2017 power of meat - meat conference · the power of meat 2017© page | 1 the power of meat an...
TRANSCRIPT
www.meatconference.com
An In-Depth Lookat Meat Throughthe Shoppers’ Eyes
POWEROF
MEAT
2017
OPERATIONALEFFICIENCY
SHELF LIFEEXTENSION
BRANDBUILDING
FOODSAFETY
OPERATIONALEFFICIENCY
SHELF LIFEEXTENSION
BRANDBUILDING
FOODSAFETY
OPERATIONALEFFICIENCY
SHELF LIFEEXTENSION
BRANDBUILDING
FOODSAFETY
OPERATIONALEFFICIENCY
SHELF LIFEEXTENSION
BRANDBUILDING
FOODSAFETY
SEE “SHELF LIFE GO FROM AN ISSUE
TO AN ASSET.
”
®Reg. U.S. Pat. & Tm. Off. © Sealed Air Corporation (US) 2016. All rights reserved.
In your business, you’re always looking to cut operating costs while continuing to meet consumer demand for fresh, functional product. Which is why you need packaging that does both. Cryovac® Darfresh® On Tray is vacuum packaging for meat, poultry, and seafood that more than doubles shelf life, reduces retail shrink by more than 50%, and comes leak-proof and consumer-ready. It’s the
best packaging to protect and grow your business.
See how extended shelf life can help your business at SealedAir.com/Darfresh-On-Tray.
The Power of Meat 2017© Page | 1
The Power of Meat An In-Depth Look at Meat and Poultry Through the Shoppers’ Eyes
2 0 1 7 Made possible by the generous support of Sealed Air’s Food Care Division
The Power of Meat
Published by: Food Marketing Institute
North American Meat Institute
Prepared for the Annual Meat Conference by: 210 Analytics, LLC

The Power of Meat 2017© Page | 2
Copyright© 2017 Food Marketing Institute The Foundation for Meat and Poultry Research and Education All rights reserved. This publication may not be reproduced, stored in any information or retrieval system or transmitted in whole or in part, in any form or by any means — electronic, mechanical, photocopying, recording or otherwise — without the express written permission of FMI or NAMI. For questions or comments, please contact: Laurie Gethin, Director of Education, FMI at [email protected] Ann Wells, Director, Education & Workforce Development, NAMI at [email protected] Anne-Marie Roerink, Principal, 210 Analytics, LLC at [email protected] The Annual Meat Conference (AMC) is designed as the yearly educational event that brings all segments of the retail meat industry together to learn how to improve marketing, operations, and profitability of meat and poultry. The conference is sponsored by the Food Marketing Institute and the North American Meat Institute in conjunction with the American Lamb Board, National Cattlemen’s Beef Association, National Chicken Council, National Pork Board, and the National Turkey Federation. Food Marketing Institute (FMI) proudly advocates on behalf of the food retail industry. FMI’s U.S. members operate nearly 40,000 retail food stores and 25,000 pharmacies, representing a combined annual sales volume of almost $770 billion. Through programs in public affairs, food safety, research, education and industry relations, FMI offers resources and provides valuable benefits to more than 1,225 food retail and wholesale member companies in the United States and around the world. FMI membership covers the spectrum of diverse venues where food is sold, including single owner grocery stores, large multi-store supermarket chains and mixed retail stores. For more information, visit fmi.org and for information regarding the FMI Foundation, visit fmifoundation.org. The Foundation for Meat and Poultry Research and Education (Foundation) is a non-profit research, education and information foundation established to study ways the meat and poultry industry can produce high-quality, safe products and operate more efficiently. The Foundation supports the educational activities of the North American Meat Institute (NAMI) by providing scientific information and research that can be used by the industry to improve products and processes. The Foundation engages leaders from industry, academia and government to advance scientific understanding related to food safety, nutrition, the environment and worker safety, among other issues. For more information, visit www.meatpoultryfoundation.org or www.meatinstitute.org for more information on NAMI.
Sealed Air Corporation — At Sealed Air, we improve access to a safer, higher quality and more sustainable food and beverage supply chain. Businesses rely on our innovative food packaging solutions and expertise to help build their brands, improve food safety, and improve shelf life and operational efficiency while reducing food waste. To learn more, visit www.sealedair.com. Published by: Food Marketing Institute The Foundation for Meat and Poultry Research and Education 2345 Crystal Drive, Suite 800 1150 Connecticut Avenue, NW, 12th floor Arlington, VA 22202 Washington, DC 20036
The Power of Meat 2017© Page | 3
Study Highlights
Meat is an enormously powerful category and a top three driver of store choice, according to shoppers. Meat delivers nearly $50 billion in sales while driving trips and basket size. As such, “getting meat right” is crucially important to the overall wellness of the store. But it was an upside down world in 2016, with dollars and trips down, and volume and margins up. To sustain growth, retailers will need to create a differentiated meat department, targeted to their shopper audience. This requires a keen understanding of the consumer and this 12th edition of the Power of Meat provides an in-depth review of shopper motivations throughout the path of purchase. Pre-Trip Preparation Fewer shoppers check meat promotions pre-trip and those who do check, do so slightly less frequently in 2017 vs. 2016. Even so, meat very much remains a planned purchase with 60 percent of shoppers checking primary store promotions and 46 percent across stores. Connecting before the visit is crucial to secure and influence the purchase. While showing year-over-year usage declines, reviewing the paper circular at home remains the most popular way to check promotions, with in-store promotional offerings, and digital, mobile and social media growing quickly. In the paper circular, meat and poultry are reclaiming their prime front and back page position, along with big picture features and hotter promotional pricing. Shoppers most prefer price-per-pound discounts, followed by BOGOs. The Meat Channel Choice Market conditions are driving changes in trip behavior. Channel switching dropped to 24 percent of shoppers, with more specialty store and club shoppers staying in-channel for their meat purchase. Alternative channels, including farmers’ markets, farm direct and butcher stores, are seeing continued growth, particularly for the occasional meat purchase. Despite these changes, supermarkets continue their dominance, with high conversion among primary shoppers and being the top destination among switchers from other
channels. Supermarket strengths in the eye of the shopper are quality and variety, whereas supercenters have a very strong everyday low price perception. Specialty/organic stores rate highly for quality and their assortment of special-attribute items, which should be a red flag to the supermarket channel. The Meat Purchasing Decision Price per pound has always had the greatest influence on the ultimate purchase decision, but the dominance of price overall is down due to higher-income households shifting their focus to quality as their top driver. Younger shoppers place greater value on preparation time and ease, and emphasize total package price over price-per-pound. But more than anything, they seek advice, tips and meal inspiration at much greater levels than their older counterparts. Millennials have the highest interest for relevant on-pack information, and overall, personal assistance is the best way to connect with shoppers. Consumers are looking for the story of meat, with high interest for on-pack information about provenance (country, region, farm or other origin information), raising practices (such as the use of antibiotics or hormones, or animal welfare) and the quality/grade certification. The latter is driven by older shoppers who rely more on their knowledge and grade information and less on brands. The opposite is true for Millennials. Altogether, improved shopper outreach can help foster high levels of trip and department satisfaction among shoppers, which is important to drive greater spending and build longer-term loyalty. Premiumization and Special Attributes Among one-third of shoppers, price relief is driving a return to larger quantities and a greater interest in more premium offerings, including brands, special attributes and value-added. Brands have emerged as one of the strongest stories in meat, with outright preference for manufacturer brands rising for both fresh and processed meat/poultry. Importantly, shoppers (particularly Millennials) have an interest for all three types of brands when

The Power of Meat 2017© Page | 4
buying fresh and processed meat: national manufacturer, small/specialty/regional manufacturer and private brands. This allows retailers to leverage a unique mix of brands tailored to their store audience. Special attributes are another very strong differentiation and sales story. Shoppers increasingly seek transparency into meat/poultry production practices and product ingredients, fueling department growth through organic, antibiotic/hormone-free, grass-fed and other transparency-focused items. Shoppers report high interest in expanded assortment of these items that focus on “free-from,” provenance, better treatment of the animal or environment, organic and natural. Price differentials, however, remain large barriers to purchase. Surveyed retailers are also reporting success in moving shoppers to these kinds of programs, particularly antibiotic-free and premium quality. Value-added meat and poultry are tagged by retailers as an area of future growth. This segment generated robust volume gains, driven by a core user group of high-income and other convenience-seeking shoppers. Price, quality and freshness perceptions stand in the way of wider adoption. Better communication about grade, handling and prices seen as equal with the level of convenience may help accelerate growth. For now, value-added still requires careful consideration at the store level. While the market shows strong long-term growth of ready-to-eat and heat-and-eat, they reached a plateau this year, while fresh saw small gains in usage and frequency of use. The trend toward transparency and premiumization provides the industry with important opportunities to test and innovate to reverse recent-year trip decline and combat the growing competition from alternative channels. Consumption and Preparation Despite economic recovery, shoppers continue to cook at home and meat/poultry is slowly returning to the dinner plate. Beef saw big volume gains and protein remains a powerful message to push with shoppers to win back meal occasions. The most
common reason to replace meat with protein alternatives is adding variety, followed by nutritional and health reasons. While the meat case offers an abundance of variety and lean/nutritious options across proteins and cuts, buying unfamiliar meat/poultry items has a much higher trial barrier than other new food experiences. Overcoming habitual purchases through education, customer service, sampling, recipes and more can drive incremental sales among existing and new customers. This is leading 76 percent of retailers surveyed to make a push to reallocate labor hours from back room processing to sales floor selling. However, 89 percent of these retailers say finding good people looking to make a career in meat is a major or somewhat of an issue. Meal kits and meal solutions surrounding meat/poultry, and featured in the meat department, may also be a good way for retailers to win back or create new meal occasions. Offering grab-and-go, ready-to-prepare dinner solutions featuring fresh meat/poultry draws interest among 53 percent of shoppers. More aggressively marketing for secondary holidays or creating meat-inspired events may be another way to drive incremental dollars and volume, with 27 percent of shoppers interested in quality, total meal solutions for holidays, such as Valentine’s Day, Mother’s Day or Father’s Day. Improving the Meat Department Meat departments average a 7.4 on a 10-point scale for their overall performance in meeting shoppers’ needs. Cleanliness, quality and freshness are high-scoring attributes, but customer service and information continues to drag down the average. Ways to make shopping for meat better and easier include many areas. Those accounting for at least one in 10 suggestions include better prices, improved customer service, better variety of meat and package sizes, and better information. Surveyed retailers recognize the importance of fixing out-of-stocks as well, with 70 percent of supermarket respondents willing to run an increased risk of department shrink (averaging 4.6 percent) to improve their in-stock position.
The Power of Meat 2017© Page | 5
Table of Contents
Introduction ............................................................................................................................................. 7 Category Overview ................................................................................................................................... 8
Meat Matters .................................................................................................................................................... 8 Meat Purchasing Preparation ................................................................................................................. 10
Slight Drop in Planned Nature of Meat Purchase ........................................................................................... 10 Engaging with Shoppers Pre-Trip Remains Important .................................................................................... 11 In-Store and Digital Coming on Strong in Promotional Research ................................................................... 12 Meat and Poultry Claim Back Their Turf in Grocery Circular .......................................................................... 13
The Meat Channel Choice ....................................................................................................................... 16
Supermarket Top Outlet for Meat, but Alternative Channels Rise ................................................................ 16 Channel Switching Drops; More Specialty/Club Shoppers Stay In-Channel ................................................... 17 Reasons for Switching Highlight Perceived Strengths and Weaknesses ........................................................ 18 Where Do Supermarket Shoppers Buy Meat/Poultry? .................................................................................. 19 Where Do Supercenter Shoppers Buy Meat/Poultry? ................................................................................... 19 Shoppers Frequent Fewer “Occasional” Outlets for Meat Purchase ............................................................. 20
The Meat Purchasing Decision ................................................................................................................ 22
An Upside-Down Market Place: Dollars Down, Volume Up ........................................................................... 22 Shoppers Agree: Lower Prices Way to Save or Trade Up .............................................................................. 22 Meat Case Accounts for Greater Share of Purchases ..................................................................................... 23 Subtle Declines in In-Store Price Comparison Behavior ................................................................................. 23 Price Per Pound Leads, But High Millennial Interest for Fixed Weight .......................................................... 25 Price Rules but Greater Focus on Preparation Time and Ease ....................................................................... 25
Information and Customer Service .......................................................................................................... 27
Satisfied Shoppers Spend More and Are More Loyal ..................................................................................... 27 In-Person Best Way to Connect with Shoppers .............................................................................................. 28 Info on Origin and Raising Practices Score Big With Shoppers ....................................................................... 29 Packaging Innovation Closely Ties to Customer Satisfaction ......................................................................... 30
Meat and Poultry Attributes ................................................................................................................... 31
Brands Make for a Strong Story in the Meat Department ............................................................................. 31 Special Attributes Are Another Strong Story .................................................................................................. 33 Special Attributes Look to Drive Continued Growth ...................................................................................... 34 Value-Added Meat and Poultry Poised for Growth ........................................................................................ 35 Price and Perception Stand in the Way of Wider Adoption ........................................................................... 36 Price Differential Substantial but Declining for Most Proteins ....................................................................... 37 Retailers are Rapidly Moving to Special Attributes ........................................................................................ 37 Slight Shift With Greater Focus on Fresh ........................................................................................................ 38
The Power of Meat 2017© Page | 6
Natural and Organic Meat/Poultry .......................................................................................................... 40 Continued Household Gains for Natural and Organic Meat/Poultry ............................................................. 40 Anticipated Basket Expansion Continues but Slows ....................................................................................... 41 Sales Reality Shows Strength for Organic/Natural ......................................................................................... 41 Price Continues to Be a Significant Barrier to Entry ....................................................................................... 42 Channel Shifting Demonstrates the Differentiation Potential ....................................................................... 43 "Free From" Solidifies Top Spot as Purchase Driver ....................................................................................... 45
Meat Consumption and Preparation ....................................................................................................... 46
Shoppers Stick with Home-Cooked Meals ...................................................................................................... 46 Meat/Poultry Make a Bit of a Comeback in Meal Lineup ............................................................................... 47 Adding Variety Greatest Reason to Occasionally Replace Meat/Poultry ....................................................... 48 Much Higher Trial Barriers to Overcome In Meat/Poultry ............................................................................. 49 Growing Meal Occasions through Meal Solutions Garners Interest .............................................................. 51 Growing Meal Occasions Through Secondary Holidays ................................................................................. 52 Consumers Focus on Lean; Meatless Meals Even Less of a Strategy ............................................................. 53
Improving the Meat Department ............................................................................................................ 54
Cleanliness and Quality Top-Rated Attributes for Meat Department ............................................................ 54 Making Shopping Better and Easier ............................................................................................................... 55 Customer Suggestions Closely Meet Retailer Strategies for Trips/Sales ........................................................ 58
Methodology ......................................................................................................................................... 59
Segment Market and Trend Reviews ....................................................................................................... 60
The Power of Meat 2017© Page | 7
Introduction
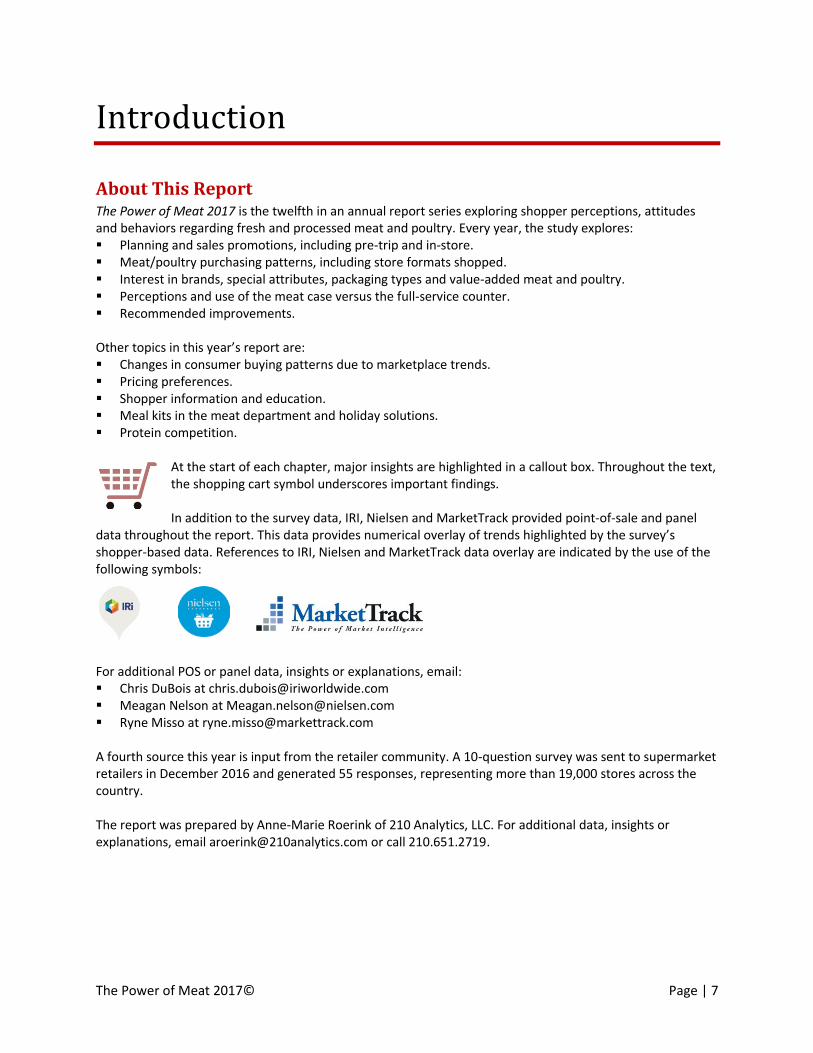
About This Report The Power of Meat 2017 is the twelfth in an annual report series exploring shopper perceptions, attitudes and behaviors regarding fresh and processed meat and poultry. Every year, the study explores: Planning and sales promotions, including pre-trip and in-store. Meat/poultry purchasing patterns, including store formats shopped. Interest in brands, special attributes, packaging types and value-added meat and poultry. Perceptions and use of the meat case versus the full-service counter. Recommended improvements. Other topics in this year’s report are: Changes in consumer buying patterns due to marketplace trends. Pricing preferences. Shopper information and education. Meal kits in the meat department and holiday solutions. Protein competition.
At the start of each chapter, major insights are highlighted in a callout box. Throughout the text, the shopping cart symbol underscores important findings. In addition to the survey data, IRI, Nielsen and MarketTrack provided point-of-sale and panel
data throughout the report. This data provides numerical overlay of trends highlighted by the survey’s shopper-based data. References to IRI, Nielsen and MarketTrack data overlay are indicated by the use of the following symbols:
For additional POS or panel data, insights or explanations, email: Chris DuBois at [email protected] Meagan Nelson at [email protected] Ryne Misso at [email protected] A fourth source this year is input from the retailer community. A 10-question survey was sent to supermarket retailers in December 2016 and generated 55 responses, representing more than 19,000 stores across the country. The report was prepared by Anne-Marie Roerink of 210 Analytics, LLC. For additional data, insights or explanations, email [email protected] or call 210.651.2719.
The Power of Meat 2017© Page | 8
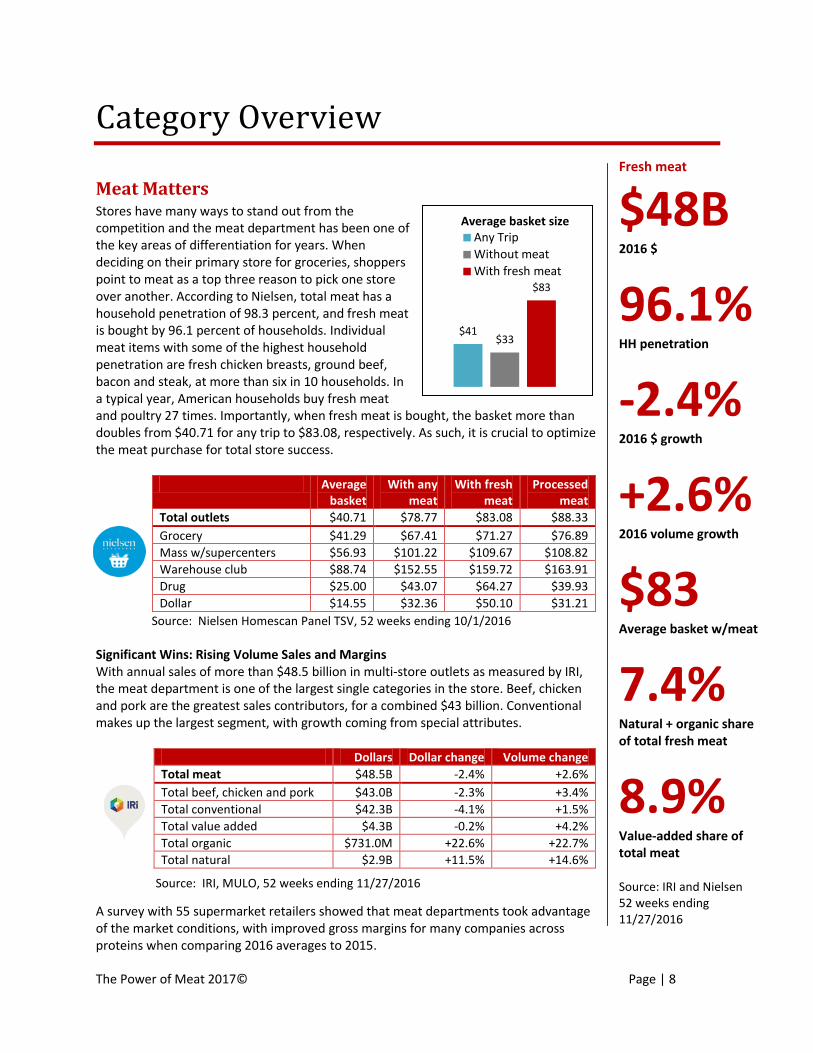
Fresh meat
$48B 2016 $
96.1% HH penetration
-2.4% 2016 $ growth
+2.6% 2016 volume growth
$83 Average basket w/meat
7.4% Natural + organic share of total fresh meat
8.9% Value-added share of total meat Source: IRI and Nielsen 52 weeks ending 11/27/2016
$41 $33
$83
Average basket size Any Trip
Without meat
With fresh meat
Category Overview
Meat Matters Stores have many ways to stand out from the competition and the meat department has been one of the key areas of differentiation for years. When deciding on their primary store for groceries, shoppers point to meat as a top three reason to pick one store over another. According to Nielsen, total meat has a household penetration of 98.3 percent, and fresh meat is bought by 96.1 percent of households. Individual meat items with some of the highest household penetration are fresh chicken breasts, ground beef, bacon and steak, at more than six in 10 households. In a typical year, American households buy fresh meat and poultry 27 times. Importantly, when fresh meat is bought, the basket more than doubles from $40.71 for any trip to $83.08, respectively. As such, it is crucial to optimize the meat purchase for total store success.
Average basket
With any meat
With fresh meat
Processed meat
Total outlets $40.71 $78.77 $83.08 $88.33
Grocery $41.29 $67.41 $71.27 $76.89
Mass w/supercenters $56.93 $101.22 $109.67 $108.82
Warehouse club $88.74 $152.55 $159.72 $163.91
Drug $25.00 $43.07 $64.27 $39.93
Dollar $14.55 $32.36 $50.10 $31.21
Significant Wins: Rising Volume Sales and Margins With annual sales of more than $48.5 billion in multi-store outlets as measured by IRI, the meat department is one of the largest single categories in the store. Beef, chicken and pork are the greatest sales contributors, for a combined $43 billion. Conventional makes up the largest segment, with growth coming from special attributes.
Dollars Dollar change Volume change
Total meat $48.5B -2.4% +2.6%
Total beef, chicken and pork $43.0B -2.3% +3.4%
Total conventional $42.3B -4.1% +1.5%
Total value added $4.3B -0.2% +4.2%
Total organic $731.0M +22.6% +22.7%
Total natural $2.9B +11.5% +14.6%
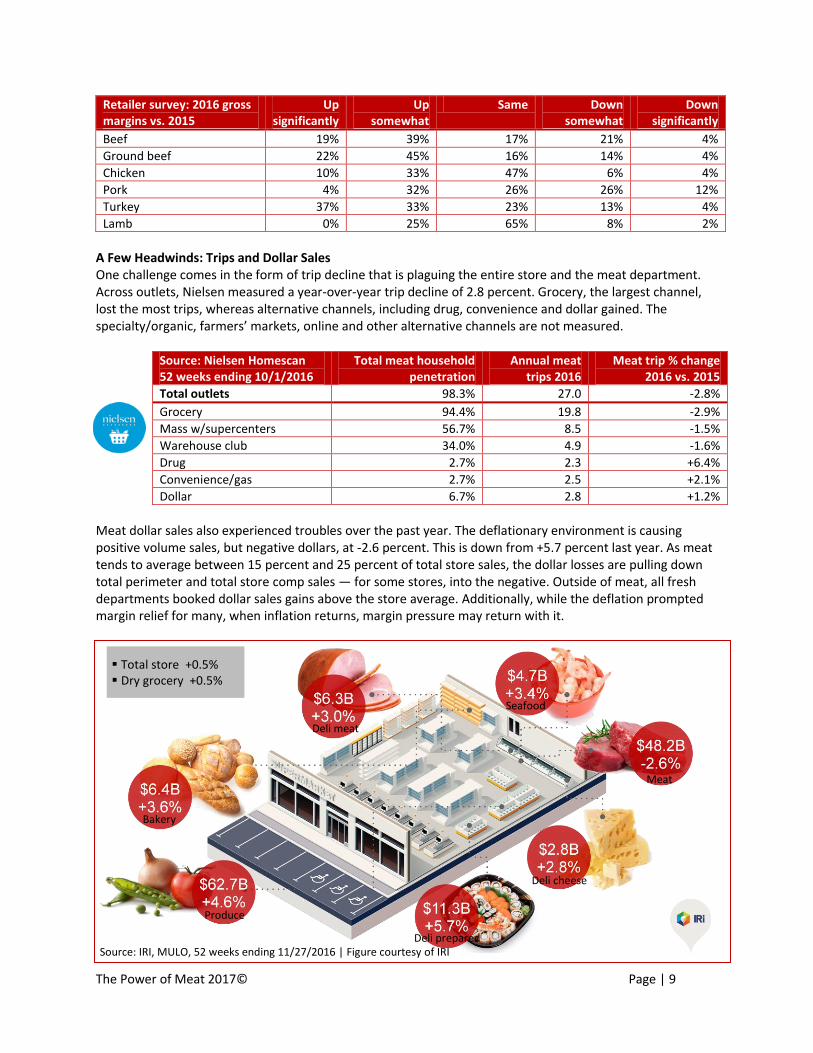
A survey with 55 supermarket retailers showed that meat departments took advantage of the market conditions, with improved gross margins for many companies across proteins when comparing 2016 averages to 2015.
Source: Nielsen Homescan Panel TSV, 52 weeks ending 10/1/2016
Source: IRI, MULO, 52 weeks ending 11/27/2016
The Power of Meat 2017© Page | 9
Retailer survey: 2016 gross margins vs. 2015
Up significantly
Up somewhat
Same Down somewhat
Down significantly
Beef 19% 39% 17% 21% 4%
Ground beef 22% 45% 16% 14% 4%
Chicken 10% 33% 47% 6% 4%
Pork 4% 32% 26% 26% 12%
Turkey 37% 33% 23% 13% 4%
Lamb 0% 25% 65% 8% 2%
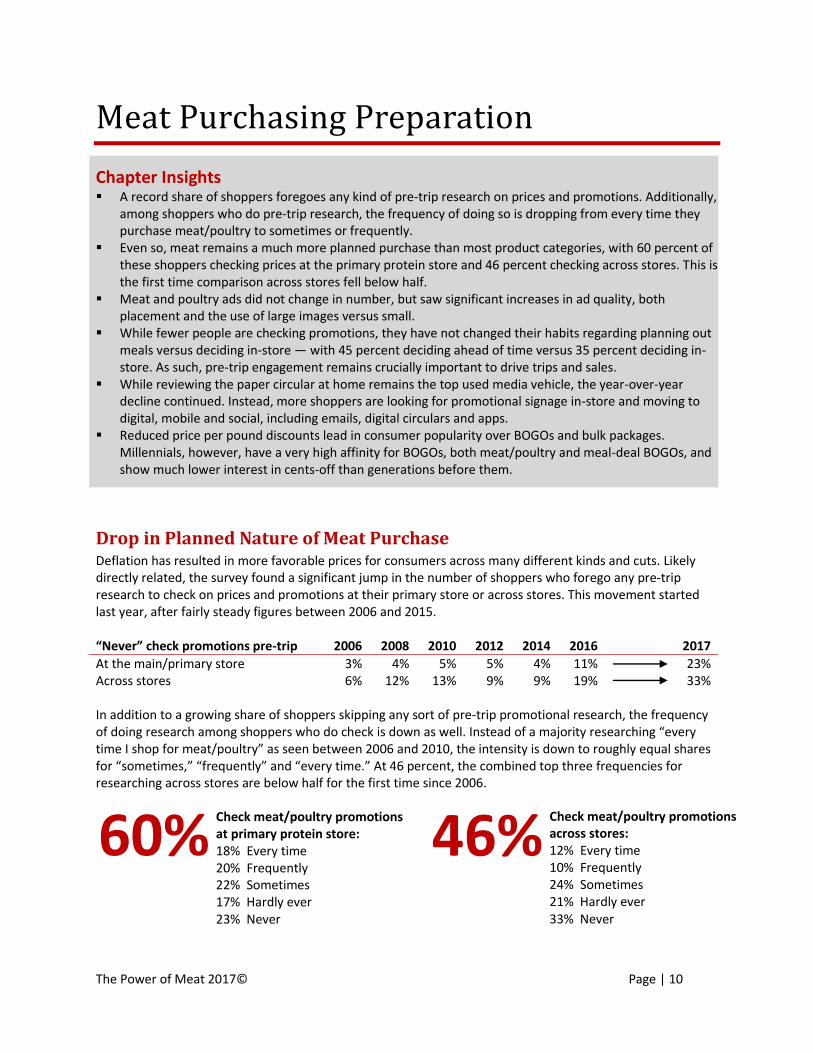
A Few Headwinds: Trips and Dollar Sales One challenge comes in the form of trip decline that is plaguing the entire store and the meat department. Across outlets, Nielsen measured a year-over-year trip decline of 2.8 percent. Grocery, the largest channel, lost the most trips, whereas alternative channels, including drug, convenience and dollar gained. The specialty/organic, farmers’ markets, online and other alternative channels are not measured.
Source: Nielsen Homescan 52 weeks ending 10/1/2016
Total meat household penetration
Annual meat trips 2016
Meat trip % change 2016 vs. 2015
Total outlets 98.3% 27.0 -2.8%
Grocery 94.4% 19.8 -2.9%
Mass w/supercenters 56.7% 8.5 -1.5%
Warehouse club 34.0% 4.9 -1.6%
Drug 2.7% 2.3 +6.4%
Convenience/gas 2.7% 2.5 +2.1%
Dollar 6.7% 2.8 +1.2%
Meat dollar sales also experienced troubles over the past year. The deflationary environment is causing positive volume sales, but negative dollars, at -2.6 percent. This is down from +5.7 percent last year. As meat tends to average between 15 percent and 25 percent of total store sales, the dollar losses are pulling down total perimeter and total store comp sales — for some stores, into the negative. Outside of meat, all fresh departments booked dollar sales gains above the store average. Additionally, while the deflation prompted margin relief for many, when inflation returns, margin pressure may return with it.
Source: IRI, MULO, 52 weeks ending 11/27/2016 | Figure courtesy of IRI
Deli meat
Seafood
Meat
Deli cheese
Bakery
Produce
Deli prepared
Total store +0.5% Dry grocery +0.5%
The Power of Meat 2017© Page | 10
Meat Purchasing Preparation
Chapter Insights A record share of shoppers foregoes any kind of pre-trip research on prices and promotions. Additionally,
among shoppers who do pre-trip research, the frequency of doing so is dropping from every time they purchase meat/poultry to sometimes or frequently.
Even so, meat remains a much more planned purchase than most product categories, with 60 percent of these shoppers checking prices at the primary protein store and 46 percent checking across stores. This is the first time comparison across stores fell below half.
Meat and poultry ads did not change in number, but saw significant increases in ad quality, both placement and the use of large images versus small.
While fewer people are checking promotions, they have not changed their habits regarding planning out meals versus deciding in-store — with 45 percent deciding ahead of time versus 35 percent deciding in-store. As such, pre-trip engagement remains crucially important to drive trips and sales.
While reviewing the paper circular at home remains the top used media vehicle, the year-over-year decline continued. Instead, more shoppers are looking for promotional signage in-store and moving to digital, mobile and social, including emails, digital circulars and apps.
Reduced price per pound discounts lead in consumer popularity over BOGOs and bulk packages. Millennials, however, have a very high affinity for BOGOs, both meat/poultry and meal-deal BOGOs, and show much lower interest in cents-off than generations before them.
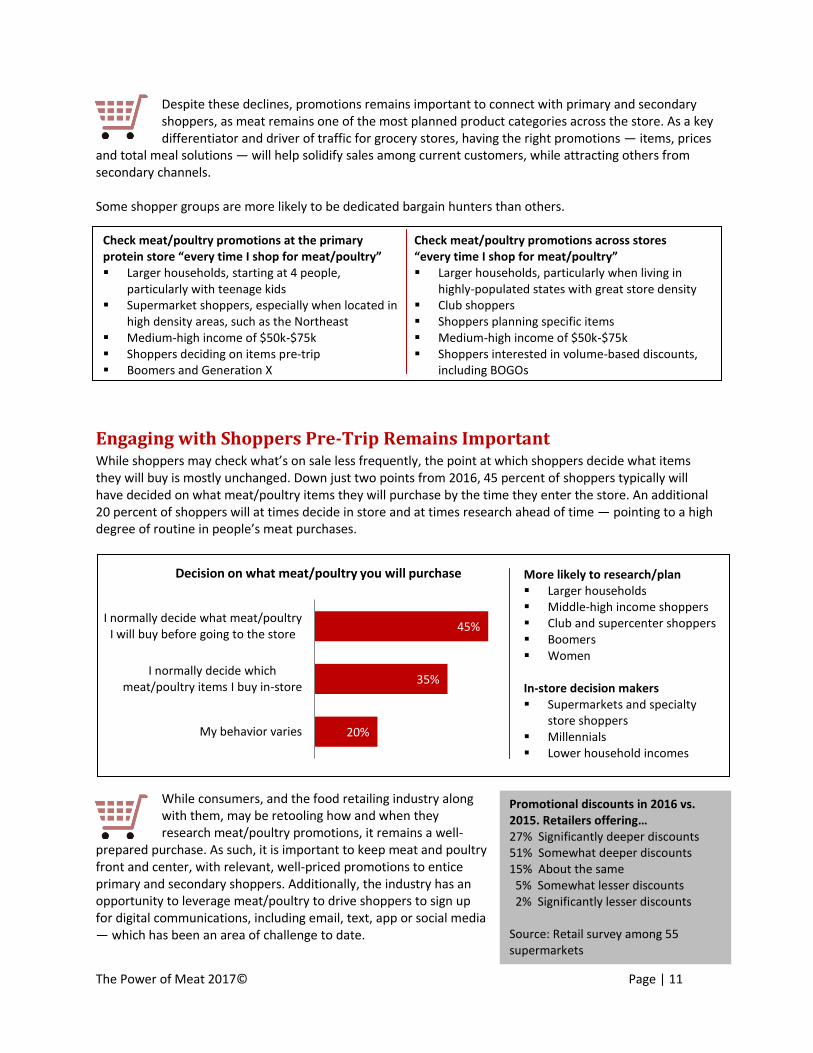
Drop in Planned Nature of Meat Purchase Deflation has resulted in more favorable prices for consumers across many different kinds and cuts. Likely directly related, the survey found a significant jump in the number of shoppers who forego any pre-trip research to check on prices and promotions at their primary store or across stores. This movement started last year, after fairly steady figures between 2006 and 2015. “Never” check promotions pre-trip 2006 2008 2010 2012 2014 2016 2017
At the main/primary store 3% 4% 5% 5% 4% 11% 23% Across stores 6% 12% 13% 9% 9% 19% 33% In addition to a growing share of shoppers skipping any sort of pre-trip promotional research, the frequency of doing research among shoppers who do check is down as well. Instead of a majority researching “every time I shop for meat/poultry” as seen between 2006 and 2010, the intensity is down to roughly equal shares for “sometimes,” “frequently” and “every time.” At 46 percent, the combined top three frequencies for researching across stores are below half for the first time since 2006.
60% Check meat/poultry promotions at primary protein store: 18% Every time 20% Frequently 22% Sometimes 17% Hardly ever 23% Never
46% Check meat/poultry promotions across stores: 12% Every time 10% Frequently 24% Sometimes 21% Hardly ever 33% Never
The Power of Meat 2017© Page | 11
Promotional discounts in 2016 vs. 2015. Retailers offering… 27% Significantly deeper discounts 51% Somewhat deeper discounts 15% About the same 5% Somewhat lesser discounts 2% Significantly lesser discounts Source: Retail survey among 55 supermarkets
Despite these declines, promotions remains important to connect with primary and secondary shoppers, as meat remains one of the most planned product categories across the store. As a key differentiator and driver of traffic for grocery stores, having the right promotions — items, prices
and total meal solutions — will help solidify sales among current customers, while attracting others from secondary channels. Some shopper groups are more likely to be dedicated bargain hunters than others.
Check meat/poultry promotions at the primary protein store “every time I shop for meat/poultry”
Check meat/poultry promotions across stores “every time I shop for meat/poultry”
Larger households, starting at 4 people, particularly with teenage kids
Supermarket shoppers, especially when located in high density areas, such as the Northeast
Medium-high income of $50k-$75k Shoppers deciding on items pre-trip Boomers and Generation X
Larger households, particularly when living in highly-populated states with great store density
Club shoppers Shoppers planning specific items Medium-high income of $50k-$75k Shoppers interested in volume-based discounts,
including BOGOs
Engaging with Shoppers Pre-Trip Remains Important While shoppers may check what’s on sale less frequently, the point at which shoppers decide what items they will buy is mostly unchanged. Down just two points from 2016, 45 percent of shoppers typically will have decided on what meat/poultry items they will purchase by the time they enter the store. An additional 20 percent of shoppers will at times decide in store and at times research ahead of time — pointing to a high degree of routine in people’s meat purchases.
While consumers, and the food retailing industry along with them, may be retooling how and when they research meat/poultry promotions, it remains a well-
prepared purchase. As such, it is important to keep meat and poultry front and center, with relevant, well-priced promotions to entice primary and secondary shoppers. Additionally, the industry has an opportunity to leverage meat/poultry to drive shoppers to sign up for digital communications, including email, text, app or social media — which has been an area of challenge to date.
20%
35%
45%
My behavior varies
I normally decide which meat/poultry items I buy in-store
I normally decide what meat/poultry I will buy before going to the store
Decision on what meat/poultry you will purchase More likely to research/plan Larger households Middle-high income shoppers Club and supercenter shoppers Boomers Women In-store decision makers Supermarkets and specialty
store shoppers Millennials Lower household incomes

The Power of Meat 2017© Page | 12
In-Store and Digital Coming on Strong in Promotional Research The paper circular continues to be the lead platform to research meat and poultry promotions. But with five to seven percentage point usage declines for four years running, the question is, for how much longer? Looking back at prior year reports, declines in the use of the paper ad have been happening for several years: 2013-2014: -5 percentage points 2014-2015: -5 percentage points 2015-2016: -7 percentage points 2016-2017: -5 percentage points, to 58 percent of shoppers who look at one or more platforms. The high usage numbers are driven by older shoppers, with a mere one-third of Millennials reviewing the print version at home compared with seven in 10 Boomers and eight in 10 seniors.
These trends suggest that paper circular usage will likely continue to drop, if not at an accelerated rate. In addition to Millennials’ and Gen Z’s tendencies to use technology for their grocery shopping trips already, older shoppers are expected to increasingly integrate technology
in their routines as well. Furthermore, retailers are shifting more dollars to digital platforms to make them more user-friendly, which will likely accelerate the shifts measured these past few years. Based on historical gains and demographic patterns, the market is increasingly moving toward: 1. Digital/mobile and social, including apps, the electronic circular and email or social media promotions.
Usage among Millennials often more than doubles that of the population as a whole, pointing to a likely acceleration in shopper usage of digital, mobile and social. Only text message promotions remain in the single digits, which is constant across product categories.
2. In-store signage. This is the second area that is seeing rapid year-over-year growth, once more driven by the Millennials who are both less likely to research promotions altogether (33 percent versus 24 percent overall) and more likely to check in-store versus pre-trip. Millennials are also more likely to check the circular in-store versus at home.
Promotional vehicles for checking meat/poultry promos
'17 Younger Millennials
Older Millennials
Gen X Younger Boomers
Older Boomers
Seniors
None 24% 33% 33% 23% 21% 20% 34%
Paper circular pre-trip 58% 35% 40% 59% 68% 69% 83%
In-store promotional signage 50% 57% 55% 50% 47% 47% 51%
Paper circular in the store 37% 40% 37% 38% 38% 33% 34%
Electronic circular 29% 25% 29% 33% 30% 25% 19%
Store app 17% 20% 19% 23% 15% 11% 9%
Special meat promotions on email/web
15% 17% 15% 17% 13% 12% 11%
Smartphone to check prices/ promos
7% 16% 14% 8% 3% 2% 1%
Social media deals 5% 12% 7% 4% 2% 3% 2%
Text specials 3% 6% 3% 3% 2% 0% 2%
Consumers increasingly determine when, where and how they want to learn about meat and poultry promotions. This leaves retailers straddling traditional and digital/social/mobile platforms for the time being. While Millennials make up one-third of shoppers, their spending lags. This
means retailers cannot yet abandon traditional marketing, the route of choice for Boomers, but have to start building wider engagement in digital, mobile and social. At the same time, the market presents opportunities for more targeted content based on demographics or past purchase history.
The Power of Meat 2017© Page | 13
Higher home usage of paper circular
Higher in-store vehicles usage (paper circular and signage)
Higher digital/mobile/social and app usage
Seniors and Boomers Frequent shoppers Larger households (4+) Shoppers who place price and
money savings front and center, frequently seeking deals at their primary store
Medium-low income
Millennials Shoppers who value low prices
and research heavily across stores and their own store
Shoppers favoring volume-based discounts, including BOGOs
Younger and older Millennials Medium-high income
Millennials Higher income Specialty store shoppers, as
well as shoppers who occasionally buy online or at farmers’ markets
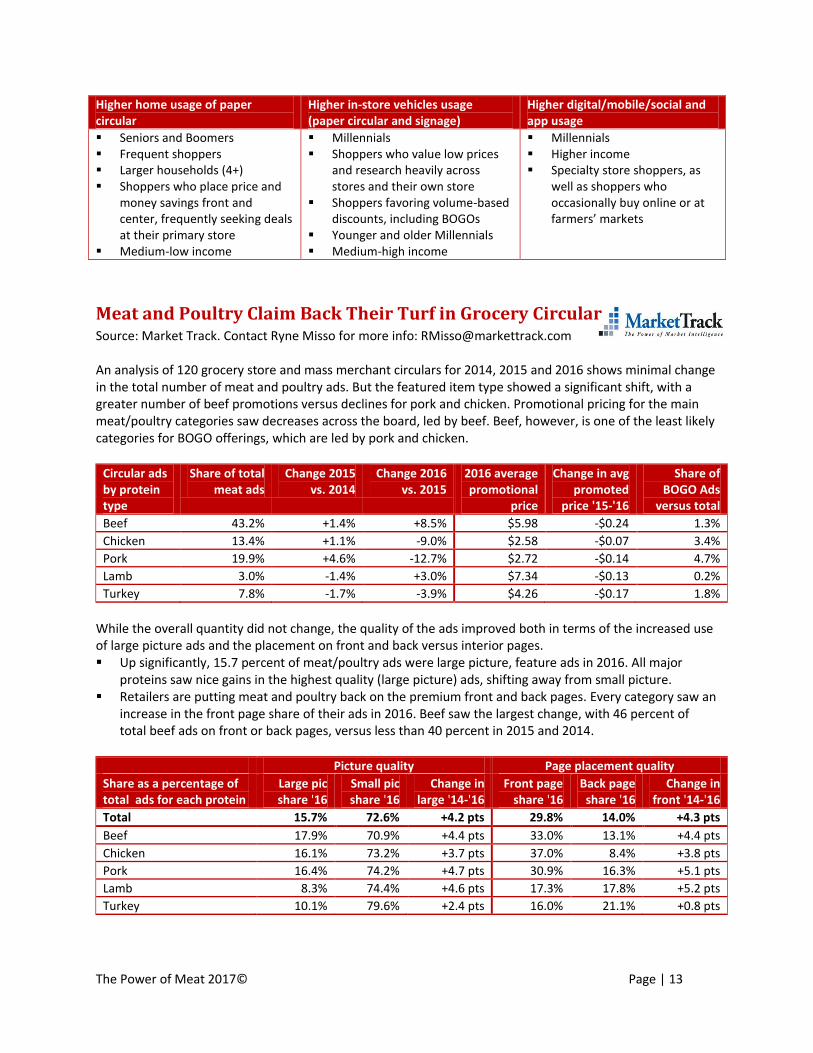
Meat and Poultry Claim Back Their Turf in Grocery Circular Source: Market Track. Contact Ryne Misso for more info: [email protected] An analysis of 120 grocery store and mass merchant circulars for 2014, 2015 and 2016 shows minimal change in the total number of meat and poultry ads. But the featured item type showed a significant shift, with a greater number of beef promotions versus declines for pork and chicken. Promotional pricing for the main meat/poultry categories saw decreases across the board, led by beef. Beef, however, is one of the least likely categories for BOGO offerings, which are led by pork and chicken.
Circular ads by protein type
Share of total meat ads
Change 2015 vs. 2014
Change 2016 vs. 2015
2016 average promotional
price
Change in avg promoted
price '15-'16
Share of BOGO Ads
versus total
Beef 43.2% +1.4% +8.5% $5.98 -$0.24 1.3%
Chicken 13.4% +1.1% -9.0% $2.58 -$0.07 3.4%
Pork 19.9% +4.6% -12.7% $2.72 -$0.14 4.7%
Lamb 3.0% -1.4% +3.0% $7.34 -$0.13 0.2%
Turkey 7.8% -1.7% -3.9% $4.26 -$0.17 1.8%
While the overall quantity did not change, the quality of the ads improved both in terms of the increased use of large picture ads and the placement on front and back versus interior pages. Up significantly, 15.7 percent of meat/poultry ads were large picture, feature ads in 2016. All major
proteins saw nice gains in the highest quality (large picture) ads, shifting away from small picture. Retailers are putting meat and poultry back on the premium front and back pages. Every category saw an
increase in the front page share of their ads in 2016. Beef saw the largest change, with 46 percent of total beef ads on front or back pages, versus less than 40 percent in 2015 and 2014.
Picture quality Page placement quality
Share as a percentage of total ads for each protein
Large pic share '16
Small pic share '16
Change in large '14-'16
Front page share '16
Back page share '16
Change in front '14-'16
Total 15.7% 72.6% +4.2 pts 29.8% 14.0% +4.3 pts
Beef 17.9% 70.9% +4.4 pts 33.0% 13.1% +4.4 pts
Chicken 16.1% 73.2% +3.7 pts 37.0% 8.4% +3.8 pts
Pork 16.4% 74.2% +4.7 pts 30.9% 16.3% +5.1 pts
Lamb 8.3% 74.4% +4.6 pts 17.3% 17.8% +5.2 pts
Turkey 10.1% 79.6% +2.4 pts 16.0% 21.1% +0.8 pts
The Power of Meat 2017© Page | 14
Other findings include: Retailer promotion of organic and other specialty attributes remains limited, led by turkey, at 2.3 percent
of total ads. While an important point of differentiation, many special-attribute buyers are less price sensitive, with the exception of natural.
Less than 2 percent of ads were tagged as “healthy eating” between 2014 and 2016. With health and nutrition being a growing factor in the purchasing decision tree and a driver for meat alternatives, this may be an area for improvement.
Meal solution promotions, where the meat and poultry is positioned as part of a larger meal, surprisingly, have declined over the past three years — making up less than 0.1 percent of meat/poultry ads.
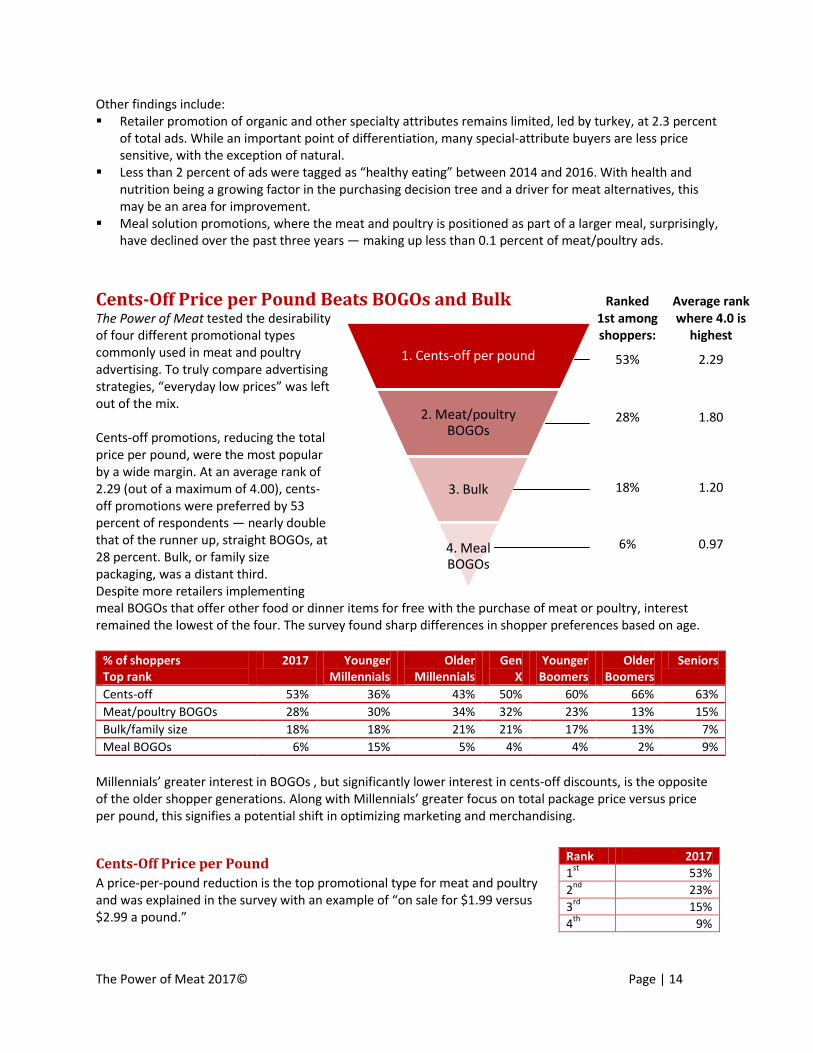
Cents-Off Price per Pound Beats BOGOs and Bulk The Power of Meat tested the desirability of four different promotional types commonly used in meat and poultry advertising. To truly compare advertising strategies, “everyday low prices” was left out of the mix. Cents-off promotions, reducing the total price per pound, were the most popular by a wide margin. At an average rank of 2.29 (out of a maximum of 4.00), cents-off promotions were preferred by 53 percent of respondents — nearly double that of the runner up, straight BOGOs, at 28 percent. Bulk, or family size packaging, was a distant third. Despite more retailers implementing meal BOGOs that offer other food or dinner items for free with the purchase of meat or poultry, interest remained the lowest of the four. The survey found sharp differences in shopper preferences based on age.
% of shoppers Top rank
2017 Younger Millennials
Older Millennials
Gen X
Younger Boomers
Older Boomers
Seniors
Cents-off 53% 36% 43% 50% 60% 66% 63%
Meat/poultry BOGOs 28% 30% 34% 32% 23% 13% 15%
Bulk/family size 18% 18% 21% 21% 17% 13% 7%
Meal BOGOs 6% 15% 5% 4% 4% 2% 9%
Millennials’ greater interest in BOGOs , but significantly lower interest in cents-off discounts, is the opposite of the older shopper generations. Along with Millennials’ greater focus on total package price versus price per pound, this signifies a potential shift in optimizing marketing and merchandising.
Cents-Off Price per Pound
A price-per-pound reduction is the top promotional type for meat and poultry and was explained in the survey with an example of “on sale for $1.99 versus $2.99 a pound.”
1. Cents-off per pound
2. Meat/poultry BOGOs
3. Bulk
4. Meal BOGOs
Ranked 1st among shoppers:
Average rank where 4.0 is
highest
53% 2.29
28% 1.80
18% 1.20
6% 0.97
Rank 2017
1st
53%
2nd
23%
3rd
15%
4th
9%

The Power of Meat 2017© Page | 15
A few findings of note: More than six in 10 Boomers prefer cents-off versus fewer than four in 10 Millennials. 62 percent of singles ranked cents-off first. Shoppers with a greater purchase interest in specialty attributes, such as organic, natural, grass-fed and
other, also overindex for this promotional type.
Buy-One, Get-One Meat and Poultry Item (BOGO)
A straight meat/poultry BOGO is the second most popular promotion across the entire population, but receives higher preference among those shoppers who are in the habit of buying in larger quantities, either based on channel shopped, household size, or habits to buy/freeze/use over time. Age wise, interest in meat BOGOs (and bulk discounts) peaks among older
Millennials and Generation X. Income wise, the highest interest for meat BOGOs is in the low-mid to middle income category of
$35,000 -$55,000 annual household income. Singles have lower-than-average interest, at 23 percent versus 35 percent for households of four. Channel shopped does not have a big influence, with only supercenter shoppers showing slightly higher
interest in this promotional type. Lastly, shoppers who purchase in larger quantities, overindex here as well.
Bulk/Family Packages
Ranked first by about one-sixth of the population, bulk/family packages are loved by some and dismissed by others. The recession drove a renewed interest in bulk for a few years, but was quickly replaced by quite the opposite attitude of “saving by buying no more than needed.” Population groups with higher interest levels for bulk/family packages are: Age wise, interest peaks among 25 to 53 year olds (older Millennials
and Generation X) — representing the most 3+ person households with children. Only 11 percent of singles have a high interest in bulk, versus 31 percent of 5+ person households. In a change from the recessionary years when bulk was popular among high-income shoppers, interest
has shifted to low and low-mid income of less than $35,000 and $35,000-$50,000 annually — perhaps directly related to lower meat prices, making bulk purchases possible for lower-income households.
Club shoppers (ranked first among 32 percent; versus just 8 percent of specialty store shoppers).
These findings are very important given the demographic shifts happening in the United States that have resulted in a record number of single- and two-person households. At the same time, the impact of the Millennials on the meat department is growing, as is the need for a different
kind of marketing/merchandising for special-attribute meat and poultry.
Buy One, Get Other Meal Items for Free (Meal Deal BOGO)
Ranked first or second by about one-quarter of the population, meal deal BOGOs are ranked lowest among the four categories and the ranking is virtually unchanged from prior years. Given the growing popularity of similar dinner meal kits, this is somewhat surprising, though their availability remains relatively low. Often, familiarity nurtures usage among shoppers. Meal BOGOs can be a very effective way to provide a quick dinner solution and to introduce shoppers to new items, both branded and private label. In terms of demographics, younger Millennials — the driving force behind fresh prepared, meal solutions and also delivery meal kits — have a much higher interest in this promotional type, at 15 percent.
Rank 2017
1st
28%
2nd
33%
3rd
30%
4th
9%
Rank 2017
1st
18%
2nd
24%
3rd
19%
4th
39%
Rank 2017
1st
6%
2nd
21%
3rd
33%
4th
40%

The Power of Meat 2017© Page | 16
The Meat Channel Choice
Chapter Insights Market conditions are driving changes in trip behavior, but supermarkets remain the top destination for
grocery-type items in general and meat/poultry specifically for about six in 10 shoppers. Across all formats, 24 percent of shoppers switch outlets when purchasing fresh meat and poultry
compared with their primary store for grocery-type items. This is down from 27 percent last year. Supermarkets continue to boast high primary shopper conversion and pick up quite a few shoppers from
other channels, particularly supercenters. The specialty/organic and club stores retain a greater share of shoppers compared with prior years. Reasons for having a dual store strategy point to seeking high-quality meat/poultry offerings, but differ
widely by channel. Supermarket strengths in the eye of the shopper are quality and variety, whereas supercenters have a very strong everyday low price perception. Specialty/organic stores score the highest in quality and providing a wide variety of special-attribute items.
Farmers’ markets and stand-alone butcher stores remain the top outlets for an occasional meat purchase, with low usage for online meat purchases. While shopped infrequently, they have the ability to impact to pull trips and dollars away from traditional channels.
Supermarket Top Outlet for Meat, but Alternative Channels Rise Traditional supermarkets maintain their lead over all the other outlets. About six in 10 shoppers name a supermarket as their primary outlet for groceries and meat/poultry. However, club and alternative channels are outlets with a greater penetration in meat and poultry than for groceries in general. Included under “alternative” are butcher shops (4 percent), farmers’ markets and farm direct (2 percent), online purchases (0.5 percent) and other channels, such as dollar, convenience stores and meal kit delivery services, at 1 percent. Alternative channels are up compared with prior years, driven by Millennial shoppers who show a higher likelihood of shopping these outlets.
Supermarkets Supercenters Club stores Organic stores Alternative
Primary store for
groceries
62% 23% 7% 6% 2%
Primary store for meat
and poultry
62% 14% 10% 7% 7.5%
↑ ↔ ↓
Gain/loss for meat share ↔ ↓ ↑ ↔ ↑

The Power of Meat 2017© Page | 17
Channel switching 2016 2017
Across all channels 27% 24%
Supermarkets 12% 14%
Supercenters 47% 45%
Club stores 42% 35%
Specialty/organic stores
50% 41%
Shopper demographics for each of these channels tend to differ widely based on income, age, gender, preferences for special attributes, freshness, etc.
More likely to shop for meat and poultry at:
Supermarkets Supercenters Club stores Northeast Boomers and seniors Smaller households of 1-2 people Higher trip frequency Organic buyers Middle and mid-high incomes
The Midwest and South Larger households, starting at
four and more people Millennials and Generation X,
particularly with young kids Lower-income households Men more so than women
Higher-income households, particularly >$100,000/year
Larger households of 3-4 people
Boomers and Generation X Organic buyers
Channel Switching Drops; More Specialty/Club Shoppers Stay In-Channel Down from 27 percent last year, 24 percent of shoppers leave their primary channel to buy fresh meat and poultry elsewhere. Channel shifting remains more prevalent among supercenter shoppers, though channel leakage declined slightly compared with previous years. The year-over-year drop in channel switching is driven by specialty/organic and club store shoppers. In prior years, they were among the most likely to switch stores for meat/poultry (often to supermarkets) and showed significantly greater likelihood to remain in their primary grocery channel this year. As they were the most likely to cite cost as the reason to switch, the lower protein prices could be a driver for greater channel loyalty. Channel switching among supermarkets increased slightly, with greater leakage to the specialty/organic channel, in particular. Reasons cited for changing channels among these supermarket switchers show a higher emphasis on assortment of special attributes, quality and customer service.
Supermarkets pick up many supercenter shoppers for meat/poultry, but lose to
clubs, butcher shops and specialty/organic stores
Supermarkets lose much fewer shoppers than supercenters and pick
up many shoppers from other channels
One-quarter of shoppers have a dual store strategy when it comes to center store and fresh protein
purchases
24% Primary channel for groceries is different than primary channel
for meat/poultry
14%
Supermarket patrons buy meat/poultry elsewhere
Where supermarket switchers buy meat/poultry:
Club stores (32%) Butcher shops (27%)
Specialty/organic stores (17%)
45% Supercenter patrons buy meat/poultry elsewhere
Where supercenter switchers buy meat/poultry:
Supermarkets (64%) Club stores (13%)
Butcher shops (10%)
The Power of Meat 2017© Page | 18
Where do the 24 percent of shoppers who switch buy meat/poultry?
2016 2017
Supermarkets 48% 39%
Clubs 18% 18%
Butcher stores 13% 17%
Supercenters 7% 5%
Farmers’ markets 4% 7%
Specialty/organic 4% 8%
Online 2% 2%
Other 4% 5%
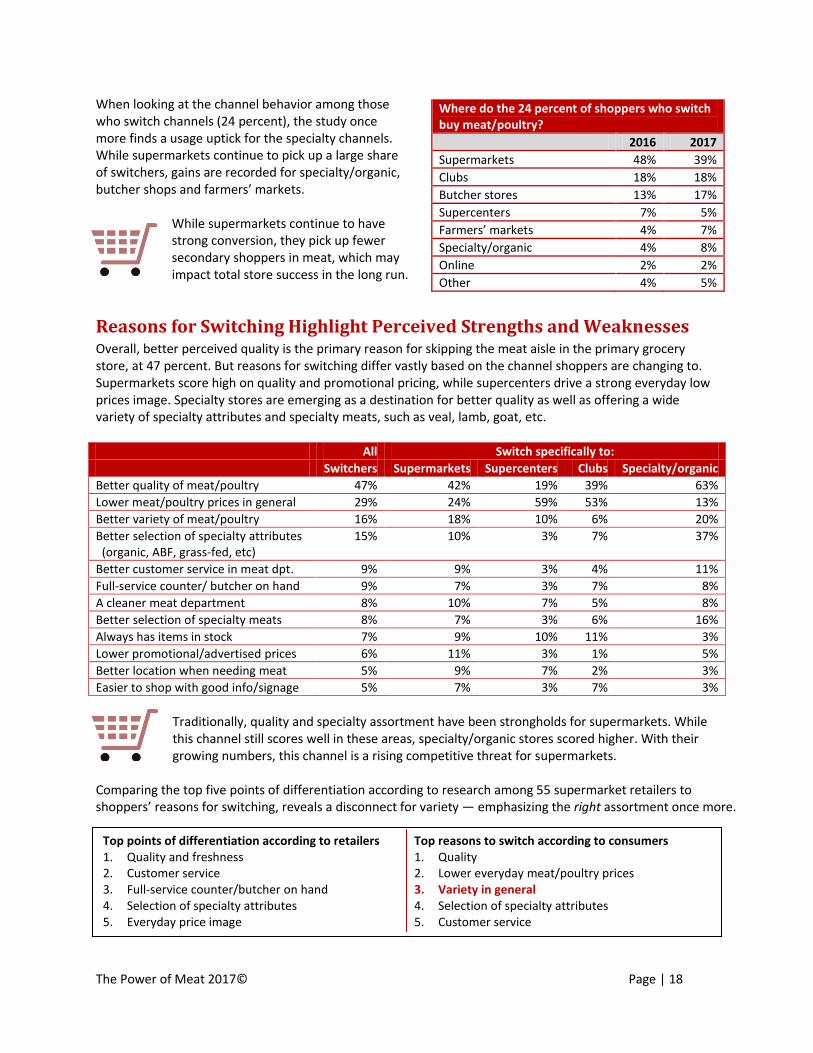
When looking at the channel behavior among those who switch channels (24 percent), the study once more finds a usage uptick for the specialty channels. While supermarkets continue to pick up a large share of switchers, gains are recorded for specialty/organic, butcher shops and farmers’ markets.
While supermarkets continue to have strong conversion, they pick up fewer secondary shoppers in meat, which may impact total store success in the long run.
Reasons for Switching Highlight Perceived Strengths and Weaknesses Overall, better perceived quality is the primary reason for skipping the meat aisle in the primary grocery store, at 47 percent. But reasons for switching differ vastly based on the channel shoppers are changing to. Supermarkets score high on quality and promotional pricing, while supercenters drive a strong everyday low prices image. Specialty stores are emerging as a destination for better quality as well as offering a wide variety of specialty attributes and specialty meats, such as veal, lamb, goat, etc. All Switch specifically to:
Switchers Supermarkets Supercenters Clubs Specialty/organic
Better quality of meat/poultry 47% 42% 19% 39% 63%
Lower meat/poultry prices in general 29% 24% 59% 53% 13%
Better variety of meat/poultry 16% 18% 10% 6% 20%
Better selection of specialty attributes (organic, ABF, grass-fed, etc)
15% 10% 3% 7% 37%
Better customer service in meat dpt. 9% 9% 3% 4% 11%
Full-service counter/ butcher on hand 9% 7% 3% 7% 8%
A cleaner meat department 8% 10% 7% 5% 8%
Better selection of specialty meats 8% 7% 3% 6% 16%
Always has items in stock 7% 9% 10% 11% 3%
Lower promotional/advertised prices 6% 11% 3% 1% 5%
Better location when needing meat 5% 9% 7% 2% 3%
Easier to shop with good info/signage 5% 7% 3% 7% 3%
Traditionally, quality and specialty assortment have been strongholds for supermarkets. While this channel still scores well in these areas, specialty/organic stores scored higher. With their growing numbers, this channel is a rising competitive threat for supermarkets.
Comparing the top five points of differentiation according to research among 55 supermarket retailers to shoppers’ reasons for switching, reveals a disconnect for variety — emphasizing the right assortment once more.
Top points of differentiation according to retailers Top reasons to switch according to consumers 1. Quality and freshness 2. Customer service 3. Full-service counter/butcher on hand 4. Selection of specialty attributes 5. Everyday price image
1. Quality 2. Lower everyday meat/poultry prices 3. Variety in general 4. Selection of specialty attributes 5. Customer service
The Power of Meat 2017© Page | 19
86%
86%
2006 2007 2008 2009 2010 2011 2012 2013 2014 2015 2016 2017
Supermarket shoppers buying meat at their primary store (conversion %)
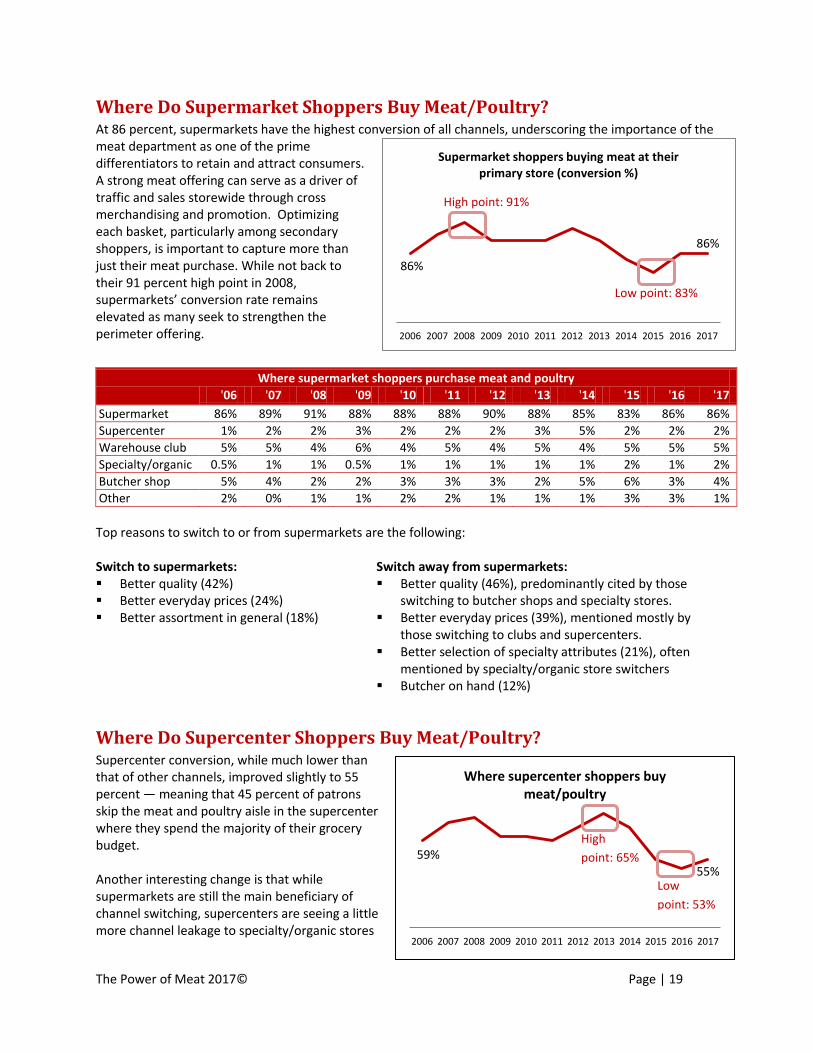
Where Do Supermarket Shoppers Buy Meat/Poultry? At 86 percent, supermarkets have the highest conversion of all channels, underscoring the importance of the meat department as one of the prime differentiators to retain and attract consumers. A strong meat offering can serve as a driver of traffic and sales storewide through cross merchandising and promotion. Optimizing each basket, particularly among secondary shoppers, is important to capture more than just their meat purchase. While not back to their 91 percent high point in 2008, supermarkets’ conversion rate remains elevated as many seek to strengthen the perimeter offering.
Where supermarket shoppers purchase meat and poultry
'06 '07 '08 '09 '10 '11 '12 '13 '14 '15 '16 '17
Supermarket 86% 89% 91% 88% 88% 88% 90% 88% 85% 83% 86% 86%
Supercenter 1% 2% 2% 3% 2% 2% 2% 3% 5% 2% 2% 2%
Warehouse club 5% 5% 4% 6% 4% 5% 4% 5% 4% 5% 5% 5%
Specialty/organic 0.5% 1% 1% 0.5% 1% 1% 1% 1% 1% 2% 1% 2%
Butcher shop 5% 4% 2% 2% 3% 3% 3% 2% 5% 6% 3% 4%
Other 2% 0% 1% 1% 2% 2% 1% 1% 1% 3% 3% 1%
Top reasons to switch to or from supermarkets are the following: Switch to supermarkets: Better quality (42%) Better everyday prices (24%) Better assortment in general (18%)
Switch away from supermarkets: Better quality (46%), predominantly cited by those
switching to butcher shops and specialty stores. Better everyday prices (39%), mentioned mostly by
those switching to clubs and supercenters. Better selection of specialty attributes (21%), often
mentioned by specialty/organic store switchers Butcher on hand (12%)
Where Do Supercenter Shoppers Buy Meat/Poultry? Supercenter conversion, while much lower than that of other channels, improved slightly to 55 percent — meaning that 45 percent of patrons skip the meat and poultry aisle in the supercenter where they spend the majority of their grocery budget. Another interesting change is that while supermarkets are still the main beneficiary of channel switching, supercenters are seeing a little more channel leakage to specialty/organic stores
High point: 91%
High point: 65%
Low point: 83%
59%
55%
2006 2007 2008 2009 2010 2011 2012 2013 2014 2015 2016 2017
Where supercenter shoppers buy meat/poultry
High
point: 65%
Low
point: 53%

The Power of Meat 2017© Page | 20
and butcher shops, which is driven by Millennial supercenter shoppers.
Where supercenter shoppers purchase meat and poultry
'06 '07 '08 '09 '10 '11 '12 '13 '14 '15 '16 '17
Supermarket 27% 25% 27% 30% 29% 30% 29% 25% 27% 27% 32% 27%
Supercenter 59% 63% 64% 60% 60% 59% 62% 65% 62% 55% 53% 55%
Warehouse club 6% 3% 4% 5% 5% 5% 6% 6% 6% 9% 6% 6%
Specialty/organic 0.5% 0.5% 1% 0.5% 0.5% 0.5% 1% 1% 2% 3% 1% 3%
Butcher shop 4% 7% 3% 3% 2% 3% 2% 2% 3% 5% 4% 6%
Other 3% 2% 1% 3% 1% 2% 1% 1% 1% 1% 5% 4%
Top reasons to switch to supercenters when doing most of the shopping in other channels, or switching away from supercenters are the following: Switch to supercenters: Better everyday prices (59%) Better quality (19%) Better assortment in general (10%)
Switch away from supercenters: Better quality of the meat/poultry (65%), cited across
all channels supercenter shoppers switch to Better assortment in general (21%) Better assortment in special attributes (14%) Better customer service/full-service counter (13%)
With so many supercenter patrons frequenting a variety of formats to purchase meat and poultry, there is opportunity all around. Supermarkets, specialty/organic stores and clubs can focus on building the basket beyond perishables among these supercenter patrons. At the same time, supercenters have a lot of room to strengthen their meat offerings and increase
shopper retention among their own shoppers.
Shoppers Frequent Fewer “Occasional” Outlets for Meat Purchase Aside from the primary store, shoppers occasionally purchase fresh meat and poultry in other channels. While meat is a much more concentrated purchase than other categories — due to its planned purchase nature — the primary store does get some occasional competition from alternative channels. However, when compared with prior years, fewer people are buying meat/poultry outside their primary channel in 2017, perhaps due to the more affordable pricing at their main outlets. Farmers’ market/farm direct and butcher stores are the main forms of competition for the occasional purchase, shopped by about one in six consumers.
3%
3%
15%
4%
7%
18%
2%
3%
3%
15%
17%
0 0.05 0.1 0.15 0.2
Meal kit delivery
Online
Dollar store
Butcher stores
Farmers' markets/farm direct
Outlets shopped occasionally in the past three months for fresh meat/poultry
2017 2016 2015
-- --
-- --

The Power of Meat 2017© Page | 21
More likely to occasionally purchase meat/poultry at:
Farmers’ markets (17%) Stand-alone butcher shops (15%)
Both lower-than-average incomes (often Millennial households) and high-income of >100,000 annually
Millennials and Generation X, particularly when children are present
Households of 3 and 4+ people Shoppers who have a high interest in special
attributes, including organic and local Specialty/organic store shoppers
Shoppers who highly value quality, variety (including special attributes and specialty meats) and customer service.
Higher-than-average income, particularly above $100,000
Boomers Supermarket shoppers Men
Dollar stores (3%) Online and meal kit delivery (3% and 2%)
Lower income of <$35,000 Large households Supercenter shoppers
Millennials and Generation X Men Lower-than-average income associated with
younger shoppers; as well as higher-income
According to the USDA, more than 167,000 U.S. farms locally produced and sold food through direct marketing practices, resulting in $8.7 billion in revenue in 2015 (including processed and unprocessed foods, such as meat and cheese). Farms selling food directly to consumers through farm stores or farmers’ markets brought $3 billion in sales, estimated at 115,000
operations. This is ahead of sales directly to retailers, which were $2.3 billion from over 23,000 operations nationwide. Leading states are California, Michigan New York, Pennsylvania and Wisconsin. Pennsylvania led in the number of farms selling directly to consumers, with more than 6,000 operations engaged in direct-to- consumer sales. California led in sales, earning $467 million. Only 8 percent of farms selling directly to consumers across the nation did so via online marketplaces, though 73 percent of all farms using direct marketing practices had internet access last year. The USDA survey also concluded that more than 80 percent of all direct market food sales occurred within 100 miles of the farm, and that most farms selling to consumers were less than 20 miles from their largest grossing marketplace. Along with the rapidly rising number of farmers' markets around the country, brick-and-mortar retailers should take notice and more effectively communicate that their meat and poultry is every bit as fresh and high quality, with a strong emphasis on food safety in the supply chain.

The Power of Meat 2017© Page | 22
The Meat Purchasing Decision
Chapter Insights After years of volume pressure, deflation is driving modest gains in volume but negative dollar growth.
Despite price relief, two-thirds of shoppers stick to their normal purchases and save; 18 percent buy a little more and 14 percent are trading up to more premium cuts and kinds.
The meat case remains the routine destination, accounting for 74 percent of all purchases. The full-service counter provides answers for those seeking specialty items, cuts, cooking advice or meal inspiration and can be an important point of differentiation.
Price per pound has the greatest influence on the ultimate purchase decision, but the dominance of price overall is down in favor of appearance (quality). Younger shoppers place great emphasis on preparation time and ease.
In-store price comparison behavior remains important, but comparing between cuts/proteins and sifting through packages is down among those who were already less focused on money-savings.
The diminished focus on price and money-saving measures throughout the trip is predominantly driven by high-income households.
Packages reflecting varying weights and prices (priced per pound) is the outright preference for 55 percent of shoppers, but Millennials and Generation X have a much stronger preference for exact weight packages — signaling likely acceleration of overall preference for exact weight as seen in the produce department.
An Upside-Down Market Place: Dollars Down, Volume Up Following several years of price inflation, particularly in beef, price conditions were much more favorable for shoppers, with the exception of turkey. The greater affordability translated into shoppers buying greater quantities, particularly in beef. However, pound gains did not fully compensate for the price decreases, leading to dollar losses for most proteins.
Fresh meat category Total dollar sales Dollar gains Total pound sales Volume gains
Total $34.3B -3.6% 10.7B +2.2%
Beef $17.9B -3.4% 3.8B +8.0%
Chicken $9.3B -1.3% 4.2B +0.5%
Pork $4.6B -8.8% 1.7B -1.9%
Turkey $1.9B -3.3% 0.9B -4.7%
Lamb $280M +0.2% 39.3M +3.7%
Veal $49M -12.7% 6.1M -10.7%
Fowl/exotic meats $138M +1.8% 38.7M -1.1%
Source: Nielsen, FCA, 52 weeks ending 11/26/2016.
Shoppers Agree: Lower Prices Way to Save or Trade Up About two-thirds of shoppers report relatively unchanged meat and poultry purchases, which by and large translated into saving a little money for the shopper, but dollar declines for the industry. Others did make changes: 18 percent of all respondents purchased a little more this past year but roughly spent the same — accounting for the modest volume uptick of +2.3 percent. And, 14 percent say they shifted at least some of their purchases to premium cuts and kinds of meat/poultry — driving significant sales growth in these areas.
The Power of Meat 2017© Page | 23
74% Of purchases selected from meat case
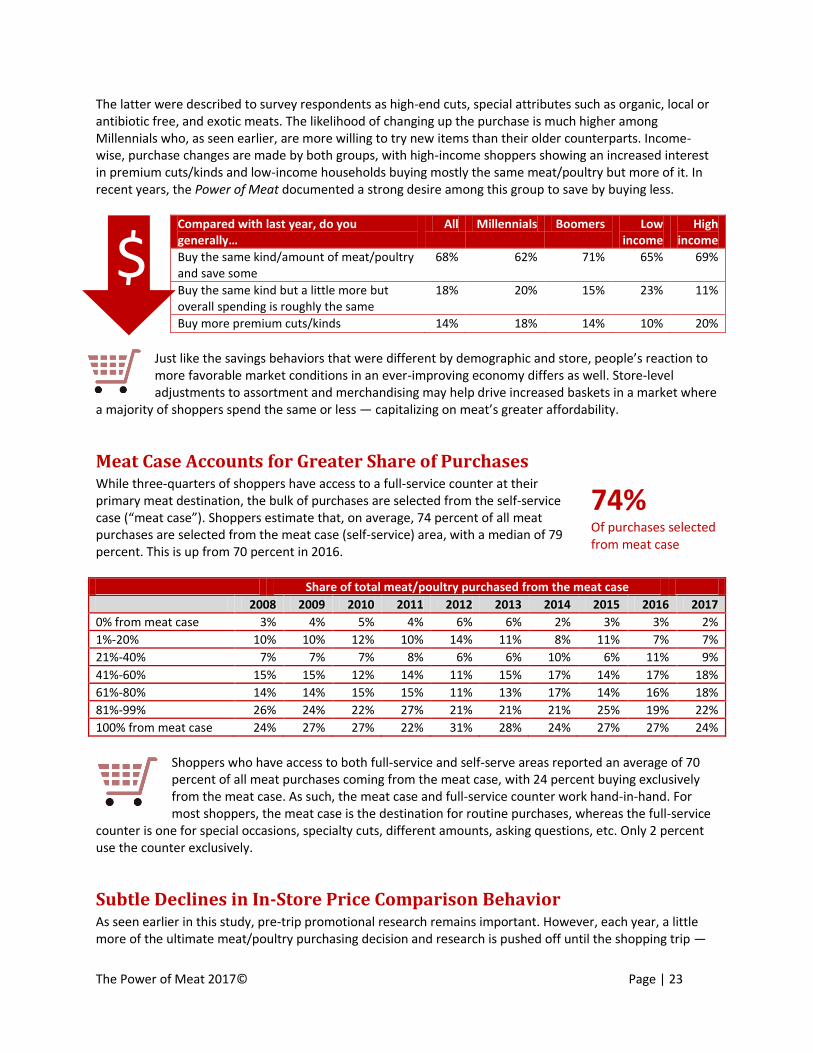
The latter were described to survey respondents as high-end cuts, special attributes such as organic, local or antibiotic free, and exotic meats. The likelihood of changing up the purchase is much higher among Millennials who, as seen earlier, are more willing to try new items than their older counterparts. Income-wise, purchase changes are made by both groups, with high-income shoppers showing an increased interest in premium cuts/kinds and low-income households buying mostly the same meat/poultry but more of it. In recent years, the Power of Meat documented a strong desire among this group to save by buying less.
Compared with last year, do you generally…
All Millennials Boomers Low income
High income
Buy the same kind/amount of meat/poultry and save some
68% 62% 71% 65% 69%
Buy the same kind but a little more but overall spending is roughly the same
18% 20% 15% 23% 11%
Buy more premium cuts/kinds 14% 18% 14% 10% 20%
Just like the savings behaviors that were different by demographic and store, people’s reaction to more favorable market conditions in an ever-improving economy differs as well. Store-level adjustments to assortment and merchandising may help drive increased baskets in a market where
a majority of shoppers spend the same or less — capitalizing on meat’s greater affordability.
Meat Case Accounts for Greater Share of Purchases While three-quarters of shoppers have access to a full-service counter at their primary meat destination, the bulk of purchases are selected from the self-service case (“meat case”). Shoppers estimate that, on average, 74 percent of all meat purchases are selected from the meat case (self-service) area, with a median of 79 percent. This is up from 70 percent in 2016.
Share of total meat/poultry purchased from the meat case
2008 2009 2010 2011 2012 2013 2014 2015 2016 2017
0% from meat case 3% 4% 5% 4% 6% 6% 2% 3% 3% 2%
1%-20% 10% 10% 12% 10% 14% 11% 8% 11% 7% 7%
21%-40% 7% 7% 7% 8% 6% 6% 10% 6% 11% 9%
41%-60% 15% 15% 12% 14% 11% 15% 17% 14% 17% 18%
61%-80% 14% 14% 15% 15% 11% 13% 17% 14% 16% 18%
81%-99% 26% 24% 22% 27% 21% 21% 21% 25% 19% 22%
100% from meat case 24% 27% 27% 22% 31% 28% 24% 27% 27% 24%
Shoppers who have access to both full-service and self-serve areas reported an average of 70 percent of all meat purchases coming from the meat case, with 24 percent buying exclusively from the meat case. As such, the meat case and full-service counter work hand-in-hand. For most shoppers, the meat case is the destination for routine purchases, whereas the full-service
counter is one for special occasions, specialty cuts, different amounts, asking questions, etc. Only 2 percent use the counter exclusively.
Subtle Declines in In-Store Price Comparison Behavior As seen earlier in this study, pre-trip promotional research remains important. However, each year, a little more of the ultimate meat/poultry purchasing decision and research is pushed off until the shopping trip —
$
The Power of Meat 2017© Page | 24
3% 6%
24% 31%
36%
4% 7%
20%
30%
39%
Never Hardly ever Occasionally Frequently Every time I shop for
meat/poultry
Checking prices by comparing different package sizes for the same product
2016 2017
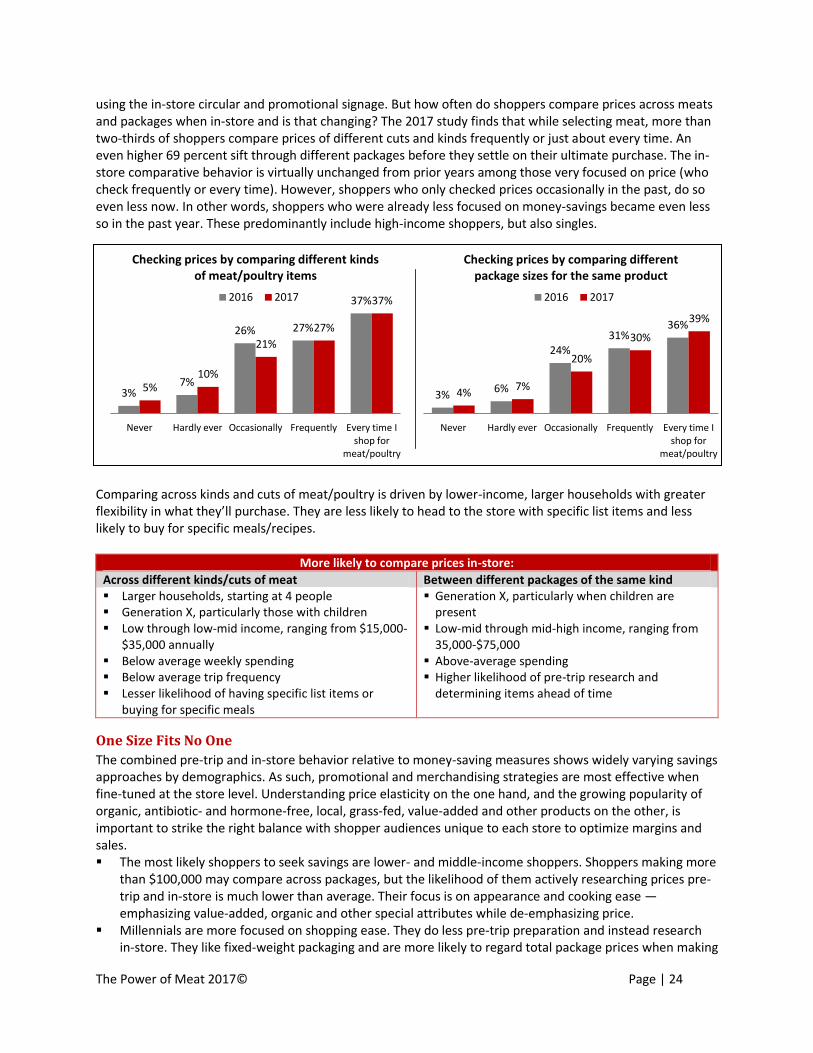
using the in-store circular and promotional signage. But how often do shoppers compare prices across meats and packages when in-store and is that changing? The 2017 study finds that while selecting meat, more than two-thirds of shoppers compare prices of different cuts and kinds frequently or just about every time. An even higher 69 percent sift through different packages before they settle on their ultimate purchase. The in-store comparative behavior is virtually unchanged from prior years among those very focused on price (who check frequently or every time). However, shoppers who only checked prices occasionally in the past, do so even less now. In other words, shoppers who were already less focused on money-savings became even less so in the past year. These predominantly include high-income shoppers, but also singles.
Comparing across kinds and cuts of meat/poultry is driven by lower-income, larger households with greater flexibility in what they’ll purchase. They are less likely to head to the store with specific list items and less likely to buy for specific meals/recipes.
More likely to compare prices in-store:
Across different kinds/cuts of meat Between different packages of the same kind Larger households, starting at 4 people Generation X, particularly those with children Low through low-mid income, ranging from $15,000-
$35,000 annually Below average weekly spending Below average trip frequency Lesser likelihood of having specific list items or
buying for specific meals
Generation X, particularly when children are present
Low-mid through mid-high income, ranging from 35,000-$75,000
Above-average spending Higher likelihood of pre-trip research and
determining items ahead of time
One Size Fits No One
The combined pre-trip and in-store behavior relative to money-saving measures shows widely varying savings approaches by demographics. As such, promotional and merchandising strategies are most effective when fine-tuned at the store level. Understanding price elasticity on the one hand, and the growing popularity of organic, antibiotic- and hormone-free, local, grass-fed, value-added and other products on the other, is important to strike the right balance with shopper audiences unique to each store to optimize margins and sales. The most likely shoppers to seek savings are lower- and middle-income shoppers. Shoppers making more
than $100,000 may compare across packages, but the likelihood of them actively researching prices pre-trip and in-store is much lower than average. Their focus is on appearance and cooking ease — emphasizing value-added, organic and other special attributes while de-emphasizing price.
Millennials are more focused on shopping ease. They do less pre-trip preparation and instead research in-store. They like fixed-weight packaging and are more likely to regard total package prices when making
3% 7%
26% 27%
37%
5% 10%
21%
27%
37%
Never Hardly ever Occasionally Frequently Every time I shop for
meat/poultry
Checking prices by comparing different kinds of meat/poultry items
2016 2017
The Power of Meat 2017© Page | 25
their buying decisions. While price is important, they also favor clean-label and convenience products, but don’t always vote with their wallets.
Women are more specific in their planning, buying for specific recipes, determining items pre-trip and are more likely to compare prices across species and packages. They are more focused on price-per-pound.
Larger households are more likely to engage in various saving behaviors, including volume-based discounts and sales promotions, and often compare between cuts/kinds in-store as well.
Price Per Pound Leads, But High Millennial Interest for Fixed Weight Traditionally, meat and poultry have been priced per pound, with packages reflecting varying weights and prices. In recent years, retailers have increasingly used each pricing, both in meat and produce. Respondents were asked about their preference and provided with an example of each pricing strategy. One-third of shoppers say it depends too much on the cut/kind, but 55 percent have an outright preference for the proven system of price per pound. This share is driven by Boomers and seniors, however, with Millennials and Generation X having a much stronger like for exact weight.
Your preference for pricing strategies… All Millennials Gen X Boomers Seniors
Price per pound, with different prices for each package 55% 45% 49% 61% 60%
Exact weight for each item (same price for each package) 12% 25% 19% 5% 5%
Depends too much on the kind/cut to say 33% 30% 32% 34% 35%
According to the National Meat Case Study 2015, retailers are increasingly leveraging exact weight packages, which grew from 24 percent to 31 percent between 2010 and 2015. They are particularly important in turkey and ground beef, representing 81 percent and 68 percent of the total packages in the meat case.
While price per pound leads merchandising practices and consumer preferences today, the market is changing, driven by demographic differences. Outright preference for fixed weight/each pricing is much higher among the younger shopper generations. Between greater
availability in meat (and produce) and shopper preference, it is likely fixed weight will see accelerated uptake in the next few years.
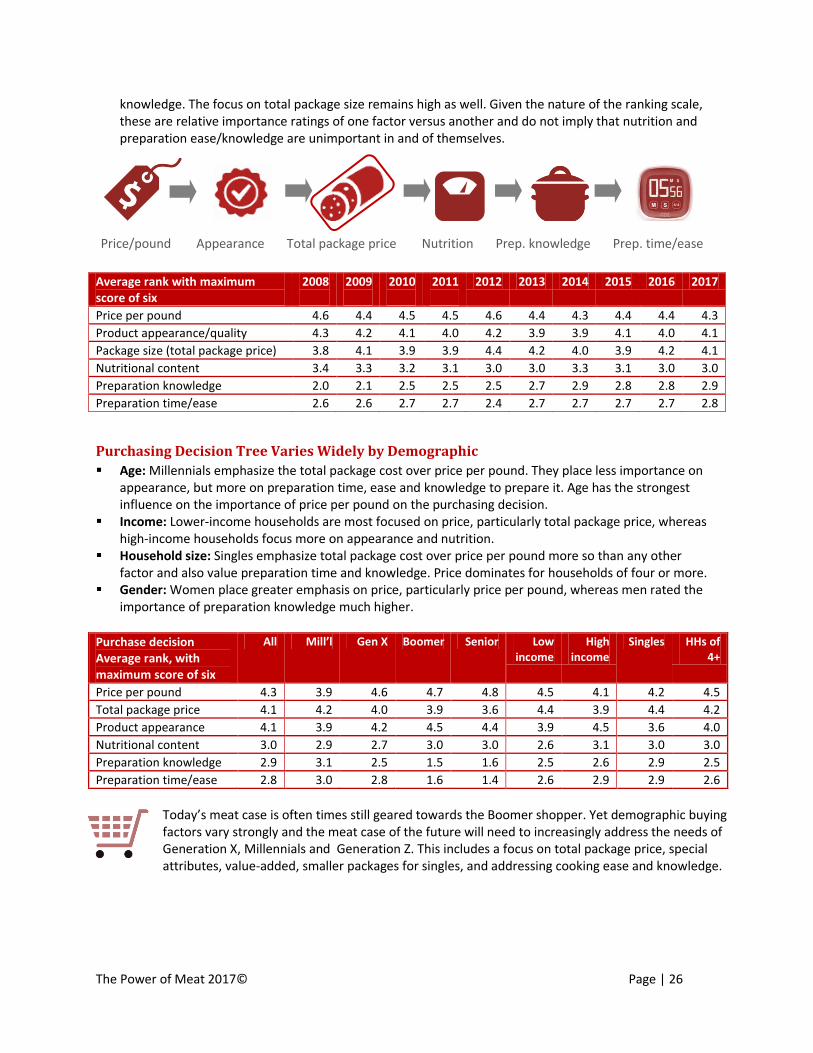
Price Rules but Greater Focus on Appearance and Knowledge When selecting and buying fresh meat and poultry, different factors such as price, nutrition or preparation ease may influence the ultimate purchase. The Power of Meat has been tracking the purchasing decision tree since the 2008 report: 2008-2010: Price per pound dominated the purchasing decision in combination with appearance. 2011-2013: Economic woes combined with rising commodity prices prompted total dominance of price,
led by price per pound with total package price in second place. 2014: With prices leveling off for most commodities and the economy in recovery, price led, but not with
the dominance seen before. The importance of time, knowledge and nutrition grew. 2015: Price per pound continued to dominate the decision, with appearance reclaiming the second
highest priority in the decision tree. 2016: Total package price rose in importance due to price and demographic trends, with shoppers
increasingly calling for smaller pack sizes and some favoring fixed-weight pricing. This year: Price per pound holds on as having the greatest influence on the ultimate purchase, but
shoppers report a greater relative focus on appearance (quality) as well as cooking speed/ease and
The Power of Meat 2017© Page | 26
knowledge. The focus on total package size remains high as well. Given the nature of the ranking scale, these are relative importance ratings of one factor versus another and do not imply that nutrition and preparation ease/knowledge are unimportant in and of themselves.
Average rank with maximum score of six
2008
2009
2010
2011
2012 2013 2014 2015 2016 2017
Price per pound 4.6 4.4 4.5 4.5 4.6 4.4 4.3 4.4 4.4 4.3
Product appearance/quality 4.3 4.2 4.1 4.0 4.2 3.9 3.9 4.1 4.0 4.1
Package size (total package price) 3.8 4.1 3.9 3.9 4.4 4.2 4.0 3.9 4.2 4.1
Nutritional content 3.4 3.3 3.2 3.1 3.0 3.0 3.3 3.1 3.0 3.0
Preparation knowledge 2.0 2.1 2.5 2.5 2.5 2.7 2.9 2.8 2.8 2.9
Preparation time/ease 2.6 2.6 2.7 2.7 2.4 2.7 2.7 2.7 2.7 2.8
Purchasing Decision Tree Varies Widely by Demographic
Age: Millennials emphasize the total package cost over price per pound. They place less importance on appearance, but more on preparation time, ease and knowledge to prepare it. Age has the strongest influence on the importance of price per pound on the purchasing decision.
Income: Lower-income households are most focused on price, particularly total package price, whereas high-income households focus more on appearance and nutrition.
Household size: Singles emphasize total package cost over price per pound more so than any other factor and also value preparation time and knowledge. Price dominates for households of four or more.
Gender: Women place greater emphasis on price, particularly price per pound, whereas men rated the importance of preparation knowledge much higher.
Purchase decision Average rank, with maximum score of six
All Mill’l Gen X Boomer Senior Low income
High income
Singles HHs of 4+
Price per pound 4.3 3.9 4.6 4.7 4.8 4.5 4.1 4.2 4.5
Total package price 4.1 4.2 4.0 3.9 3.6 4.4 3.9 4.4 4.2
Product appearance 4.1 3.9 4.2 4.5 4.4 3.9 4.5 3.6 4.0
Nutritional content 3.0 2.9 2.7 3.0 3.0 2.6 3.1 3.0 3.0
Preparation knowledge 2.9 3.1 2.5 1.5 1.6 2.5 2.6 2.9 2.5
Preparation time/ease 2.8 3.0 2.8 1.6 1.4 2.6 2.9 2.9 2.6
Today’s meat case is often times still geared towards the Boomer shopper. Yet demographic buying factors vary strongly and the meat case of the future will need to increasingly address the needs of Generation X, Millennials and Generation Z. This includes a focus on total package price, special attributes, value-added, smaller packages for singles, and addressing cooking ease and knowledge.
Price/pound Appearance Total package price Nutrition Prep. knowledge Prep. time/ease
The Power of Meat 2017© Page | 27
Information and Customer Service
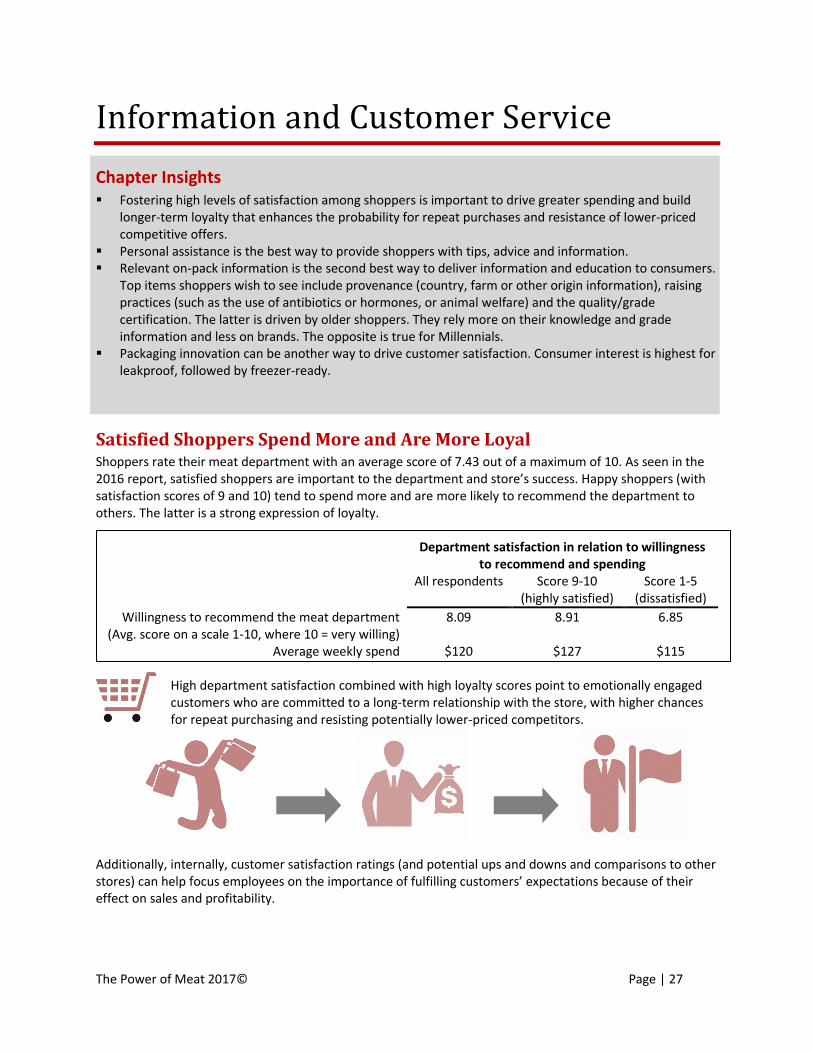
Chapter Insights Fostering high levels of satisfaction among shoppers is important to drive greater spending and build
longer-term loyalty that enhances the probability for repeat purchases and resistance of lower-priced competitive offers.
Personal assistance is the best way to provide shoppers with tips, advice and information. Relevant on-pack information is the second best way to deliver information and education to consumers.
Top items shoppers wish to see include provenance (country, farm or other origin information), raising practices (such as the use of antibiotics or hormones, or animal welfare) and the quality/grade certification. The latter is driven by older shoppers. They rely more on their knowledge and grade information and less on brands. The opposite is true for Millennials.
Packaging innovation can be another way to drive customer satisfaction. Consumer interest is highest for leakproof, followed by freezer-ready.
Satisfied Shoppers Spend More and Are More Loyal Shoppers rate their meat department with an average score of 7.43 out of a maximum of 10. As seen in the 2016 report, satisfied shoppers are important to the department and store’s success. Happy shoppers (with satisfaction scores of 9 and 10) tend to spend more and are more likely to recommend the department to others. The latter is a strong expression of loyalty.
Department satisfaction in relation to willingness to recommend and spending
All respondents Score 9-10 (highly satisfied)
Score 1-5 (dissatisfied)
Willingness to recommend the meat department (Avg. score on a scale 1-10, where 10 = very willing)
8.09 8.91 6.85
Average weekly spend $120 $127 $115 High department satisfaction combined with high loyalty scores point to emotionally engaged customers who are committed to a long-term relationship with the store, with higher chances for repeat purchasing and resisting potentially lower-priced competitors.
Additionally, internally, customer satisfaction ratings (and potential ups and downs and comparisons to other stores) can help focus employees on the importance of fulfilling customers’ expectations because of their effect on sales and profitability.
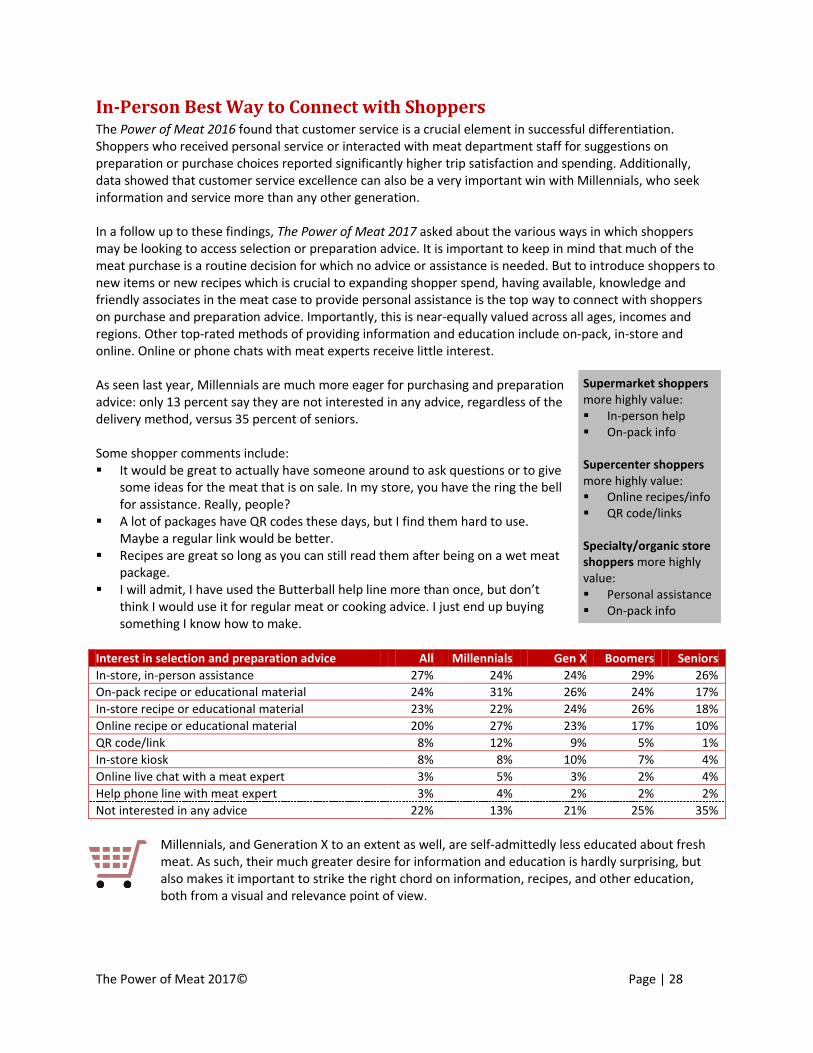
The Power of Meat 2017© Page | 28
Supermarket shoppers more highly value: In-person help On-pack info Supercenter shoppers more highly value: Online recipes/info QR code/links
Specialty/organic store shoppers more highly value: Personal assistance On-pack info
In-Person Best Way to Connect with Shoppers The Power of Meat 2016 found that customer service is a crucial element in successful differentiation. Shoppers who received personal service or interacted with meat department staff for suggestions on preparation or purchase choices reported significantly higher trip satisfaction and spending. Additionally, data showed that customer service excellence can also be a very important win with Millennials, who seek information and service more than any other generation. In a follow up to these findings, The Power of Meat 2017 asked about the various ways in which shoppers may be looking to access selection or preparation advice. It is important to keep in mind that much of the meat purchase is a routine decision for which no advice or assistance is needed. But to introduce shoppers to new items or new recipes which is crucial to expanding shopper spend, having available, knowledge and friendly associates in the meat case to provide personal assistance is the top way to connect with shoppers on purchase and preparation advice. Importantly, this is near-equally valued across all ages, incomes and regions. Other top-rated methods of providing information and education include on-pack, in-store and online. Online or phone chats with meat experts receive little interest. As seen last year, Millennials are much more eager for purchasing and preparation advice: only 13 percent say they are not interested in any advice, regardless of the delivery method, versus 35 percent of seniors. Some shopper comments include: It would be great to actually have someone around to ask questions or to give
some ideas for the meat that is on sale. In my store, you have the ring the bell for assistance. Really, people?
A lot of packages have QR codes these days, but I find them hard to use. Maybe a regular link would be better.
Recipes are great so long as you can still read them after being on a wet meat package.
I will admit, I have used the Butterball help line more than once, but don’t think I would use it for regular meat or cooking advice. I just end up buying something I know how to make.
Interest in selection and preparation advice All Millennials Gen X Boomers Seniors
In-store, in-person assistance 27% 24% 24% 29% 26%
On-pack recipe or educational material 24% 31% 26% 24% 17%
In-store recipe or educational material 23% 22% 24% 26% 18%
Online recipe or educational material 20% 27% 23% 17% 10%
QR code/link 8% 12% 9% 5% 1%
In-store kiosk 8% 8% 10% 7% 4%
Online live chat with a meat expert 3% 5% 3% 2% 4%
Help phone line with meat expert 3% 4% 2% 2% 2%
Not interested in any advice 22% 13% 21% 25% 35%
Millennials, and Generation X to an extent as well, are self-admittedly less educated about fresh meat. As such, their much greater desire for information and education is hardly surprising, but also makes it important to strike the right chord on information, recipes, and other education, both from a visual and relevance point of view.

The Power of Meat 2017© Page | 29
Retailer survey insights: Out of 55 surveyed retailers, 22 percent are doing a significant push to reallocate labor from back room processing to the sales floor selling. Another 39 percent are making somewhat of a push and 15 percent are planning to. Of the 24 percent who are not, some are already 100 percent case-ready.
Additionally, 67 percent of respondents consider finding good people who want to make a career in meat a major issue and 22 percent see it as somewhat of an issue. Only 11 percent of retailers say they are able to find and keep good people. A greater share of case-ready is one answer to the labor problem, according to 41 percent of respondents.
Earlier editions of the Power of Meat have often documented a) the self-rated lack of knowledge of meat and poultry and b) shoppers increasingly turning online
for advice instead of asking in the store. Last year’s study found that only 7 percent would ask an associate in the meat department for help with a question when making something new. Yet, this year’s survey clearly finds that shoppers would actually value personal assistance. This indicates two possible disconnects: either stores do not have knowledge and friendly associates readily available in the meat case, or shoppers do not consider available resources a solution to their questions. Either way, given the strong positive impact of customer service on trip experience, spending and loyalty, there is much to be gained to offer the best personal experience possible. The question is whether the industry-wide issue of hiring and retaining quality butchers is resulting in a growing opportunity gap for connecting with shoppers through customer service. As we consider the recent-year pressure on trips, growing the basket size will be all the more important, and an improved role in customer service and education can play an important role.
Info on Origin and Raising Practices Score Big With Shoppers Provenance, not necessary limited to country, but inclusive of farm or region as well, along with raising practices are the top two pieces of information shoppers would like to see on the package label. Each are deemed important by more than four in 10 shoppers. With meat being an habitual purchase for most shoppers, these levels of interest should be considered quite high in the quest to build loyalty or drive new item purchase. Very closely behind is a reference to the quality certification, such as prime/choice/select for beef, or Grade A, etc for chicken. However, for the latter, the interest is driven by Boomers and seniors, with
only 31 percent of Millennials valuing this information. Earlier editions of the Power of Meat demonstrated wide confusion over the USDA beef grading system with subsequent preferences associated with brands more so than grades.
Second-tier information preferences center on education relative to nutrition, preparation and storage, each at about one-third of shoppers. Lastly, about one-quarter of shoppers would like to see recipes and serving suggestions and information on the breed. Interest in on-pack information regarding: All Millennials Gen X Boomers Seniors Origin, such as country, region or farm 41% 35% 42% 44% 43%
Raising practices, such as antibiotic-free, cage-free, etc. 41% 39% 44% 44% 35%
Quality certification or grade (prime, grade A, etc.) 40% 31% 38% 47% 46%
Preparation and storage instructions, including time/temperature, storage and thawing
35% 33% 35% 38% 38%
Nutrition information and specific nutrition callouts 34% 36% 34% 34% 34%
Recipes and serving suggestions 26% 30% 27% 22% 15%
Breed (Angus, Hereford, Waygu, etc.)* 22% 25% 21% 21% 17%
* Note that the importance of a breed reference was asked of all shoppers, regardless of their level of beef consumption.

The Power of Meat 2017© Page | 30
Other items mentioned by respondents multiple times include: Carbon footprint. Allergen information due to possible cross
contamination. Package and use by date.
Whether the product was frozen before. GMO reference. Origin in terms of farm versus country. Larger print on labels.
Packaging Innovation Closely Ties to Customer Satisfaction Packaging is an integral part of customer satisfaction as well— generating many comments for improvement, including pack size, functionality, cleanliness and environmentally-friendly options. Shoppers value ease-of-use and cleanliness when it comes to packaging. Leakproof continues to draw the highest and near universal interest among shoppers, and 50 percent would like to see their meat department add more products in leakproof packaging. “I would switch brands if more had leakproof packaging, especially chicken.” Some other insights: Freezer-ready — High interest among most shopper groups except those with a high trip frequency with
the tendency to purchase fresh meat and poultry multiple times per week. “It’s great to buy packages that you can put straight in the freezer without having freezer burn or needing to repackage the meat yourself. But not around much.”
Environmentally-friendly — Higher interest among Millennials as well as higher-income shoppers. “I wish they would get rid of all the Styrofoam and use something that biodegrades.”
Resealable — Resealable solutions may be an alternate way to address the growing call for smaller pack sizes, while still selling a larger volume — particularly in combination with solutions that provide greater shelf life and on-pack educational tools. Resealable packaging draws the highest interest among two-person households, at 51 percent.
Pre-portioning into small/meal-size quantities — Predictably, smaller households have a much higher interest, at 32 percent. “The minute I saw the bags that contain a bunch of smaller, one chicken breast pouches, I was sold. Didn’t even check the price per pound. I just cook for myself and if I buy a regular package, I have to repackage it myself or end up throwing half of it out.” Interest is also closely tied to income, where interest rises along with earnings. Interest is lower among frequent shoppers as well.
Interest in more products using packages that are…
Very interested
Somewhat interested
Not too/at all interested
Leakproof 50% 48% 2%
Freezer-ready 41% 35% 24%
Environmentally-friendly 38% 32% 30%
Resealable 34% 38% 28%
Reduces food waste 29% 34% 37%
Pre-portioned into small/meal-size quantities 24% 45% 31%
The interest in packaging innovation is clear, but the real question is whether shoppers are aware of packaging benefits when making their selections in the meat case. In addition to functional advantages for retailers, sales may be influenced by educating shoppers on the benefits of various packaging as true selling points. For example, while avoiding messiness
with leak-proof packaging may be evident to most shoppers, these vacuum-sealed packages have many other advantages such as freezer-readiness, avoiding freezer burn, and extended home refrigerator storage that could be touted along with cleanliness.
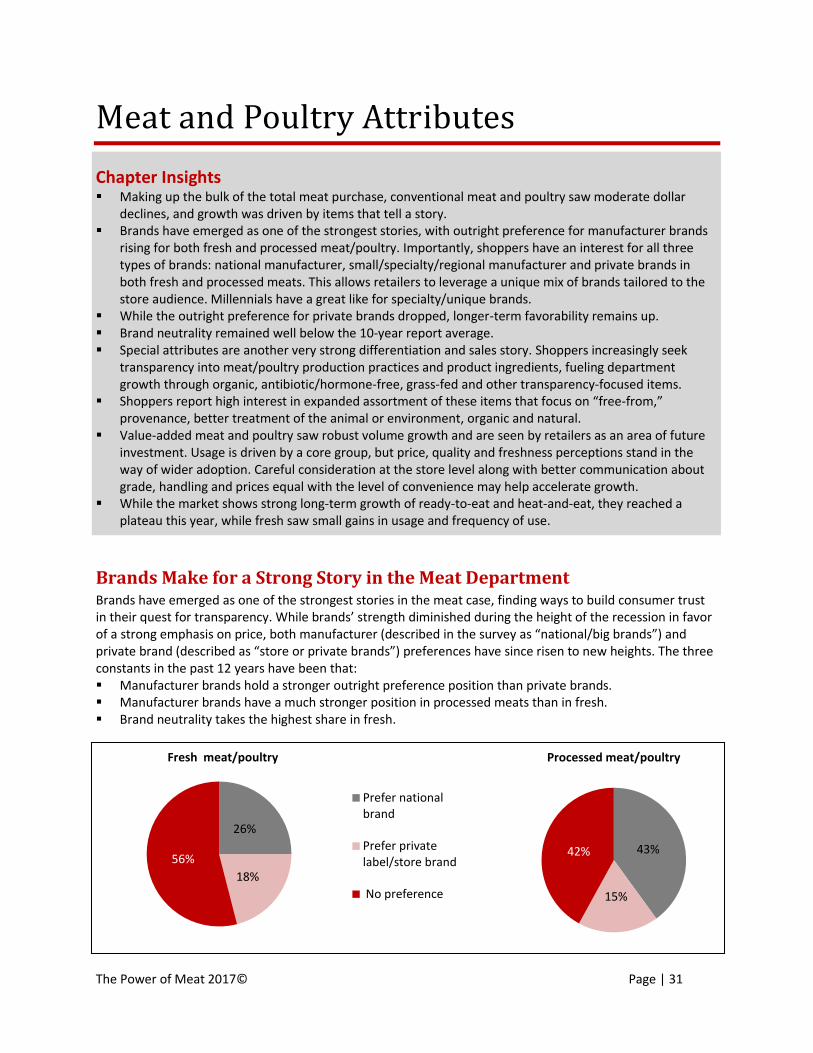
The Power of Meat 2017© Page | 31
26%
18%
56%
Fresh meat/poultry
Prefer national brand
Prefer private label/store brand
No preference
43%
15%
42%
Processed meat/poultry
Meat and Poultry Attributes
Chapter Insights Making up the bulk of the total meat purchase, conventional meat and poultry saw moderate dollar
declines, and growth was driven by items that tell a story. Brands have emerged as one of the strongest stories, with outright preference for manufacturer brands
rising for both fresh and processed meat/poultry. Importantly, shoppers have an interest for all three types of brands: national manufacturer, small/specialty/regional manufacturer and private brands in both fresh and processed meats. This allows retailers to leverage a unique mix of brands tailored to the store audience. Millennials have a great like for specialty/unique brands.
While the outright preference for private brands dropped, longer-term favorability remains up. Brand neutrality remained well below the 10-year report average. Special attributes are another very strong differentiation and sales story. Shoppers increasingly seek
transparency into meat/poultry production practices and product ingredients, fueling department growth through organic, antibiotic/hormone-free, grass-fed and other transparency-focused items.
Shoppers report high interest in expanded assortment of these items that focus on “free-from,” provenance, better treatment of the animal or environment, organic and natural.
Value-added meat and poultry saw robust volume growth and are seen by retailers as an area of future investment. Usage is driven by a core group, but price, quality and freshness perceptions stand in the way of wider adoption. Careful consideration at the store level along with better communication about grade, handling and prices equal with the level of convenience may help accelerate growth.
While the market shows strong long-term growth of ready-to-eat and heat-and-eat, they reached a plateau this year, while fresh saw small gains in usage and frequency of use.
Brands Make for a Strong Story in the Meat Department Brands have emerged as one of the strongest stories in the meat case, finding ways to build consumer trust in their quest for transparency. While brands’ strength diminished during the height of the recession in favor of a strong emphasis on price, both manufacturer (described in the survey as “national/big brands”) and private brand (described as “store or private brands”) preferences have since risen to new heights. The three constants in the past 12 years have been that: Manufacturer brands hold a stronger outright preference position than private brands. Manufacturer brands have a much stronger position in processed meats than in fresh. Brand neutrality takes the highest share in fresh.
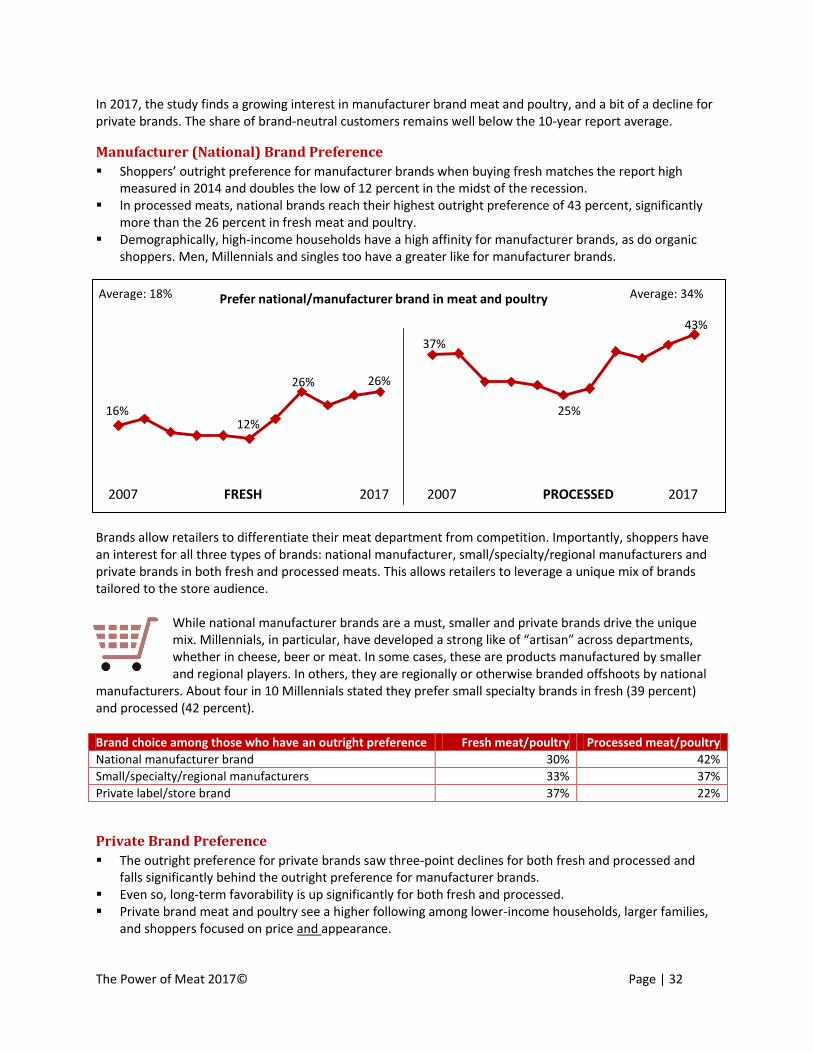
The Power of Meat 2017© Page | 32
16% 12%
26% 26%
37%
25%
43%
Prefer national/manufacturer brand in meat and poultry
In 2017, the study finds a growing interest in manufacturer brand meat and poultry, and a bit of a decline for private brands. The share of brand-neutral customers remains well below the 10-year report average.
Manufacturer (National) Brand Preference
Shoppers’ outright preference for manufacturer brands when buying fresh matches the report high measured in 2014 and doubles the low of 12 percent in the midst of the recession.
In processed meats, national brands reach their highest outright preference of 43 percent, significantly more than the 26 percent in fresh meat and poultry.
Demographically, high-income households have a high affinity for manufacturer brands, as do organic shoppers. Men, Millennials and singles too have a greater like for manufacturer brands.
Brands allow retailers to differentiate their meat department from competition. Importantly, shoppers have an interest for all three types of brands: national manufacturer, small/specialty/regional manufacturers and private brands in both fresh and processed meats. This allows retailers to leverage a unique mix of brands tailored to the store audience.
While national manufacturer brands are a must, smaller and private brands drive the unique mix. Millennials, in particular, have developed a strong like of “artisan” across departments, whether in cheese, beer or meat. In some cases, these are products manufactured by smaller and regional players. In others, they are regionally or otherwise branded offshoots by national
manufacturers. About four in 10 Millennials stated they prefer small specialty brands in fresh (39 percent) and processed (42 percent). Brand choice among those who have an outright preference Fresh meat/poultry Processed meat/poultry
National manufacturer brand 30% 42%
Small/specialty/regional manufacturers 33% 37%
Private label/store brand 37% 22%
Private Brand Preference
The outright preference for private brands saw three-point declines for both fresh and processed and falls significantly behind the outright preference for manufacturer brands.
Even so, long-term favorability is up significantly for both fresh and processed. Private brand meat and poultry see a higher following among lower-income households, larger families,
and shoppers focused on price and appearance.
2007 FRESH 2017 2007 PROCESSED 2017
Average: 18% Average: 34%

The Power of Meat 2017© Page | 33
Shoppers with an outright preference for private brands also show a higher interest in meal BOGOs — perhaps pointing to an opportunity for retailers to introduce shoppers to meat and other private-label items through meal solution promotional offerings.
Brand Neutrality
Brand neutrality remains far below the survey high of 74 percent, measured in the midst of the recession. In processed meat and poultry, outright preference for national brands exceeds brand neutrality for the
first time in 10 years — another signal of strength for manufacturer brands. Unlike other areas of the store, Millennials have lower brand neutrality, and it is shoppers ages 65+ who
are the most undecided when it comes to brands, either in fresh or processed.
Large, small and private branded meat and poultry can enjoy mutual growth by not simply co-existing, but rather evolving and working together to serve the full spectrum of consumer needs and wants. It is a curated, balanced assortment, targeted at the store level, that offers customers the best overarching value.
Special Attributes Are Another Strong Story Shoppers increasingly seek transparency into production practices and product ingredients across food categories, including meat and poultry. While conventional is maintaining in volume, growth in dollars and volume has been fueled by specialty attributes that provide greater insight into raising and production practices. While many post impressive growth rates, the size of the segments in absolute dollars should be kept in mind.
13%
13%
21%
18%
9% 12%
18%
15%
Prefer private label/store brand meat and poultry
71% 74%
54%
56% 53%
63%
42%
No preference for any brand in meat and poultry
2007 FRESH 2017 2007 PROCESSED 2017
2007 FRESH 2017 2007 PROCESSED 2017
Average: 66% Average: 54%
Average: 16% Average: 13%
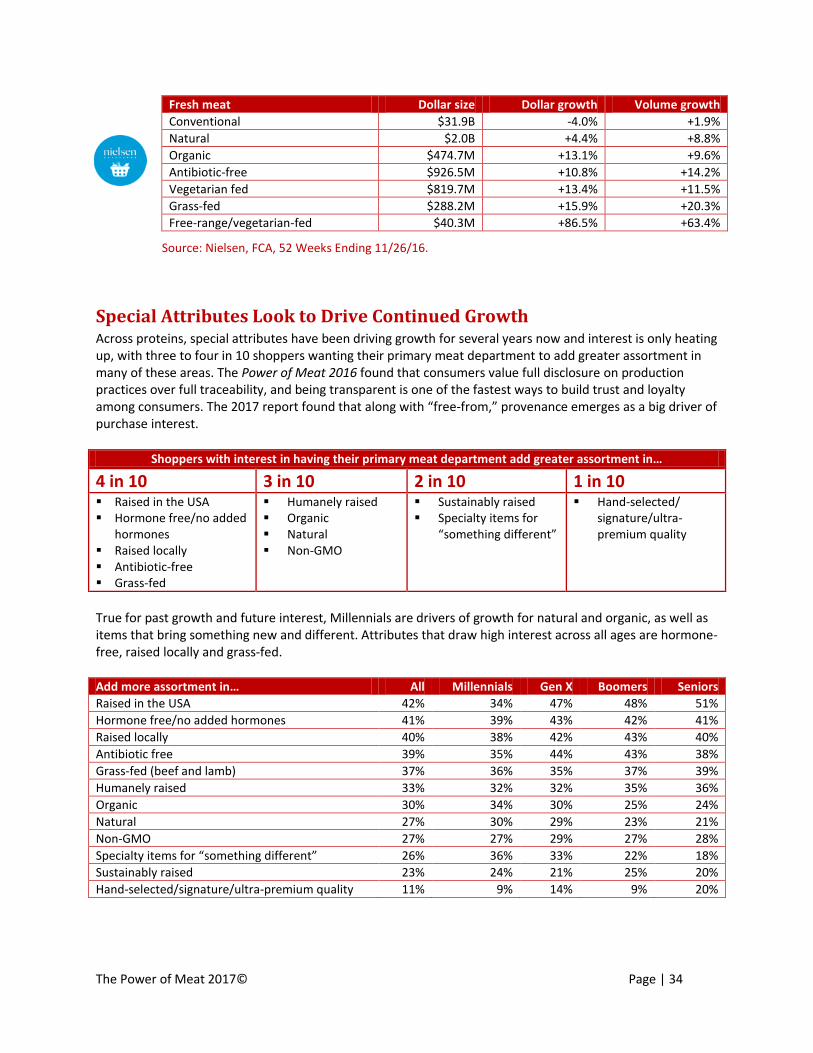
The Power of Meat 2017© Page | 34
Fresh meat Dollar size Dollar growth Volume growth
Conventional $31.9B -4.0% +1.9%
Natural $2.0B +4.4% +8.8%
Organic $474.7M +13.1% +9.6%
Antibiotic-free $926.5M +10.8% +14.2%
Vegetarian fed $819.7M +13.4% +11.5%
Grass-fed $288.2M +15.9% +20.3%
Free-range/vegetarian-fed $40.3M +86.5% +63.4%
Source: Nielsen, FCA, 52 Weeks Ending 11/26/16.
Special Attributes Look to Drive Continued Growth Across proteins, special attributes have been driving growth for several years now and interest is only heating up, with three to four in 10 shoppers wanting their primary meat department to add greater assortment in many of these areas. The Power of Meat 2016 found that consumers value full disclosure on production practices over full traceability, and being transparent is one of the fastest ways to build trust and loyalty among consumers. The 2017 report found that along with “free-from,” provenance emerges as a big driver of purchase interest.
Shoppers with interest in having their primary meat department add greater assortment in…
4 in 10 3 in 10 2 in 10 1 in 10 Raised in the USA Hormone free/no added
hormones Raised locally Antibiotic-free Grass-fed
Humanely raised Organic Natural Non-GMO
Sustainably raised Specialty items for
“something different”
Hand-selected/ signature/ultra-premium quality
True for past growth and future interest, Millennials are drivers of growth for natural and organic, as well as items that bring something new and different. Attributes that draw high interest across all ages are hormone-free, raised locally and grass-fed. Add more assortment in… All Millennials Gen X Boomers Seniors
Raised in the USA 42% 34% 47% 48% 51%
Hormone free/no added hormones 41% 39% 43% 42% 41%
Raised locally 40% 38% 42% 43% 40%
Antibiotic free 39% 35% 44% 43% 38%
Grass-fed (beef and lamb) 37% 36% 35% 37% 39%
Humanely raised 33% 32% 32% 35% 36%
Organic 30% 34% 30% 25% 24%
Natural 27% 30% 29% 23% 21%
Non-GMO 27% 27% 29% 27% 28%
Specialty items for “something different” 26% 36% 33% 22% 18%
Sustainably raised 23% 24% 21% 25% 20%
Hand-selected/signature/ultra-premium quality 11% 9% 14% 9% 20%
The Power of Meat 2017© Page | 35
Other items shoppers would like to see added include: Dry-aged beef. Kobe or waygu. Certified Hereford beef. Bison.
Different types of meat, like fowl, pheasant or venison.
Free range. USDA Prime.
In addition to age, cited interest shows other demographic patterns as well. Current organic purchasers tend
to have above-average interest in all specialty attributes from origin to grass-fed. Introducing organic buyers to some of these other claims if organic is not available may prove to be a successful tactic for higher-income, transparency-focused shoppers.
Raised in the USA claim Shoppers in the Midwest Current organic buyers Boomers and seniors Club shoppers Mid-high income
Hormone free/no added hormones Current organic buyers Women Generation X Households with children,
particularly ages 0-6 Mid-high income Supermarket shoppers
Grass-fed Current organic buyers High-income Specialty/organic stores,
supermarket and club stores Households of 3-4 people,
particularly older kids Slightly higher for Boomers
and seniors
Raised locally Current organic buyers The Pacific and mountain
regions Households with children Specialty/organic store and
supermarket shoppers Mid-high income
Antibiotic-free (ABF) Current organic buyers Households with children,
especially ages 0-6 Generation X Women Larger households Supermarket shoppers Mid-high income
Specialty items/new and different items Like buying from
smaller/specialty producers Supermarket channel Millennials Singles and dual households Mid and higher income Urban and suburban
Value-Added Meat and Poultry Poised for Growth Tagged as a successful area of growth by retailers, value-added meat is a popular choice among some shopper groups, while it remains a no-go for others. The core user group drove big volume gains, but price and perception stand in the way of wider adoption. As such, it continues to be an offering that will work well in stores catering to higher-income and other convenience-seeking shoppers, but will struggle in others. The survey defined value-added meat as items that are pre-marinated, pre-cut or pre-seasoned, such as kabobs, meatloaf, meat balls or pre-marinated chicken wings. Compared with 2016, the share of shoppers who purchase value-added meat and poultry with regularity dropped somewhat. The combined value for “sometimes” and “frequently” dropped from 41 percent in 2016 to 35 percent in 2017.
Purchase value-added meat and poultry 2015 2016 2017
Frequently 23% 9% 28%
6%
Sometimes 29%
Others indicated they only purchase these items under certain conditions, including when in a time crunch (8 percent); for special occasions (9 percent) or thought their store does not carry any value-added meats, at 3 percent.
41% 35%
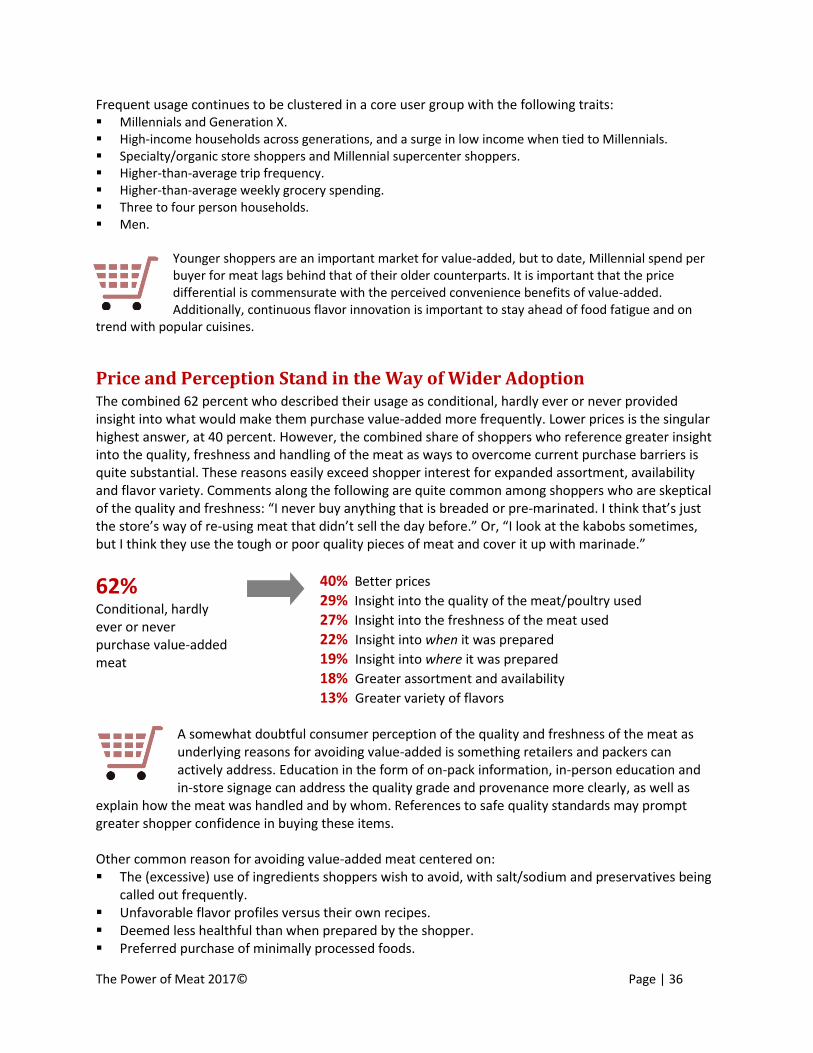
The Power of Meat 2017© Page | 36
Frequent usage continues to be clustered in a core user group with the following traits: Millennials and Generation X. High-income households across generations, and a surge in low income when tied to Millennials. Specialty/organic store shoppers and Millennial supercenter shoppers. Higher-than-average trip frequency. Higher-than-average weekly grocery spending. Three to four person households. Men.
Younger shoppers are an important market for value-added, but to date, Millennial spend per buyer for meat lags behind that of their older counterparts. It is important that the price differential is commensurate with the perceived convenience benefits of value-added. Additionally, continuous flavor innovation is important to stay ahead of food fatigue and on
trend with popular cuisines.
Price and Perception Stand in the Way of Wider Adoption The combined 62 percent who described their usage as conditional, hardly ever or never provided insight into what would make them purchase value-added more frequently. Lower prices is the singular highest answer, at 40 percent. However, the combined share of shoppers who reference greater insight into the quality, freshness and handling of the meat as ways to overcome current purchase barriers is quite substantial. These reasons easily exceed shopper interest for expanded assortment, availability and flavor variety. Comments along the following are quite common among shoppers who are skeptical of the quality and freshness: “I never buy anything that is breaded or pre-marinated. I think that’s just the store’s way of re-using meat that didn’t sell the day before.” Or, “I look at the kabobs sometimes, but I think they use the tough or poor quality pieces of meat and cover it up with marinade.”
62% Conditional, hardly ever or never purchase value-added meat
40% Better prices
29% Insight into the quality of the meat/poultry used
27% Insight into the freshness of the meat used
22% Insight into when it was prepared
19% Insight into where it was prepared
18% Greater assortment and availability
13% Greater variety of flavors
A somewhat doubtful consumer perception of the quality and freshness of the meat as underlying reasons for avoiding value-added is something retailers and packers can actively address. Education in the form of on-pack information, in-person education and in-store signage can address the quality grade and provenance more clearly, as well as
explain how the meat was handled and by whom. References to safe quality standards may prompt greater shopper confidence in buying these items. Other common reason for avoiding value-added meat centered on: The (excessive) use of ingredients shoppers wish to avoid, with salt/sodium and preservatives being
called out frequently. Unfavorable flavor profiles versus their own recipes. Deemed less healthful than when prepared by the shopper. Preferred purchase of minimally processed foods.

The Power of Meat 2017© Page | 37
Price Differential Substantial but Declining for Most Proteins Along with mixed success among shoppers, sales results too saw mixed results. Overall, volume did well with robust contributions by beef, chicken and pork. Dollars did not fare as well, with deflation driving down dollar gains for beef and straight sales declines for turkey, lamb and veal. Despite improvements for chicken and pork, the total value-added category lost slightly in dollars, at -0.3 percent.
Value-added meat
Dollar sales
$ % change
Volume Sales (lbs)
Vol % change
Avg price/ pound
Total $4.3B -0.3% 1.0B +3.8% -4.0%
Beef $2.2B -1.8% 430.5M +4.5% -6.1%
Chicken $852.0M +2.8% 234.1M +3.9% -1.0%
Pork $879.6M +1.1% 246.4 +4.1% -2.9%
Turkey $308.2M -0.9% 88.2M 0.0% -2.0%
Lamb $16.5M -3.1% 3.6M -4.6% +1.6%
Veal $8.8M -6.9% 1.4M -12.6% +6.6%
Source: IRI, MULO, 52 Weeks Ending 11/26/16.
Shoppers called out the price differential as the most common reason for not purchasing more value-added meat and poultry. The difference in the average price per pound for the total segment versus value-added can indeed be quite substantial — though it is important to keep in mind this involves a different lineup of cuts and is not a straight comparison. Additionally, as seen in the table above, prices did drop between 1 percent and 6 percent for the biggest value-added proteins of beef, chicken, pork and turkey.
Price differential of value-added meat versus total meat
Average price/pound total
Average price/pound value added
Difference
Total $3.26 $4.25 +30.4%
Beef $4.86 $5.15 +6.0%
Chicken $2.33 $3.64 +56.2%
Pork $2.73 $3.57 +30.8%
Turkey $2.14 $3.49 +63.1%
Lamb $4.53 $6.91 +52.5%
Source: IRI, MULO, 52 Weeks Ending 11/26/16.
Value-added meat and poultry addresses several trends that are driving growth in perimeter and center-store categories, including fun and different flavor profiles; the growing popularity of international cuisines such as pre-marinated fajita meat; and the overarching important of convenience. Yet, value-added meat has not seen the kind of gains that value-added produce
has locked in. While cost differentials are similar, the levels of doubt over quality and freshness are somewhat unique to the meat category. Value-added can be a real win in stores with shoppers emphasizing convenience, but still has some barriers to overcome in others.
Retailers Are Rapidly Moving to Special Attributes Survey results among 55 food retailers show mostly successful implementation of many of these programs, with a majority reporting being somewhat or greatly successful in moving shoppers to premium, value-added or special attribute programs. Antibiotic-free has the greatest success ratings, while locally-sourced is both the lowest implemented and the lowest rated.
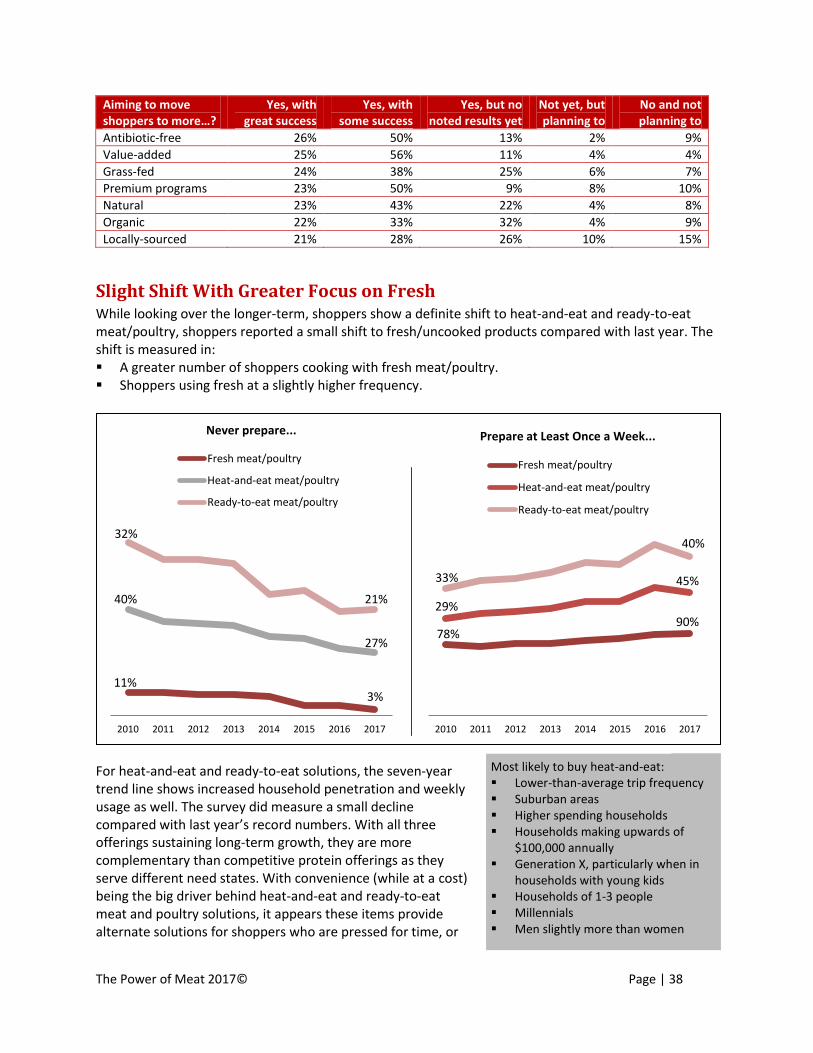
The Power of Meat 2017© Page | 38
Most likely to buy heat-and-eat: Lower-than-average trip frequency Suburban areas Higher spending households Households making upwards of
$100,000 annually Generation X, particularly when in
households with young kids Households of 1-3 people Millennials Men slightly more than women
Aiming to move shoppers to more…?
Yes, with great success
Yes, with some success
Yes, but no noted results yet
Not yet, but planning to
No and not planning to
Antibiotic-free 26% 50% 13% 2% 9%
Value-added 25% 56% 11% 4% 4%
Grass-fed 24% 38% 25% 6% 7%
Premium programs 23% 50% 9% 8% 10%
Natural 23% 43% 22% 4% 8%
Organic 22% 33% 32% 4% 9%
Locally-sourced 21% 28% 26% 10% 15%
Slight Shift With Greater Focus on Fresh While looking over the longer-term, shoppers show a definite shift to heat-and-eat and ready-to-eat meat/poultry, shoppers reported a small shift to fresh/uncooked products compared with last year. The shift is measured in: A greater number of shoppers cooking with fresh meat/poultry. Shoppers using fresh at a slightly higher frequency.
For heat-and-eat and ready-to-eat solutions, the seven-year trend line shows increased household penetration and weekly usage as well. The survey did measure a small decline compared with last year’s record numbers. With all three offerings sustaining long-term growth, they are more complementary than competitive protein offerings as they serve different need states. With convenience (while at a cost) being the big driver behind heat-and-eat and ready-to-eat meat and poultry solutions, it appears these items provide alternate solutions for shoppers who are pressed for time, or
11% 3%
40%
27%
32%
21%
2010 2011 2012 2013 2014 2015 2016 2017
Never prepare...
Fresh meat/poultry
Heat-and-eat meat/poultry
Ready-to-eat meat/poultry
78% 90%
29%
45% 33%
40%
2010 2011 2012 2013 2014 2015 2016 2017
Prepare at Least Once a Week...
Fresh meat/poultry
Heat-and-eat meat/poultry
Ready-to-eat meat/poultry
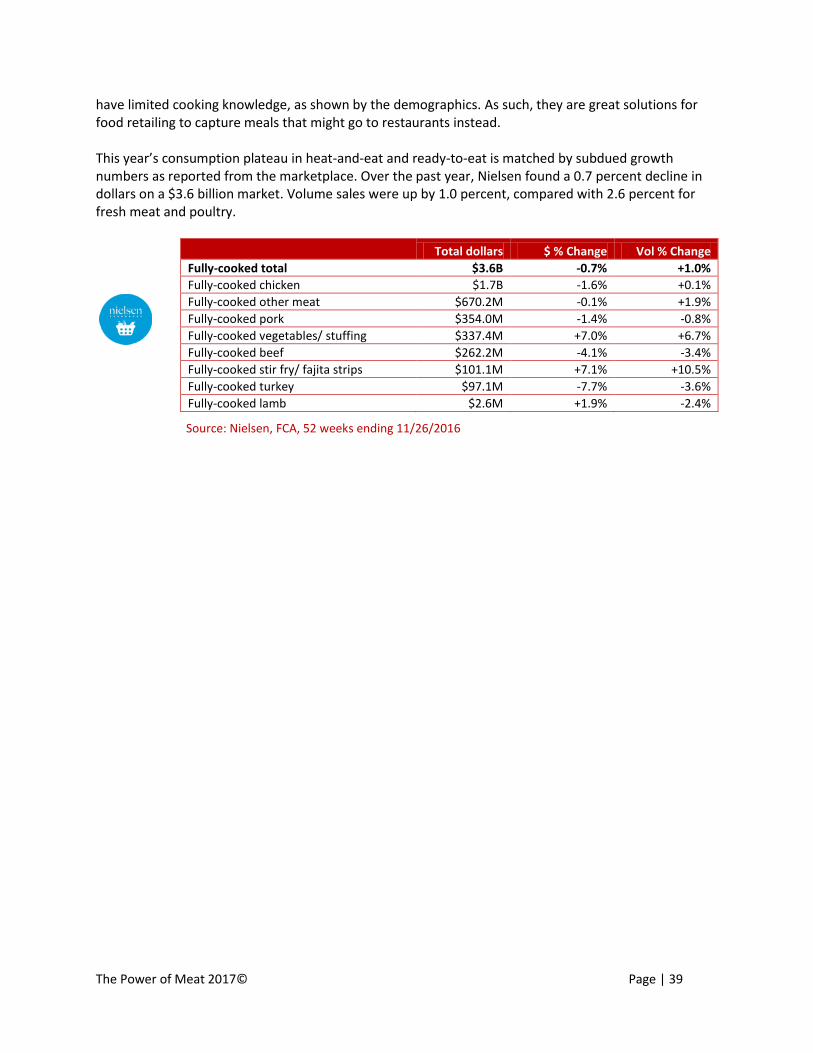
The Power of Meat 2017© Page | 39
have limited cooking knowledge, as shown by the demographics. As such, they are great solutions for food retailing to capture meals that might go to restaurants instead. This year’s consumption plateau in heat-and-eat and ready-to-eat is matched by subdued growth numbers as reported from the marketplace. Over the past year, Nielsen found a 0.7 percent decline in dollars on a $3.6 billion market. Volume sales were up by 1.0 percent, compared with 2.6 percent for fresh meat and poultry.
Total dollars $ % Change Vol % Change
Fully-cooked total $3.6B -0.7% +1.0%
Fully-cooked chicken $1.7B -1.6% +0.1%
Fully-cooked other meat $670.2M -0.1% +1.9%
Fully-cooked pork $354.0M -1.4% -0.8%
Fully-cooked vegetables/ stuffing $337.4M +7.0% +6.7%
Fully-cooked beef $262.2M -4.1% -3.4%
Fully-cooked stir fry/ fajita strips $101.1M +7.1% +10.5%
Fully-cooked turkey $97.1M -7.7% -3.6%
Fully-cooked lamb $2.6M +1.9% -2.4%
Source: Nielsen, FCA, 52 weeks ending 11/26/2016

The Power of Meat 2017© Page | 40
Core organic shoppers: Higher-income of
$100K and above Millennials and
Generation X Shoppers who spend
and shop more than average
Families with children especially young kids
College educated Working full time Supermarket and/or
specialty store shoppers
Higher propensity for farmers’ markets and online purchases
Natural and Organic Meat/Poultry
Chapter Insights For the first time in 12 years, shoppers who have bought natural/organic (48 percent) exceed those who
have not, at 41 percent. Just 10 years ago, that gap was 50 percentage points. Sales show robust volume growth for both natural and organic, but due to deflation, a mild dollar loss for
natural, versus 18.5 percent dollar gains in organic meat and poultry. Seventy-eight percent of current shoppers anticipate keeping purchases level, with 19 percent foreseeing increases.
With growing household penetration comes a change in shopper behavior. On the one hand, the natural/organic market caters to core/dedicated shoppers who are relatively price immune, while on the other there are peripheral/occasional shoppers who drive the natural segment and are price sensitive.
Price is also the greatest barrier to entry among non-buyers, with differentials of up to +98 percent for natural and +176 percent for organic. Other reasons are doubt over any added benefits, lack of availability or no perceived differences in taste.
Supermarkets are the largest channel for the natural/organic purchase, but channel shifting behavior shows the category can serve as an important point of differentiation, particularly for the specialty and alternative channels — driving a significant number of secondary trips.
The top reason for buying natural and organic continues to be “free from” substances shoppers want to avoid followed by perceived better treatment of the animals the meat came from. Lesser environmental impact rose compared with the early years of the study, driven by strong Millennial influence.
Continued Household Gains for Natural and Organic Meat/Poultry Household penetration for combined natural and organic meat and poultry is on a seven-year growth path. Using a three-month purchasing window to measure household penetration, 49 percent of shoppers have purchased natural/organic meat. This means for the first time, more shoppers recall having purchased natural/organic than not. Just 10 years ago, the gap between have and have not purchased natural/organic meat was 50 percentage points.
20% 19% 18% 18% 20% 24% 26%
34% 39%
42%
48%
68% 69% 67% 69% 68% 65%
61% 54%
49% 46%
41%
12% 12% 15% 13% 12% 12% 13% 12% 12% 12% 11%
2007 2008 2009 2010 2011 2012 2013 2014 2015 2016 2017
Organic/natural purchases in the past 3 months
Purchased Did Not Purchase Don't Know if Purchased
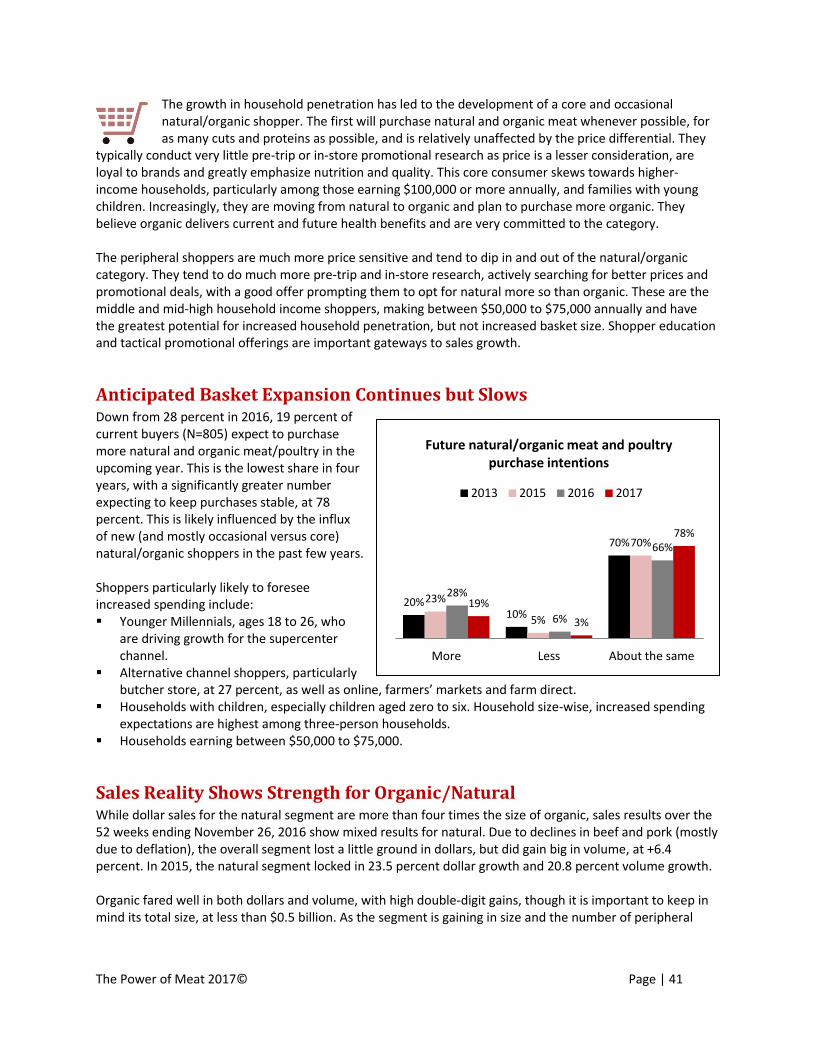
The Power of Meat 2017© Page | 41
20% 10%
70%
23%
5%
70%
28%
6%
66%
19%
3%
78%
More Less About the same
Future natural/organic meat and poultry purchase intentions
2013 2015 2016 2017
The growth in household penetration has led to the development of a core and occasional natural/organic shopper. The first will purchase natural and organic meat whenever possible, for as many cuts and proteins as possible, and is relatively unaffected by the price differential. They
typically conduct very little pre-trip or in-store promotional research as price is a lesser consideration, are loyal to brands and greatly emphasize nutrition and quality. This core consumer skews towards higher-income households, particularly among those earning $100,000 or more annually, and families with young children. Increasingly, they are moving from natural to organic and plan to purchase more organic. They believe organic delivers current and future health benefits and are very committed to the category. The peripheral shoppers are much more price sensitive and tend to dip in and out of the natural/organic category. They tend to do much more pre-trip and in-store research, actively searching for better prices and promotional deals, with a good offer prompting them to opt for natural more so than organic. These are the middle and mid-high household income shoppers, making between $50,000 to $75,000 annually and have the greatest potential for increased household penetration, but not increased basket size. Shopper education and tactical promotional offerings are important gateways to sales growth.
Anticipated Basket Expansion Continues but Slows Down from 28 percent in 2016, 19 percent of current buyers (N=805) expect to purchase more natural and organic meat/poultry in the upcoming year. This is the lowest share in four years, with a significantly greater number expecting to keep purchases stable, at 78 percent. This is likely influenced by the influx of new (and mostly occasional versus core) natural/organic shoppers in the past few years. Shoppers particularly likely to foresee increased spending include: Younger Millennials, ages 18 to 26, who
are driving growth for the supercenter channel.
Alternative channel shoppers, particularly butcher store, at 27 percent, as well as online, farmers’ markets and farm direct.
Households with children, especially children aged zero to six. Household size-wise, increased spending expectations are highest among three-person households.
Households earning between $50,000 to $75,000.
Sales Reality Shows Strength for Organic/Natural While dollar sales for the natural segment are more than four times the size of organic, sales results over the 52 weeks ending November 26, 2016 show mixed results for natural. Due to declines in beef and pork (mostly due to deflation), the overall segment lost a little ground in dollars, but did gain big in volume, at +6.4 percent. In 2015, the natural segment locked in 23.5 percent dollar growth and 20.8 percent volume growth. Organic fared well in both dollars and volume, with high double-digit gains, though it is important to keep in mind its total size, at less than $0.5 billion. As the segment is gaining in size and the number of peripheral
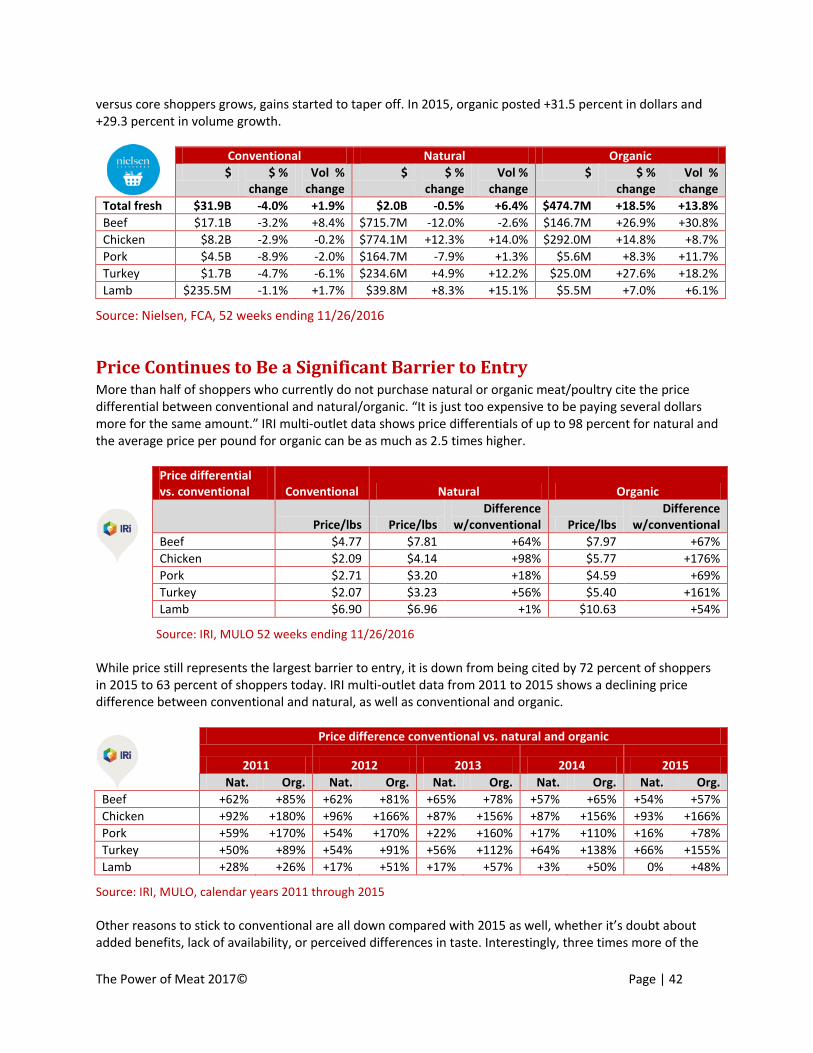
The Power of Meat 2017© Page | 42
versus core shoppers grows, gains started to taper off. In 2015, organic posted +31.5 percent in dollars and +29.3 percent in volume growth.
Conventional Natural Organic
$ $ % change
Vol % change
$ $ % change
Vol % change
$ $ % change
Vol % change
Total fresh $31.9B -4.0% +1.9% $2.0B -0.5% +6.4% $474.7M +18.5% +13.8%
Beef $17.1B -3.2% +8.4% $715.7M -12.0% -2.6% $146.7M +26.9% +30.8%
Chicken $8.2B -2.9% -0.2% $774.1M +12.3% +14.0% $292.0M +14.8% +8.7%
Pork $4.5B -8.9% -2.0% $164.7M -7.9% +1.3% $5.6M +8.3% +11.7%
Turkey $1.7B -4.7% -6.1% $234.6M +4.9% +12.2% $25.0M +27.6% +18.2%
Lamb $235.5M -1.1% +1.7% $39.8M +8.3% +15.1% $5.5M +7.0% +6.1%
Source: Nielsen, FCA, 52 weeks ending 11/26/2016
Price Continues to Be a Significant Barrier to Entry More than half of shoppers who currently do not purchase natural or organic meat/poultry cite the price differential between conventional and natural/organic. “It is just too expensive to be paying several dollars more for the same amount.” IRI multi-outlet data shows price differentials of up to 98 percent for natural and the average price per pound for organic can be as much as 2.5 times higher.
Price differential vs. conventional Conventional Natural Organic
Price/lbs Price/lbs
Difference w/conventional Price/lbs
Difference w/conventional
Beef $4.77 $7.81 +64% $7.97 +67%
Chicken $2.09 $4.14 +98% $5.77 +176%
Pork $2.71 $3.20 +18% $4.59 +69%
Turkey $2.07 $3.23 +56% $5.40 +161%
Lamb $6.90 $6.96 +1% $10.63 +54%
Source: IRI, MULO 52 weeks ending 11/26/2016
While price still represents the largest barrier to entry, it is down from being cited by 72 percent of shoppers in 2015 to 63 percent of shoppers today. IRI multi-outlet data from 2011 to 2015 shows a declining price difference between conventional and natural, as well as conventional and organic.
Price difference conventional vs. natural and organic
2011 2012 2013 2014 2015
Nat. Org. Nat. Org. Nat. Org. Nat. Org. Nat. Org.
Beef +62% +85% +62% +81% +65% +78% +57% +65% +54% +57%
Chicken +92% +180% +96% +166% +87% +156% +87% +156% +93% +166%
Pork +59% +170% +54% +170% +22% +160% +17% +110% +16% +78%
Turkey +50% +89% +54% +91% +56% +112% +64% +138% +66% +155%
Lamb +28% +26% +17% +51% +17% +57% +3% +50% 0% +48%
Source: IRI, MULO, calendar years 2011 through 2015
Other reasons to stick to conventional are all down compared with 2015 as well, whether it’s doubt about added benefits, lack of availability, or perceived differences in taste. Interestingly, three times more of the
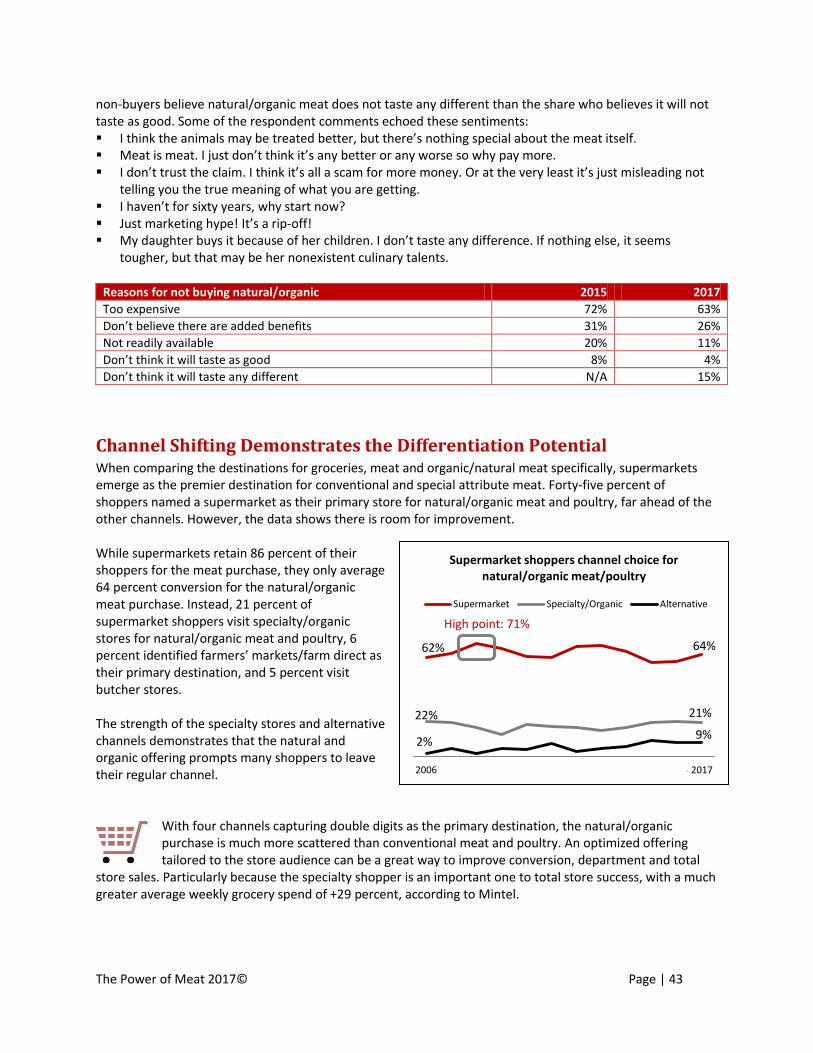
The Power of Meat 2017© Page | 43
non-buyers believe natural/organic meat does not taste any different than the share who believes it will not taste as good. Some of the respondent comments echoed these sentiments: I think the animals may be treated better, but there’s nothing special about the meat itself. Meat is meat. I just don’t think it’s any better or any worse so why pay more. I don’t trust the claim. I think it’s all a scam for more money. Or at the very least it’s just misleading not
telling you the true meaning of what you are getting. I haven’t for sixty years, why start now? Just marketing hype! It’s a rip-off! My daughter buys it because of her children. I don’t taste any difference. If nothing else, it seems
tougher, but that may be her nonexistent culinary talents.
Reasons for not buying natural/organic 2015 2017
Too expensive 72% 63%
Don’t believe there are added benefits 31% 26%
Not readily available 20% 11%
Don’t think it will taste as good 8% 4%
Don’t think it will taste any different N/A 15%
Channel Shifting Demonstrates the Differentiation Potential When comparing the destinations for groceries, meat and organic/natural meat specifically, supermarkets emerge as the premier destination for conventional and special attribute meat. Forty-five percent of shoppers named a supermarket as their primary store for natural/organic meat and poultry, far ahead of the other channels. However, the data shows there is room for improvement. While supermarkets retain 86 percent of their shoppers for the meat purchase, they only average 64 percent conversion for the natural/organic meat purchase. Instead, 21 percent of supermarket shoppers visit specialty/organic stores for natural/organic meat and poultry, 6 percent identified farmers’ markets/farm direct as their primary destination, and 5 percent visit butcher stores. The strength of the specialty stores and alternative channels demonstrates that the natural and organic offering prompts many shoppers to leave their regular channel.
With four channels capturing double digits as the primary destination, the natural/organic purchase is much more scattered than conventional meat and poultry. An optimized offering tailored to the store audience can be a great way to improve conversion, department and total
store sales. Particularly because the specialty shopper is an important one to total store success, with a much greater average weekly grocery spend of +29 percent, according to Mintel.
62% 64%
22% 21%
2% 9%
2006 2007 2008 2009 2010 2011 2012 2013 2014 2015 2016 2017
Supermarket shoppers channel choice for natural/organic meat/poultry
Supermarket Specialty/Organic Alternative
High point: 71%
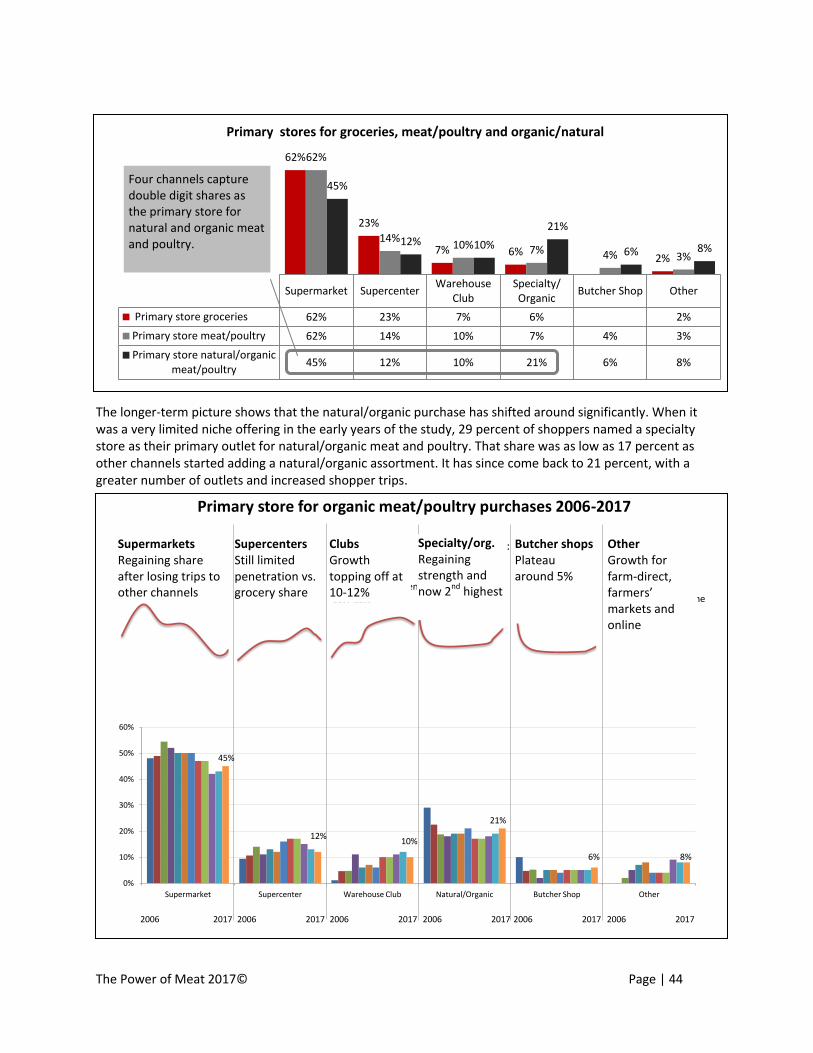
The Power of Meat 2017© Page | 44
The longer-term picture shows that the natural/organic purchase has shifted around significantly. When it was a very limited niche offering in the early years of the study, 29 percent of shoppers named a specialty store as their primary outlet for natural/organic meat and poultry. That share was as low as 17 percent as other channels started adding a natural/organic assortment. It has since come back to 21 percent, with a greater number of outlets and increased shopper trips.
Supermarket Supercenter Warehouse
Club Specialty/ Organic
Butcher Shop Other
Primary store groceries 62% 23% 7% 6% 2%
Primary store meat/poultry 62% 14% 10% 7% 4% 3%
Primary store natural/organic meat/poultry
45% 12% 10% 21% 6% 8%
62%
23%
7% 6% 2%
62%
14% 10% 7% 4% 3%
45%
12% 10%
21%
6% 8%
Primary stores for groceries, meat/poultry and organic/natural
0%
10%
20%
30%
40%
50%
60%
Supermarket Supercenter Warehouse Club Natural/Organic Butcher Shop Other
Regaining share afterloosing trips to otherchannels
Continued limitedpenetration in natural/organic vs.total grocery share
Sustained growthtopping off between10%-12%
Regaining strengthto second-highest outlet
Plateau around 5%
Supermarkets Supercenters Clubs Specialty/Organic Butcher shops
Primary store for organic meat/poultry purchases 2006-2017
45%
2006 2017
12%10%
21%
6% 8%
2006 2017 2006 2017 2006 2017 2006 2017 2006 2017
Other
Strong growth for farmers’ markets,farm direct and online
Four channels capture double digit shares as the primary store for natural and organic meat and poultry.
Supermarkets Regaining share after losing trips to other channels
Supercenters Still limited penetration vs. grocery share
Clubs Growth topping off at 10-12%
Specialty/org. Regaining strength and now 2
nd highest
Butcher shops Plateau around 5%
Other Growth for farm-direct, farmers’ markets and online
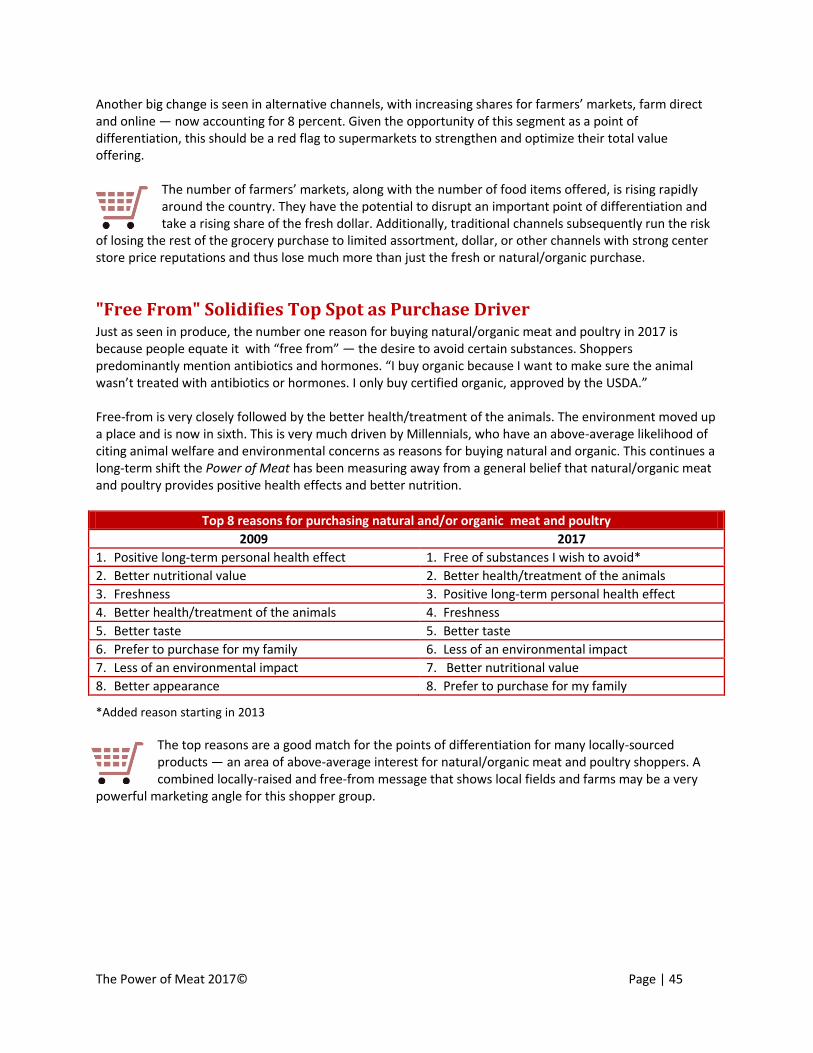
The Power of Meat 2017© Page | 45
Another big change is seen in alternative channels, with increasing shares for farmers’ markets, farm direct and online — now accounting for 8 percent. Given the opportunity of this segment as a point of differentiation, this should be a red flag to supermarkets to strengthen and optimize their total value offering.
The number of farmers’ markets, along with the number of food items offered, is rising rapidly around the country. They have the potential to disrupt an important point of differentiation and take a rising share of the fresh dollar. Additionally, traditional channels subsequently run the risk
of losing the rest of the grocery purchase to limited assortment, dollar, or other channels with strong center store price reputations and thus lose much more than just the fresh or natural/organic purchase.
"Free From" Solidifies Top Spot as Purchase Driver Just as seen in produce, the number one reason for buying natural/organic meat and poultry in 2017 is because people equate it with “free from” — the desire to avoid certain substances. Shoppers predominantly mention antibiotics and hormones. “I buy organic because I want to make sure the animal wasn’t treated with antibiotics or hormones. I only buy certified organic, approved by the USDA.” Free-from is very closely followed by the better health/treatment of the animals. The environment moved up a place and is now in sixth. This is very much driven by Millennials, who have an above-average likelihood of citing animal welfare and environmental concerns as reasons for buying natural and organic. This continues a long-term shift the Power of Meat has been measuring away from a general belief that natural/organic meat and poultry provides positive health effects and better nutrition.
Top 8 reasons for purchasing natural and/or organic meat and poultry
2009 2017
1. Positive long-term personal health effect 1. Free of substances I wish to avoid*
2. Better nutritional value 2. Better health/treatment of the animals
3. Freshness 3. Positive long-term personal health effect
4. Better health/treatment of the animals 4. Freshness
5. Better taste 5. Better taste
6. Prefer to purchase for my family 6. Less of an environmental impact
7. Less of an environmental impact 7. Better nutritional value
8. Better appearance 8. Prefer to purchase for my family
*Added reason starting in 2013
The top reasons are a good match for the points of differentiation for many locally-sourced products — an area of above-average interest for natural/organic meat and poultry shoppers. A combined locally-raised and free-from message that shows local fields and farms may be a very
powerful marketing angle for this shopper group.
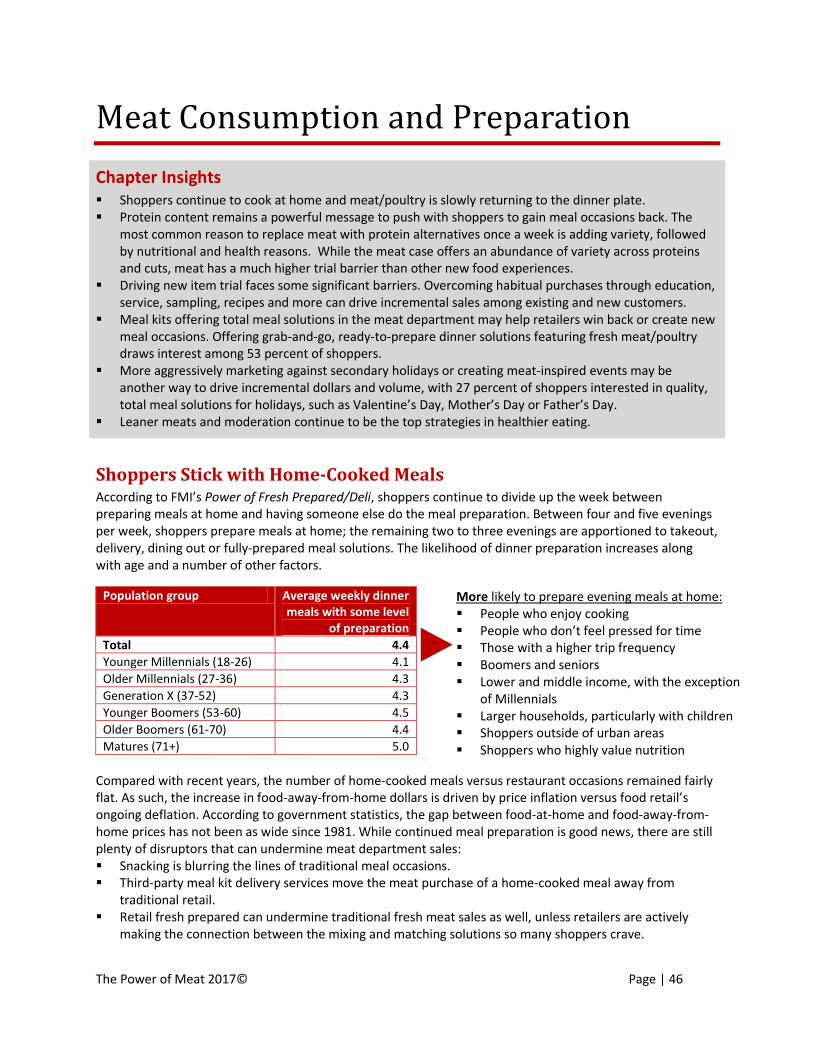
The Power of Meat 2017© Page | 46
Meat Consumption and Preparation
Chapter Insights
Shoppers continue to cook at home and meat/poultry is slowly returning to the dinner plate. Protein content remains a powerful message to push with shoppers to gain meal occasions back. The
most common reason to replace meat with protein alternatives once a week is adding variety, followed by nutritional and health reasons. While the meat case offers an abundance of variety across proteins and cuts, meat has a much higher trial barrier than other new food experiences.
Driving new item trial faces some significant barriers. Overcoming habitual purchases through education, service, sampling, recipes and more can drive incremental sales among existing and new customers.
Meal kits offering total meal solutions in the meat department may help retailers win back or create new meal occasions. Offering grab-and-go, ready-to-prepare dinner solutions featuring fresh meat/poultry draws interest among 53 percent of shoppers.
More aggressively marketing against secondary holidays or creating meat-inspired events may be another way to drive incremental dollars and volume, with 27 percent of shoppers interested in quality, total meal solutions for holidays, such as Valentine’s Day, Mother’s Day or Father’s Day.
Leaner meats and moderation continue to be the top strategies in healthier eating.
Shoppers Stick with Home-Cooked Meals According to FMI’s Power of Fresh Prepared/Deli, shoppers continue to divide up the week between preparing meals at home and having someone else do the meal preparation. Between four and five evenings per week, shoppers prepare meals at home; the remaining two to three evenings are apportioned to takeout, delivery, dining out or fully-prepared meal solutions. The likelihood of dinner preparation increases along with age and a number of other factors.
Population group Average weekly dinner meals with some level
of preparation
Total 4.4
Younger Millennials (18-26) 4.1
Older Millennials (27-36) 4.3
Generation X (37-52) 4.3
Younger Boomers (53-60) 4.5
Older Boomers (61-70) 4.4
Matures (71+) 5.0
Compared with recent years, the number of home-cooked meals versus restaurant occasions remained fairly flat. As such, the increase in food-away-from-home dollars is driven by price inflation versus food retail’s ongoing deflation. According to government statistics, the gap between food-at-home and food-away-from-home prices has not been as wide since 1981. While continued meal preparation is good news, there are still plenty of disruptors that can undermine meat department sales: Snacking is blurring the lines of traditional meal occasions. Third-party meal kit delivery services move the meat purchase of a home-cooked meal away from
traditional retail. Retail fresh prepared can undermine traditional fresh meat sales as well, unless retailers are actively
making the connection between the mixing and matching solutions so many shoppers crave.
More likely to prepare evening meals at home: People who enjoy cooking People who don’t feel pressed for time Those with a higher trip frequency Boomers and seniors Lower and middle income, with the exception
of Millennials Larger households, particularly with children Shoppers outside of urban areas Shoppers who highly value nutrition
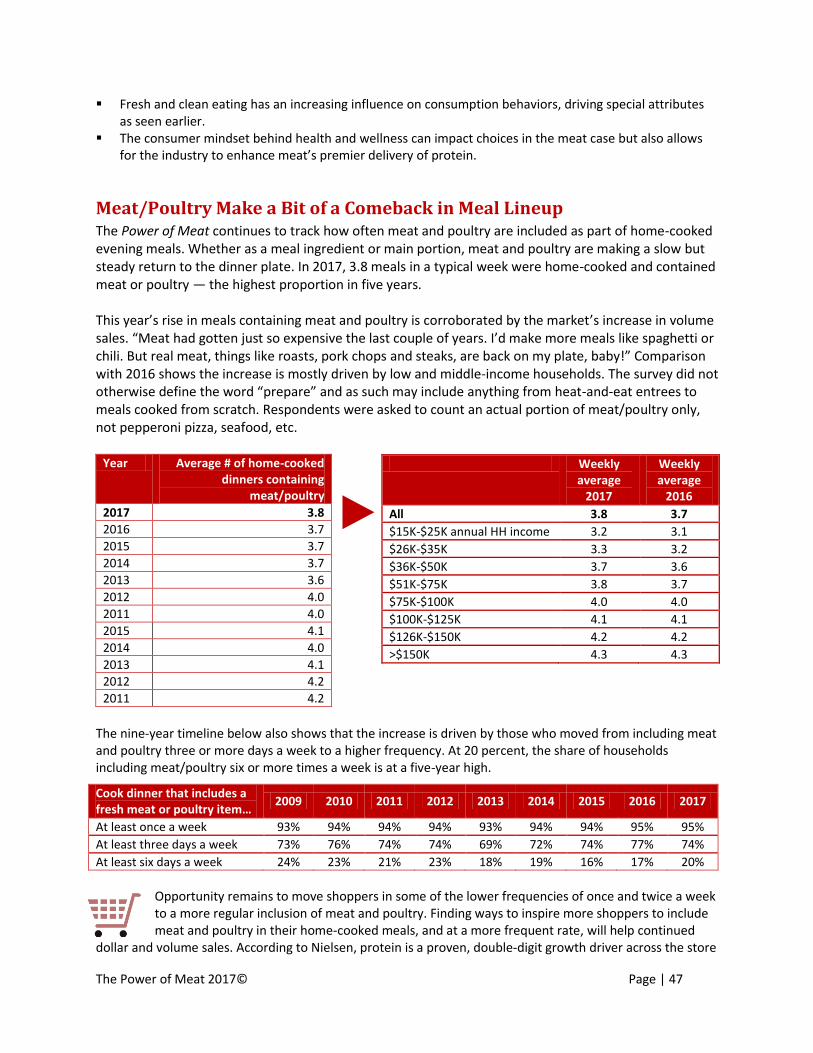
The Power of Meat 2017© Page | 47
Fresh and clean eating has an increasing influence on consumption behaviors, driving special attributes as seen earlier.
The consumer mindset behind health and wellness can impact choices in the meat case but also allows for the industry to enhance meat’s premier delivery of protein.
Meat/Poultry Make a Bit of a Comeback in Meal Lineup The Power of Meat continues to track how often meat and poultry are included as part of home-cooked evening meals. Whether as a meal ingredient or main portion, meat and poultry are making a slow but steady return to the dinner plate. In 2017, 3.8 meals in a typical week were home-cooked and contained meat or poultry — the highest proportion in five years. This year’s rise in meals containing meat and poultry is corroborated by the market’s increase in volume sales. “Meat had gotten just so expensive the last couple of years. I’d make more meals like spaghetti or chili. But real meat, things like roasts, pork chops and steaks, are back on my plate, baby!” Comparison with 2016 shows the increase is mostly driven by low and middle-income households. The survey did not otherwise define the word “prepare” and as such may include anything from heat-and-eat entrees to meals cooked from scratch. Respondents were asked to count an actual portion of meat/poultry only, not pepperoni pizza, seafood, etc.
Year Average # of home-cooked dinners containing
meat/poultry
2017 3.8
2016 3.7
2015 3.7
2014 3.7
2013 3.6
2012 4.0
2011 4.0
2015 4.1
2014 4.0
2013 4.1
2012 4.2
2011 4.2
The nine-year timeline below also shows that the increase is driven by those who moved from including meat and poultry three or more days a week to a higher frequency. At 20 percent, the share of households including meat/poultry six or more times a week is at a five-year high.
Cook dinner that includes a fresh meat or poultry item…
2009 2010 2011 2012 2013 2014 2015 2016 2017
At least once a week 93% 94% 94% 94% 93% 94% 94% 95% 95%
At least three days a week 73% 76% 74% 74% 69% 72% 74% 77% 74%
At least six days a week 24% 23% 21% 23% 18% 19% 16% 17% 20%
Opportunity remains to move shoppers in some of the lower frequencies of once and twice a week to a more regular inclusion of meat and poultry. Finding ways to inspire more shoppers to include meat and poultry in their home-cooked meals, and at a more frequent rate, will help continued
dollar and volume sales. According to Nielsen, protein is a proven, double-digit growth driver across the store
Weekly average
2017
Weekly average
2016
All 3.8 3.7
$15K-$25K annual HH income 3.2 3.1
$26K-$35K 3.3 3.2
$36K-$50K 3.7 3.6
$51K-$75K 3.8 3.7
$75K-$100K 4.0 4.0
$100K-$125K 4.1 4.1
$126K-$150K 4.2 4.2
>$150K 4.3 4.3
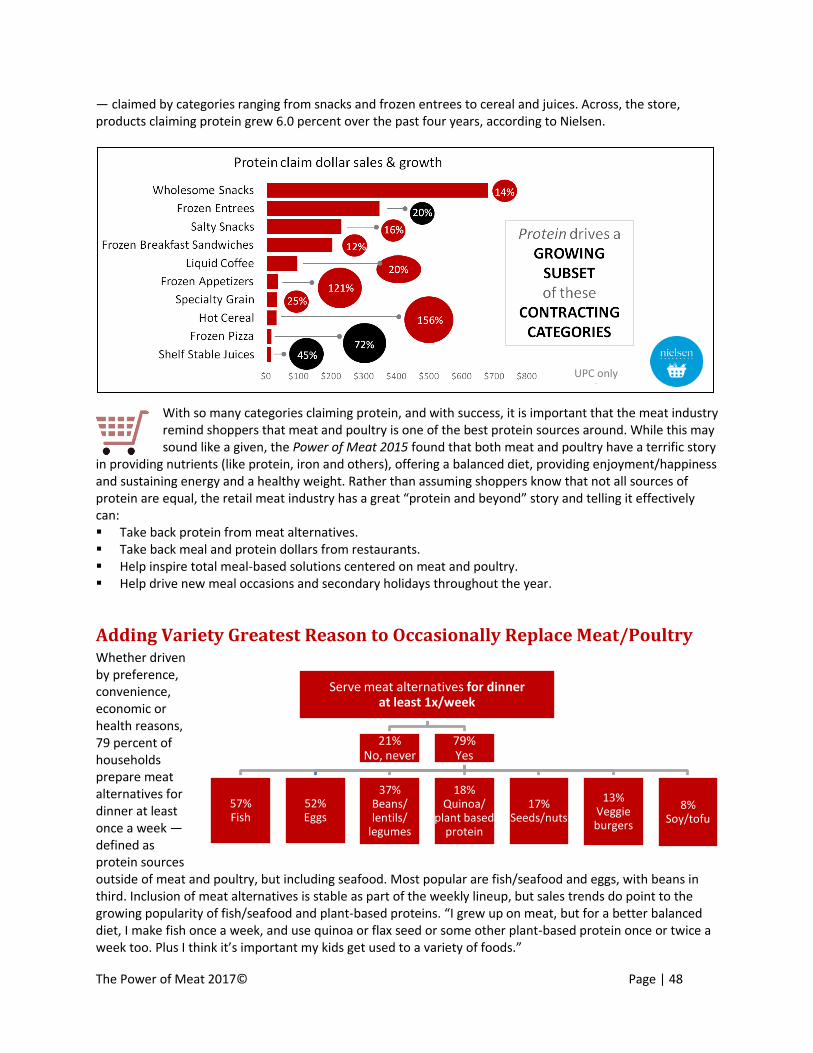
The Power of Meat 2017© Page | 48
Serve meat alternatives for dinner at least 1x/week
21% No, never
79% Yes
57% Fish
52% Eggs
37% Beans/ lentils/
legumes
18% Quinoa/
plant based protein
17% Seeds/nuts
13% Veggie burgers
8% Soy/tofu
— claimed by categories ranging from snacks and frozen entrees to cereal and juices. Across, the store, products claiming protein grew 6.0 percent over the past four years, according to Nielsen.
With so many categories claiming protein, and with success, it is important that the meat industry remind shoppers that meat and poultry is one of the best protein sources around. While this may sound like a given, the Power of Meat 2015 found that both meat and poultry have a terrific story
in providing nutrients (like protein, iron and others), offering a balanced diet, providing enjoyment/happiness and sustaining energy and a healthy weight. Rather than assuming shoppers know that not all sources of protein are equal, the retail meat industry has a great “protein and beyond” story and telling it effectively can: Take back protein from meat alternatives. Take back meal and protein dollars from restaurants. Help inspire total meal-based solutions centered on meat and poultry. Help drive new meal occasions and secondary holidays throughout the year.
Adding Variety Greatest Reason to Occasionally Replace Meat/Poultry Whether driven by preference, convenience, economic or health reasons, 79 percent of households prepare meat alternatives for dinner at least once a week — defined as protein sources outside of meat and poultry, but including seafood. Most popular are fish/seafood and eggs, with beans in third. Inclusion of meat alternatives is stable as part of the weekly lineup, but sales trends do point to the growing popularity of fish/seafood and plant-based proteins. “I grew up on meat, but for a better balanced diet, I make fish once a week, and use quinoa or flax seed or some other plant-based protein once or twice a week too. Plus I think it’s important my kids get used to a variety of foods.”
UPC only products

The Power of Meat 2017© Page | 49
The study finds that many shoppers serve up meat alternatives simply because they prefer to add some variety or something different to the meal lineup. Variety is universally cited as the top reason. Perception as being good from a health or nutrition point of view, however, is a powerful second reason, particularly among older shoppers. The environmental impact of meat was the number one other reason people listed, driven by Millennial respondents. Some of the write-in “other” comments shoppers provided are: For overall balance to assure nutritional goals. Better for my family, better for the world. I dislike factory farming, so only occasionally buy meat when at a farmers’ market. I just don’t like eating a lot of meat. Once or twice a week is plenty. I can get my protein from cheese and peanut butter just as well. Just a lousy cook.
Twenty-three percent of shoppers point to the expense of meat/poultry versus that of alternatives. In that regard, price relief is helping retailers win back protein. “I had started to cook some more meals with beans or eggs as the protein. Say bean or potato and egg tacos instead of
ground beef. But now that ground beef is affordable again, I definitely buy more of it.” Far ahead of affordability, variety and nutrition/health are areas retailers can actively address as well. Variety — Many shoppers stick to the same cuts and kinds of meat and poultry. As such, there is a lot to
be gained to introduce shoppers to new item or proteins. Sell a roast instead of ground beef. Sell lamb for a nice dinner at home instead of having the shopper go out for a steak dinner. Retailers have lots of variety, but they key is to get shoppers to purchase across the entire offering. The next section will address opportunities to address new item introductions and the interest in total meal solutions.
Nutrition and health — Every year, the Power of Meat tracks nutritional attitudes relative to meat and poultry. Among higher-income shoppers, lean cuts and the inclusion of alternative proteins is big. Among lower-income shoppers, portion control is a bigger measure. Education on the nutritional benefits and variety in offerings when managing a balanced diet, or addressing specific dietary needs, can be a great way to put meat/poultry back into play.
Much Higher Trial Barriers to Overcome In Meat/Poultry Driving new item introductions and adoption has traditionally been an important way to grow sales across the store. Additionally, meat and poultry sales gains can be achieved by attracting new shoppers or taking meal occasions from other outlets or proteins. However, barriers to try something different when purchasing meat and poultry look to be much higher than seen for new item trial in other categories and channels. One reason may be shoppers’ high loyalty to their meat department, as expressed by high satisfaction ratings as well as meat being a top three reason to pick a primary store, according to FMI’s U.S. Grocery Shopper Trends. Marginal knowledge may be another. Shoppers’ lack of knowledge and comfort surrounding preparing meat and poultry has been well-documented in prior editions of the Power of Meat. Whether
10%
23%
26%
26%
44%
52%
Dietary needs/disease or health management
Cost/less expensive
Easier to prepare
Own/family member preference
Nutrition/health
Adding variety/just something different
Reasons for serving meat alternatives
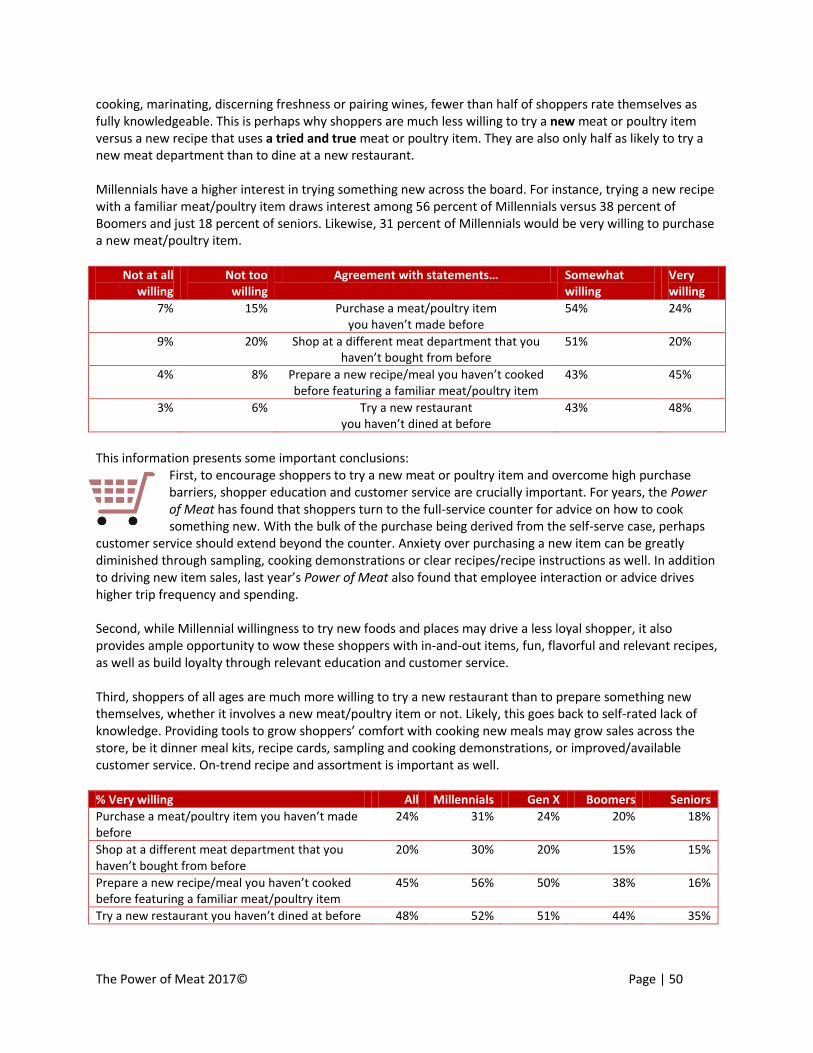
The Power of Meat 2017© Page | 50
cooking, marinating, discerning freshness or pairing wines, fewer than half of shoppers rate themselves as fully knowledgeable. This is perhaps why shoppers are much less willing to try a new meat or poultry item versus a new recipe that uses a tried and true meat or poultry item. They are also only half as likely to try a new meat department than to dine at a new restaurant. Millennials have a higher interest in trying something new across the board. For instance, trying a new recipe with a familiar meat/poultry item draws interest among 56 percent of Millennials versus 38 percent of Boomers and just 18 percent of seniors. Likewise, 31 percent of Millennials would be very willing to purchase a new meat/poultry item.
Not at all willing
Not too willing
Agreement with statements… Somewhat willing
Very willing
7% 15% Purchase a meat/poultry item you haven’t made before
54% 24%
9% 20% Shop at a different meat department that you haven’t bought from before
51% 20%
4% 8% Prepare a new recipe/meal you haven’t cooked before featuring a familiar meat/poultry item
43% 45%
3% 6% Try a new restaurant you haven’t dined at before
43% 48%
This information presents some important conclusions:
First, to encourage shoppers to try a new meat or poultry item and overcome high purchase barriers, shopper education and customer service are crucially important. For years, the Power of Meat has found that shoppers turn to the full-service counter for advice on how to cook something new. With the bulk of the purchase being derived from the self-serve case, perhaps
customer service should extend beyond the counter. Anxiety over purchasing a new item can be greatly diminished through sampling, cooking demonstrations or clear recipes/recipe instructions as well. In addition to driving new item sales, last year’s Power of Meat also found that employee interaction or advice drives higher trip frequency and spending. Second, while Millennial willingness to try new foods and places may drive a less loyal shopper, it also provides ample opportunity to wow these shoppers with in-and-out items, fun, flavorful and relevant recipes, as well as build loyalty through relevant education and customer service. Third, shoppers of all ages are much more willing to try a new restaurant than to prepare something new themselves, whether it involves a new meat/poultry item or not. Likely, this goes back to self-rated lack of knowledge. Providing tools to grow shoppers’ comfort with cooking new meals may grow sales across the store, be it dinner meal kits, recipe cards, sampling and cooking demonstrations, or improved/available customer service. On-trend recipe and assortment is important as well. % Very willing All Millennials Gen X Boomers Seniors
Purchase a meat/poultry item you haven’t made before
24% 31% 24% 20% 18%
Shop at a different meat department that you haven’t bought from before
20% 30% 20% 15% 15%
Prepare a new recipe/meal you haven’t cooked before featuring a familiar meat/poultry item
45% 56% 50% 38% 16%
Try a new restaurant you haven’t dined at before 48% 52% 51% 44% 35%
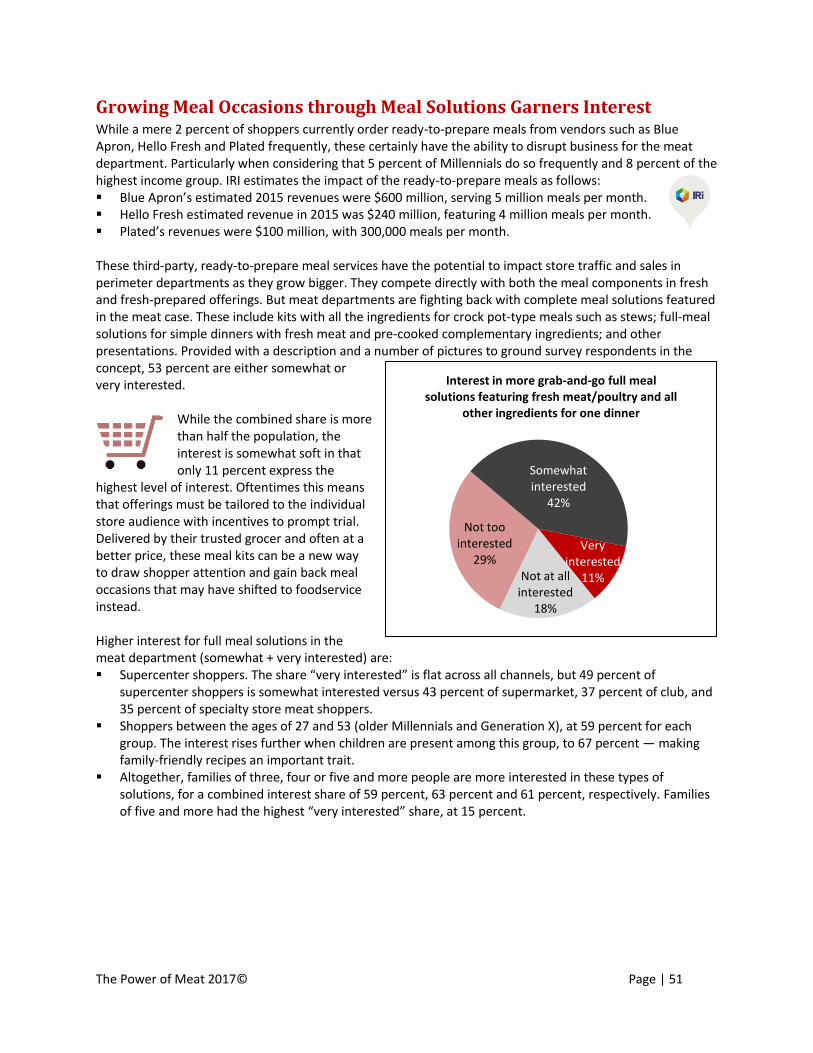
The Power of Meat 2017© Page | 51
Not at all interested
18%
Not too interested
29%
Somewhat interested
42%
Very interested
11%
Interest in more grab-and-go full meal solutions featuring fresh meat/poultry and all
other ingredients for one dinner
Growing Meal Occasions through Meal Solutions Garners Interest While a mere 2 percent of shoppers currently order ready-to-prepare meals from vendors such as Blue Apron, Hello Fresh and Plated frequently, these certainly have the ability to disrupt business for the meat department. Particularly when considering that 5 percent of Millennials do so frequently and 8 percent of the highest income group. IRI estimates the impact of the ready-to-prepare meals as follows: Blue Apron’s estimated 2015 revenues were $600 million, serving 5 million meals per month. Hello Fresh estimated revenue in 2015 was $240 million, featuring 4 million meals per month. Plated’s revenues were $100 million, with 300,000 meals per month. These third-party, ready-to-prepare meal services have the potential to impact store traffic and sales in perimeter departments as they grow bigger. They compete directly with both the meal components in fresh and fresh-prepared offerings. But meat departments are fighting back with complete meal solutions featured in the meat case. These include kits with all the ingredients for crock pot-type meals such as stews; full-meal solutions for simple dinners with fresh meat and pre-cooked complementary ingredients; and other presentations. Provided with a description and a number of pictures to ground survey respondents in the concept, 53 percent are either somewhat or very interested.
While the combined share is more than half the population, the interest is somewhat soft in that only 11 percent express the
highest level of interest. Oftentimes this means that offerings must be tailored to the individual store audience with incentives to prompt trial. Delivered by their trusted grocer and often at a better price, these meal kits can be a new way to draw shopper attention and gain back meal occasions that may have shifted to foodservice instead. Higher interest for full meal solutions in the meat department (somewhat + very interested) are: Supercenter shoppers. The share “very interested” is flat across all channels, but 49 percent of
supercenter shoppers is somewhat interested versus 43 percent of supermarket, 37 percent of club, and 35 percent of specialty store meat shoppers.
Shoppers between the ages of 27 and 53 (older Millennials and Generation X), at 59 percent for each group. The interest rises further when children are present among this group, to 67 percent — making family-friendly recipes an important trait.
Altogether, families of three, four or five and more people are more interested in these types of solutions, for a combined interest share of 59 percent, 63 percent and 61 percent, respectively. Families of five and more had the highest “very interested” share, at 15 percent.

The Power of Meat 2017© Page | 52
Jan Feb Mar Apr May June July August Sep Oct Nov Dec
Can seasonal items drive spikes at other times? Duck Leg of Lamb Whole Turkeys
43%
29% 27%
I typically already tend to celebrate those types of occasions with a home-
cooked meal
I like going out to a restaurant for those
types of occasions and have no interest in such
an offering
I would be interested in quality and easy solutions
for those types of occasions
Restaurant-quality, complete meal solutions for holidays such as Mother's Day, Father's Day and Valentine's Day
Jan Feb Mar Apr May June July August Sep Oct Nov Dec
Can everyday items drive greater spikes throughout the year?
Chuck Fresh Ground Beef Chicken Breasts Chicken Thighs
Growing Meal Occasions Through Secondary Holidays While some cuts and kinds of meat are everyday choices among consumers, others tend to be reserved for special occasions — as shown by the strong seasonality of whole turkey, duck or leg of lamb as examples. According to weekly sales data by Nielsen, each spikes around major holidays, such as Easter, Thanksgiving, Christmas and New Year’s. Others, such as ground beef and chicken wings, spike around holidays like Super Bowl and big barbecue holidays, including the Fourth of July and Labor Day. However, for many of the big and secondary holidays, restaurant sales spike too. The study checked into whether retailers have an opportunity to drive incremental sales during other, smaller holidays, such as Valentine’s Day, Mother’s Day, Father’s Day and others. Study respondents reacted to how a potential offering by their primary meat department featuring restaurant-quality complete meal solutions for these secondary holidays would influence their decision to eat in versus out. In line with holiday tracking by the National Retail Federation, some four in 10 say they typically stay home for these holidays. But more than one-quarter of shoppers say they would be interested in a quality, easy solution to cook at home instead. Those more interested in holiday meal solutions: Generation X, with interest
among 32 percent. Supermarket shoppers more so
than any other banner. Mid-high income categories
from $50,000 to $75,000. Shoppers earning more than $100,000 annually are much more likely to want the eating out experience.
Thirty percent of women are interested in holiday solutions versus 24 percent of men. Interest also rises along with household size, at 31 percent for four people and up.
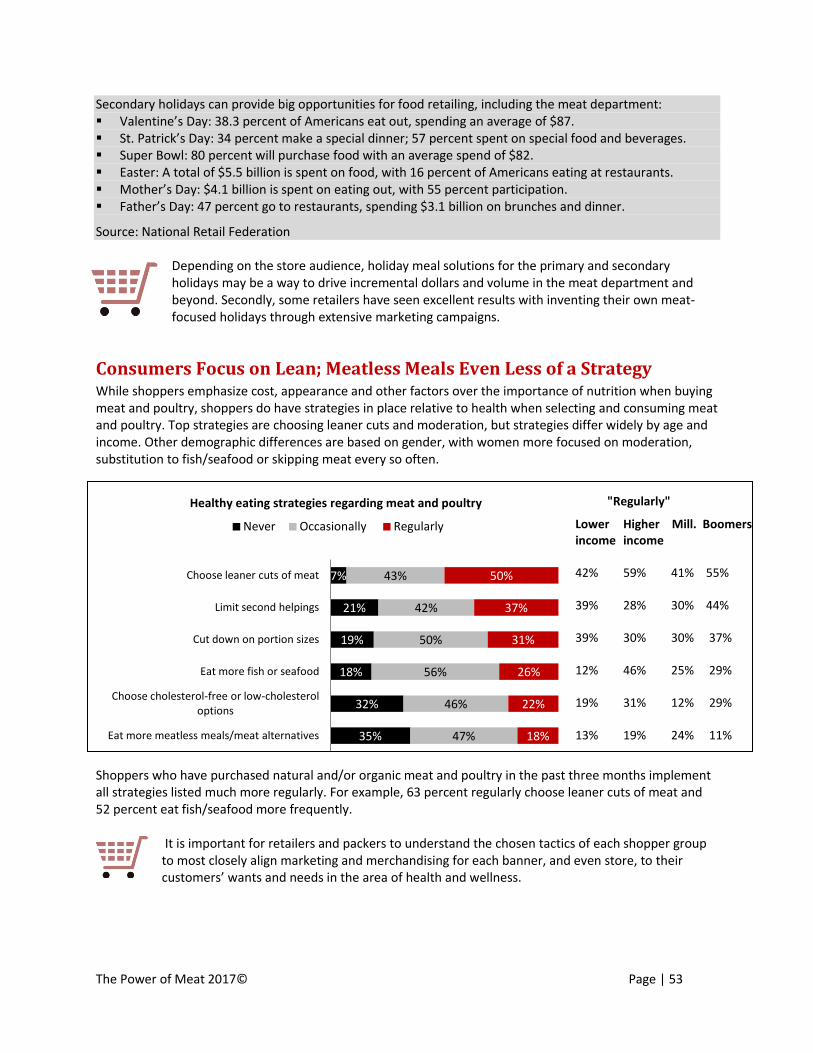
The Power of Meat 2017© Page | 53
Secondary holidays can provide big opportunities for food retailing, including the meat department: Valentine’s Day: 38.3 percent of Americans eat out, spending an average of $87. St. Patrick’s Day: 34 percent make a special dinner; 57 percent spent on special food and beverages. Super Bowl: 80 percent will purchase food with an average spend of $82. Easter: A total of $5.5 billion is spent on food, with 16 percent of Americans eating at restaurants. Mother’s Day: $4.1 billion is spent on eating out, with 55 percent participation. Father’s Day: 47 percent go to restaurants, spending $3.1 billion on brunches and dinner.
Source: National Retail Federation
Depending on the store audience, holiday meal solutions for the primary and secondary holidays may be a way to drive incremental dollars and volume in the meat department and beyond. Secondly, some retailers have seen excellent results with inventing their own meat-focused holidays through extensive marketing campaigns.
Consumers Focus on Lean; Meatless Meals Even Less of a Strategy While shoppers emphasize cost, appearance and other factors over the importance of nutrition when buying meat and poultry, shoppers do have strategies in place relative to health when selecting and consuming meat and poultry. Top strategies are choosing leaner cuts and moderation, but strategies differ widely by age and income. Other demographic differences are based on gender, with women more focused on moderation, substitution to fish/seafood or skipping meat every so often.
Shoppers who have purchased natural and/or organic meat and poultry in the past three months implement all strategies listed much more regularly. For example, 63 percent regularly choose leaner cuts of meat and 52 percent eat fish/seafood more frequently.
It is important for retailers and packers to understand the chosen tactics of each shopper group to most closely align marketing and merchandising for each banner, and even store, to their customers’ wants and needs in the area of health and wellness.
35%
32%
18%
19%
21%
7%
47%
46%
56%
50%
42%
43%
18%
22%
26%
31%
37%
50%
Eat more meatless meals/meat alternatives
Choose cholesterol-free or low-cholesterol options
Eat more fish or seafood
Cut down on portion sizes
Limit second helpings
Choose leaner cuts of meat
Healthy eating strategies regarding meat and poultry
Never Occasionally Regularly Lower Higher Mill. Boomers income income 42% 59% 41% 55% 39% 28% 30% 44% 39% 30% 30% 37% 12% 46% 25% 29% 19% 31% 12% 29% 13% 19% 24% 11%
"Regularly"
The Power of Meat 2017© Page | 54
Improving the Meat Department
Chapter Insights Meat departments average a 7.4 on a 10-point scale for their overall performance in meeting shoppers’
needs. Cleanliness, quality and freshness are high-scoring attributes, but customer service and information continues to drag down the average.
Ways to make shopping for meat better and easier include many areas. Those accounting for at least one in 10 suggestions include better prices, improved customer service, better variety of meat and package sizes, and better information.
Cleanliness and Quality Top-Rated Attributes for Meat Department In addition to learning about habits, interests and preferences, the survey probed into how the industry is measuring up to provide a national and channel performance yardstick for comparison. Cutting across banners, shoppers provided feedback on how the meat department at their primary store is performing in terms of variety, quality, prices, customer service, signage/organization and cleanliness. Respondents used a 10-point scale, where 10 is excellent.
Primary meat department performance. Average on a scale 1-10, where 10 is highest
All shopper average
Supermarket average
Supercenter average
Overall performance in meeting your needs 7.4 7.4 7.2
Cleanliness 8.1 8.2 7.8
Quality and freshness 7.9 7.9 7.5
Signage and organization 7.4 7.5 7.1
Variety of kinds/cuts and package sizes 7.2 7.2 7.1
Prices 7.1 7.0 7.1
Customer service and information 6.9 7.2 6.2
Cleanliness —Meat department cleanliness continues to be the highest ranked attribute, and a clean,
organized department is a simple must for success. Specifically, shoppers call for wipes and bags, personnel in clean aprons, clean cases, non-leaky packages and nicely stocked inventory.
Quality and freshness — Quality was the second highest-rated attribute and is very much part of the overall value proposition in combination with price. Lack of perceived quality evokes the strongest of open-ended responses.
Variety — Package size and brand variety continue to draw many responses, with the majority of comments focused on accommodating smaller households.
Prices — Every day price perception rose in favorability compared with prior years. This was always a strong suit for supercenters and the first time supermarkets reached the 7-mark as well.
Customer service and information —Service remains a sore spot on the industry score card, though supermarkets rated better than supercenters.
A few more insights:
Supercenter patrons who buy meat and poultry in the supermarket channel rated the meat department there with an above-average 7.6. In other words, they make the conscious decision to shop for meat and poultry outside of their primary grocery channel and are highly satisfied doing so. This will make it hard
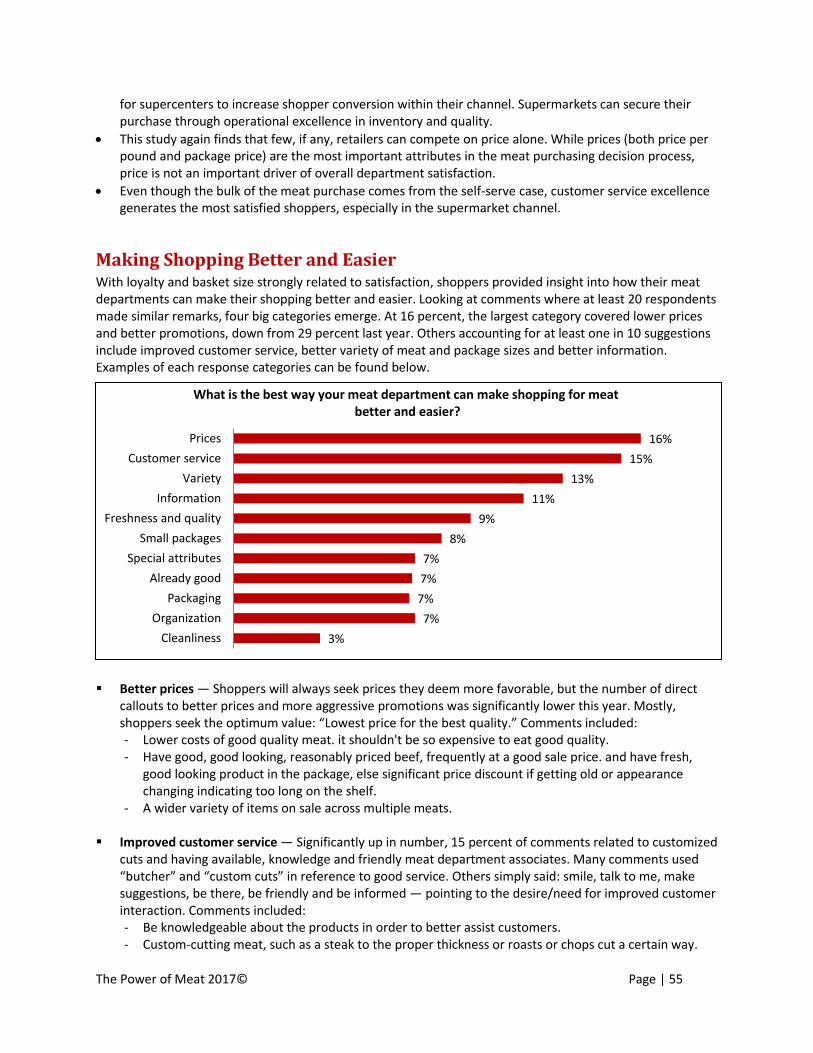
The Power of Meat 2017© Page | 55
for supercenters to increase shopper conversion within their channel. Supermarkets can secure their purchase through operational excellence in inventory and quality.
This study again finds that few, if any, retailers can compete on price alone. While prices (both price per pound and package price) are the most important attributes in the meat purchasing decision process, price is not an important driver of overall department satisfaction.
Even though the bulk of the meat purchase comes from the self-serve case, customer service excellence generates the most satisfied shoppers, especially in the supermarket channel.
Making Shopping Better and Easier With loyalty and basket size strongly related to satisfaction, shoppers provided insight into how their meat departments can make their shopping better and easier. Looking at comments where at least 20 respondents made similar remarks, four big categories emerge. At 16 percent, the largest category covered lower prices and better promotions, down from 29 percent last year. Others accounting for at least one in 10 suggestions include improved customer service, better variety of meat and package sizes and better information. Examples of each response categories can be found below.
Better prices — Shoppers will always seek prices they deem more favorable, but the number of direct
callouts to better prices and more aggressive promotions was significantly lower this year. Mostly, shoppers seek the optimum value: “Lowest price for the best quality.” Comments included: - Lower costs of good quality meat. it shouldn't be so expensive to eat good quality. - Have good, good looking, reasonably priced beef, frequently at a good sale price. and have fresh,
good looking product in the package, else significant price discount if getting old or appearance changing indicating too long on the shelf.
- A wider variety of items on sale across multiple meats. Improved customer service — Significantly up in number, 15 percent of comments related to customized
cuts and having available, knowledge and friendly meat department associates. Many comments used “butcher” and “custom cuts” in reference to good service. Others simply said: smile, talk to me, make suggestions, be there, be friendly and be informed — pointing to the desire/need for improved customer interaction. Comments included: - Be knowledgeable about the products in order to better assist customers. - Custom-cutting meat, such as a steak to the proper thickness or roasts or chops cut a certain way.
3%
7%
7%
7%
7%
8%
9%
11%
13%
15%
16%
Cleanliness
Organization
Packaging
Already good
Special attributes
Small packages
Freshness and quality
Information
Variety
Customer service
Prices
What is the best way your meat department can make shopping for meat better and easier?

The Power of Meat 2017© Page | 56
- Fast service, accessible, friendly workers for when you have a question. - Greet me when I approach the counter and ask how they can help. - Have a butcher available to give you advice on different cuts and how best to use them. - Have a butcher, at a butcher counter. Not having everything pre-sized and wrapped with the butcher
"hiding out" behind closed doors. - Have enough advertised specials on hand AND adequate personnel to serve customer load. NOT an
ignorant, unskilled apprentice all by himself. - Making the store setup easier to understand and maybe having someone by the meats to help point
you in the right direction and give suggestions.
Protein variety — Every year, variety, selection and assortment are another big area of respondents’ suggestions. This includes: a) A solid variety of meat and poultry basics. b) Package size variety for all the meat offerings. c) Different kinds of proteins, whether it be species including buffalo, ostrich, frog legs, etc. d) Special attributes, including kosher, organic, local, grass-fed, antibiotic/hormone-free and others. Some verbatim responses include: - Have a variety of cuts of meat, fresh, and in various package sizes. - Giving more options, I love pot roasts and they are often too small to feed a family. - Less traditional beef cuts. More turkey, chicken, grass-fed beef, buffalo, other meats. - A wide selection of portions in package meat. - Carry quality meats and a variety of them. I often have to go to multiple stores to find a specialty cut
or type of meat especially lamb or a good grade of beef. - Would like to see more of the cuts used in past like some of the roast cuts without going to a
"butcher shop" and paying premium for the cut Smaller packages — An ever-growing number of comments directly relate to more packages for one- and
two-person households. Demographically, this is a growing group across the United States. The impact of the smaller household size is further reinforced by the shift in the role of meat and poultry as a meal ingredient versus a center of the plate item. - Since I'm single I'd like to see smaller packages. My store will gladly give me the portion that I want,
but I don't like to ask. For instance, ground beef etc. is always in more than a pound in the package; I'd love to see 1/2 pound or so packages ready to put in my cart.
- Have convenient one-portion sized meats, with recipes, ready to go in resealable packages. Pick it up and that's dinner!
- Have the same deal for the family bulk pack on the smaller pack. I’m just one person. Having to buy six chicken breasts is ridiculous to get the deal.
- Please remember that there are those of us out here who don't have a ginormous family. We cook for one. We need healthy, nutritious options for us to prepare for ourselves. We are a very underserved demographic.
Extensive information —There was a noticeable growth in the number of responses asking for more
information about product content and provenance, better labeling, recipes and other preparation suggestions. Other comments included larger font, pack dates and other product/production info. - Clear and concise information about pricing, nutrition, and source of products; and ease of access to
that information. - Clear labeling and pricing. Noting if product is farmed in USA. - More information: Clearly-marked price per pound. Date packaged. Time it will remain fresh in the
refrigerator and freezer. Easier to read labels period.

The Power of Meat 2017© Page | 57
- Give us the story behind the meat. - Better explanations of what different meat cuts are for. Like this is good as a roast, this makes good
fajitas, etc.
Special attributes — Along with an increased demand for information comes an increased demand for special-attribute meat and poultry itself, from calls to go 100 percent organic to simply better insight into the full farm-to-fork process. Others call for a greater variety of value-added and meal solutions. A few comments are: - Carry a full line of healthy, organic, sustainably-raised meat/poultry and sustainably-caught wild (not
farmed, ever) fish products all year round. - Carry locally raised, free-range meat and poultry. - Not have a huge price gap between sustainable, humane, non-hormone, non-antibiotic
meats/poultry and other meat/poultry and make it easier to find those items. - Need healthier selections that are cook-ready or heat-and-eat.
Better freshness and quality —Another 10 percent of comments pertained to the quality and the freshness of the meat and poultry. This category has consistently generated comments throughout the year, and represents shoppers’ quest for value for the money. Some of the responses were: - Just sell the best quality and freshest meat possible. - Better cuts of meat. Remove the fat/gristle that seems to be present for almost every package. - Stop adding food dye to meats to suggest freshness or juiciness; it's deceptive, insulting, and
unnecessary. - Be more careful about not selling slimy meat! It's so frustrating to take meat home that actually is a
little too old and I question the safety. It's so frustrating! I hate slimy meat! I feel like the meat dept needs to step it up, in several of the stores, and only sell the freshest meat. Sometimes I skip sales or anything remotely questionable because I have lost some of my trust in the meat staff's judgment.
Organization and in-stock —Seven percent of comments noted organizational improvements, ranging
from better signage, clearly labeled pricing, different layout by type, pack size or special attribute, and improvement of in-stock availability, particularly for items on sale. Out-of-stocks have a tremendous negative influence on trip satisfaction and longer-term loyalty. - Check the stock daily and move the nearly expired stuff to a
reduced price bargain section with warning that it be used quickly. Often, the older stuff is actually placed first on shelf.
- Have all the advertised specials together and easy to find. - Have the items organized (based on type, cut, brand, amount). - Keep different meats separated and easily accessible with clearly
labeled packaging indicating price, pounds, and freshness. - Not packed in so close. - Putting all "reduced for quick sale" items in one location. - Have enough of the product on hand or if they run out take the sign down so I'm not deceived. - Having a full selection. Many times you go and sections are empty so you have to buy a different
product then you want or make multiple trips. - Show the variety in easier to identify packaging. - Make new products easy to find. - Signs which clearly and plainly point to different meats in the meat case.
Fixing out-of-stocks Retailers recognize the importance of fixing out-of-stocks, with 70 percent of supermarket respondents willing to run an increased risk of department shrink (averaging 4.6 percent) to improve their in-stock position.
The Power of Meat 2017© Page | 58
Packaging innovation — 4 percent of comments referenced concepts such as vacuum packs, ovenable and freezable packaging and packaging that does not tear or leak when transported from the store to the home. Many referenced improvements related to cleanliness, but respondents referenced other packaging innovation as well:
- Be able to see both the top and bottom of the packaged meat. - Make containers so you don't have to use all those extra plastic bags, less waste in packaging,
and more environmentally friendly packaging - Ready to freeze packages, so I don't have to go home and cut the meat into portions, then
repackage and freeze for later. There are only two of us, so we buy bulk and freeze for later quite often.
- Lose the PLASTIC and Styrofoam containers/wrapping. - Make the packaging easier to open without getting juice all over the counter. - No leak packaging, make plastic harder to puncture accidentally. - Possibly containers that have meats in their own separate space, so I can take out what I need
one at a time and freeze, if needed, for future meals. - Resealable packages, or smaller portion sizes, in a big package so you can take smaller quantities
out without having to use the whole package.
Cleanliness — Cleanliness is simply a must as well as a highly rated attribute overall: - Maintain the smell and cycle the meat more effectively. If it smells like old meat there is no way I
am purchasing anything from the department. - Always have fresh meat and great cuts. Clean displays and packages are most important. - Having sanitation wipes or plastic bags available for leaking packages, like hamburger and
chicken that isn't frozen.
Customer Suggestions Closely Meet Retailer Strategies for Trips/Sales Retailers also provided insight into how they’re looking to be more relevant to drive trips and sales among shoppers and non-shoppers. Hot, and targeted, promotions and pricing strategy adjustments
- Deeper discounts along with a focus on EDLP pricing, service and freshness. - Lower price per package, smaller cuts and more "ready to go" items (shrinking families/cooking less). - More electronic marketing and digital media. - Very hot front page ads, with several interior page value-added items, 30% more fresh meat items in ads. - Increased loyalty card offers directed at specific groups, heavier promotions.
Variety, particularly value-added and special attributes - Best variety of organic ad naturally raised meats combined with very competitive prices. - Trade up with Certified Angus Beef and Natural Fresh Pork and Poultry. - More value-added items and meal solutions — marinated and seasoned meats.
Customer service excellence - Engaging the shopper with service and suggestions. Utilizing recipes in ads that build the total plate. - Developing better sales, customer facing skills within the department. - Always have stock available and strive to provide customers with advice/service.
Total basket approach - More add-on items like beer and wine to go along with a meat purchase. - Focus on in-store conversion more than driving original trips.
The Power of Meat 2017© Page | 59
Methodology
The data for The Power of Meat 2017 were collected through an online consumer panel. The survey was conducted in the second week of November 2016, among a national sample of 2,382 U.S. consumers. Sample adjustments were made to ensure the sample accurately mirrored the population. The margin of error associated with the survey is 2.1 percent at the 95 percent confidence level. Percentages may not always add to 100 percent due to rounding. Years reflected in the report correspond with the report year. Respondents must have met the following requirements to participate in the survey: A minimum of 18 years of age. Primary or equally shared responsibility for food shopping. Not adhere to a vegetarian or vegan lifestyle. The report was prepared by Anne-Marie Roerink of 210 Analytics, LLC. For additional data, insights or explanations, email [email protected] or call 210.485.4552.
Geographic Regions
Northeast: CT, RI, MA, VT, NH, ME, NJ, PA, NY Midwest: IA, IL, IN, KS, MI, MN, MO, NE, ND, OH, SD, WI South: AL, AR, DC, DE, FL, GA, KY, LA, MD, MS, NC, OK, PR, SC, TN, TX, VA, WV West: AK, AZ, CA, CO, HI, ID, MT, NM, NV, OR, UT, WA, WY
The study uses the following generational definitions:
Young Millennials (Generation Y): Ages 18-24 Older Millennials: Ages 25-34 Generation X: Ages 35-50 Young Boomers: Ages 51-60 Older Boomers: Ages 61-69 Silent Generation: Ages 70+
Boomers: 51-69
Millennials: 18-34
The Power of Meat 2017© Page | 60
Segment Market and Trend Reviews
Turkey Category Overview By: The National Turkey Federation Americans enjoy turkey at nearly twice the amount now than 30 years ago, as turkey has expanded its appeal beyond the Thanksgiving and Christmas family meals. Consumers have discovered the value and versatility of ground meat from turkey, made with juicy dark meat from thighs and drumsticks. They have found enjoyment in the flavor options of turkey tenderloin and turkey breast seasoned or marinated with spicy and sweet sauces. Turkey ground meat is widely popular as high-protein low-fat turkey option in burgers, meatballs, chili, meatloaf and tacos as well as for grilling, in soups, sauces, salads and wraps. Turkey is also an unexpected choice to power-up at snack time: rolling a slice of turkey around carrot, celery, or zucchini to dip in salsa; turkey chunks mixed with apple slices and almonds; or sliced turkey wrapped around a pretzel stick dipped in honey mustard. A lean protein powerhouse, turkey is low in fat, high in protein and rich in B vitamins and minerals to energize consumers. Turkey provides essential nutrients to promote healthy metabolism by helping our bodies convert food into energy. Three-ounce cooked, skinless turkey ground meat that’s 93 percent lean will fuel the body with 22 grams of protein at 180 calories and just three grams of saturated fat. High-protein poultry and meat take more work to digest, metabolize, and use, burning more calories by digesting them. High protein foods also take longer to leave your stomach and satisfy your appetite from overeating. Complete proteins contain all nine essential amino acids your body needs to build lean muscle. Your body cannot produce these essential amino acids, and poultry and meat are among the best sources. The National Turkey Federation is found at EatTurkey.org and ServeTurkey.org, on Twitter @TurkeyGal and on Facebook as Turkey.The Perfect Protein. NTF is the national advocate raising awareness for its members' products, while strengthening their ability to profitably and safely deliver wholesome, high-quality and nutritious food to consumers worldwide. The National Turkey Federation represents growers, processors, hatchers, breeders, distributors, allied services and state associations.
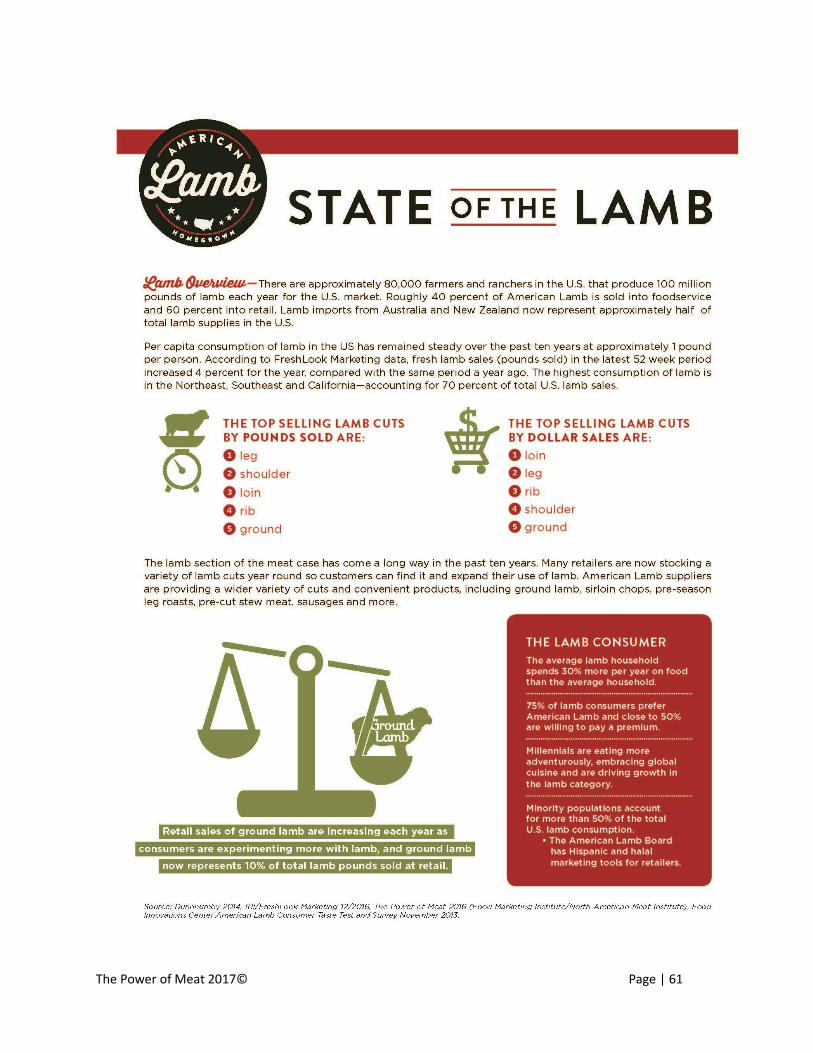
The Power of Meat 2017© Page | 61
The Power of Meat 2017© Page | 62
Pork Category Overview By: Patrick Fleming, Director of Market Intelligence, and Angela Anderson, Communications Manager for Domestic Marketing at the National Pork Board. America’s pig farmers produced a record-breaking number of market hogs in 2016, resulting in ample supplies of pork at the retail meat case and in restaurants. Today’s large hog supplies are being driven by both a growth in the breeding herds and increased productivity. The high level of pork production is expected to continue well into 2017, again providing record-breaking supplies of pork in the marketplace. Pork production is cyclical, and in good times, such as in 2014 with high pork prices, many farmers built financial reserves or invested in their business by expanding production. Although slaughter capacity has been close to capacity several times this past year, the silver lining is that there are several processing facilities under construction right now, which should alleviate the large hog supplies coming into the marketplace. But even with the new processing plants in place, pork prices are anticipated to stay a good value throughout the year due to the large supply of pork. It is important to note that U.S. pork demand remains strong. Consumer spending on pork in 2016 was up 7.6 percent over the five-year average. The abundant protein supply in the marketplace is good news for retailers since meat prices should continue to fall and encourage more promotional activity. For consumers, pork is expected to continue to be a good value in the meat case in 2017, with sales and in-store promotions on both fresh and processed pork. For many consumers, including Millennials, pork provides a powerful eating experience because of its flavor, versatility and convenience, key attributes for retailers to feature at the meat case and in print promotions this year. Pork has a major flavor role in the three meal dayparts of breakfast, lunch and dinner. With items like Pork Jerky, Bacon Jerky and Chicharrones, pork has flavor offerings in the snaking category Pork, and especially ham, is on trend in the marketplace and remains the No. 2 most-consumed protein in the United States. Ham has the potential of being a great everyday meal option for many consumers, not just the perfect holiday meal. New ham research conducted by the National Pork Board showed that there is growth potential for whole ham purchases throughout the year, which would help grow the total pork sales and volume at the meat case. Smaller hams, new flavor profiles and marketing throughout the year offer untapped market opportunity. Beyond ham, a great value position on all pork products will encourage consumers to enjoy other cuts, like pork loins or shoulder roasts, more frequently. Retailers should continue to focus on the fresh pork category and consider featuring pork shoulders, loins and hams for the early part of 2017. These cuts will bring the best value to retailers and will help to move a significant volume of pork during a time of growing supplies. For more information on merchandising pork at retail, visit www.PorkRetail.org.
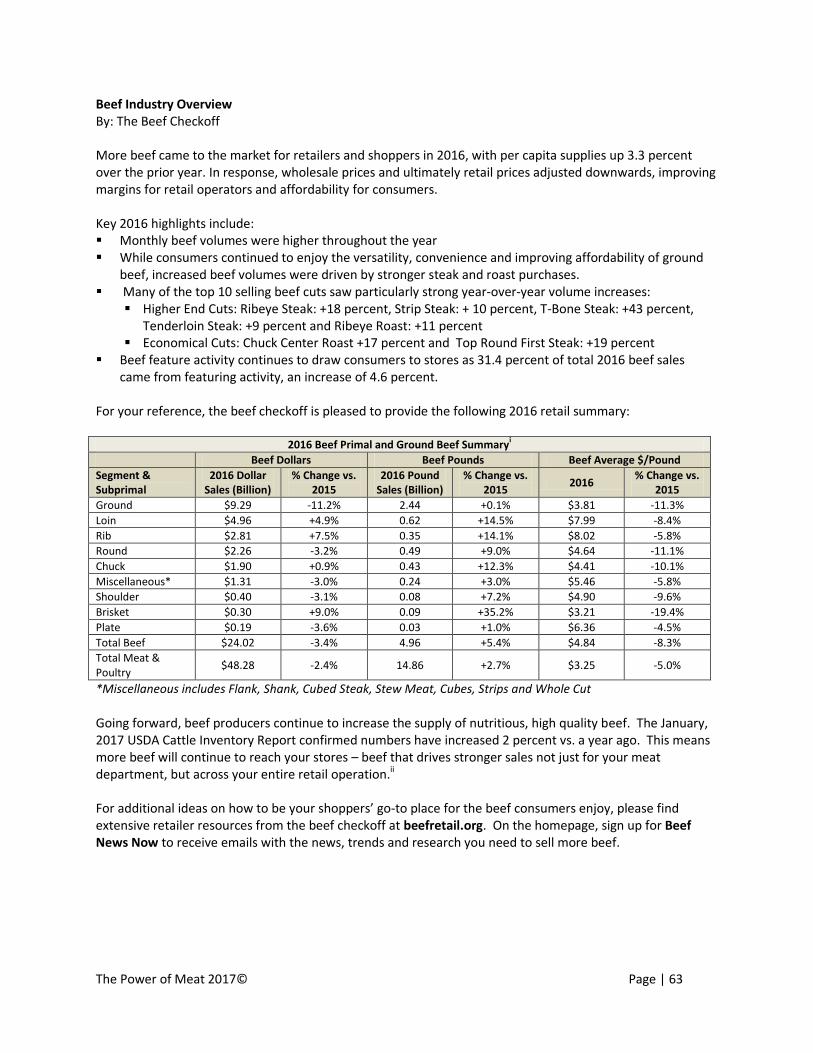
The Power of Meat 2017© Page | 63
Beef Industry Overview By: The Beef Checkoff More beef came to the market for retailers and shoppers in 2016, with per capita supplies up 3.3 percent over the prior year. In response, wholesale prices and ultimately retail prices adjusted downwards, improving margins for retail operators and affordability for consumers. Key 2016 highlights include: Monthly beef volumes were higher throughout the year While consumers continued to enjoy the versatility, convenience and improving affordability of ground
beef, increased beef volumes were driven by stronger steak and roast purchases. Many of the top 10 selling beef cuts saw particularly strong year-over-year volume increases:
Higher End Cuts: Ribeye Steak: +18 percent, Strip Steak: + 10 percent, T-Bone Steak: +43 percent, Tenderloin Steak: +9 percent and Ribeye Roast: +11 percent
Economical Cuts: Chuck Center Roast +17 percent and Top Round First Steak: +19 percent Beef feature activity continues to draw consumers to stores as 31.4 percent of total 2016 beef sales
came from featuring activity, an increase of 4.6 percent.
For your reference, the beef checkoff is pleased to provide the following 2016 retail summary:
2016 Beef Primal and Ground Beef Summaryi
Beef Dollars Beef Pounds Beef Average $/Pound
Segment & Subprimal
2016 Dollar Sales (Billion)
% Change vs. 2015
2016 Pound Sales (Billion)
% Change vs. 2015
2016 % Change vs.
2015
Ground $9.29 -11.2% 2.44 +0.1% $3.81 -11.3%
Loin $4.96 +4.9% 0.62 +14.5% $7.99 -8.4%
Rib $2.81 +7.5% 0.35 +14.1% $8.02 -5.8%
Round $2.26 -3.2% 0.49 +9.0% $4.64 -11.1%
Chuck $1.90 +0.9% 0.43 +12.3% $4.41 -10.1%
Miscellaneous* $1.31 -3.0% 0.24 +3.0% $5.46 -5.8%
Shoulder $0.40 -3.1% 0.08 +7.2% $4.90 -9.6%
Brisket $0.30 +9.0% 0.09 +35.2% $3.21 -19.4%
Plate $0.19 -3.6% 0.03 +1.0% $6.36 -4.5%
Total Beef $24.02 -3.4% 4.96 +5.4% $4.84 -8.3%
Total Meat & Poultry
$48.28 -2.4% 14.86 +2.7% $3.25 -5.0%
*Miscellaneous includes Flank, Shank, Cubed Steak, Stew Meat, Cubes, Strips and Whole Cut
Going forward, beef producers continue to increase the supply of nutritious, high quality beef. The January, 2017 USDA Cattle Inventory Report confirmed numbers have increased 2 percent vs. a year ago. This means more beef will continue to reach your stores – beef that drives stronger sales not just for your meat department, but across your entire retail operation.ii For additional ideas on how to be your shoppers’ go-to place for the beef consumers enjoy, please find extensive retailer resources from the beef checkoff at beefretail.org. On the homepage, sign up for Beef News Now to receive emails with the news, trends and research you need to sell more beef.
The Power of Meat 2017© Page | 64
Chicken Industry Overview By: Tom Super, Senior Vice President, Communications, National Chicken Council Chances are, eight out of 10 shoppers in the checkout line have some type of chicken product in their carts. A 2016 surveyiii by the National Chicken Council (NCC) found that 87 percent of consumers ate a chicken meal or snack purchased from a supermarket and 72 percent ate a chicken meal or snack from a food service establishment in the two weeks leading up to the survey. Consumers’ taste for chicken shows no signs of waning, either. People bought more chicken last year and plan to buy more in 2017. In the 12 months following the survey, 21 percent of consumers anticipate eating more chicken from the supermarket and 14 percent anticipate eating more from a food service establishment. Supermarket numbers increased 2.4 percent and are now at parity with those seen in 2015. Consumers with the highest consumption levels tend to skew younger, more affluent and ethnically diverse with larger households. Among gender, total chicken consumption was split right down the middle: 50 percent female, 50 percent male. For many, chicken is the go-to food for lean meat, because of its low fat and high protein content, its versatility, variety, affordability and nutrient richness. In fact, according to U.S. Department of Agriculture estimates, Americans will eat 92 pounds of chicken per person this year, a record amount. Winner-Winner. Chicken tops the list of protein being consumed most often per week. Broiler Outlook Supplies of beef, pork and chicken are on the rise, and at the same time U.S. per capita meat consumption is expected to return to an all -time peak by 2018. Most meat and poultry analysts agree that robust export sales will be the most critical component for the success of the industry in the two-three years ahead, but the strength of the U.S. dollar, competitive pricing in world markets and the pace of economic growth in trade destinations will all be important factors in that success. In the short term, abundant grain and oilseed crops should make navigating these waters more manageable. On the broiler side, China will be the biggest variable that could determine the amount of success we have in increasing export sales. China banned all U.S. poultry, including breeding stock, in January 2015, based on a high path avian influenza detection in a wild bird in Oregon. Chinese domestic production is predicted to decrease by 5.5 percent in 2016 and 10.4 percent in 2017, according to USDA/FAS — signs that the shortage of breeding stock is taking a toll. China remains our only trading partner with a ban still in place, and the U.S. government and poultry trade associations continue to work to negotiate the re-opening of this market.
i Freshlook/IRI, Total US MULO, 52 Weeks Ending 12/25/2016; Categorized by VMMeat System ii IRI Market Basket Study, Total US, 52 Weeks Ending 6/14/14
iii The survey was commissioned by the National Chicken Council and conducted online by ORC International June 6
– 9, 2016, among 1,017 adults. Funding was provided by Elanco and WATT Global Media.