the market effects of sdg&e's and pg&e's commercial
TRANSCRIPT
The Market Effects of SDG&E’s and PG&E’sCommercial Lighting Efficiency Programs
Mitchell Rosenberg, XENERGY Consulting, Inc.Michael Rufo, XENERGY Consulting, Inc.
Athena Besa, San Diego Gas & ElectricMary O ‘Drain, Pacific Gas & Electric
ABSTRACT
This paper summarizes the methods and findings of a project to assess the market effects ofcommercial lighting efficiency programs sponsored by San Diego Gas & Electric and Pacific Gas &Electric. The study focused on effects on the markets for efficient fluorescent lighting components:electronic ballasts, T-8 lamps, and fixtures that integrate those technologies. The research for theproject consisted of surveys of representative samples of end-users in the sponsors’ service territoriesand a “non-program” area in which no utility DSM programs had operated, in-depth interviews withmanufacturers and other supply side actors in both the sponsor and non-program areas, and review ofsecondary sources. The study found that the sponsors’ programs, as part of a larger national utilityeffort, had a significant effect on levels of customer demand for efficient ballasts and lamps at thenational as well as regional level. The sponsors’ programs also had important effects on the localmarkets, such as increased promotion by designers and contractors and very rapid up swings in demandamong certain sectors of end-users. Market share for efficient fluorescent components continues toincrease in the face of decreased utility program support. This and other evidence suggests that someof the market effects of the sponsors’ programs will be durable.
Introduction
Operational Definitions and Objectives of the Project
During the latter half of 1997, San Diego Gas & Electric and Pacific Gas & Electric undertooka study to assess the effects of their energy efficiency programs on the commercial market for efficientfluorescent lighting equipment. Both utilities had offered large-scale programs of various kinds toencourage the use of efficient fluorescent lighting equipment since the mid- 1980s. The study focusedon the effects of programs that operated between 1992 and 1996.
This paper summarizes the scope, methods, and findings of the commercial lighting marketeffects study. We also present observations on “lessons learned” from the study regarding technicalaspects of evaluating a program’s market effects. Finally, we identify a number of questions raised byour findings concerning the features of the complex commercial market for efficient lightingequipment, which merit further study in support of continued market transformation efforts.
We adopted as the basis for this evaluation the operational definitions of market transformation
and market eflects of energy efficiency programs put forth in the Scoping Study on markettransformation commissioned by the California Demand-Side Management Measurement Advisory
The Market Effects of SDG &E’sand PG& E’s Commerm”alLighting Eficiency Programs -7.287
Committee (CADMAC) and completed in 1996. The key definitions from the Scoping Study (Schlegelet al. 1996) include the following:
. Market Transformation “means a reduction in market barriers due to a market intervention,as evidenced by a set of market eflects, that lasts after the intervention has been withdrawn,reduced or changed.”
. A Market Eflect is “a change in the structure of a market or the behavior of participants in amarket that is reflective of an increase in the adoption of energy efficiency products,services, or practices and is causally related to market interventions.”
The primary objectives of the project were to:
. Identify changes in the commercial lighting markets that favor the adoption of efficientfluorescent technologies, both in the sponsors’ service territories and in the nation as awhole;
. Assess the extent to which these changes were attributable to the sponsors’ programs; and,
● Project the expected durability of any observed effects.
Other project objectives were to develop detailed demand-side and supply-side fluorescentlighting market characterizations, including segmentation and to characterize the nature and extent ofinterventions in the market by the sponsors, other utilities, and government agencies.
Research and Analysis Activities
The following research activities were undertaken in suppcmt of the analytical objectives.
. Customer surveys. Telephone surveys were conducted with representative random samples of579 commercial customers in the sponsors’ service territories and 287 commercial customers ina 9-state “nonprogram” area in which no utility lighting rebate programs had been offered.These were supplemented by in-depth interviews with 25 facilities managers working for RealEstate Investment Management firms (REIMs) and chain retailers both within and outside thesponsors’ territories. These surveys captured information on adoption of efficient technologiesand related practices, as well as the experience and effects of efficiency programs among thesponsors’ customers.
. Interviews with Supply-Side blarket Actors. In-depth interviews were carried out with 183
individuals working on the supply side of the cclmmercial lighting market. These includeddistributors, designers, installers, manufacturers, and government officials involved in product
standard and code development and enforcement. These interviews captured information on awide range of issues, including production, stocking, and promotion decisions in regard toefficient lighting equipment and program impacts on those decisions. In addition, 90 closed-ended interviews were conducted with distributors to estimate market penetration of efficientequipment.
. Secondary Sources. The project used a wide range of secondary sources, including prior utilityprogram evaluation, saturation, and market stuclies, Census data on equipment sales and
construction volumes, and a variety of reports and articles on lighting technologies and markets.
7.288- Rosenberg, et. al.
Overview of the Sponsors’ Programs
The sponsors’ programs to support efficient commercial fluorescent technologies can besummarized as follows.
. Scale of activity. The volume of the sponsors’ program activity was huge in relation to themarkets targeted. During the period January 1992 - July 1997, PG&E paid rebates on about 9million four-foot ballasts and 15.6 million four foot lamps. These subsidized purchasesaccounted for 40 percent of all ballast sales (not just electronic ballasts) in the PG&E serviceterritory during the study period and 80 percent of all electronic ballast sales. SDG&E paidrebates on 2.1 million ballasts and 4.7 million lamps. We estimated that subsidized ballastpurchases accounted for 30 to 35 percent of the market for all ballasts in the San Diego territoryfor the study period, or 60 to 70 percent of electronic ballast purchases. Rebate activity for bothprograms peaked in 1994 and 1995.
● Sponsor’s programs in the context of national aclivity. During the period 1988-1996, utilitiesnationwide paid out nearly $2 billion in rebates for efficient fluorescent lighting components.These rebates subsidized the purchase of roughly half of all electronic ballasts shippeddomestically during this period. This is 16 percent of all ballasts shipped during the studyperiod. The sponsors’ programs accounted for over 13 percent of these rebates.
● Focus on applications in existing buildings. About 80 percent of the electronic ballasts onwhich PG&E paid rebates were installed in projects in existing buildings. The results ofcustomer surveys suggest that that roughly one-lhalf of these ballasts were used in retrofitprojects and the remainder in renovation and remodeling projects. Based on analysis ofprogram expenditures, a similar pattern appeared tcl hold for SDG&E.
. PG&E Program Strategies. PG&E promoted the use of efficient commercial fluorescentlighting in existing buildings through a variety of mechanisms. The largest of the programsoriented to existing buildings was Retrofit Express, which paid a fixed rebate amount percomponent. Retrofit Express accounted for 6.5 million of the 9 million ballasts rebated overthe study period. The Customized (Retrofit) program accounted for roughly 0.5 million ballastsrebated. This program based rebate payments on estimated KW and kWh savings, usinglighting power densities (LPDs) specified in the California Building Code (Title 24) as thebenchmark. Incentives for the use of efficient lighting in new construction were always basedon Lighting Power Densities. Over time, qualifying design LPDs have been reduced to theircurrent level, which ranges from 10 to 30 percent below Title 24 requirements, depending onbuilding type.
PG&E has promoted the development of both the supply and demand side of the market forefficient commercial lighting through a number of other strategies, including: designer
education through the Pacific Energy Center, provision of tools to support efficient lightingdesigns, participation in statewide processes to revise Title 24 (with lower LPDs), and energyaudit programs. Marketing of the programs focused on the office, retail, and institutionalsectors. 1
‘ For this study, the institutional sector includes the following kinds of buildings: primary and secondary school, government officebuildings, health and hospitals, lodging, colleges and universities. Utility records did not distinguish government from other kindsof office buildings.
The Market Effects of SDG &E’s and PG& E’s Commercial Lighting Eficiency Programs -7.289
● SDG&E Program Strategies. SDG&E’s programs to promote retrofit and replacement withefficient lighting among commercial customers began on a significant scale in 1989. Since thattime, the programs have evolved substantially in terms of target markets, measures supported,customer incentive levels and formats, and delivery mechanisms. One constant throughout hasbeen a high level of customer contact and logistical support for retrofit projects, including
project planning, prescreening of contractors, and, for some customers, full turnkey projectmanagement.
Size and Segmentation of the Sponsor’s Commercial Lighting Market
Methodological Challenges
Any analysis of a program’s market effects proceeds from a detailed profile of the targetmarket. The key elements of this profile include the total size of the market, its segmentation in termsof adoption of efficient lighting technologies, and the size and description of the segments.Assembling such a profile required the integration of data from a number of sources, each denominateddifferently, e.g.: number of square feet equipped with certain kinds of lighting; percentage of totalwattage installed accounted for by different kinds of equipment; number of efficient units sold, numberof units sold through various programs.
The key integration task was to express information from the various sources in terms ofnumbers of units installed (stock) or purchased in a given year (flow). The fulcrum for integratingthese sources is the pair of ratios: square feeticustorner and fluorescent ballasts (or fixtures orlamps)/square foot. We used reported number of employees from the customer surveys andemployee/square foot factors from CBECSZ to synthesize square footage for each sample facility. Wealso obtained the respondents’ estimates of the floorspace involved in each project involving theinstallation of fluorescent lighting equipment. These data allowed us to integrate and compare theresults of the customer surveys with the analysis of Census shipment data, distributor surveys onmarket penetration, the sponsors’ equipment saturation surveys, and program records of units rebated.This supported flexible analysis, as well as cross-checking to assess the plausibility of the individualdata sources.
Results
The sponsors’ commercial lighting markets are, simply put, huge. They constitute 4 percent ofthe total US market for commercial lighting equipment. The study results indicate that the commercialmarket is highly segmented in terms of adoption of efficient lighting equipment and related variables.Generally, the segmentation reflects the strength of customers’ motivations to invest in energyefficiency and organizational resources available to develop and manage efficiency improvements andequipment purchases. Thus, penetration of efficient equipment is highest in the institutional and
owner-occupied office sectors. Customers in these segments stand to benefit more than others frominvestments in energy efficiency because they are more likely to own their facility and the facility islikely to be larger and thus use more lighting energy. Moreover, these customers are likely to be part of
2 Energy Information Administration, Commercial Building Energy Survey: Energy End- Use Intensities in Commercial Buildings, 1995.
7.290- Rosenberg, et. al.
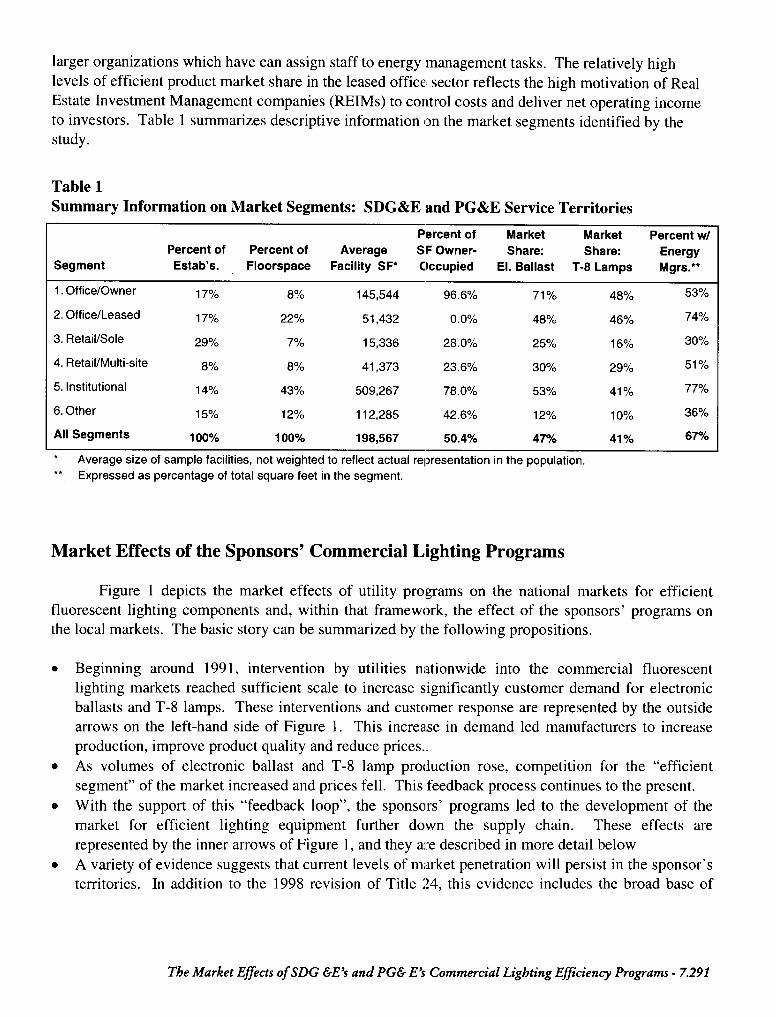
larger organizations which have can assign staff to energy management tasks. The relatively highlevels of efficient product market share in the leased office sector reflects the high motivation of RealEstate Investment Management companies (REIMs) to control costs and deliver net operating incometo investors. Table 1 summarizes descriptive information on the market segments identified by the
study.
Table 1Summary Information on Market Segments: SDG&E and PG&E Service Territories
Percent of Market Market Percent w/Percent of Percent of Average SF Owner- Share: Share: Energy
Segment Estab’s. Floorspace Facility SF* C)ccupied EL Ballast T-8 Lamps Mgrs.**
1.Office/Owner 1770 80/0 145,544 96.6?/0 71~o 487. 53?!.
2. Office/Leased 17’XO 22% 51,432 0.0% 4870 46?(0 74%
3. Retail/Sole 29% 770 15,336 28.0% 25% 16% 30~o
4. Retail/Multi-site 870 8% 41,373 23.6% 30% 29yo 51%
5. Institutional 1J’% 43% 509,267 78.0?40 53% 41~o 77%
6. Other 15% 12?40 112,285 42.670 1270 1o% 36?40
All Segments 100% 100% 198,567 50.4% 47% 41 y. 67%
● Average size of sample facilities, not weighted to reflect actual representation in the population,
‘* Expressed as percentage of total square feet in the segment.
Market Effects of the Sponsors’ Commercial Lighting Programs
Figure 1 depicts the market effects of utility programs on the national markets for efficientfluorescent lighting components and, within that framework, the effect of the sponsors’ programs onthe local markets. The basic story can be summarized by the following propositions.
●
●
●
●
Beginning around 1991, intervention by utilities nationwide into the commercial fluorescentlighting markets reached sufficient scale to increase significantly customer demand for electronic
ballasts and T-8 lamps. These interventions and custc)mer response are represented by the outsidearrows on the left-hand side of Figure 1. This increase in demand led manufacturers to increase
production, improve product quality and reduce prices..
As volumes of electronic ballast and T-8 lamp production rose, competition for the “efficientsegment” of the market increased and prices fell. This feedback process continues to the present.
With the support of this “feedback loop”, the sponsors’ programs led to the development of themarket for efficient lighting equipment further down the supply chain. These effects are
represented by the inner arrows of Figure 1, and they are described in more detail below
A variety of evidence suggests that current levels of market penetration will persist in the sponsor’sterritories. In addition to the 1998 revision of Title 24, this evidence includes the broad base of
The Market Effects of SDG &E’s and PG& E’s Commerca”al Lighting Eficiency Programs -7.291
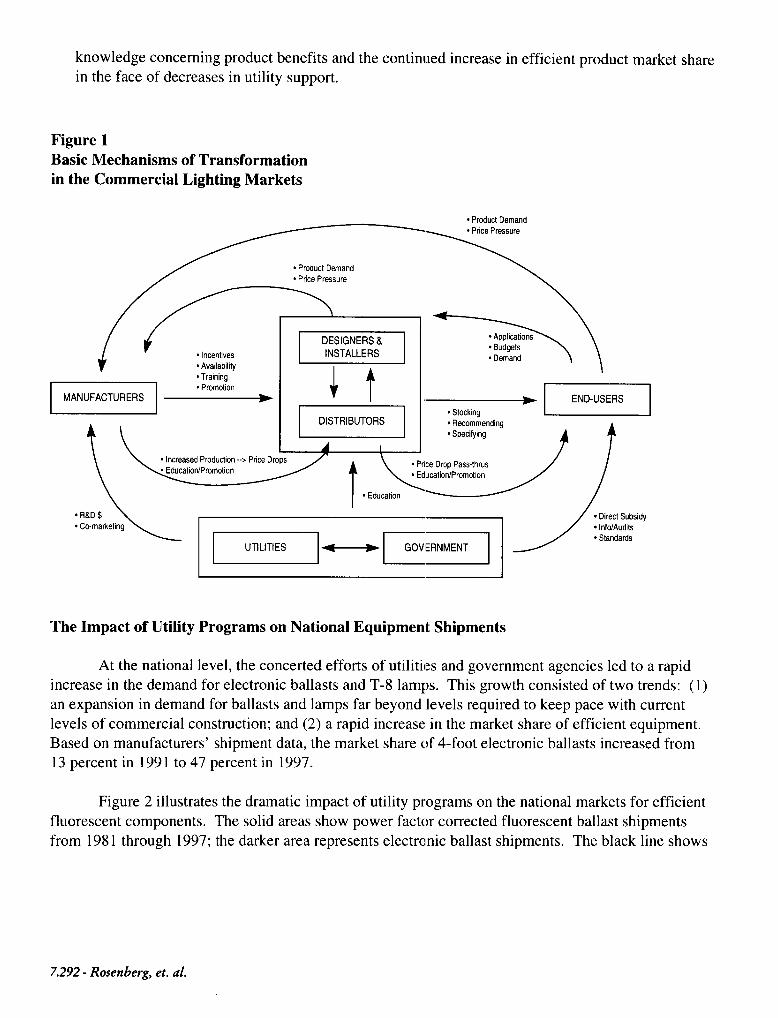
knowledge concerning product benefits and the continued increase in efficient product market share
in the face of decreases in utility support.
Figure 1Basic Mechanisms of Transformationin the Commercial Lighting Markets
● PrcductDemand. PricePressure
. ProductDemand
. PticePressure
‘b
oAvailaMiiy
L
‘c+ p-,
. IncreasedProduction.-> PriceDrops
wEducation
. R&D$● Co-marketing
~q
PEE-1
niiiii+—EE1● Stocking
● Rwommending● Specifying
?!
/
/
● DirectSubsidy● info/Audta● Standards
The Impact of Utility Programs on National Equipment Shipments
At the national level, the concerted efforts of utilities and government agencies led to a rapid
increase in the demand for electronic ballasts and T-8 lamps. This growth consisted of two trends: (1)an expansion in demand for ballasts and lamps far beyond levels required to keep pace with currentlevels of commercial construction; and (2) a rapid increase in the market share of efficient equipment.Based on manufacturers’ shipment data, the market share of 4-foot electronic ballasts increased from13 percent in 1991 to 47 percent in 1997.
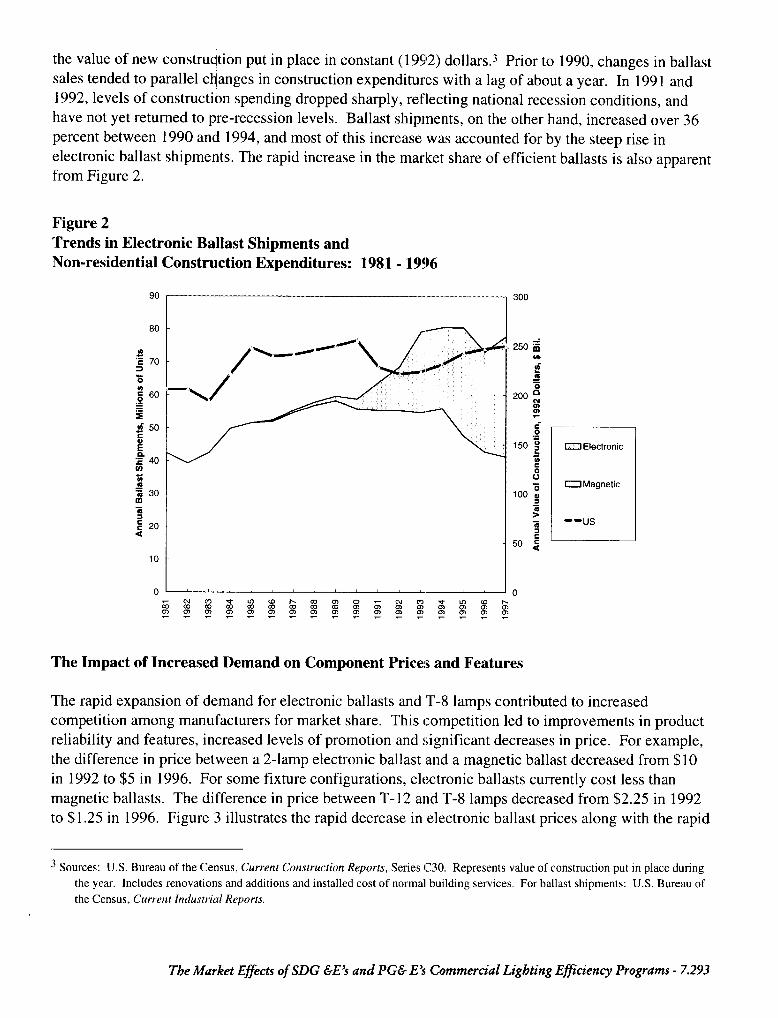
Figure 2 illustrates the dramatic impact of utility programs on the national markets for efficient
fluorescent components. The solid areas show power factor corrected fluorescent ballast shipments
from 1981 through 1997; the darker area represents electronic ballast shipments. The black line shows
7.292- Rosenberg, et. al.
i
the value of new constru tion put in place in constant (1992) dollars.s Prior to 1990, changes in ballastsales tended to parallel c anges in construction expenditures with a lag of about a year. In 1991 and1992, levels of construct n spending dropped sharply, reflecting national recession conditions, andhave not yet returned to pre-recession levels. Ballast shipments, on the other hand, increased over 36percent between 1990 and 1994, and most of this increase was accounted for by the steep rise in
electronic ballast shipments. The rapid increase in the market share of efficient ballasts is also apparentfrom Figure 2.
Figure 2
Trends in Electronic Ballast Shipments andNon-residential Construction Expenditures: 1981-1996
/
\ ./-
/-\
H Electronic
U Magnetic
--us
CUL7VGcocom Ulbmmg%mcom!g
Nlmv&mmfa
fabmf.mmmmm mm
%mmmmmmmm mm
---r- ---- ---- ---- -
The Impact of Increased Demand on Component Prices and Features
The rapid expansion of demand for electronic ballasts and T-8 lamps contributed to increasedcompetition among manufacturers for market share. This competition led to improvements in productreliability and features, increased levels of promotion and significant decreases in price. For example,the difference in price between a 2-lamp electronic ballast and a magnetic ballast decreased from $10in 1992 to $5 in 1996. For some fixture configurations, electronic ballasts currently cost less thanmagnetic ballasts. The difference in price between T-12 and T-8 lamps decreased from $2.25 in 1992
to $1.25 in 1996. Figure 3 illustrates the rapid decrease in electronic ballast prices along with the rapid
3Sources”U.S.Bureauof the Census, Current tlmstructiorr Reports, Series C30, Represents vafue of construction put in place duringthe year. Includes renovations and additions and installed cost of normal building services, For ballast shipments: U.S. Bureau ofthe Census, Current Industrial Reports.
Tbe Market Eflects of SDG &E’s and PG& E’s COmm~~”dl Lighting Efficiency Progrums -7.293
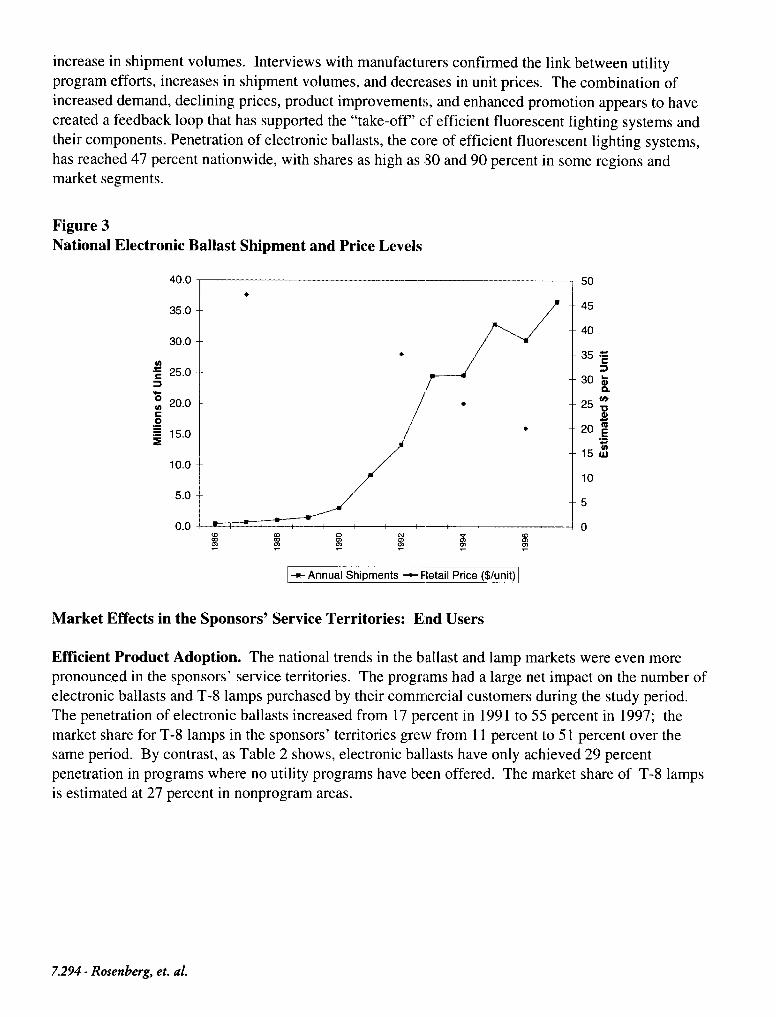
increase in shipment volumes. Interviews with manufacturers confirmed the link between utility
program efforts, increases in shipment volumes, and decreases in unit prices. The combination ofincreased demand, declining prices, product improvements, and enhanced promotion appears to have
created a feedback loop that has supported the “take-off” cf efficient fluorescent lighting systems andtheir components. Penetration of electronic ballasts, the core of efficient fluorescent lighting systems,has reached 47 percent nationwide, with shares as high as 80 and 90 percent in some regions andmarket segments.
Figure 3
National Electronic Ballast Shipment and Price Levels
40.0
35.0
30.0
In.= 25.0>G~ 20.0co.-: 15.0
10.0
5.0
0.0
●
✏
●
●
t
10
5
0
+ Annual Shipments + Fletail Price ($/unit)
Market Effects in the Sponsors’ Service Territories: End Users
Eftlcient Product Adoption. The national trends in the ballast and lamp markets were even morepronounced in the sponsors’ service territories. The programs had a large net impact on the number ofelectronic ballasts and T-8 lamps purchased by their commercial customers during the study period.The penetration of electronic ballasts increased from 17 percent in 1991 to 55 percent in 1997; themarket share for T-8 lamps in the sponsors’ territories grew from 11 percent to 51 percent over thesame period. By contrast, as Table 2 shows, electronic ballasts have only achieved 29 percentpenetration in programs where no utility programs have been offered. The market share of T-8 lampsis estimated at 27 percent in nonprogram areas.
7.294- Rosenberg, et. al.
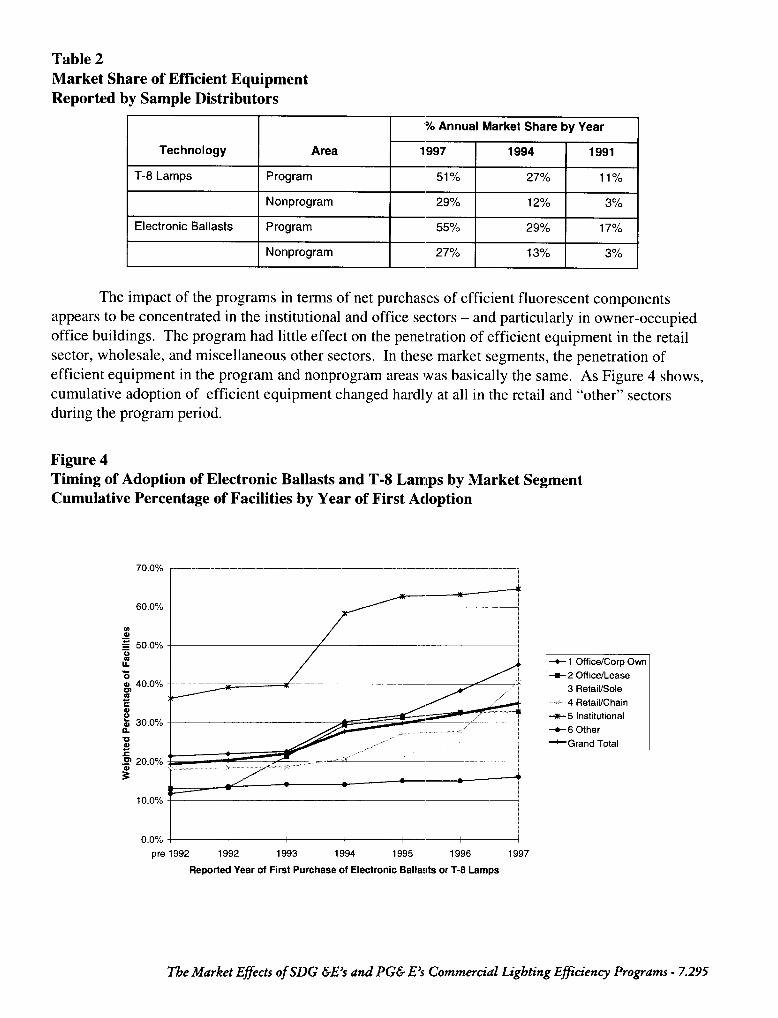
Table 2Market Share of Eftlcient EquipmentReported by Sample Distributors
‘% Annual Market Share by Year
Technology Area 1997 1994 1991
T-8 Lamps Program 51% Zi’% 1170
Nonprogram 2$)% 12% 3%
Electronic Ballasts Program 55% 29% 1i’O/o
Nonprogram zT~o 13% 370
The impact of the programs in terms of net purchases of efficient fluorescent components
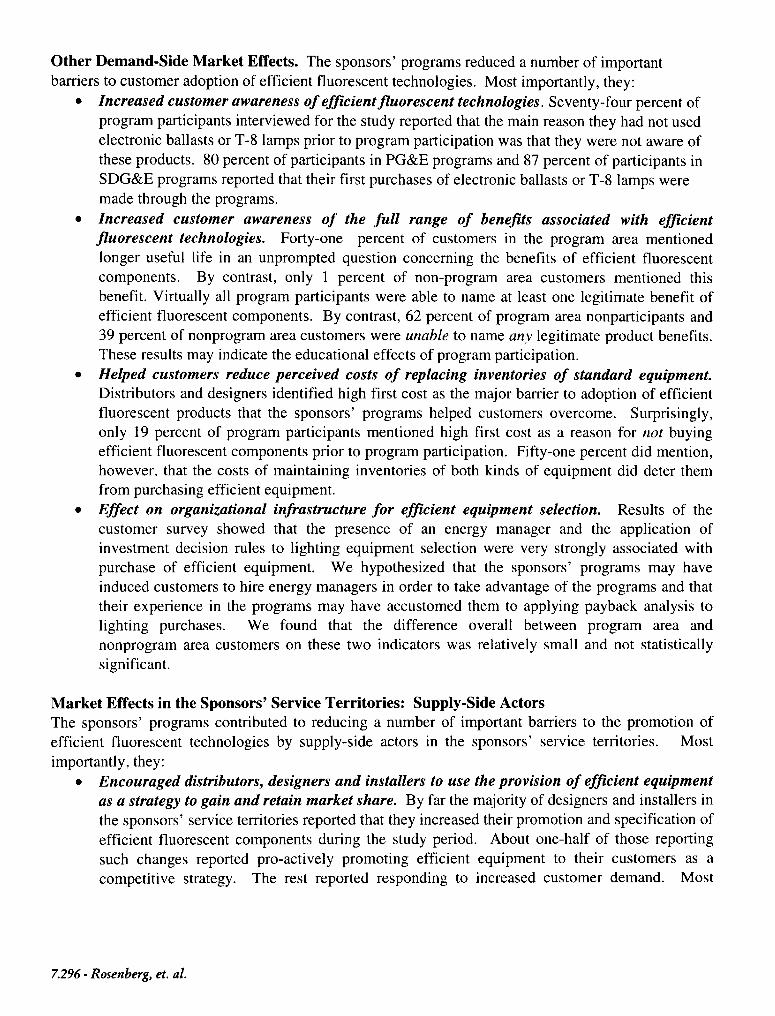
appears to be concentrated in the institutional and office sectors – and particularly in owner-occupiedoffice buildings. The program had little effect on the penetration of efficient equipment in the retailsector, wholesale, and miscellaneous other sectors. In these market segments, the penetration ofefficient equipment in the program and nonprogram areas was basically the same. As Figure 4 shows,cumulative adoption of efficient equipment changed hardly at all in the retail and “other” sectorsduring the program period.
Figure 4Timing of Adoption of Electronic Ballasts and T-8 Lamlps by Market SegmentCumulative Percentage of Facilities by Year of First Adoption
70.0% l-—--——–------–--—–————-——— —.—.._.—— ———.—..—....—,
ma).-:5 50,0%c1If
%aJ 40.0% -g
5va 30.0%0.ualE.5 20.0%
0.0% ~--t---lpre 1992 1992 1993 1994 1995 1996 1997
Reported Year of First Purchaae of Electronic Ballasts or T-8 Lamps
I+ 1 Office/Corp Own
-=- 2 Office/Lease
3 Retail/Sole
,. 4 Ratail/Chain
-x-5 Institutional
+6 Other
*Grancl Total
The Market Effects of SDG &E’s dnd PG& E’s Commercial Lighting E@ency Progrums -7.295
Other Demand-Side Market Effects. Thesponsors’ programs reduced anumber of importantbamiers tocustomer adoption ofefficient fluorescent technologies. Mostimportantly, they:
● Increased customer awareness of efficient fluorescent technologies. Seventy-four percent ofprogram participants interviewed for the study reported that the main reason they had not used
electronic ballasts or T-8 lamps prior to program participation was that they were not aware ofthese products. 80 percent of participants in PG&E programs and 87 percent of participants in
SDG&E programs reported that their first purchases of electronic ballasts or T-8 lamps weremade through the programs.
● Increased customer awareness of the full range of benejits associated with efficientfluorescent technologies. Forty-one percent of customers in the program area mentioned
longer useful life in an unprompted question concerning the benefits of efficient fluorescentcomponents. By contrast, only 1 percent of non-program area customers mentioned thisbenefit. Virtually all program participants were able to name at least one legitimate benefit of
efficient fluorescent components. By contrast, 62 percent of program area nonparticipants and39 percent of nonprogram area customers were unable to name any legitimate product benefits.These results may indicate the educational effects of program participation.
. Helped customers reduce perceived costs of replacing inventories of standard equipment.Distributors and designers identified high first cost as the major barrier to adoption of efficientfluorescent products that the sponsors’ programs helped customers overcome. Surprisingly,only 19 percent of program participants mentioned high first cost as a reason for not buyingefficient fluorescent components prior to program participation. Fifty-one percent did mention,however, that the costs of maintaining inventories of both kinds of equipment did deter themfrom purchasing efficient equipment.
. Effect on organizational infrastructure for efficient equipment selection. Results of thecustomer survey showed that the presence of an energy manager and the application ofinvestment decision rules to lighting equipment selection were very strongly associated withpurchase of efficient equipment. We hypothesized that the sponsors’ programs may have
induced customers to hire energy managers in order to take advantage of the programs and thattheir experience in the programs may have accustomed them to applying payback analysis tolighting purchases. We found that the difference overall between program area and
nonprogram area customers on these two indicators was relatively small and not statisticallysignificant.
Market Effects in the Sponsors’ Service Territories: Supply-Side ActorsThe sponsors’ programs contributed to reducing a number of important barriers to the promotion of
efficient fluorescent technologies by supply-side actors in the sponsors’ service territories. Most
importantly, they:
. Encouraged distributors, designers and installers to use the provision of efficient equipmentas a strategy to gain and retain market share. By far the majority of designers and installers inthe sponsors’ service territories reported that they increased their promotion and specification ofefficient fluorescent components during the study period. About one-half of those reporting
such changes reported pro-actively promoting efficient equipment to their customers as acompetitive strategy. The rest reported responding to increased customer demand. Most
7.296- Rosenberg, et. al.
attributed increased customer demand for efficient components in part to the sponsors’
programs.
● Set the stage to make revisions in California’s Title 24 building code which effectivelyrequire the use of efficient components politically acceptable to most supply-side actors. The
impact of the utility programs in this area was strong. Prior to the rapid increase in efficientproduct penetration, the California Energy Commission had been hesitant to revise requiredLighting Power Densities. PG&E staff were deeply involved in the revision process for Title24 and forcefully advocated the reduction of Lighting Power Densities.
The Durability of Market Changes
We believe that evidence gathered through this study generally supports the conclusion that
current levels of market share for efficient components would persist in the absence of further localutility market interventions. This evidence includes:
. Persistence in the growth of market share both nationally and in the program area in the face ofdeclining utility support and incentive payments.
. Widespread awareness (facilities encompassing 70 percent of total floorspace) among end-usersof the benefits of efficient fluorescent lighting equipment.
● Low and declining incremental costs for efficient equipment..
● The promulgation of revisions to Title 24 which will effectively require the use of electronicballasts and T-8 lamps in most permitted construction.
We also identified evidence which suggests that the recent pace of growth in efficient productmarket share is unlikely to be sustained. This evidence includes the following.
. Despite a decade of intense promotion and plentiful rebates, the retail and miscellaneous sectorshave not adopted efficient fluorescent technology in great numbers. Moreover, adoption ofefficient products by smaller customers in virtually all sectors is relatively low.
. Manufacturers continue to resist the phase-out of magnetic ballasts and associated lamptechnology. This resistance may be prompted by fear of loss of market share in other countriesand loss of margin, which is relatively higher for magnetic than for electronic ballasts.
Lessons Learned
This project yielded a great deal of insight into the practicalities of conducting a large-scalemarket effects study and identified areas in which additional research would yield significant value.The most important of these for future studies are as follows.
Additional Analysis and Research Infrastructure. Size, segmentation, and current strategies of the Real Estate Management Industry. Nearly
50 percent of commercial floorspace is leased in the sponsors’ territories. In the leased officesector (22 percent of floorspace), lighting selection is entirely the province of the propertymanager. In the retail sectors, lessees exercise more choice, but not in all cases. A study of thesegments of the real estate management industry and the motives and modus operandi of thedenizens of those segments would benefit future program design.
The Market Effects of SDG &E’s and PG& E’s Commercial Lighting Eficiency Programs -7.297
● Sampleframefor market actors. At the moment, there are no accurate, comprehensive lists ofkey types of firms on the supply side: installers, designers, distributors. This situation defeatsthe implementation of probability-based estimation strategies for indicators such as marketshare of efficient products based on reports from distributors. Information from these sources isnonetheless valuable. For the time being, the samples for such interviews are necessarilyjudgmental and the process for selecting them needs to be made explicit in the evaluations.Future research on the commercial market would benefit from work to develop better sampleframe information on the companies that provide services to commercial building owners.
Comments on Research Methods. Assess hypotheses using multiple methods. Analyzing a hypothesis using two approaches –
say cross-sectional and historical – can help clarify the case for or against a hypothesizedmarket effect where the evidence from one approach or the other is indecisive. For example,we found that the percentage of organizations with energy managers was higher in the sponsors’program areas than in the non-program areas, but that the difference was not statisticallysignificant. However, we did not include questions in the survey regarding the extent to whichorganizations hired energy managers to take advantage of utility programs. Capturing such datawould have allowed us to better evaluate the cross-sectional findings in assessing programattribution.
● Think through the connection between customer survey results, shipment data, and othermarket share indicators. Appropriate indicators of market share and sources for these datavary by end-use technology. Market effects researchers need to think through the factorsrequired for integrating market share information in a variety of units from multiple sources indesigning their projects.
References
Eto, J., Prahl, R., and Schlegel, J. 1996. A Scoping Study on Energy-Eficiency Market Transformation
by California Utility DSM Programs. Berkeley, CA: Lawrence Berkeley National Laboratory.
Energy Information Administration 1995. Commercial Building Energy Survey: Energy End- Use
Intensities in Commercial Buildings, 1995.
XENERGY, 1996. 1996 Measure Cost Study, prepared for the California Demand-Side ManagementAdvisory Committee. May.
Easton Consultants 1997. New England C&I Lighting Market Transformation and Baseline Study
Final Report, July 1997.
Lawrence Berkeley National Laboratory 1997. Draft Report on Potential Impact of Possible Energy
Eficiency Levels for Fluorescent Lamp Ballasts, July 1997.
Heschong Mahone Group 1997 Lighting Eficiency Technology Report, Vol. 1-4, May 1997,
7.298- Rosenbmg, et. al.