the malign effects of drug and crime control policies on
TRANSCRIPT

Scholarship Repository Scholarship Repository University of Minnesota Law School
Articles Faculty Scholarship
2008
The Malign Effects of Drug and Crime Control Policies on Black The Malign Effects of Drug and Crime Control Policies on Black
Americans Americans
Michael Tonry University of Minnesota Law School, [email protected]
Matthew Melewski
Follow this and additional works at: https://scholarship.law.umn.edu/faculty_articles
Part of the Law Commons
Recommended Citation Recommended Citation Michael Tonry and Matthew Melewski, The Malign Effects of Drug and Crime Control Policies on Black Americans, 37 CRIME & JUST. 1 (2008), available at https://scholarship.law.umn.edu/faculty_articles/499.
This Article is brought to you for free and open access by the University of Minnesota Law School. It has been accepted for inclusion in the Faculty Scholarship collection by an authorized administrator of the Scholarship Repository. For more information, please contact [email protected].

Michael Tonry and Matthew Melewski
The Malign Effects of Drugand Crime Control Policieson Black Americans
ABSTRACT
The disproportionate presence of blacks in American prisons, jails, andDeath Rows, and the principal reasons for it-higher rates of commissionof violent crimes and racially disparate effects of drug policies and sen-tencing laws governing violent and drug crimes-are well known. Sincethe late 1980s, black involvement in violent crime has declined substan-tially, but racial disproportions have not. Blacks are six to seven timesmore likely than whites to be in prison. Nearly a third of young blackmen are under criminal justice system control. A third of black boys bornin 2001 are predicted to spend some time in prison. The simplest explana-tion for these patterns is that drug and sentencing policies that contributeto disparities have not been significantly changed in decades. The questionthen is, why not? The answer is that the white majority does not empa-thize with poor black people who wind up in prison. That in turn is be-cause recent punishment policies have replaced the urban ghetto, JimCrow laws, and slavery as a mechanism for maintaining white dominanceover blacks in the United States.
Seen from outside the United States, and, we expect, as it will be seen
by future generations of Americans, four aspects of contemporary
crime control policies stand out: the world's highest imprisonment
rate, the Western world's only use of capital punishment, the Western
world's most severe punishments short of death, and the effects of
those policies on black Americans. Gross racial disparities in impris-
Michael Tonry is Sonosky Professor of Law and Public Policy, University of MinnesotaLaw School, and senior fellow, Netherlands Institute for the Study of Crime and LawEnforcement. Matthew Melewski is a 2008 graduate of the University of Minnesota LawSchool. They are grateful to Alfred Blumstein, Richard Frase, Marc Mauer, Myron Or-field, and Kevin Reitz for helpful comments on earlier drafts.
© 2008 by The University of Chicago. All rights reserved.
0192-3234/2008/0037-0009$10.00

Michael Tonry and Matthew Melewski
onment and entanglement in the criminal justice system result partlyfrom racial differences in offending, but preponderantly from adoptionand continuation of drug and crime control policies that affect blackAmericans much more severely than whites. Much of the harm beingdone to disadvantaged black Americans and their loved ones in thename of crime control was, and is, avoidable.
The litany of ways crime control policies disproportionately affectblack Americans by now is so familiar as to be unsurprising. Blacksconstituted 12.8 percent of the general population in 2005 but nearlyhalf of prison inmates and 42 percent of Death Row residents. Im-prisonment rates for black men were nearly seven times higher thanfor white men. About a third of young black men aged 20-29 were inprison or jail or on probation or parole on an average day in 2005.The Bureau of Justice Statistics (BJS) estimated in 2003 that 32 percentof black men born in 2001 will spend some part of their lives in a stateor federal prison. That is a substantial underestimate of the likelihoodthat black men will spend time behind bars; it does not take accountof jail confinement, which is much more common than time in prison(Bonczar 2003; BJS 2007, tables 6.33.2005, 6.17.2006, 6.80.2007).
What is surprising is not that these things are true, but that they arewell known, have long been well known, and have changed little inrecent decades. Few people except academics and liberal law reform-ers-seemingly almost no policy makers-much notice or care. Theracial disparities caused by the federal 100-to-one law that punishescrack cocaine offenses much more severely than powder cocaine of-fenses were foreseeable when the law was passed (Tonry 1995, pp. 4-6)and were irrefutably documented long ago (McDonald and Carlson1993). The law remains in effect, successively endorsed by the Reagan,Bush I, Clinton, and Bush II administrations.'
To take another example, the Congressional Black Caucus, duringconsideration of federal crime legislation in 1994, fought hard for aRacial Justice Act that would allow statistics on racial disparities in
'The U.S. Sentencing Commission repeatedly urged the Congress to repeal or di-minish the crack/powder sentencing differential (e.g., U.S. Sentencing Commission 1995).Attorney General Janet Reno initially endorsed the commission's 1995 proposal to elim-inate the 100-to-one differential, and, backtracking, she and "drug czar" General BarryMcCaffrey later called for it to be reduced to 10-to-one, but to no avail (Tonry 2004,chap. 1). In 2007, the commission proposed amendment of guideline provisions that madefederal sentencing even tougher than the mandatory minimum law required. The Con-gress through inaction allowed the amendments to take effect. The statute itself, whichdoes the main damage, continued in effect early in 2008, unchanged.

Malign Effects 3
capital punishment to be introduced in death penalty cases. David Bal-
dus and his colleagues, using Georgia data on 2,000 cases from the1970s, had convincingly shown that the racial characteristics of murder
defendants and victims were powerfully associated with whether capi-
tal punishment is imposed (Baldus, Woodworth, and Pulaski 1990).Twenty-two percent of black killers of white victims were sentenced to
death compared with 3 percent of white killers of blacks (prosecutors
sought death in 70 percent of black-on-white killings and 19 percent
of white-on-black). The U.S. Supreme Court in McCleskey v. Kemp
(481 U.S. 279 [1987]) decided that such evidence was irrelevant indeciding claims about racial discrimination. Even though the court "as-
sumed the study is statistically valid" (n. 8), it ruled that a defendantalleging discrimination had to prove that the prosecutor in that par-ticular case had acted in a biased way. This is almost impossible to do;
bigoted officials seldom admit to acting in bigoted ways.For a time, it appeared likely that President Clinton would support
the caucus. In the end, he did not. Instead he signed the Violent CrimeControl and Law Enforcement Act of 1994, which created more than50 new federal capital offenses; the caucus's proposed provision had
been dropped (Gest 2001, pp. 230-35). For a few years in the 1990s,the caucus continued to support federal legislation attempting to re-
duce racial disparities in death penalty cases, but the issue gradually
died down. The proportion of blacks on Death Row was about the
same in 2007 as it had been in 1994.A third example: Daniel Patrick Moynihan in 1965 urged a contro-
versial welfare policy of benign neglect toward poor black Americans,
arguing that they needed mostly to be let alone to get on with theirlives. American crime control policies in the early twenty-first century
do the opposite of that. They diminish the life chances of black men(Western 2006; Provine 2007) and undermine the social fabric of manypoor black communities (Clear 2007).
Since at least 1980, American crime control policies have under-
mined achievement of full unbiased participation of black Americans
in the nation's social, economic, and political life. Modern wars on
crime and drugs, which date from the early 1970s, shortly after thefirst serious federal antidiscrimination laws were enacted, could notmore effectively have kept black Americans "in their place" had they
been designed with that aim in mind.The following list of social, vocational, educational, and economic

Michael Tonry and Matthew Melewski
differences between blacks and whites is drawn from the 2007 StatisticalAbstract of the United States:
* 33.3 percent of black children lived in households below the pov-erty line in 2004, compared with 14.2 percent of white children;
* the mortality rate for black infants in 2003 was 14 per 1,000 livebirths, compared with 5.7 per 1,000 for whites;
* per capita income for black Americans was $16,035 in 2004, com-pared with $25,203 for whites;
* 10 percent of adult blacks were unemployed and 35.8 percent werenot in the labor force in 2005, compared with 4.4 and 33.7 percentof whites;
* 17.6 percent of blacks 25 and older had college degrees in 2005,compared with 28 percent of whites; and
* 48.1 percent of blacks owned their own homes in 2005, comparedwith 72.7 percent of whites (U.S. Department of Commerce 2006,tables 107, 214, 575, 685, 693, 954).
Those differences have been at least exacerbated by, and are probablysubstantially attributable to, the nearly seven-to-one racial differencein imprisonment rates that has been typical for the past quarter century,the staggering difference in black and white men's lifetime chances ofgoing to prison, and the entanglement of a large minority of youngblack men in their 20s in the justice system at a time of life when otheryoung men are building careers and conventional lives (Western 2006).Accumulating bodies of research show that going to prison reducesemployment prospects and average and lifetime earnings (Fagan andFreeman 1999; Raphael, Holzer, and Stoll 2006) and reduces the laterwell-being of prisoners' children (Murray and Farrington, in this vol-ume). A different literature shows that disadvantaged communities aredamaged, not helped, when large numbers of their residents are sentto prison. Low levels of imprisonment at least arguably may preventcrime through deterrence, incapacitation, and removal of antisocial rolemodels; high levels cause crime rates to increase and neighborhoodsto deteriorate (Clear 2007; in this volume).
If incarceration rates for jail and prison together had remained at1970 levels (around 130 per 100,000) or at 1980 levels (around 200),American crime control policies would have bitten much less deeplyinto black American communities. American crime rates reached theirall-time high in 1981, so the 1980 comparison is probably the better

Malign Effects 5
one. Less than a third of black Americans in prison in 2008 would be
there had 1980 rates continued. Many fewer black men would havesuffered the pains of imprisonment, resulting stigma, and reduced em-
ployment prospects. There would have been many fewer broken black
families, fewer negative role models for black boys, and more marriage-able black men. There would have been less deterioration in poor black
communities because tipping points would not have been reached. At
a time when civil rights and welfare policies aimed at improving op-
portunities and living standards for black Americans, drug and crimepolicies worsened them.
Scholars have long paid attention to interactions among race, crime,
and criminal justice (e.g., Du Bois [1899] 1988; Myrdal 1944). The
modern literature dates from Alfred Blumstein's at the time courageous
1982 article showing that a principal reason why so many more blacks
than whites were in prison was that they were much more often ar-rested for the kinds of crimes that typically resulted in prison sen-
tences.2 The more serious the crime, the more fully offending patterns
appeared to explain racial disparities in imprisonment.3 That conclu-sion was tested in lots of ways-for example, by comparing racial pat-
terns in victims' identifications of assailants with racial patterns in
arrests and by comparing arrests and victims' reports to prison admis-
sions-but held up at least through the mid-1990s (Langan 1985;Tonry 1995, chaps. 2, 3).
Substantial literatures have continued to accumulate on racial pat-
2 "Courageous" because at the time racial issues were so sensitive that few scholars,
black or white, could write about racial differences in offending without being accusedof racism, blaming the victims of racial discrimination, or perpetuating racially harmfulstereotypes. William Julius Wilson, a black American who is among the most distinguishedand influential sociologists of his generation, wrote a landmark book, The Declining Sig-nificance of Race, in which he argued that poor blacks' main problem was not racism anddiscrimination per se but the deindustrialization of the American economy and the lossof semi- and unskilled industrial jobs in American cities (Wilson 1978). In the prefaceto his next major book, The Truly Disadvantaged, he observed that critics "either labeledme a neoconservative or directly or indirectly tried to associate The Declining Significanceof Race with the neoconservative movement.. . . I am a social democrat and probablyto the left politically of the overwhelming majority of these critics" (1987, p. viii).
3 Conversely, the less serious the offense, the less offending differences appeared toexplain disparities. For drug offenses, arrests are simply artifacts of police tactics andcannot sensibly be used as behavioral measures. Blumstein's article was controversial atthe time but in retrospect is easily consonant with research on sentencing outcomes,which generally shows few racial differences in the probability of imprisonment for themost serious offenses. The space for bias, unconscious stereotyping and attribution, andother nonoffense factors to affect outcomes increases as prison sentences become lesslikely (Spohn 2000).
Michael Tonry and Matthew Melewski
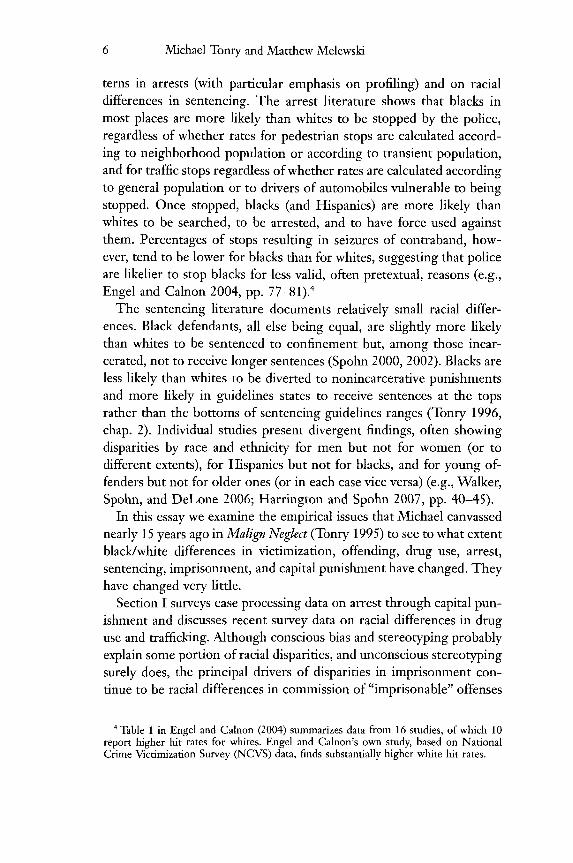
terns in arrests (with particular emphasis on profiling) and on racialdifferences in sentencing. The arrest literature shows that blacks inmost places are more likely than whites to be stopped by the police,regardless of whether rates for pedestrian stops are calculated accord-ing to neighborhood population or according to transient population,and for traffic stops regardless of whether rates are calculated accordingto general population or to drivers of automobiles vulnerable to beingstopped. Once stopped, blacks (and Hispanics) are more likely thanwhites to be searched, to be arrested, and to have force used againstthem. Percentages of stops resulting in seizures of contraband, how-ever, tend to be lower for blacks than for whites, suggesting that policeare likelier to stop blacks for less valid, often pretextual, reasons (e.g.,Engel and Calnon 2004, pp. 77-81). 4
The sentencing literature documents relatively small racial differ-ences. Black defendants, all else being equal, are slightly more likelythan whites to be sentenced to confinement but, among those incar-cerated, not to receive longer sentences (Spohn 2000, 2002). Blacks areless likely than whites to be diverted to nonincarcerative punishmentsand more likely in guidelines states to receive sentences at the topsrather than the bottoms of sentencing guidelines ranges (Tonry 1996,chap. 2). Individual studies present divergent findings, often showingdisparities by race and ethnicity for men but not for women (or todifferent extents), for Hispanics but not for blacks, and for young of-fenders but not for older ones (or in each case vice versa) (e.g., Walker,Spohn, and DeLone 2006; Harrington and Spohn 2007, pp. 40-45).
In this essay we examine the empirical issues that Michael canvassednearly 15 years ago in Malign Neglect (Tonry 1995) to see to what extentblack/white differences in victimization, offending, drug use, arrest,sentencing, imprisonment, and capital punishment have changed. Theyhave changed very little.
Section I surveys case processing data on arrest through capital pun-ishment and discusses recent survey data on racial differences in druguse and trafficking. Although conscious bias and stereotyping probablyexplain some portion of racial disparities, and unconscious stereotypingsurely does, the principal drivers of disparities in imprisonment con-tinue to be racial differences in commission of "imprisonable" offenses
'Table 1 in Engel and Calnon (2004) summarizes data from 16 studies, of which 10report higher hit rates for whites. Engel and Calnon's own study, based on NationalCrime Victimization Survey (NCVS) data, finds substantially higher white hit rates.

Malign Effects 7
and the foreseeable disparate effects on blacks and whites of policetactics in the war on drugs and sentencing policies for violent and drugoffenses.
Section II explains the patterns the preceding sections document.Because much racial disparity is attributable to the effects of policiesthat could have been foreseen to affect black offenders disproportion-ately severely and are now widely recognized to have that effect, thefundamental questions are how that could have happened and why ithas been allowed to continue to happen. The answer is that politicaland ideological exigencies of the last quarter century have conduced tothe adoption of crime control policies of unprecedented severity, theprimary burdens of which have been borne by disadvantaged blacks(and, increasingly, Hispanics). The history of American race relationshas produced political and social sensibilities that made white majori-ties comparatively insensitive to the suffering of disadvantaged blacks.
Section III proposes ways that avoidable disparities can be reduced.
I. Racial Differences in Criminal Justice System CaseProcessing
Here is what was known in the mid-1990s about racial disparities in
the criminal justice system (Tonry 1995, chap. 2). For a century beforethe 1960s black people had been more likely to be held in prison thanwhites. Racial disparities began to rise in the 1960s and then shot upto all-time highs in the 1980s: blacks by then were half of Americanprisoners, though only 12 percent of the U.S. population, and had animprisonment rate seven times higher than the white rate. Part of thereason for this was that blacks were sometimes treated more harshlythan whites for reasons of bias or unconscious stereotyping. A largerpart of the explanation, however, was that blacks were more likely thanwhites to be arrested for the "imprisonable" offenses of robbery, rape,
aggravated assault, and homicide. Victimization data on victims' de-scriptions of assailants and police data on victim and offender charac-teristics in homicide cases suggested that the racial offending patternsshown in arrest data for serious crimes were not far off from reality.Critically, however, there had been no significant shifts in racial pat-terns in arrests for a quarter century, and involvement in serious violent
crime could not explain why black imprisonment rates had risen sorapidly since the late 1960s. A principal driver of the increase was

Michael Tonry and Matthew Melewski
imprisonment for drug crimes (Blumstein and Beck 1999), and policymakers knew or should have known that the enemy foot soldiers inthe war on drugs would be young, disadvantaged, inner-city membersof minority groups (Tonry 1995).
Little in that paragraph would need to be changed to describe con-ditions in 2007 rather than in 1993-94. Racial differences in commis-sion of serious violent crimes continue to be an important contributorto imprisonment disparities, but the absolute overrepresentation ofblacks among arrestees has declined significantly. Imprisonment rates,however, were much higher in 2007 than in 1993, and with their in-crease the lifetime probability of imprisonment for black men and thepercentage of young black men under justice system control both in-creased substantially. The black fractions of the prison, jail, and DeathRow populations have changed little. Nor has the difference in blackimprisonment rates compared to white rates changed significantly. Pol-icies authorizing or requiring harsh punishments for drug offenses con-tinue to be one major contributor to racial disparities. Another is stag-gering increases in severity of sentences for violent crime: if 40-50percent of people arrested for violent crimes are black, then blackAmericans are foreseeably bearing the burdens of increased harshness.
A. Incarceration RatesFigure 1 shows black and white percentages of state and federal pris-
oners from 1950 to 2006. Blacks were about a third of prisoners in1960 and under 40 percent in 1970. The black percentage rose con-tinuously to the mid-40s around 1980, rising slowly thereafter until theearly 1990s and plateauing at about 50. For most years between 1991and 2002, in absolute numbers there were more black than white pris-oners. The black percentage has since declined slightly.
Calculation of trend data has been complicated by a BJS decisionbeginning in the late 1990s to report separate figures for blacks, whites,and Hispanics. In earlier years, Hispanics were included within racialcategories and sometimes also reported separately. The BJS change hadthe effect of reducing "black" imprisonment rates. In our view, skincolor and "racial" identity have been more salient social characteristicsin recent decades in the United States than the Hispanic/non-Hispanicdifference has been. Insofar as racial bias, stereotypes, and attributionshave influenced officials' decisions, appearance is much more likelythan a Hispanic surname or ancestry to have influenced decisions. Ac-

Malign Effects 9
100
8o t -jk90 -
so I-Blk]
70
60 %
, 50 .
40-
30
20
10
0
FiG. 1.-Percentage of state and federal prisoners, by race, 1950-2006. Sources: For1950-80: Cahalan (1986); for 1980-2006: BJS, "Prisoners," various years. Until the late1990s, race was broken down into three categories for all statistics: white, black, andother. In recent years, BJS added Hispanic as a racial category to various statistics, thuscomplicating linear representations of the data. In 1999, BJS added Hispanic as a racialcategory to combined state and federal prison statistics (skipping 1998 in the process).BJS also revised some data in later years, occasionally creating three different data pointsfor a single year. In 2004, BJS added the category of "two or more races," furthercomplicating the data. We have adopted the approach taken in Tonry (2005). The His-panic category has been removed and redistributed for every year since 1999. This re-distribution was made by examining the years 1990 and 1995, for which BJS has supplieddata both with and without a separate Hispanic category. Approximately one-fourth ofHispanics were formerly counted as black in those years, and three-quarters were countedas white. For all years, the most recent published BJS data were used, except for 1990and 1995. For those years, the older data without the Hispanic separation were used.The category of "two or more races" has been redistributed evenly between blacks andwhites.
cordingly, in figure 1 (and other figures) we adjusted BJS prison pop-ulation data to take account of the estimated black/white fractionsamong Hispanics.
The jail story is much the same, as figure 2 shows. About a third of
'The method for redistributing Hispanics was determined by examining 1990 and1995 data in which the BJS reported black/white figures including Hispanics and alsoreported Hispanics separately. For 1995, e.g., 17.6 percent of prisoners were classifiedas Hispanic. Excluding Hispanics, 45.7 percent of prisoners were black and 33.5 percentwere white. Including Hispanics, 49.9 percent were black and 47.7 percent were white.Simple math shows that approximately one-fourth of Hispanics were counted as blackand three-fourths as white (Tonry 2005, p. 1255, n. 99).

10 Michael Tonry and Matthew Melewski
70'
60' - - - - - -
j50-
40-
30.
20.
10-
0'
FIG. 2-Percentage of local jail inmates, by race, 1950-2006. Sources: For 1950-83:Cahalan (1986); BJS (1984, 1990); for 1983-89: BJS, "Jail Inmates," various years; for1990-95: Gilliard and Beck (1996); for 1996-2006: BJS, "Prison and Jail Inmates atMidyear," various years. BJS began using a separate Hispanics category much earlier inreporting jail data than in reporting prisoner data. For every year starting in 1990 theHispanic category has been removed and redistributed, estimating that one-fourth ofHispanics were previously counted as black and three-quarters were counted as white.
jail inmates were black in 1950 and about 40 percent in 1970, a levelaround which the black percentage oscillated until the late 1980s. Fora decade after that, coinciding with the most aggressive years of thewar on drugs, blacks were 45-48 percent of inmates, after which thepercentage declined somewhat. BJS data for the years 1990-2006 havebeen adjusted to distribute Hispanics between blacks and whites.
Because the preceding two figures are expressed in black/white per-centages, they do not reflect the true magnitude of racial differencesin imprisonment rates. It would be natural for someone new to thesubject to compare the black percentage of the general population(12-13 percent) to the black percentages of the combined jail andprison populations (48-50 percent) and conclude that blacks are fourtimes more likely to be confined than should be expected. The truedifference in recent years has typically been about seven times. Thereason is that whites are underrepresented in prison compared withtheir presence in the population and blacks are overrepresented. In2006, for example, the total imprisonment rate for black men for jail

Malign Effects 11
2800 -
2 600
200
200
1800
1600-
14001
1200-1000-
800-
200 White
FIG. 3.-Incarceration in state and federal prisons and local jails per 100,000, by race,1950-2006. Sources: BJS (1984, 1990; "Jail Inmates," various years; "Prisoners," variousyears; "Prison and Jail Inmates at Midyear," various years); Cahalan (1986); Gilliard andBeck (1996). The BJS occasionally publishes the number of prisoners in state and federalprisons and local jails, by race, as a ratio of the races' respective general populations (whatwe might call the total imprisonment rate). The publications are sporadic and interspersedwith the ratio only for state prisons, only for state and federal prisons, only for local jails,or (most commonly) only for males. This graph is based on data used in figs. 1 and 2,then compared with population statistics provided by the Census Bureau.
and prison combined was 4,789 per 100,000 residents and the whiterate was 737 per 100,000 (the corresponding rates for black and whitewomen were 358 and 94) (Sabol, Minton, and Harrison 2007, table14).6
Figure 3 shows aggregate black/white incarceration rates for jails andfederal and state prisons from 1950 to 2006. Black rates dwarf thoseof whites. The increase in the black rate between 1980 and 2006 (1,834
'These numbers understate the rates since, per current BJS practice, Hispanic blacksand whites are excluded.
12 Michael Tonry and Matthew Melewski
900- en5o-
800-
750-
mOwijitel
7 00- c
650-
600,S550
~500-~450-
J@ 40D
*~300
250 20
200-
150- 126 17 139 137
100-1
-50.. P 4 '1 'e' 0 4 , 0, , i 1
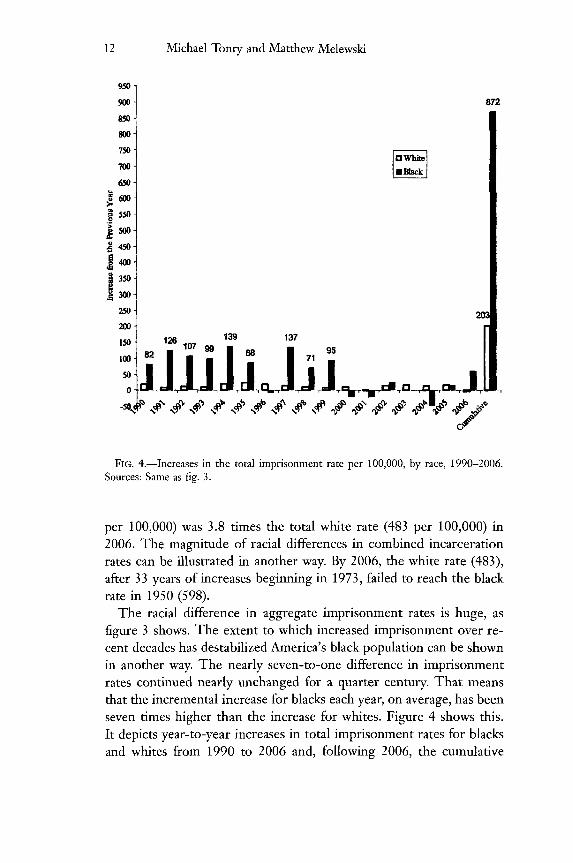
FIG. 4.-Increases in the total imprisonment rate per 100,000, by race, 1990-2006.Sources: Same as fig. 3.
per 100,000) was 3.8 times the total white rate (483 per 100,000) in2006. The magnitude of racial differences in combined incarcerationrates can be illustrated in another way. By 2006, the white rate (483),after 33 years of increases beginning in 1973, failed to reach the blackrate in 1950 (598).
The racial difference in aggregate imprisonment rates is huge, asfigure 3 shows. The extent to which increased imprisonment over re-cent decades has destabilized America's black population can be shownin another way. The nearly seven-to-one difference in imprisonmentrates continued nearly unchanged for a quarter century. That meansthat the incremental increase for blacks each year, on average, has beenseven times higher than the increase for whites. Figure 4 shows this.It depicts year-to-year increases in total imprisonment rates for blacksand whites from 1990 to 2006 and, following 2006, the cumulative

Malign Effects 13
2500
2000, -. -.
1500-
1000- bt
500-
1ooo / /
FIG. 5.-Prisoners under sentence of death, by race, 1968-2006. Source: Snell (2007)
increases. In 9 of the 17 years shown, the increase in black imprison-
ment rates exceeded 70 per 100,000. In four of those years, the increase
exceeded 100 per 100,000. Those 1-year increases exceed the total im-
prisonment rates of Canada and most European countries. Over 17
years, the black rate increased by 872 per 100,000 and the white rate
by 203, a difference approaching 500 percent.Racial disparities on Death Row parallel those for imprisonment
generally. Figure 5 shows absolute numbers of blacks and whites on
Death Row. The black fraction has not changed significantly for 25
years, despite a steep decline in homicide rates and despite, as we show
below, a significant decline in the percentages of blacks arrested forhomicide.
The disproportionate presence of blacks in American prisons and
jails has not changed substantially since 1980. The important question
is why.
In 2005, the imprisonment rates for the Scandinavian countries ranged between 70and 85 per 100,000 population. The rates for France, Germany, Belgium, and Austriawere under 100 per 100,000. The Canadian rate was just above 100 per 100,000 (Walmsley2007).

14 Michael Tonry and Matthew Melewski
B. Racial Differences in Criminality as Explanations for ImprisonmentRates
Twenty-five years ago possible explanations for why the prison pop-ulation was nearly half black were contentious and hotly disputed. Sus-picions that criminal justice officials were racially biased and laboredunder the influence of racial stereotypes detrimental to blacks werewidespread (e.g., American Friends Service Committee 1971). Withina decade, however, a consensus view emerged that, though bias andstereotyping existed, they were not the primary drivers of racial dis-parities in imprisonment. For serious violent crimes, a primary driverwas racial differences in offending. Blacks committed homicides, rapes,robberies, and serious assaults at much higher rates than whites did.Much violent offending is intraracial. Failure to take black offenders'violent crimes seriously in effect would constitute indifference to blackvictims' violent victimization, and few people would want to do that.Racial disparities preponderantly based on offending differences weredifficult to challenge on normative grounds.
There were two important caveats to the explanation that differencesin racial offending explain differences in imprisonment. First, it appliedmostly to serious violent offenses; for less serious offenses, offendingexplained much less of imprisonment disparities. For the most seriouscrimes, the crime itself appeared to be the primary factor explainingsentencing decisions, leaving comparatively little room for bias or ste-reotyping to operate. Less serious crimes allowed more room for dis-cretionary decision making and the crime explained less. Second, forsome crimes, arrest differences have no necessary link to offendingdifferences; drug arrests are the most important example. Police canarrest street-level inner-city drug dealers almost at will, meaning thatarrests are more a measure of police than of criminal activity. Dispar-ities in arrests for drug offenses are the result of police policy choices.
The preceding paragraphs summarize analyses catalyzed by a land-mark article by Alfred Blumstein (1982) that compared racial differ-ences in arrests to racial differences in imprisonment, by offense andoverall. It prompted additional more refined analyses by others (e.g.,Langan 1985; Tonry 1995). The basic conclusion held up and wasbroadly confirmed by research on sentencing disparities that generallyconcluded that there are few racial differences in sentence lengths foroffenders sent to prison (presumably mostly for more serious offensesand more chronic offenders); disparities are much more likely con-

Malign Effects 15
cerning the in/out decision (typically often concerning less serious of-fenses and offenders) (Blumstein et al. 1983; Spohn 2000; Harringtonand Spohn 2007).
In this subsection, we summarize Blumstein's analysis, replicate theanalysis for the year 2004, and consider other sources of data thatmight confirm or refute conclusions reached.
1. Blumstein's Original Analysis. Blumstein compared racial per-centages among arrestees for particular offense categories to racial per-centages among state prisoners sentenced following convictions forthose offenses. Lots of questions can be raised as to whether arrestsare a valid measure of offending (e.g., they might be systematicallybiased or erratically incomplete), whether jail inmates should have beentaken into account, and whether they should be compared with racialpatterns in prison admissions rather than in prison populations.8 Wereturn to some of those questions below. First we present Blumstein'sanalysis.
Table 1 sets out Blumstein's original analysis and adds one additionalcolumn of information. Columns 1 and 2 show black/white percentagesamong people serving prison sentences in 1979 for 11 offense cate-gories and overall. Columns 3 and 4 show black/white percentages ofpeople aged 18 and up arrested in 1979 for those offense categoriesand overall. Column 6, which was not in Blumstein's analysis, com-pares the black percentages in the preceding columns and shows, forexample, that black arrests for homicide account for all but 1.3 percentof the black percentage among people imprisoned for homicide. Theunexplained variations among people imprisoned for robbery and ag-gravated assault are larger, but still small. For lesser assaults, auto theft,and burglary, the unexplained variation ranges from 16.6 to 29.8 per-cent, with the largest unexplained variation being for drug crime (36.7percent).
Blumstein used a different analysis. Results are shown in column 5.He compared black imprisonment relative to arrests to white impris-onment relative to arrests. Whites were relatively underrepresented inprison compared with their presence among arrestees (e.g., 47.7 per-cent of homicide prisoners but 48.5 percent of homicide arrestees; 57.7
8 Blumstein (1982) identifies others. Use of aggregate national data, e.g., could cam-
ouflage stark differences between states (some of which might be very discriminatory,but this would pass unrecognized) and overlook offsetting racial biases (e.g., punishingblacks with white victims very harshly while punishing crimes involving black victimsleniently or not at all).

16 Michael Tonry and Matthew Melewski
TABLE 1
Comparison of Crime-Specific Percentage of Blacks in State Prisonand in Arrests, 1979
% Black PrisonersUnexplained by
Prisoners Arrests Arrest
Between Within
White Black White Black Races RaceCrime (1) (2) (3) (4) (5) (6)
Murder and nonnegligentmanslaughter 47.7 52.3 48.4 51.6 2.8 1.3
Forcible rape 43.7 56.3 51.3 48.7 26.3 13.5Robbery 38.8 61.2 42.9 57.1 15.6 6.7Aggravated assault 57.7 42.3 59.0 41.0 5.2 3.1Other violent 53.1 46.9 60.9 39.1 27.3 16.6Burglary 57.7 42.3 67.1 32.9 33.1 22.2Larceny/auto theft 50.7 49.3 65.4 34.6 45.6 29.8Other property 64.4 35.6 65.4 34.6 4.3 2.8Drugs 60.5 39.5 75.0 25.0 48.9 36.7Public order 61.4 38.6 69.3 30.7 29.5 20.5Other 71.7 28.3 66.3 33.7 -28.7 -19.1Total 50.9 49.14 56.6 43.45 20.5 11.6
SOURCE.-Blumstein (1982).
percent of burglary prisoners but 67.1 percent of burglary arrestees).He thus compared blacks' presence in prison given an arrest for aparticular offense to whites' presence. Between-race calculations (col.5) produce higher rates of unexplained variation than do within-racecalculations (col. 6) (20.5 percent overall compared with 11.6), but theresults using either calculation were inconsistent with the hypothesisthat racial bias and stereotyping explained the largest part of disparitiesin imprisonment rates for serious crimes.
Two primary objections to Blumstein's analysis are that arrests maythemselves be a biased basis for comparison and that prison populationdata reflect a combination of prison admission rates with sentencelengths. Patrick Langan (1985) explored these objections. His aim wasto get behind arrests by looking at data on assailants identified byvictims and, to avoid the confounding interaction effects of prison ad-mission rates and average sentence lengths, by looking at prison ad-mission rates alone. He compared data from the NCVS for 1973, 1979,and 1982 on victims' characterizations of their assailants' race withracially disaggregated data on prison admissions. Because victimization
Malign Effects 17
TABLE 2
Comparison of Crime-Specific Percentage of Blacksand in Arrests, 2004
in State Prison
% Black PrisonersUnexplained by
Prisoners Arrests Arrest
Between WithinWhite Black White Black Races Race
Crime (1) (2) (3) (4) (5) (6)
Murder and nonnegligentmanslaughter 48.9 51.1 52.0 48.0 11.6 6.0
Forcible rape 61.7 38.3 67.7 32.3 23.2 15.7Robbery 37.6 62.4 49.0 51.0 37.2 18.2Assault 53.3 46.7 73.5 26.5 58.8 43.2
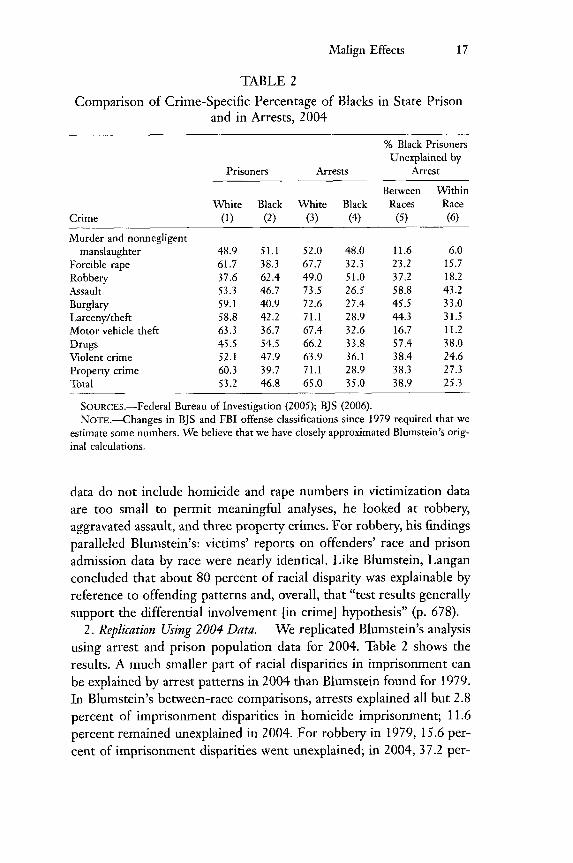
Burglary 59.1 40.9 72.6 27.4 45.5 33.0Larceny/theft 58.8 42.2 71.1 28.9 44.3 31.5Motor vehicle theft 63.3 36.7 67.4 32.6 16.7 11.2Drugs 45.5 54.5 66.2 33.8 57.4 38.0Violent crime 52.1 47.9 63.9 36.1 38.4 24.6Property crime 60.3 39.7 71.1 28.9 38.3 27.3Total 53.2 46.8 65.0 35.0 38.9 25.3
SOURCEs.-Federal Bureau of Investigation (2005); BJS (2006).NoTE.-Changes in BJS and FBI offense classifications since 1979 required that we
estimate some numbers. We believe that we have closely approximated Blumstein's orig-inal calculations.
data do not include homicide and rape numbers in victimization dataare too small to permit meaningful analyses, he looked at robbery,aggravated assault, and three property crimes. For robbery, his findings
paralleled Blumstein's: victims' reports on offenders' race and prisonadmission data by race were nearly identical. Like Blumstein, Langanconcluded that about 80 percent of racial disparity was explainable byreference to offending patterns and, overall, that "test results generally
support the differential involvement [in crime] hypothesis" (p. 678).2. Replication Using 2004 Data. We replicated Blumstein's analysis
using arrest and prison population data for 2004. Table 2 shows theresults. A much smaller part of racial disparities in imprisonment can
be explained by arrest patterns in 2004 than Blumstein found for 1979.In Blumstein's between-race comparisons, arrests explained all but 2.8
percent of imprisonment disparities in homicide imprisonment; 11.6
percent remained unexplained in 2004. For robbery in 1979, 15.6 per-cent of imprisonment disparities went unexplained; in 2004, 37.2 per-

18 Michael Tonry and Matthew Melewski
4JJ - -32.9 3.
~'30-
20F
0o-- -r---
omicift Rvpe Robbery Aravat d Assaul
FIG. 6-Black percentages among Uniform Crime Report violent index arrestees,
1982-2006 (5-year averages). Source: Federal Bureau of Investigation, Crime in the UnitedStates, various years.
cent. Overall, Blumstein's 1979 analysis left 20.5 percent of impris-
onment disparities unexplained. He replicated the analysis using 1991
data and concluded that unexplained disparities had increased to 25
percent (Blumstein 1993). Our 2004 analysis left 38.9 percent unex-
plained. Had Blumstein in his 1982 article found unexplained dispar-
ities as large as we find for 2004, surely his conclusion would have
been the opposite of what it was: such large unexplained variation cre-
ates a strong presumption of racial bias.In trying to understand why the results are so different for 2004, we
looked at racial trends in arrest patterns. Perhaps black percentages
among arrestees for serious crimes rose rapidly after 1979, with black
percentages in 2004 being anomalously low. As figure 6 shows, how-
ever, the opposite is true. Black Americans' involvement in violence is
declining. The figure shows black percentages, averaged over 5-year
periods, among people arrested for homicide, forcible rape, robbery,
and aggravated assault. Although black Americans continue to be
overrepresented among arrestees, the degree of overrepresentation has
been falling for a quarter century. Fifty-six percent of homicide arrest-
ees in 1992-96 were black; 49 percent were in 2002-6. In 1982-86, 49
percent of rape arrestees were black; 33 percent were in 2002-6. The
declines are almost as steep for robbery and aggravated assault. That's

Malign Effects 19
100... -Robbey Anrus- - Robbery, as reported by victim
90 -- Aggravated Assault Arestsgo- - *Aggravated Assaulk as i-pozted byvktiam
70
60 .- . ......50
40
20
10
FIG. 7.-Percentage of blacks among lone offenders as perceived by victims and per-centage of black arrests, 1978-2005. Sources: BJS, Sourcebook of Criminal ustice Statistics(http://www.albany.edu/sourcebook/), various years; Federal Bureau of Investigation,Crime in the United States, various years.
good news: black involvement in serious violent crime has been de-
clining.Perhaps, we thought, the explanation is to be found in changes in
arrest data that operated to underreport black violence. To check this,
using NCVS data we compared arrest percentages with robbery and
aggravated assault victims' characterizations of the racial characteristics
of their assailants. Figure 7 shows the result: no significant change in
a quarter century. Black percentages among arrestees for both offenses
have consistently tracked victims' characterizations but been higher.
The reason is at least in part that many robberies and assaults involve
more than one assailant, and the NCVS data pertain to crimes involv-
ing lone offenders.
So why are so many blacks in prison compared with whites? That
question can be answered at (at least) two levels. The first, which we
discuss in the remaining portion of this section, is mechanical: what
are the mechanisms that put more blacks in prison than their popu-
lation or crime participation percentages appear to justify? The second,
which we discuss in Section II, is more difficult: what is it about Amer-
ican society and cultural norms that allowed those mechanisms to exist
and allows them to persist?
20 Michael Tonry and Matthew Melewski
C. What Are the Direct Causes of Racial Disparities in Imprisonment?
There are four plausible explanations for why there are so manymore black prisoners than offending patterns suggest there should be.
First, invidious bias and conscious stereotypes ("Many young blackmen are dangerous, so I must treat this young black man harshly") may
cause police, prosecutors, and judges to treat black defendants moreseverely than they treat whites. Second, subtler forms of subconscious
stereotyping and attribution may be operating. Third, disparities may
be worsened by police practices that disproportionately affect blacks.
Fourth, disparities may be worsened by sentencing policies relating toviolent and drug crimes.
1. Bias and Conscious Stereotyping. We have the least to say about
this hypothesis. No doubt some Americans, including some public offi-
cials, are racists and are biased against blacks. Larger numbers are no
doubt affected by conscious stereotypes about blacks. Still more engagein "statistical discrimination," the attribution of traits that characterize
groups to individual members of groups. This is one central issue in
analyses of racial profiling. If many young black men in particular
neighborhoods, who adopt particular styles of dress, are involved in
gang activities or drug dealing, police seeing a young man in that
neighborhood who fits that pattern may believe it likely that he is a
gang member or drug dealer and stop him, even if the individualized
basis for a stop that the law requires does not exist. To a police officer,
this may seem an obvious and sensible thing to do. To a civil libertar-
ian, such a stop is an obvious and intolerable instance of crude racial
stereotyping. Efforts to establish from police stop data whether "yields"
or "hit rates" for blacks and whites stopped by the police are higher
or lower effectively assume that this form of statistical stereotyping
could be acceptable: if blacks are stopped at twice the rate of whites
but contraband is found in the same or a higher percentage of cases,
that implicitly demonstrates that police are not acting in an invidious
way but have valid reasons more often to be suspicious of blacks.The effects of bias and stereotyping are likely to be different at
police and sentencing stages. Research on profiling generally concludes
that police do stop blacks disproportionately often on the streets and
on the highway, generally do not achieve higher hit rates for blacks
than for whites (e.g., Engel and Calnon 2004), but usually make more
arrests. Inevitably this means that police practices lead to higher levels
of black arrests, and therefore convictions and prisoners, than would

Malign Effects 21
otherwise exist. These practices are particularly likely to worsen racialdisparities for drug and firearms offenses since those are the two kindsof illegal contraband police stops are most likely to yield. We discussthis further below in relation to drug policy.
On the basis of personal interactions over decades with judges inmany American jurisdictions, we do not believe that invidious racialbias and gross stereotypes are likely substantially to affect sentencingdecisions. This is a subject judges worry about and discuss often amongthemselves and with others. Sentencing research showing that thereare few racial differences in sentence lengths is consistent with ourbelief (e.g., Spohn 2000, 2002). Sentencing research showing that thereare often in/out differences is not necessarily strongly inconsistent withit. Black defendants, especially young ones, often have more extensivecriminal records than whites, and judges take criminal records intoaccount when deciding which defendants "deserve another chance."Similarly, black defendants on average have less stable home lives, lessconventional employment records, and fewer educational attainmentsthan whites, and judges take such things into account in deciding whichdefendants are more likely to succeed in community sentences andprograms and which are more likely to reoffend.9
2. Unconscious Stereotyping and Attribution. In some ways it is sur-prising that the literature on sentencing disparities shows compara-tively few differences in outcomes on the basis of race. Recent researchon "colorism" and the significance of Afrocentric features in stereo-typing offenders shows that stereotypes are deeply embedded in Amer-ican culture and affect both white and black people (the fullest exam-ination of this literature can be found in Blank, Dabaddy, and Citro[2004]). Analysts of "Afrocentric feature bias" posit that certain stereo-typically African American facial features influence decision makers'(and research subjects') judgments about individual offenders. Al-though the number of studies is small, their implications are disturbing.One study found that people with more Afrocentric features appearedmore "criminal" to observers and that the more Afrocentric features
9 Our point in the text is not that the practices described in this and the precedingsentence are necessarily unobjectionable, but that many judges engage in them in goodfaith. Argument can be made that black defendants acquire more extensive criminalrecords at younger ages than whites because police are more likely to arrest them, andaccordingly that the criminal record at least in part is more a product of police than ofcriminal activity, and in fairness should not be held against black defendants. Similarly,objections have long been made to taking account of social factors (household stability,employment, education) in sentencing, precisely because they are correlated with race.

22 Michael Tonry and Matthew Melewski
an individual possessed, the more "criminal" he appeared (Eberhardtet al. 2004). In other studies, Afrocentric features were associated withlonger prison sentences and increased frequency of capital sentencing(Blair, Judd, and Fallman 2004; Eberhardt et al. 2006).1"
The study of Afrocentric feature bias emerged from research on"colorism," discrimination within racial groups on the basis of grada-tions in skin color (Jones 2000). Many studies have shown that peopleassociate lighter skin tones among blacks with positive characteristicsand darker skin tones with negative characteristics (e.g., Maddox andGray 2002), but no published work has investigated colorism in crim-inal justice settings.
Several recent studies have tried to assess the significance of Afro-centric feature bias. Blair et al. (2002) found that individuals with moreAfrocentric features were judged by college undergraduates to havestereotypical African American traits. Blair, Chapleau, and Judd (2005)showed that research subjects believed that individuals with more Af-rocentric features were likely more often than others to behave ag-gressively.
Eberhardt et al. (2004) asked 182 police officers to examine photo-graphs of male students and employees at Stanford University. Halfwere shown white faces and half were shown black faces. One-third ofthe officers were asked to rate the stereotypicality of each face on ascale, that is, how stereotypical each face was of members of the per-son's race. Another third, told that some of the faces might be of crim-inals, were asked to indicate whether the person "looked criminal."The last third were asked to rate attractiveness on a scale. Each officercompleted only one of the three measures.
More black than white faces were thought to look criminal. Blackfaces rated above the median for stereotypicality were judged as crim-inal significantly more than were black faces rated below the median.The opposite was found for white faces. The authors concluded thatthe police officers thought that black faces looked more criminal andthat "the more black, the more criminal" (Eberhardt et al. 2004, p.889).
Blair, Judd, and Chapleau (2004) analyzed the Afrocentric features
0 Another explanation is that many biases people harbor are not consciously accessible.
The Implicit Association Test, which has been used to assess implicit attitudes towarddifferent groups, has shown a significant implicit preference for whites among all racesand ethnicities (Greenwald and Krieger 2006).

Malign Effects 23
of inmates in the Florida Department of Corrections database. They
asked undergraduates to rate the faces of a randomly selected sample
of 216 inmates, 100 black and 116 white, in terms of the "degree towhich each face had features that are typical of African Americans" (p.
676). After they controlled for race and criminal history, Afrocentric
features were a significant predictor of sentence length. Within each
race, more Afrocentric features were associated with longer sentences."'
Pizzi, Blair, and Judd (2005, p. 351) argued that judges and prose-
cutors have adapted to differences between racial groups but have not
been sensitized to sentencing differences on the basis of Afrocentric
features: "Racial stereotyping in sentencing decisions still persists. Butit is not a function of the racial category of the individual; instead,
there seems to be an equally pernicious and less controllable process
at work. Racial stereotyping in sentencing still occurs based on the
facial appearance of the offender. Be they White or African American,
those offenders who possess stronger Afrocentric features receiveharsher sentences for the same crimes."
Eberhardt et al. (2006, p. 383), using a database of death-eligible
cases in Philadelphia, "examined the extent to which perceived stereo-typicality of Black defendants influenced jurors' death-sentencing de-
cisions in cases with both White and Black victims." Stanford under-
graduates were shown pictures of 44 defendants, presented randomly
and edited for uniformity, and asked to rate the stereotypicality of each
black defendant's appearance. With stereotypicality as the only inde-
pendent variable, 24.4 percent of black defendants rated below the
median for stereotypicality received a death sentence, compared with57.5 percent of black defendants rated above the median.
3. Drug Policy. American drug policies are a primary aggravator of
racial disparities in imprisonment. Blumstein's 1982 analysis of 1979
prison population showed that arrest patterns for drug offenses ex-
plained the smallest percentage of racial disproportionality in impris-
onment (48.9 percent unexplained) of any offense category at a timewhen 5.7 percent of prisoners (about 16,000 total) had been convicted
of drug crimes (see table 1). Our analysis of 2004 data again showed
" Blair, Judd, and Fallman (2004, p. 677) note, however, that this does not necessarilyimply explicit bias: "this form of stereotyping appears to occur without people's awarenessand outside their immediate control."
24 Michael Tonry and Matthew Melewski
100
90-WiW
80
70 .
60-
50-
40-
30
20
10
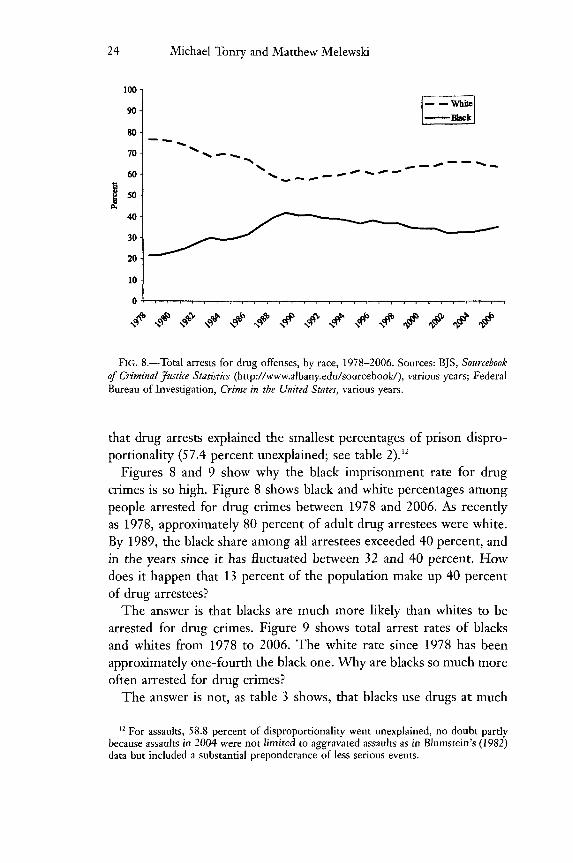
FIG. 8.-Total arrests for drug offenses, by race, 1978-2006. Sources: BJS, Sourcebookof Criminal Justice Statistics (http://www.albany.edu/sourcebook/), various years; FederalBureau of Investigation, Cime in the United States, various years.
that drug arrests explained the smallest percentages of prison dispro-portionality (57.4 percent unexplained; see table 2).12
Figures 8 and 9 show why the black imprisonment rate for drugcrimes is so high. Figure 8 shows black and white percentages amongpeople arrested for drug crimes between 1978 and 2006. As recentlyas 1978, approximately 80 percent of adult drug arrestees were white.By 1989, the black share among all arrestees exceeded 40 percent, andin the years since it has fluctuated between 32 and 40 percent. Howdoes it happen that 13 percent of the population make up 40 percentof drug arrestees?
The answer is that blacks are much more likely than whites to bearrested for drug crimes. Figure 9 shows total arrest rates of blacksand whites from 1978 to 2006. The white rate since 1978 has beenapproximately one-fourth the black one. Why are blacks so much moreoften arrested for drug crimes?
The answer is not, as table 3 shows, that blacks use drugs at much
2 For assaults, 58.8 percent of disproportionality went unexplained, no doubt partly
because assaults in 2004 were not limited to aggravated assaults as in Blumstein's (1982)data but included a substantial preponderance of less serious events.

Malign Effects 25
1,600 F - Whku
1,400
1,200
S1,000
goo
400-
40200 * 0 10 10 -1 e 1 0 4"
FIG. 9.-Total arrest rate for drug offenses, by race, 1978-2006. Sources: BJS, Sourcebook
of Criminal Justice Statistics (http://www.albany.edu/sourcebook/), various years.
higher rates than whites do. National Institute of Drug Abuse surveyshave tracked self-reported drug use since the 1970s. The table showspercentages of blacks and whites who reported using alcohol, any otherdrugs, and four categories of illicit substances ever, in the last year, andin the last month. In 2005 and 2006, larger percentages of whites re-ported using alcohol, cocaine (including crack), and hallucinogens, andthe differences are large. Larger percentages of whites than blacks re-port having ever used marijuana, and slightly higher percentages of
blacks report using marijuana recently. Only for crack (consideredalone) do blacks report significantly higher use levels than whites, butthe absolute levels are low. One conclusion is clear: the reason so manymore blacks than whites are arrested or imprisoned for drug crimes isnot that they use drugs much more extensively than whites do.
Another plausible reason why blacks might more often be arrested
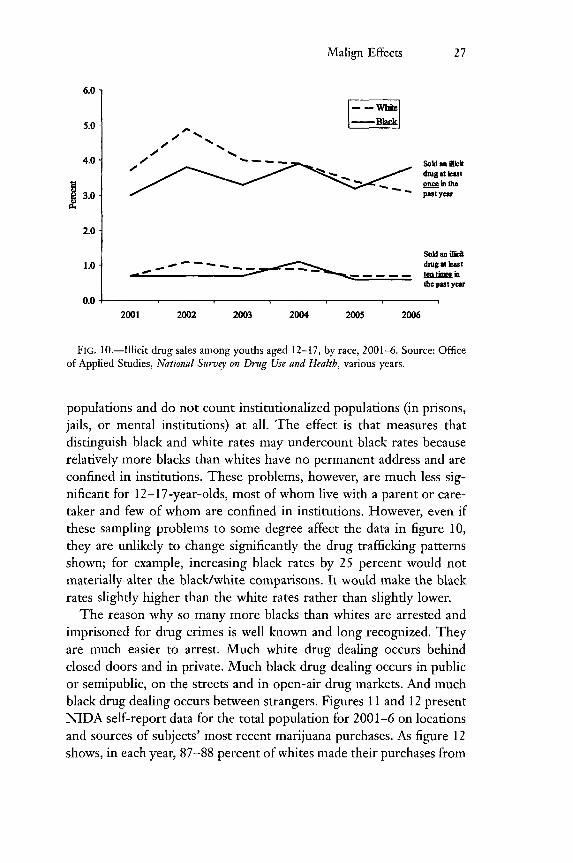
for drug crimes than are whites is that they are much more extensivelyinvolved in drug trafficking. National Institute of Drug Abuse (NIDA)surveys based on representative samples of the U.S. population indicatethat this is not true. 3 Figure 10 shows self-reported drug selling by
" In recent years, reports of the National Survey on Drug Use and Health have iden-tified the author as the Office of Applied Studies, Substance Abuse and Mental Health

26 Michael Tonry and Matthew Melewski
TABLE 3
Percentage of Drug Use, by Race, 2005-6
2005 2006
Drug White Black White Black
Alcohol:Ever used 86.9 75.2 86.9 75.4Within last year 70.5 55.5 70.4 55.1Within last month 56.5 40.8 55.8 40.0
All illicit drugs:*Ever used 48.9 44.7 49.0 42.9
Within last year 14.5 16.0 14.8 16.4Within last month 8.1 9.7 8.5 9.8
Marijuana:Ever used 43.7 39.0 43.9 37.6Within last year 10.6 12.3 10.7 12.4
Within last month 6.1 7.6 6.4 7.4Cocaine:'
Ever used 15.5 9.8 16.3 9.1Within last year 2.4 2.0 2.5 2.1Within last month 1.0 1.1 .9 1.3
Crack:Ever used 3.2 4.9 3.3 5.3Within last year .5 1.2 .5 1.3Within last month .2 .8 .2 .8
Hallucinogens:Ever used 16.3 6.5 17.0 6.6Within last year 1.8 .8 1.7 1.4Within last month .5 .2 .4 .5
SouRcE.-Office of Applied Studies, National Survey on Drug Use and Health, variousyears.
* Illicit drugs include marijuana/hashish, cocaine (including crack), heroin, hallucin-
ogens, inhalants, or prescription-type psychotherapeutics used nonmedically.I Includes crack cocaine.
12-17-year-old blacks and whites for the years 2001-6. Three to fourpercent of both groups reported selling drugs at least once in the pre-
ceding year, and 1 percent reported selling drugs at least 10 or moretimes during the preceding year. The black and white rates for mostmeasures are nearly identical; on average for the entire period and formost years, white rates are slightly higher than black rates.
Representative national surveys undercount transient and homeless
Services Administration, which is how we refer to data from the survey in source notes.Predecessor surveys were published by the NIDA. Because most readers will be morefamiliar with that attribution, we refer to NIDA when discussing survey data in the text.
Malign Effects 27
6.0-
5.0 -Bb-
4.0 0 -01 Soldaml it
dug at leut3.0~o n tha
2.0- past yew
2.0-
Sold an alcit1.0- drug at Imt
the put year
0.0
2001 2002 2003 2004 2005 2006
FIG. 10.-Illicit drug sales among youths aged 12-17, by race, 2001-6. Source: Officeof Applied Studies, National Survey on Drug Use and Health, various years.
populations and do not count institutionalized populations (in prisons,jails, or mental institutions) at all. The effect is that measures thatdistinguish black and white rates may undercount black rates becauserelatively more blacks than whites have no permanent address and areconfined in institutions. These problems, however, are much less sig-nificant for 12-17-year-olds, most of whom live with a parent or care-taker and few of whom are confined in institutions. However, even ifthese sampling problems to some degree affect the data in figure 10,they are unlikely to change significantly the drug trafficking patternsshown; for example, increasing black rates by 25 percent would notmaterially alter the black/white comparisons. It would make the blackrates slightly higher than the white rates rather than slightly lower.
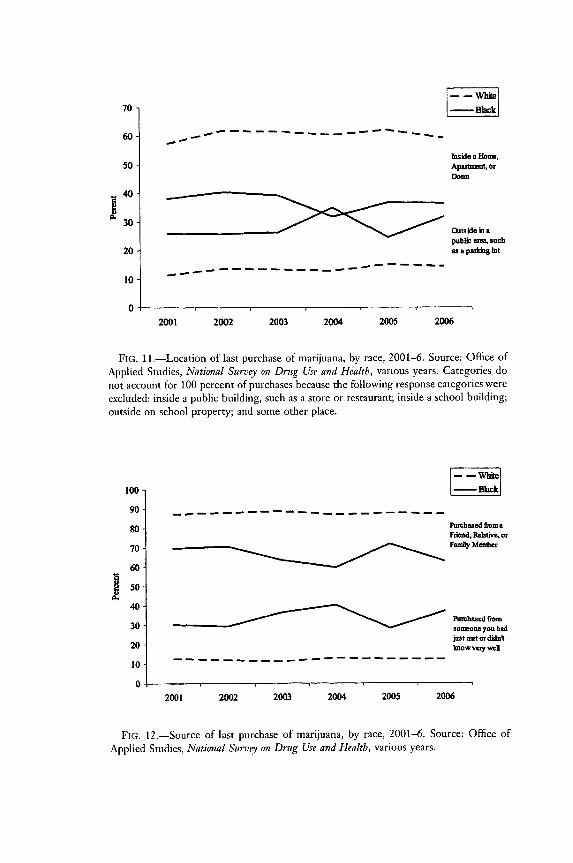
The reason why so many more blacks than whites are arrested andimprisoned for drug crimes is well known and long recognized. Theyare much easier to arrest. Much white drug dealing occurs behindclosed doors and in private. Much black drug dealing occurs in publicor semipublic, on the streets and in open-air drug markets. And muchblack drug dealing occurs between strangers. Figures 11 and 12 presentNIDA self-report data for the total population for 2001-6 on locationsand sources of subjects' most recent marijuana purchases. As figure 12shows, in each year, 87-88 percent of whites made their purchases from
1--wa
lnslde a Hoe,Apafantet, or
oasna
Outside in apublic aes, suchas a padkdg lot
2001 2002 2003 2004 2005 2006
FIG. 1 .- Location of last purchase of marijuana, by race, 2001-6. Source: Office ofApplied Studies, National Survey on Drug Use and Health, various years. Categories do
not account for 100 percent of purchases because the following response categories were
excluded: inside a public building, such as a store or restaurant; inside a school building;outside on school property; and some other place.
Purchased fuonaFriend, Relative, orFamily Mertber
40140-
Puwbased from301 ""o s yoo had
just wet ordidn't20- know very well
01
2001 2002 2003 2004 2005 2006
FIG. 12.-Source of last purchase of marijuana, by race, 2001-6. Source: Office ofApplied Studies, National Survey on Drug Use and Health, various years.
f

Malign Effects 29
friends, relatives, and family members. By contrast, blacks purchasedmarijuana from people they had just met or did not know well 30-40percent of the time.
Figure 11 presents data on where marijuana is purchased. Depending
on the year, 57-62 percent of purchases by whites occurred inside ahome, apartment, or dorm, and only 11-14 percent outdoors in publicspaces such as parking lots. For black purchasers, the pattern was
starkly different. Forty percent or less of purchases occurred in privateindoor spaces; 26-35 percent were made outdoors in public spaces.
Undercover drug agents can penetrate black urban drug markets rel-atively easily and make arrests almost at will. Most white drug dealing,by contrast, occurs within existing social networks in which peopleknow one another, and in private. Undercover agents have to investmuch more time in establishing their bona fides; the arrest yield froma fixed amount of time or effort is much lower when pursuing whitethan when pursuing black sellers.
In other words, black arrest rates are so much higher than whiterates because police choose as a strategic matter to invest more energyand effort in arresting blacks. So many more blacks than whites are in
prison because police officials have adopted practices, and policy mak-ers have enacted laws, that foreseeably treat black offenders much moreharshly than white ones.
4. Sentencing Policies for Violent and Drug Crimes. Sentencing pol-icies for drug crimes and violent crimes have been a major driver ofracial disparities in imprisonment since the mid-1970s. Until the early1980s, the tougher laws mainly established mandatory minimum sen-
tences for violent and gun crimes, but the minimums were usually 1or 2 years or at most 5 (Shane-DuBow, Brown, and Olsen 1985). Be-ginning in the mid-1980s and continuing through the mid-1990s, epit-omized by the federal 100-to-one law governing cocaine sentencing
and California's three-strikes law that required sentences ranging from25 years to life for third felonies, sentences for drugs, guns, and vio-
lence were made incomparably harsher.Black Americans have borne the brunt of this tougher sentencing.
For drug crimes, as we have already shown, police arrest policies pro-
duce arrest rates for blacks that are far out of proportion to blacks'drug use or involvement in drug trafficking. For understandable rea-sons of social disadvantage and limited life chances, blacks engage more

30 Michael Tonry and Matthew Melewski
TABLE 4
New Commitments to State Prisons, by Race, 2003
All Black* White* Hispanic'
Violence, of which 28.2% 27.7% 26.1% 34.9%Homicide 2.9 2.9 2.5 3.5
Robbery 7.6 10.4 4.7 8.3Property 27.9 24.2 32.8 22.2
Drugs 30.7 37.5 25.5 30.6
Public order, of which 12.7 10.2 15 11.8Guns 3.3 4.2 2.1 3.7
All 100 100 100 100
SOURCE.-BJS, National Corrections Reporting Program-2003 (fi6ncrpO3O4.csv),table 4.
* Includes persons of Hispanic origin.Includes persons of all races.
often in gun crimes and serious violent crimes. Laws that increase sen-tences for such crimes inevitably exacerbate racial disparities.
Table 4, for example, shows new state prison commitments by con-viction offense and race for 2003, the most recent year for which data
are available from the BJS National Corrections Reporting Program.
Among whites, 53.7 percent were committed for violent, drug, or gun
crimes, compared with 69.4 percent of black offenders (in both casesincluding Hispanic same-race offenders). The racial skew is evengreater when the focus is narrowed to robbery, drugs, and guns (52.1
percent of black prisoners, 32.3 percent of whites). Among black pris-
oners, 37.5 percent were committed for drug crimes; among whiteprisoners, 25.5 percent were.
There have long been good reasons to believe that longer sentences
for drug crimes have no effect on levels of drug use, drug prices, ordrug trafficking (e.g., Wilson 1990; Dills, Miron, and Summers 2008;
MacCoun and Martin, forthcoming). And there are good reasons to
doubt that increasing penalties for particular violent or drug crimesfrom 3 years to 5, 5 years to 10, or 10 years to 20 has any discernible
effects on crime rates (e.g., Doob and Webster 2003; Dills, Miron, and
Summers 2008; Tonry, in this volume). Those things being true, to
increase penalties for crimes with which blacks are charged, for what-
ever reason, is to increase racial disparities in prison for no good reason
or for a not well-justified one.5. In Sum. Black Americans suffer from imprisonment rates six to
seven times higher than those of whites primarily for two reasons.

Malign Effects 31
Police arrest policies for drugs target a type of drug trafficking (street-level transactions in inner-city areas) in which blacks are dispropor-tionately involved. American sentencing laws and policies specify pun-ishments that are both absolutely and relatively severe for violent, drug,and gun crimes for which blacks are more likely than whites to bearrested and prosecuted. Conscious bias and stereotyping, and uncon-scious stereotyping and attribution, no doubt play some roles in caus-ing disparities, but smaller ones.
II. Making Sense of Racial DisparitiesA primary aim of this essay was to see how patterns of racial disparityhave changed since the mid-1990s. We learned three important thingsthat provided one bit of good news and two of terrible news. The goodnews is that patterns of racial involvement in serious crime as shownin arrest data have changed. The percentages of people arrested foraggravated assault, robbery, rape, and homicide who are black havebeen declining and in 2006 were much lower than in 1985. One mighthope, and expect, that racial disparities in imprisonment would havefallen commensurately.
The two bits of terrible news: The first is that blacks continue tomake up about half of the prison population14 and about the samepercentage of Death Row inmates as in the 1980s. The chance that ablack American is in prison in 2007 remains six to seven times higherthan the chance that a white American is in prison. The declininginvolvement of blacks in serious violent crime has had no effect onracial disparities in prison.
The second is that insensitivity to the interests of black Americanscontinues to characterize American crime policies. Racial disparities inimprisonment continue to be generated by policy choices that wereknown, or should have been known, disproportionately to affect dis-advantaged black Americans. In no significant respect have Americandrug policies changed since the 1980s-the federal 100-to-one rule is
" BJS (2007) data for midyear 2006 show that black men constituted 41 percent ofmale jail and prison inmates. The true figure in a country in which skin color mattersmuch more than ethnicity is 46-48 percent (because a few years ago the BJS stoppedcounting black Hispanics as black and thereby reduced the black percentage by 10-12percent; a quarter to a third of imprisoned Hispanics, who made up 21 percent of maleinmates, are dark skinned). Forty-seven percent is to be sure less than 50 and is the resultof the rapid increase in imprisonment of Hispanic people in recent years. There weremore non-Hispanic blacks than non-Hispanic whites imprisoned in 2007.

32 Michael Tonry and Matthew Melewski
the symbol of that-and they continue grossly disproportionately to
ensnare young blacks and, increasingly, young Hispanics."5 And Amer-ican policies toughening penalties for violent crime have had the same
effect. If the conditions of life faced by disadvantaged minority youthsmake them disproportionately likely to be involved in violent crime,
then policies making punishments for violent crime enormously
harsher will disproportionately affect them, and they have.
Lofc Wacquant's work provides insight into how that happened. 6
For a decade now, he has been writing articles on race and crime con-
trol policy. His basic argument is that American cultural practices andlegal institutions have operated to maintain patterns of racial domi-
nance and hierarchy for two centuries. Until the Civil War, slavery
assured white domination. Within 30 years after the war, the practicesand legal forms of discrimination known as "Jim Crow" laws restored
white domination of blacks. In the "Great Migration" in the 1910s and1920s, millions of blacks moved from the South to the North to escape
Jim Crow; the big city ghettos, housing discrimination, and otherforms of discrimination kept blacks in their subordinate place (Lieber-
son 1980). And when deindustrialization and the flight of jobs to the
suburbs left disadvantaged blacks marooned in the urban ghettos, themodern wars on drugs and crime took over (Wacquant 2002a, 2002b).
Wacquant's writing is passionate and controversial, but it is time
more people paid attention to it. The civil rights movement has borne
fruit in the forms of increased economic and social integration of blacksin American society. The progress made is remarkable in light of the
justice system experiences of black Americans.Wacquant's argument is a functionalist one, about what criminal jus-
tice policies and practices do, rather than a political one about what
" The U.S. Sentencing Commission (2007) revisions to its crack and cocaine guidelinesmerely nibble at the edges of the disparities caused by the 100-to-one statute: "Thesentencing commission's striking move on Tuesday, meant to address the wildly dispro-portionate punishments for crack and powder cocaine, will have only a minor impact.Unless Congress acts, many thousands of defendants will continue to face vastly differentsentences for possessing and selling different types of the same thing" (Liptak 2007, p.A21).
16 We do not here discuss features of American politics that made racial insensitivitymore explicable in the last 30 years: the political ascendancy of the right wing of theRepublican Party, embodying the contemporary resurgence of what Richard Hofstadter(1965) called the "paranoid streak in American politics," and the influence on it of fun-damentalist Protestants. If crime and drugs are matters of good and evil, and criminalsand drug users are evil, then there is little reason to expect sympathy or empathy towardthem from the holders of those views (especially if the criminals and drug users are blackand different). See Tonry (2008).

Malign Effects 33
those practices and policies are intended to do. Thought of that way,thinking of what the machinery of the criminal justice system produces,it is hard not to see that it produces devastatingly reduced life chancesfor black Americans. If its aims were to reduce disadvantaged blackmen's chances of earning a decent living, or being successfully marriedand a good father, or being socialized into prosocial values, it is hardto see how the criminal justice system could do those things better(Western 2006). There has to be a reason why the criminal justicesystem treats American blacks so badly, why its foreseeable disparateimpacts on blacks and whites are disregarded, and Wacquant's analysisprovides a better explanation than any other that has been offered.
Wacquant's passion sometimes makes it easy for critics to dismisshis arguments as polemics. He is, however, no longer alone in sug-gesting that American criminal justice practices operate to keep poorblacks in their places. Here is what Douglas Massey, author (withNancy Denton) of American Apartheid (1993), a widely praised anddecidedly nonpolemical account of housing discrimination, had to sayin Categorically Unequal, his 2007 book on social stratification:
Whether whites care to admit it or not, they have a selfish interestin maintaining the categorical mechanisms that perpetuate racialstratification. As a result, when pushed by the federal governmentto end overt discriminatory practices, they are likely to innovatenew and more subtle ways to maintain their privileged position insociety. If one discriminatory mechanism proves impossible to sus-tain, whites have an incentive to develop alternatives that may beassociated only indirectly with race and are therefore not in obvi-ous violation of civil rights law. The specific mechanisms by whichracial stratification occurs can thus be expected to evolve overtime. (P. 54)
[The] new emphasis on retribution and punishment was achieved. . . through the deliberate racialization of crime and violence inpublic consciousness by political entrepreneurs. (P. 94)
As discrimination moved underground, new mechanisms for exclu-sion were built into the criminal justice system for Afro Ameri-cans. (P. 251)
And, to complete this span of the political spectrum, here is whatGlenn C. Loury, a conservative black economist and the author of The

34 Michael Tonry and Matthew Melewski
Anatomy of Racial Inequality (2002), had to say in introducing his 2007Tanner Lectures at Stanford:
We have embraced what criminologist Michael Tonry calls a policyof "malign neglect," and in doing so we, as a society, have stum-bled more or less wittingly into a God-awful cul de sac. I willclaim that the connection of this apparatus to the history of racialdegradation and subordination in our country (lynching, min-strelsy, segregation, ghetto-ization) is virtually self-evident, andthat the racial subtext of our law and order political discourse overthe last three decades has been palpable. (Loury 2007, p. 9; refer-ences omitted)
There are also psychological explanations for racial disparities' per-
sistence. System justification theory posits "a general human tendencyto support and defend the social status quo, broadly defined" (Blasi andJost 2006, p. 1123). People, regardless of their situation, try to ratio-
nalize the injustices and inequities they see (Chen and Tyler 2002).Stereotypes (such as that the rich are smart and the poor are lazy) areoften employed to demonstrate that all members of the system deserve
their status. Concerning the criminal justice system, about which con-
cern about racial disparities in imprisonment might be expected, com-
fort can be found in racial stereotypes, such as that black Americansare especially criminal, so of course many of them are in prison.
The incentive to rationalize is clear. People who believe in a just
system experience, by and large, more positive emotions than peoplewho blame the system. For example, poor people who blame them-
selves for their own poverty are happier and more satisfied with life ingeneral (Blasi and Jost 2006, p. 1141). By rationalizing the inequities
one sees in American sentencing, one finds mental comfort.A considerable literature on racial differences in attitudes toward and
opinions about crime control policy shows that whites have substan-
tially harsher attitudes concerning punishment and greater confidencein the justice system and its practitioners than do blacks (e.g., Unnever,
Cullen, and Lero-Jonson, in this volume). Lawrence Bobo and Devon
Johnson, concluding an extensive analysis of black/white differences in
attitudes toward capital punishment and laws punishing crack cocainetraffickers (mostly black) much more harshly than powder cocaine traf-fickers (mostly white), observe that
The most consistent predictor of criminal justice policy attitudes

Malign Effects 35
is, in fact, a form of racial prejudice. While white racial resent-ment does not ever explain a large share of the variation in any ofthe attitudes we have measured, it is the most consistently influen-tial of the variables outside of race classification itself. This patternhas at least two implications. It further buttresses the concern thatsome of the major elements of public support for punitive criminaljustice policies are heavily tinged with racial animus and thus quitelikely to be resistant to change based on suasion and information-based appeals. What is more, this pattern reinforces the claim...that one major function of the criminal justice system is the regu-lation and control of marginalized social groups such as AfricanAmericans. (2004, pp. 171-72)
There are no easy paths out of the racial dead end in which Amer-ican crime policy finds itself. The damage has been done to living blackAmericans: lives have been blighted, life chances have been reduced,and communities have been undermined. Even radical changes inAmerican crime policies can change none of that.
III. How Can We Do Better?Nonetheless, things can be done. One approach, radical decarceration,is corrective. Three others, elimination of bias and stereotyping, aban-donment of policies and laws that do unnecessary damage, and creationof devices making their later replication of such policies and laws lesslikely, are preventative.
A. Radical DecarcerationEfforts to eliminate bias and stereotyping in official decision making
are being made throughout the United States and should continue tobe made. Unfortunately, such efforts, even if completely successful, canhave only modest effects. The primary drivers of racial disparities aredrug and sentencing policies. Table 5 illustrates why elimination of biasand disparities will not significantly lessen the damage racial disparitiesdo. The top row shows black and white imprisonment rates in 2006."7The second row shows what would happen if black rates were de-creased by 10 percent, which is a high estimate of the degree to which
" The black/white ratio is not higher than 5.5 : 1 because the table uses BJS data thatexclude Hispanics of either race and because it contains combined data on men andwomen. The disparity ratio for women in 2006 (3.8 : 1) was significantly lower than thatfor men (6.3 : 1) (Sabol, Minton, and Harrison 2007, table 14).

36 Michael Tonry and Matthew Melewski
TABLE 5
Disparity in Incarceration Rates, by Race
Black White Ratio
A. Disparity Reduced 10%
Imprisonment rate, 200610% less disparityReduction in prison per 100,000
2,661 483 5.5 : 12,395 483 5.0 :1
266 0
B. Use of Imprisonment Halved
Imprisonment rate, 2006 2,661 483 5.5 :1Imprisonment halved 1,330 241 5.5 : 1Reduction in prison per 100,000 1,330 241
C. Return to 1980 Imprisonment Rates
Imprisonment rate, 1980 827 134 6.2 : 1Reduction in prison per 100,000 1,834 349
SOURCE.-Office of Applied Studies, National Survey on Drug Use and Health, variousyears.
bias and stereotyping enhance disparities, while white rates were leftunchanged. The black imprisonment rate would fall from approxi-mately 2,661 per 100,000 to 2,395 and the ratio of black-to-white im-prisonment rates would fall from 5.5 : 1 to 5.0 : 1.
If instead, as the fifth row shows, the prison population were cut byhalf across the board, the ratio of imprisonment rates would remainthe same but the black imprisonment rate would fall from 2,661 to1,330. Or if, as the penultimate row shows, imprisonment rates werecut to 1980 levels, the black imprisonment rate would be 827 per100,000.
The differing implications of these different approaches are enor-mous. The U.S. Census estimates that 38.34 million U.S. residents in2006 were black. If the imprisonment rate were halved, the black ratewould fall from 26,613 per million to 13,306. That means that over500,000 fewer black Americans would be in prison or jail. Returningto the 1980s imprisonment rate would mean 702,400 fewer blackAmericans behind bars. By contrast, eliminating all effects of bias andstereotyping would free at most 101,900 black Americans.
Of course, every effort should be made to eliminate bias and stereo-typing. Their diminution will reduce racial disparities and the absolutesize of the bite prisons take out of the black population. In absoluteterms, though, that will only nibble at the problem. Only radical de-
Malign Effects 37
carceration can make a big difference. To attempt to limit damage doneto people now entangled in the arms of the criminal justice system,devices need to be created for reducing the lengths of current prisonsentences and releasing hundreds of thousands of people from prison.New systems of parole, pardon, and commutation will need to be de-veloped, as well as programs of social welfare and support to ease peo-ples' transitions back into the free community.
B. Abandonment of Disparity-Causing PoliciesTo limit damage to disadvantaged young people not yet ensnared,
legislatures will need to repeal laws authorizing capital punishment andcreating mandatory minimum sentences, sentences of life without thepossibility of parole, and truth-in-sentencing laws. Most such laws wereadopted primarily for symbolic or expressive purposes rather than withany basis for believing that they would significantly affect crime ratesand patterns, and they do great and disproportionate harm to blackAmericans.
American jurisdictions will need to establish principled new systemsof sentencing guidelines coupled with mechanisms for shortening un-duly, disparately, or disproportionately long prison sentences. Newguidelines will need to call for proportionate sentences for most crimesmeasured mostly in weeks and months, as in most other Western coun-tries, and in years only for the most serious crimes.
These may seem millenarian proposals. They are not. They woulddo little more than return American crime control and punishmentpolicies to the mainstream of Western developed countries. Everyother Western country manages to get by without capital punishment,life without the possibility of parole, and prison sentences measuredprimarily in years and decades.
Alfred Blumstein (1993) years ago showed that American practition-ers and policy makers can respond quickly to racial disparity problems.He observed that from 1965 to 1969, white and nonwhite arrest ratesfor young offenders were indistinguishable; that from 1970 to 1980white rates exceeded nonwhite rates; and that thereafter by 1989 non-white rates nearly tripled and white rates halved, leaving nonwhite ratesnearly four times higher. Figure 13 tells the story. Here is what Blum-stein surmises happened:
The decline [in white arrest rates] after the 1974 peak was un-doubtedly a consequence of the general trend toward decriminali-
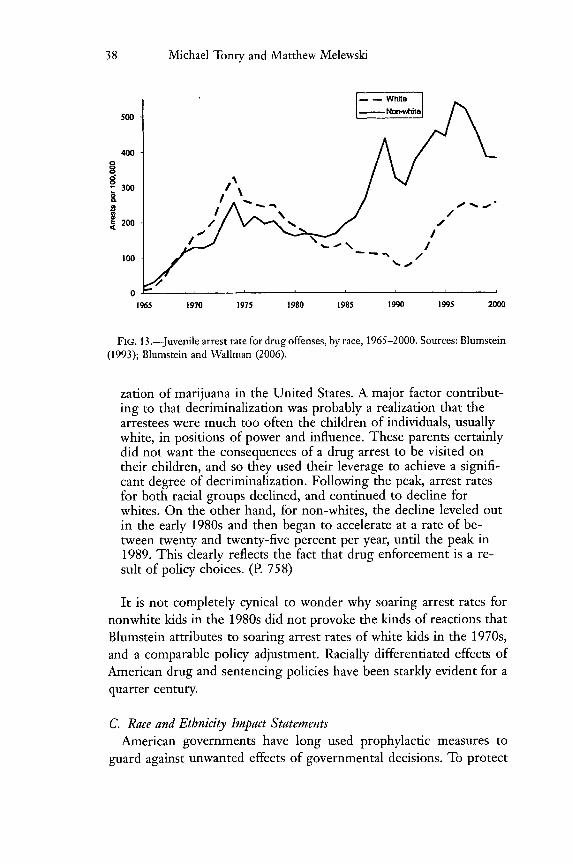
38 Michael Tonry and Matthew Melewski
500
400
-300
-- -- White
J /
100 ,
1965 1970 1975 1980 1985 1990 1995 2000
FIG. 13.-Juvenile arrest rate for drug offenses, by race, 1965-2000. Sources: Blurnstein(1993); Blumstein and Wallman (2006).
zation of marijuana in the United States. A major factor contribut-ing to that decriminalization was probably a realization that thearrestees were much too often the children of individuals, usuallywhite, in positions of power and influence. These parents certainlydid not want the consequences of a drug arrest to be visited ontheir children, and so they used their leverage to achieve a signifi-cant degree of decriminalization. Following the peak, arrest ratesfor both racial groups declined, and continued to decline forwhites. On the other hand, for non-whites, the decline leveled outin the early 1980s and then began to accelerate at a rate of be-tween twenty and twenty-five percent per year, until the peak in1989. This clearly reflects the fact that drug enforcement is a re-sult of policy choices. (P. 758)
It is not completely cynical to wonder why soaring arrest rates fornonwhite kids in the 1980s did not provoke the kinds of reactions thatBlumstein attributes to soaring arrest rates of white kids in the 1970s,and a comparable policy adjustment. Racially differentiated effects ofAmerican drug and sentencing policies have been starkly evident for aquarter century.
C. Race and Ethnicity Impact StatementsAmerican governments have long used prophylactic measures to
guard against unwanted effects of governmental decisions. To protect

Malign Effects 39
the public purse, legislatures in many states require that legislative pro-posals be accompanied by or trigger fiscal impact statements. Federaland state laws routinely require the preparation of environmental im-pact statements before building and other permits may be issued. It isa small step to require that proposals for policy and statutory changesrelating to drug and crime control policies carry with them or triggerrace and ethnicity impact statements. Projected new laws or policieslikely disproportionately to affect members of minority groups ad-versely should be made subject to strong presumptions against theiradoption.
If racially disparate effects of public policies are a problem, and inmost policy realms that proposition is self-evident, policy makers inthis realm also should be required to declare and justify disparate ef-fects. The second edition of the Model Penal Code (American Law In-stitute 2007) provides that such statements be required, and a literatureon the subject is beginning to develop (Tonry 2004, pp. 221-26; Mauer2007).
D. Are Meaningful Changes Possible?We realize that our proposals for radical reduction in America's
prison population, repeal of repressive legislation, and requirement ofrace and ethnicity impact statements may strike some readers as fan-ciful. If racial disparities and the damage they have unarguably doneto millions of individual black Americans and their families, and toblack Americans as a group, are pressing social problems, then radicalmeasures are called for.
There are pessimistic and optimistic ways to contemplate the future.The pessimistic one is to recall LoYc Wacquant's functionalist analysisof racial hierarchy in American history and the succession of mecha-nisms by which white domination has been maintained. If slavery wassucceeded by Jim Crow, which was succeeded by the racially segregatednorthern ghettoes, which was succeeded by mass imprisonment, it ishard not to wonder what will substitute for mass imprisonment, orwhether mass imprisonment will endure for the reasons Wacquantsketched.
The optimistic one focuses on the good things the civil rights move-ment accomplished. Sixty years ago, nearly all black Americans weresecond-class citizens; nearly all were victims of discriminatory prac-tices, norms, and laws. That is no longer true. Today it is primarily

40 Michael Tonry and Matthew Melewski
disadvantaged black Americans who suffer, seemingly for the accidentof their births. Perhaps as the normative developments that underlaythe civil rights movement wrestle with the functionalist developmentsthat Wacquant described, a time will come when our proposals do notlook fanciful. They are simple proposals that aim to redress profoundsocial injustices. Seen that way, they are not radical at all.
REFERENCES
American Friends Service Committee. 1971. Struggle for Justice. New York:Hill and Wang.
American Law Institute. 2007. Model Penal Code: Sentencing. 2nd ed. Tentativedraft no. 1 (April 9). Philadelphia: American Law Institute.
Baldus, David C., George G. Woodworth, and Charles A. Pulaski Jr. 1990.Equal Justice and the Death Penalty: A Legal and Empirical Analysis. Boston:Northeastern University Press.
BJS (Bureau of Justice Statistics). 1984. "The 1983 Jail Census." Washington,DC: U.S. Department of Justice, Bureau of Justice Statistics.
-. 1990. "Profile of Jail inmates 1978." Washington, DC: U.S. Depart-ment of Justice, Bureau of Justice Statistics.
- .2006. "Prisoners in 2004." Washington, DC: U.S. Department ofJus-tice, Bureau of Justice Statistics.
-. 2007. "Prison and Jail Inmates at Midyear 2006." Washington, DC:U.S. Department of Justice, Bureau of Justice Statistics.
Blair, Irene V., Kristine M. Chapleau, and Charles M. Judd. 2005. "The Useof Afrocentric Features as Cues for Judgment in the Presence of DiagnosticInformation." European Journal of Social Psychology 3 5:59-68.
Blair, Irene V., Charles M. Judd, and Kristine M. Chapleau. 2004. "The Influ-ence of Afrocentric Facial Features in Criminal Sentencing." PsychologicalScience 15(10):674-79.
Blair, Irene V., Charles M. Judd, and Jennifer L. Fallman. 2004. "The Auto-maticity of Race and Afrocentric Facial Features in Social Judgments." Jour-nal of Personality and Social Psychology 87(6):763-78.
Blair, Irene V., Charles M. Judd, Melody S. Sadler, and Christopher Jenkins.2002. "The Role of Afrocentric Features in Person Perception: Judging byFeatures and Categories." Journal of Personality and Social Psychology 83(1):5-25.
Blank, Rebecca M., Marilyn Dabaddy, and Constance E Citro, eds. 2004. Mea-suring Racial Discrimination. Washington, DC: National Academy Press.
Blasi, Gary, and John T. Jost. 2006. "System Justification Theory and Research:Implications for Law, Legal Advocacy, and Social Justice." California LawReview 94:1119-68.

Malign Effects 41
Blumstein, Alfred. 1982. "On Racial Disproportionality of the United States'Prison Populations." ]ournal of Criminal Law and Criminology 73:1259-81.
-. 1993. "Racial Disproportionality of U.S. Prison Populations Revis-ited." University of Colorado Law Review 64:743-60.
Blumstein, Alfred, and Allen Beck. 1999. "Population Growth in U.S. Prisons,1980-1996." In Prisons, edited by Michael Tonry and Joan Petersilia. Vol.26 of Crime and Justice: A Review of Research, edited by Michael Tonry. Chi-cago: University of Chicago Press.
Blumstein, Alfred, Jacqueline Cohen, Susan Martin, and Michael Tonry, eds.1983. Research on Sentencing: The Search for Reform. Washington, DC: Na-tional Academy Press.
Blumstein, Alfred, and Joel Wallman. 2006. "The Crime Drop and Beyond."Annual Review of Laws and Social Sciences 2:12 5-46.
Bobo, Lawrence, and Devon Johnson. 2004. "A Taste for Punishment: Blackand White Americans' Views on the Death Penalty and the War on Drugs."Du Bois Review 1:15 1-80
Bonczar, Thomas P. 2003. "Prevalence of Imprisonment in the U.S. Popula-tion, 1974-2001." Washington, DC: U.S. Department of Justice, Bureau ofJustice Statistics.
Cahalan, Margaret W.. 1986. Historical Correction Statistics in the United States,1850-1984. Washington, DC: U.S. Department of Justice, Bureau of JusticeStatistics.
Chen, Emmeline S., and Tom R. Tyler. 2002. "Cloaking Power: LegitimizingMyths and the Psychology of the Advantaged." In The Use and Abuse ofPower: Multiple Perspectives on the Causes of Corruption, edited by Annette Y.Lee-Chai and John A. Bargh. New York: Psychology Press, Taylor andFrancis.
Clear, Todd. 2007. Imprisoning Communities: How Mass Incarceration Makes Dis-advantaged Neighborhoods Worse. New York: Oxford University Press.
-. In this volume. "Communities with High Incarceration Rates."Dills, Angela K., Jeffrey A. Miron, and Garrett Summers. 2008. "What Do
Economists Know about Crime?" Working Paper no. 13759. Cambridge,MA: National Bureau of Economic Research.
Doob, Anthony, and Cheryl Webster. 2003. "Sentence Severity and Crime:Accepting the Null Hypothesis." In Crime and Justice: A Review of Research,vol. 30, edited by Michael Tonry. Chicago: University of Chicago Press.
Du Bois, W E. B. 1988. "The Negro Criminal." In The Economics of Race andCrime, edited by Samuel L. Myers and Margaret C. Simms. New Brunswick,NJ: Transaction Books. (Originally published 1899.)
Eberhardt, Jennifer L., Paul G. Davies, Valerie J. Purdie-Vaughns, and SheriLynn Johnson. 2006. "Looking Deathworthy: Perceived Stereotypicality ofBlack Defendants Predicts Capital-Sentencing Outcomes." Psychological Sci-ence 17(5):383-86.
Eberhardt, Jennifer L., Phillip Atiba Goff, Valerie J. Purdie, and Paul G. Da-vies. 2004. "Seeing Black: Race, Crime and Visual Processing." Journal ofPersonality and Social Psychology 87(6):876-93.

42 Michael Tonry and Matthew Melewski
Engel, Robin Shepard, and Jennifer M. Calnon. 2004. "Examining the Influ-ence of Drivers' Characteristics during Traffic Stops with Police: Resultsfrom a National Survey." Justice Quarterly 21(l):49-90.
Fagan, Jeffrey, and Richard B. Freeman. 1999. "Crime and Work." In Crimeand Justice: A Review of Research, vol. 25, edited by Michael Tonry. Chicago:University of Chicago Press.
Federal Bureau of Investigation. 2005. Crime in the United States, 2004. Wash-ington, DC: U.S. Department of Justice.
Gest, Ted. 2001. Crime and Politics: Big Government's Erratic Campaign for Lawand Order. New York: Oxford University Press.
Gilliard, Darrell K., and Allen J. Beck. 1996. Prison and Jail Inmates, 1995.Washington, DC: U.S. Department of Justice, Bureau of Justice Statistics.
Greenwald, Anthony, and Linda Hamilton Krieger. 2006. "Implicit Bias: Sci-entific Foundations." California Law Review 94:945-67.
Harrington, Michael P., and Cassia Spohn. 2007. "Defining Sentence Type:Further Evidence against Use of the Total Incarceration Variable." Journalof Research in Crime and Delinquency 44(1):36-63.
Hofstadter, Richard. 1965. The Paranoid Style in American Politics and OtherEssays. Chicago: University of Chicago Press.
Jones, Trina. 2000. "Shades of Brown: The Law of Skin Color." Duke LawJournal 49:1487-1557.
Langan, Patrick. 1985. "Racism on Trial: New Evidence to Explain the RacialComposition of Prisons in the United States." Journal of Criminal Law andCriminology 76:666-83.
Lieberson, Stanley. 1980. A Piece of the Pie-Blacks and White Immigrants since1980. Berkeley and Los Angeles: University of California Press.
Liptak, Adam. 2007. "Whittling Away, but Leaving a Gap." New York Times(November 17), p. A21.
Loury, Glenn C. 2002. The Anatomy of Racial Inequality. Cambridge, MA: Har-vard University Press.
-. 2007. "Racial Stigma, Mass Incarceration and American Values." Tan-ner Lectures in Human Values delivered at Stanford University, April 4 and5. http://www.econ.brown.edu/fac/GlennLoury/louryhomepage/.
MacCoun, Robert, and Karin D. Martin. Forthcoming. "Drug Abuse." InHandbook on Crime and Punishment, edited by Michael Tonry. New York:Oxford University Press.
Maddox, Keith B., and Stephanie A. Gray. 2002. "Cognitive Representationsof Black Americans: Reexploring the Role of Skin Tone." Personality andSocial Psychology Bulletin 2 8:250-59.
Massey, Douglas S. 2007. Categorically Unequal. New York: Russell SageFoundation.
Massey, Douglas S., and Nancy Denton. 1993. American Apartheid: Segregationand the Making of the Underclass. Cambridge, MA: Harvard University Press.
Mauer, Marc. 2007. "Racial Impact Statements as a Means of Reducing Un-warranted Sentencing Disparities." Ohio State Journal of Criminal Law 5:19-46.

Malign Effects 43
McDonald, Douglas C., and Kenneth C. Carlson. 1993. Sentencing in the Fed-eral Courts: Does Race Matter? Washington DC: U.S. Department of Justice,Bureau of Justice Statistics.
Moynihan, Daniel Patrick. 1965. The Negro Family: The Case for National Ac-tion. Washington, DC: U.S. Department of Labor, Office of Policy Planningand Research.
Murray, Joseph, and David P. Farrington. In this volume. "Effects of ParentalImprisonment in Children."
Myrdal, Gunnar. 1944. An American Dilemma-the Negro Problem and ModernDemocracy. New York: Harper and Row.
Pizzi, William T, Irene V Blair, and Charles M. Judd. 2005. "Discriminationin Sentencing on the Basis of Afrocentric Features." Michigan Journal of Raceand Law 10:327-53.
Provine, Doris Marie. 2007. Unequal under Law: Race in the War on Drugs.Chicago: University of Chicago Press.
Raphael, Steven, Harry Holzer, and Michael Stoll. 2006. "How Do Crime andIncarceration Affect the Employment Prospects of Less Educated BlackMen?" In Black Males Left Behind, edited by Ronald Mincy. Washington,DC: Urban Institute.
Sabol, William J., Todd D. Minton, and Paige M. Harrison. 2007. "Prison andJail Inmates at Midyear 2006." Washington, DC: U.S. Department of Jus-tice, Bureau of Justice Statistics.
Shane-Dubow, Sandra, Alice P. Brown, and Erik P. Olsen. 1985. SentencingReform in the United States: History, Content and Effect. Washington, DC: U.S.Government Printing Office.
Snell, Tracy L. 2007. "Capital Punishment, 2006." Washington, DC: U.S. De-partment of Justice, Bureau of Justice Statistics.
Spohn, Cassia. 2000. "Thirty Years of Sentencing Reform: The Quest for aRacially Neutral Sentencing Process." In Criminal Justice 2000, vol. 3, editedby the U.S. National Institute ofJustice. Washington, DC: U.S. Departmentof Justice, National Institute of Justice.
- . 2002. How Do Judges Decide? The Search for Fairness and Justice inPunishment. Thousand Oaks, CA: Sage.
Tonry, Michael. 1995. Malign Neglect: Race, Crime, and Punishment in America.New York: Oxford University Press.
1996. Sentencing Matters. New York: Oxford University Press.2004. Thinking about Crime: Sense and Sensibility in American Penal
Culture. New York: Oxford University Press.2005. "Obsolescence and Immanence in Penal Theory and Policy."
Columbia Law Review 105:1233-75.- . 2008. "Crime and Human Rights-How Political Paranoia, Religious
Fundamentalism, and Constitutional Obsolescence Combined to DevastateBlack America." Criminology 46(1):1-34.
- In this volume. "Learning from the Limits of Deterrence Research."Unnever, James D., Francis T. Cullen, and Cheryl N. Lero-Jonson. In this
volume. "Race, Racism, and Support for Capital Punishment."

44 Michael Tonry and Matthew Melewski
U.S. Department of Commerce. 2006. Statistical Abstract of the United States:2007. Washington, DC: U.S. Government Printing Office.
U.S. Sentencing Commission. 1995. 1995 Special Report to the Congress: Cocaineand Federal Sentencing Policy. Washington, DC: U.S. Sentencing Com-mission.
-. 2007. Cocaine and Federal Sentencing Policy. Washington, DC: U.S. Sen-tencing Commission.
Wacquant, Lo'c. 2002a. "Deadly Symbiosis: Rethinking Race and Imprison-ment in Twenty-first-Century America." Boston Review (April/May).
2002b. "From Slavery to Mass Incarceration." New Left Review13(January-February):41-60.
Walker, Samuel, Cassia Spohn, and Miriam DeLone. 2006. The Color ofJustice:Race, Ethnicity, and Crime in America. 4th ed. Belmont, CA: Wadsworth.
Walmsley, Roy. 2007. World Prison Population List. 7th ed. London: Interna-tional Centre for Prison Studies.
Western, Bruce. 2006. Punishment and Inequality in America. New York: RussellSage Foundation.
Wilson, James Q. 1990. "Drugs and Crime." In Drugs and Crime, edited byMichael Tonry and James Q. Wilson. Vol. 13 of Crime and justice: A Reviewof Research, edited by Michael Tonry and Norval Morris. Chicago: Universityof Chicago Press.
Wilson, William Julius. 1978. The Declining Significance of Race: Blacks andAmerican Institutions. Chicago: University of Chicago Press.
1987. The Truly Disadvantaged: The Inner City, the Underclass, and PublicPolicy. Chicago: University of Chicago Press.