analyses of crime, community corrections, and … reinvestment in michigan justice reinvestment in...
TRANSCRIPT

�Justice Reinvestment in Michigan
Justice Reinvestment in michigan
Analyses of Crime, Community Corrections, and Sentencing Policies
Governor Jennifer M. Granholm, Senate Majority Leader Michael D. Bishop, and Speaker of the
House Andy Dillon requested intensive technical assistance from the Council of State Governments Justice Center (Justice Center) to help develop a statewide policy framework that reduces crime and victimization in Michigan, manages the growth in spending on corrections, and reinvests in targeted efforts to increase public safety in high-crime neighborhoods.
The governor and legislative leaders established a bipartisan, bicameral, and inter-branch working group to guide the Justice Center’s efforts. This working group identified a cross-section of stakeholders and data sources for the Justice Center to consult in analyzing crime, community corrections, and sentencing policies in Michigan.
The Justice Center convened roundtable discussions and organized numerous interviews with representatives of county and local government and community-based organizations. The Justice Center also collected data from multiple sources to inform the analyses outlined in this brief, including the Michigan Department of Corrections, Michigan State Police, Prosecuting Attorney’s Association of Michigan, Michigan Department of Education, Michigan Department of Labor and Economic Growth, and the Michigan Commission on Law Enforcement Standards.
This policy brief summarizes the findings of the Justice Center. These findings should provide the working group with a data-driven foundation upon which to review and consider policy options to increase public safety and reduce spending on corrections.

� Justice Reinvestment in Michigan
Crime
• Violent crime is a problem in Michigan, and it is concentrated in particular communities.
• Homicide victims are disproportionately young, male, and African American.
• The certainty of apprehension for people committing violent crime in Michigan is low and appears to be declining.
• Backlogs at the state’s crime lab delay criminal investigations and undermine the swift and certain apprehension of offenders.
• Michigan has the fewest local law enforcement personnel per capita among the states in the Great Lakes region, despite having the region’s highest violent crime rate.
• Michigan has a large number of unemployed, disconnected youth, who are at particular risk of involvement in the criminal justice system.
Community Corrections
• In Michigan, people convicted of felonies are more likely to be sentenced to county jail and/or probation than is the case in other states.
• People on probation and parole supervision account for a very small percentage of overall arrests in Michigan; among people under community supervision who are arrested for a crime, most are on probation (not parole).
• Probationers with high risk and need factors have high rearrest rates; this subset of probationers is in particular need of intensive supervision, health services, education, and other supports.
• People on community supervision in Michigan experience high rates of unemployment.
• Michigan’s reincarceration and rearrest rates are lower than the national average.
Sentencing Policies
• State spending on corrections has increased significantly in recent years, and, over this period, it has consumed a growing share of the overall state budget.
• Michigan’s sentencing structure is unique among the states.
• The average minimum sentence imposed by Michigan judges for various violent crimes is comparable to the average length of incarceration for people nationally. Nevertheless, people sentenced to prison in Michigan for various violent crimes stay in prison considerably longer than is the case nationally.
• Many offenders are released from prison in Michigan without any supervision.
SummaryPolicymakers in Michigan are interested in reducing the state’s high rate of violent crime, rate of reoffending among probationers and parolees, and spending on corrections. The Justice Center’s analyses of crime, community corrections, and sentencing policy identified the following key findings.

�Justice Reinvestment in Michigan
I. Crime
Violent crime is a problem in Michigan, and it is concentrated in particular communities.
• Michigan’s violent crime rate is the highest in the Great Lakes region.1
• The violent crime rate in Michigan remained relatively unchanged from 2000–2007, while the national rate declined 8 percent.2
• Wayne and Saginaw counties accounted for the highest violent crime rates in the state in 2007.3
Homicide victims are disproportionately young, male, and African American.
• Although people between the ages of 17 and 39 represent less than 30 percent of the population, they accounted for 57 percent of homicide victims in the same year.4
• Eighty percent of homicide victims were men.5
• Despite representing 14 percent of the state’s population, African Americans accounted for 72 percent of homicide victims in 2006.6
The certainty of apprehension for people committing violent crime in Michigan is low and appears to be declining.
• In 2007, only 28 percent of violent index crimes in Michigan resulted in an arrest or were otherwise cleared, compared with the national average of 44 percent. Only 37 percent of murders were cleared in Michigan, compared with 61 percent nationally.7
• Between 2000 and 2007, arrests for violent crimes declined 22 percent, even though the number of violent crimes committed in Michigan declined by just 2 percent.8
• Although the certainty of apprehension remains low, once an individual in Michigan is arrested, the data suggest that there is a comparatively higher likelihood of being convicted and serving either a jail or prison sentence.9
Backlogs at the state’s crime lab delay criminal investigations and undermine the swift and certain apprehension of offenders.
• The average delay for processing DNA and firearms samples between January and September 2008 was 135 and 101 days, respectively.10
violent crime, �007per 100,000
Five counties in michigan have violent crime rates over 500 per �00,000 residents.
counties
no. violent crimes
violent crime Rate
Wayne ��,�65 �,�88.6
saginaw �,��9 �,0��.4
genesee �,474 784.8
calhoun �,075 779.�
ingham �,585 57�.�
Source: Justice Mapping Center

4 Justice Reinvestment in Michigan
• Law enforcement executives and jail administrators indicate that these delays can create additional costs at the local level by impeding investigations and court processes and, in some cases, causing individuals to be held longer in jail.
• The recent closure of the Detroit crime lab in fall of 2008 will exacerbate these already existing backlogs at the state labs.
Michigan has the fewest local law enforcement personnel per capita among the states in the Great Lakes region, despite having the region’s highest violent crime rate.
• As local governments deal with decreasing revenues, they are balancing budgets in part by reducing the number of people working in sheriff’s offices and local police departments.
• Although Wayne County (Detroit) has the highest crime rate in the state, the number of Detroit law enforcement personnel has declined by 31 percent since 2000, or 1,545 positions. During this time period, Detroit’s resident population only declined by 4 percent.11
• Likewise, Flint, Grand Rapids, and Lansing lost 14 percent, 13 percent, and 7 percent of their law enforcement personnel, respectively.12
• Since 2003, the number of assistant prosecuting attorneys and staff in offices across the state has declined 7 percent.13
Michigan has a large number of unemployed, disconnected youth, who are at particular risk of involvement in the criminal justice system.
• Across Michigan, more than 27,500 young adults between the ages of 16–19 are neither working nor attending school and do not have their high school diploma.14 In particular counties and neighborhoods across Michigan, the percentage of young adults fitting this description is more than 10 percent.
• Young men between the ages of 17 and 24 commit 26 percent of violent index crimes, despite comprising only 6 percent of the state’s population.15
0
100
200
300
400
500
600law enforcement personnel
violent crime
NYILMNWIOHINMI
ra
te p
er
10
0,0
00
536
263
334
271
343307 291
335
289267
533
418 414
460
Violent Crime and Law Enforcement Personnel Per 100,000 in the Great Lakes States, 2007
Disconnected Youth, �000percentages
Disconnected youth are �6–�9 year olds who are
• not working,
• not in school, and
• without a diploma.
counties*
counties % Disconnected Youth
Lake ��.�%
Luce �6.7%
ionia 9.8%
iosco 8.4%
gladwin 8.�%
*counties with disconnected youth rates > 8.0%.
Five counties in michigan have disconnected youth rates over 8%.
Source: Justice Mapping Center

5Justice Reinvestment in Michigan
II. Community Corrections
In Michigan, people convicted of felonies are more likely to be sentenced to county jail and/or probation than is the case in other states.
• Twenty-three percent of felony convictions in Michigan result in a prison sentence, compared with 40 percent nationally. At the same time, roughly 70 percent of convicted felons receive a prison or jail sentence both nationally and in Michigan.16
• There are approximately 53,000 felony probationers under the supervision of the Department of Corrections at any given time.17 In 2007, 7,352 probationers were revoked and returned to either jail or prison for violating the conditions of supervision, with 80 percent of these probationers receiving a jail sentence.18
• Prosecutors from across the state report that in many Michigan counties with overcrowded jail facilities, the court and probation officials are not likely to apply swift, short jail stays to sanction violation behavior among probation violators.
People on probation and parole supervision account for a very small percentage of overall arrests in Michigan; among people under community supervision who are arrested for a crime, most are on probation (not parole).19
• The majority of people arrested for violent and property crimes in Michigan in 2007 were not on felony probation or parole at the time of their arrest. Of all arrests made in Michigan in 2007, only 9 percent involved offenders on parole or probation supervision.20 This analysis was not able to review the past criminal history of those arrested who were not currently on supervision.
• In 2007, felony probationers accounted for 7 percent of all arrests for index offenses, and parolees accounted for 3 percent.21
• People on felony probation supervision in Michigan account for a significant percentage of violent crimes committed. In 2007, 15 percent of individuals arrested for murder and 14 percent arrested for rape were on probation at the time of their arrest.22
Percent of Felony Convictions Resulting in Prison, Jail, or Probation Sentence: Michigan vs. National Average
Michigan
National Average
23% 49% 28%
40% 30% 28%
prison jail probation
Rearrests of People on Felony Probation and Parole, 2007
85,45� arrests for index crimes(Murder, Rape, Robbery, Agg. Assault, Burglary, Larceny, MV Theft, Arson)
7% on probation 3% on parole
�6,466 Parolees11% rearrested for index crime
8�,��4 Felony Probationers7% rearrested for index crime

6 Justice Reinvestment in Michigan
Probationers with high risk and need factors have high rearrest rates; this subset of probationers is in particular need of intensive supervision, health services, education, and other supports.
• Of the 29,214 people placed on felony probation in Michigan in 2007, 5,981 were identified as high-risk, based on a risk model developed by the Justice Center. Of this group, 39 percent were rearrested within one year of placement on supervision compared with 27 percent for all probationers.
• High risk probationers in Michigan are also in need of basic education, substance abuse treatment, and mental health services. Specifically, 83 percent demonstrated a need for substance abuse treatment, 21 percent had a known mental illness, and 42 percent had less than an 11th grade education.23
People on community supervision in Michigan experience high rates of unemployment.
• Between 50 to 70 percent of people on parole are unemployed.24
• Fifty percent of people on probation are unemployed.25
Michigan’s reincarceration and rearrest rates are lower than the national average.
• Michigan’s three-year prison reincarceration rate of 33 percent is lower than the 40 percent national reincarceration rate published by the Bureau of Justice Statistics (BJS), which excludes both absconders and California data.26
• Michigan’s three-year rearrest rate for people released from prison is 52 percent, which is considerably lower than the BJS average national rearrest rate of 68 percent.27
• Michigan’s recidivism rates may be lower than the national averages, in part, because people admitted to and released from Michigan’s prisons are convicted of more serious crimes, serve longer terms of incarceration, and are older when they are released from prison.
Parolees/Probationers per �,000, �007 unemployment, �007
eight counties in michigan have unemployment rates over �0%.
counties*
countiesno. Parole Probation
Parole Probation per �,000
% unemployed
Keweenaw �8 �0.4 �0.7%
Roscommon �40 ��.4 9.6%
muskegon �,0�0 ��.8 7.�%
gladwin �6� ��.7 �0.�%
Lake �09 ��.5 �0.7%
tuscola 604 ��.4 8.�%
clare �84 �0.7 �0.6%
alcona 9� �0.� �0.�%
Wayne �0,567 �0.� 8.8%
*counties with probation/parole rates > �0 per �,000.
Source: Justice Mapping Center

7Justice Reinvestment in Michigan
III. Sentencing Policies
State spending on corrections has increased significantly in recent years, and over this period, it has consumed a growing share of the overall state budget.
• State general fund spending on corrections increased 57 percent from $1.26 billion to $1.99 billion between FY1998 and FY2008.28
• In the past ten years, state spending on corrections increased from 16.2 percent of state general fund expenditures in FY1997 to 22.6 percent in FY2007.29
• One out of every three state workers is employed by the Department of Corrections.30
Michigan’s sentencing structure is unique among the states.
• Michigan’s sentencing structure requires nearly all felony offenders sentenced to prison to serve 100 percent of the minimum sentence imposed by the judge, which is based on the state’s sentencing guidelines.
• Michigan judges do not impose a maximum sentence that is tailored to the specifics of the case, except in certain cases. Instead, maximum sentences are set by statute for each criminal offense.
• In Michigan, there is a wide range between the minimum and maximum sentence for most cases. For people admitted to prison in 2007, the average minimum sentence was 3.7 years while the average maximum sentence was 14 years.31
• The Michigan parole board reviews eligible cases for release and can decide not to release a person once they have served their minimum sentence. They can determine that the person should serve up to the
$0.0
$0.5
$1.0
$1.5
$2.0
$2.5
$3.0
‘08‘07‘06‘05‘04‘03‘02‘01‘00‘991998
bil
lio
ns
$1.26$1.48
$1.58 $1.56$1.81
$1.99
Michigan Department of Corrections Budget, 1998–2008
estimated annual Prison expenditures, �007
michigan taxpayers will pay over $�.� billion to imprison people sentenced in �007. One third of the costs are accounted for by people sentenced to prison from Wayne county.
counties*
counties
Prison Bed Years
estimated annual expenditure
Wayne �4,458 $433,762,326
Oakland �,40� $102,049,419
Kent �,�0� $99,040,6�5
macomb �,068 $6�,050,79�
genesee �,064 $6�,9��,�59
muskegon �,�85 $�8,549,�80
saginaw �,��� $�6,95�,���
counties
Prison Bed Years
estimated annual expenditure
Berrien 95� $�8,550,�70
Kalamazoo 9�7 $�7,5��,579
Washtenaw 896 $�6,888,84�
ingham 880 $�6,404,695
Jackson 864 $�5,9�4,��4
calhoun 67� $�0,��0,546
state total 4�,��� $�,��9,9�6,997
*counties with expenditures > $�0 million.
Source: Justice Mapping Center
8 Justice Reinvestment in Michigan
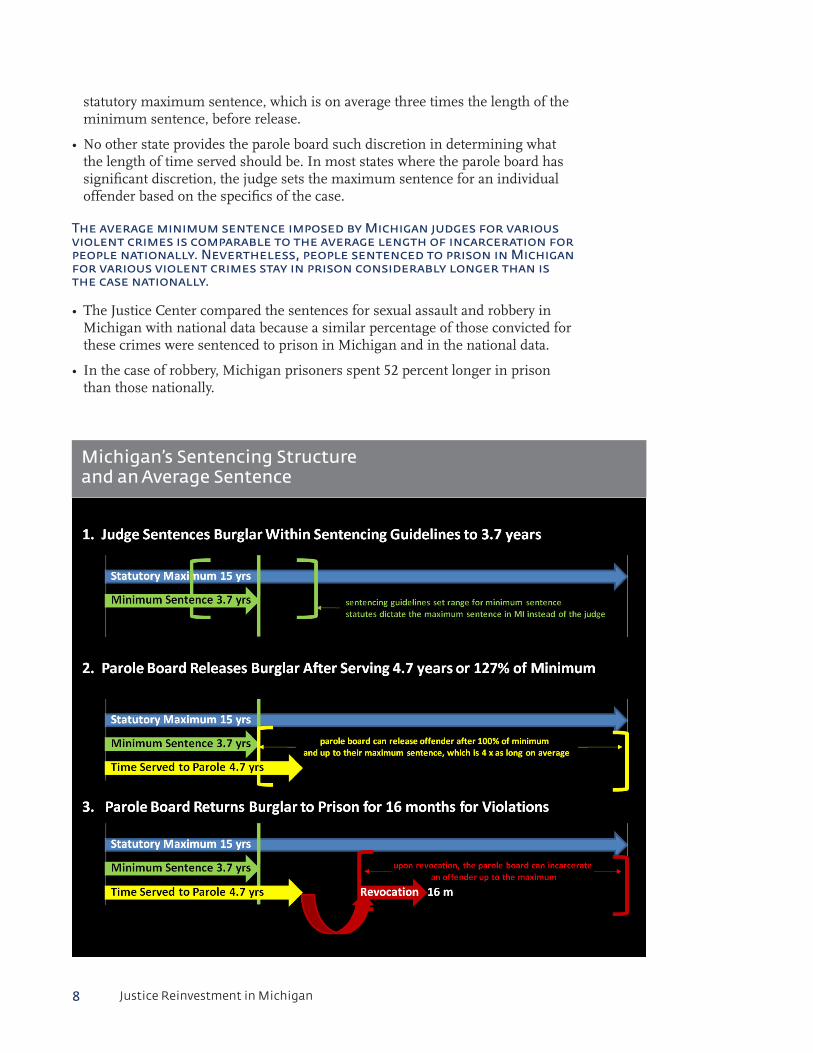
statutory maximum sentence, which is on average three times the length of the minimum sentence, before release.
• No other state provides the parole board such discretion in determining what the length of time served should be. In most states where the parole board has significant discretion, the judge sets the maximum sentence for an individual offender based on the specifics of the case.
The average minimum sentence imposed by Michigan judges for various violent crimes is comparable to the average length of incarceration for people nationally. Nevertheless, people sentenced to prison in Michigan for various violent crimes stay in prison considerably longer than is the case nationally.
• The Justice Center compared the sentences for sexual assault and robbery in Michigan with national data because a similar percentage of those convicted for these crimes were sentenced to prison in Michigan and in the national data.
• In the case of robbery, Michigan prisoners spent 52 percent longer in prison than those nationally.
michigan’s sentencing structure and an average sentence

9Justice Reinvestment in Michigan
• For sexual assault, Michigan prisoners spent 33 percent longer in prison. The data suggest that prisoners in Michigan, when compared to similar groups of criminals convicted of similar crimes, serve significantly longer terms of incarceration.
• The data do not suggest, however, that the sentencing guidelines or minimum sentences are the reason why prisoners in Michigan serve longer in prison. For robbery, the average minimum sentence in Michigan was 14 percent above the national average time served. For sexual assault, the average minimum sentence in Michigan was 23 percent lower than the national average time served.
• The overwhelming difference between the lengths of time served nationally and in Michigan appears to be attributed to the unique level of discretion available to the state’s parole board. The average prisoner serves 127 percent of their minimum sentence imposed by the court before they are first paroled.
Many offenders are released from prison in Michigan without any post-release supervision.
• More than 1,000 offenders were released in 2007 to no community supervision. These offenders have “maxed out” their term of imprisonment; they have served the maximum period of imprisonment allowed by statute.
• These offenders served an average of over 8 years in prison, and 200 percent of their minimum court imposed sentence.32
• Of those who maxed out in 2007, 42 percent were incarcerated for violent offenses and 37 percent were for sex offenses.33
• Without postrelease supervision it becomes more difficult to ensure a smooth transition to the community, which could potentially reduce this population’s likelihood of committing new crimes.
Comparison of Prison Disposition Rates and Sentence Lengths for Robbery and Sexual Assault Prisoners in Michigan and National Data
Percent of convictions resulting in a
prison sentenceTime served in prison
(in months)
Offense
National(2004 court disposition data)
Michigan(2005 court disposition data)
National Average(2003 releases)
Michigan Average(2007 releases)
Michigan Average Minimum Sentence(2007 releases)
Robbery 72% 77% 64 97 73
Sexual Assault
61% 63% 79 105 61
Source: BJS National Judicial Reporting Program, 2004 Court Disposition Data & 2003 Release Data; 2005 MDOC Annual Report; 2007 MDOC Releases Data File.

�0 Justice Reinvestment in Michigan
1. U.S. Department of Justice, Federal Bureau of Investigation. Crime in the United States, 2007 (September 2008).
2. Ibid. Federal Bureau of Investigation (2008).
3. Ibid.
4. Michigan State Police, Criminal Justice Information Center. Crime in Michigan, 2006 Uniform Crime Report (2007).
5. Ibid.
6. Ibid.
7. Ibid. Federal Bureau of Investigation (2008). (Within the UCR Program, law enforcement agencies can clear, or “close,” offenses in one of two ways: by arrest or by exceptional means.)
8. Ibid, Federal Bureau of Investigation, 2008. This footnote applies only to violent index crimes (murder, rape, robbery, or aggravated assault).
9. The arrest and conviction/disposition data are not exactly comparable, since the arrest data includes violent index offenses and the conviction/disposition data includes all felony assaultive offenses. Consequently, comparing arrest to conviction data includes an unknown error rate.
10. Michigan State Police, Forensic Advantage Workload Summary by Section (1/1/2008 – 9/30/2008), provided to CSG via email communication.
11. U.S. Department of Justice, Federal Bureau of Investigation. Crime in the United States (2000). Ibid. Federal Bureau of Investigations (2008).
12. Ibid.
13. Chart titled, “Prosecution Personnel Increases After 5 Years of Steady Decline,” provided to Justice Center from Prosecuting Attorney’s Association of Michigan (PAAM).
14. U.S. Census Bureau, 2000 Census of Population and Housing: “Armed Forces Status for Population 16 to 19 Years by School Enrollment by Educational Attainment by Employment Status”, (November 2002).
15. Ibid. Michigan State Police, (2007).
16. Michigan Department of Corrections 2005 Statistical Report. Bureau of Justice Statistics, Felony Sentences in State Courts, 2004, (July 2007).
17. Council of State Governments Justice Center analysis of Michigan Department of Corrections data of people on probation in 2007.
18. CSG Request to Michigan Department of Corrections for analysis of 2007 court dispositions.
19. This study includes data for people who were currently on supervision and does not account for people who were previously under supervision.
20. Council of State Governments Justice Center, Arrest of Offenders Under Supervision in Michigan in 2007, (forthcoming in 2009).
21. Ibid. Index crimes include murder, rape, robbery, aggravated assault, burglary, larceny, motor vehicle theft, and arson.
22. Ibid.
23. Council of State Governments Justice Center analysis of Michigan Department of Corrections data of placements on to probation in 2007.
24. Michigan Department of Corrections, Response to request for data from CSG Justice Center, 2008.
25. Ibid, Michigan Department of Corrections, 2008.
26. Analysis of Michigan Department of Corrections data; Bureau of Justice Statistics, Recidivism of Prisoners Released in 1994 (2002).
27. Ibid.
28. FY2009 & FY2010 Executive Budget, State of Michigan.
29. National Association of State Budget Officers, 1997 State Expenditure Report, National Association of State Budget Officers (Washington, D.C. National Association of State Budget Officers, 1998); National Association of State Budget Officers, 2006 State Expenditure Report, National Association of State Budget Officers (Washington, D.C.: National Association of State Budget Officers, 2007).
30. State of Michigan Civil Service Commission, Annual Workforce Report: First Quarter, Fiscal Year 2007–08 (2007).
31. Justice Center analysis of 2007 Michigan Department of Corrections (MDOC) data (2008). Analysis excluded offenders with life sentences.
32. Justice Center analysis of MDOC 2007 release data.
33. Ibid.
Notes

��Justice Reinvestment in Michigan
to learn more about the justice reinvestment strategy in michigan and other states, please visit:
www.justicereinvestment.org.
The Justice Center is a national, nonpartisan organization that works with policymakers to develop data-driven, consensus-based strategies that increase public safety and strengthen communities. Assistance from the Justice Center is made possible in part through funding support provided by the Bureau of Justice Assistance, a component of the U.S. Department of Justice, and the Public Safety Performance Project of The Pew Charitable Trusts’ Center on the States.
This project was supported by Grant No 2008-DD-BX-0685 awarded by the Bureau of Justice Assistance. The Bureau of Justice Assistance is a component of the Office of Justice Pro-grams, which also includes the Bureau of Justice Statistics, the National Institute of Justice, the Office of Juvenile Justice and Delinquency Prevention, and the Office for Victims of Crime. Points of view or opinions in this document are those of the author and do not represent the official position or policies of the United State Department of Justice.
To learn more about the Bureau of Justice Assistance, please visit: http://www.ojp.usdoj.gov/BJA/.
Research and analysis described in this report also have been funded by the Public Safety Performance Project of The Pew Charitable Trusts’ Center on the States. Launched in 2006 as a project of the Pew Center on the States, the Public Safety Performance Project seeks to help states advance fiscally sound, data-driven policies and practices in sentencing and corrections that protect public safety, hold offenders accountable, and control corrections costs.
To learn more about the Public Safety Performance Project, please visit: http://www.pewpublicsafety.org/.
Points of view, recommendations, or findings stated in this document are those of the authors and do not necessarily represent the official position or policies of the United States Department of Justice, The Pew Charitable Trusts, Council of State Governments Justice Center, or the Council of State Governments’ members.
Suggested citation: Council of State Governments Justice Center, Justice Reinvestment in Michigan: Analyses of Crime, Community Corrections and Sentencing Policies, (New York: Council of State Governments Justice Center, 2009).
Council of State GovernmentsJustice Center
www.justicecenter.csg.org
100 Wall Street20th FloorNew York, NY 10005tel: 212-482-2320fax: 212-482-2344
4630 Montgomery AvenueSuite 650 Bethesda, MD 20814tel: 301-760-2401 fax: 240-497-0568
project contact:LaToya McBean [email protected]
504 W. 12th Street Austin, TX 78701tel: 512-482-8298fax: 512-474-5011