the lldb debugger in freebsd by ed maste
TRANSCRIPT
The LLDB Debugger in FreeBSD
Ed Maste EuroBSDCon 2014

Why a New Debugger?
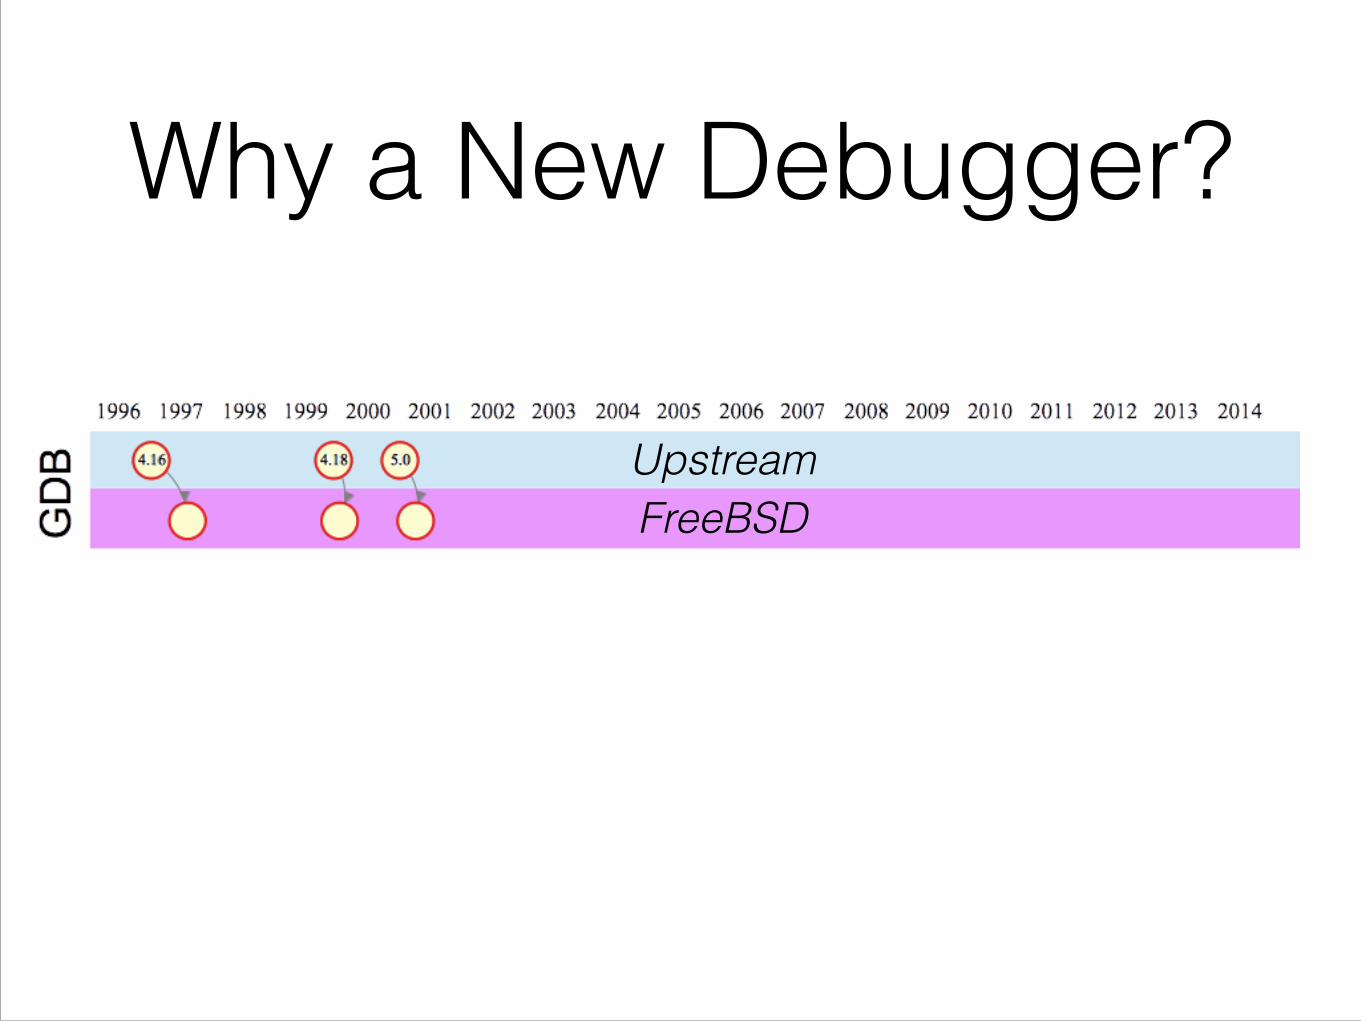
Why a New Debugger?
UpstreamFreeBSD

Why a New Debugger?

Why a New Debugger?
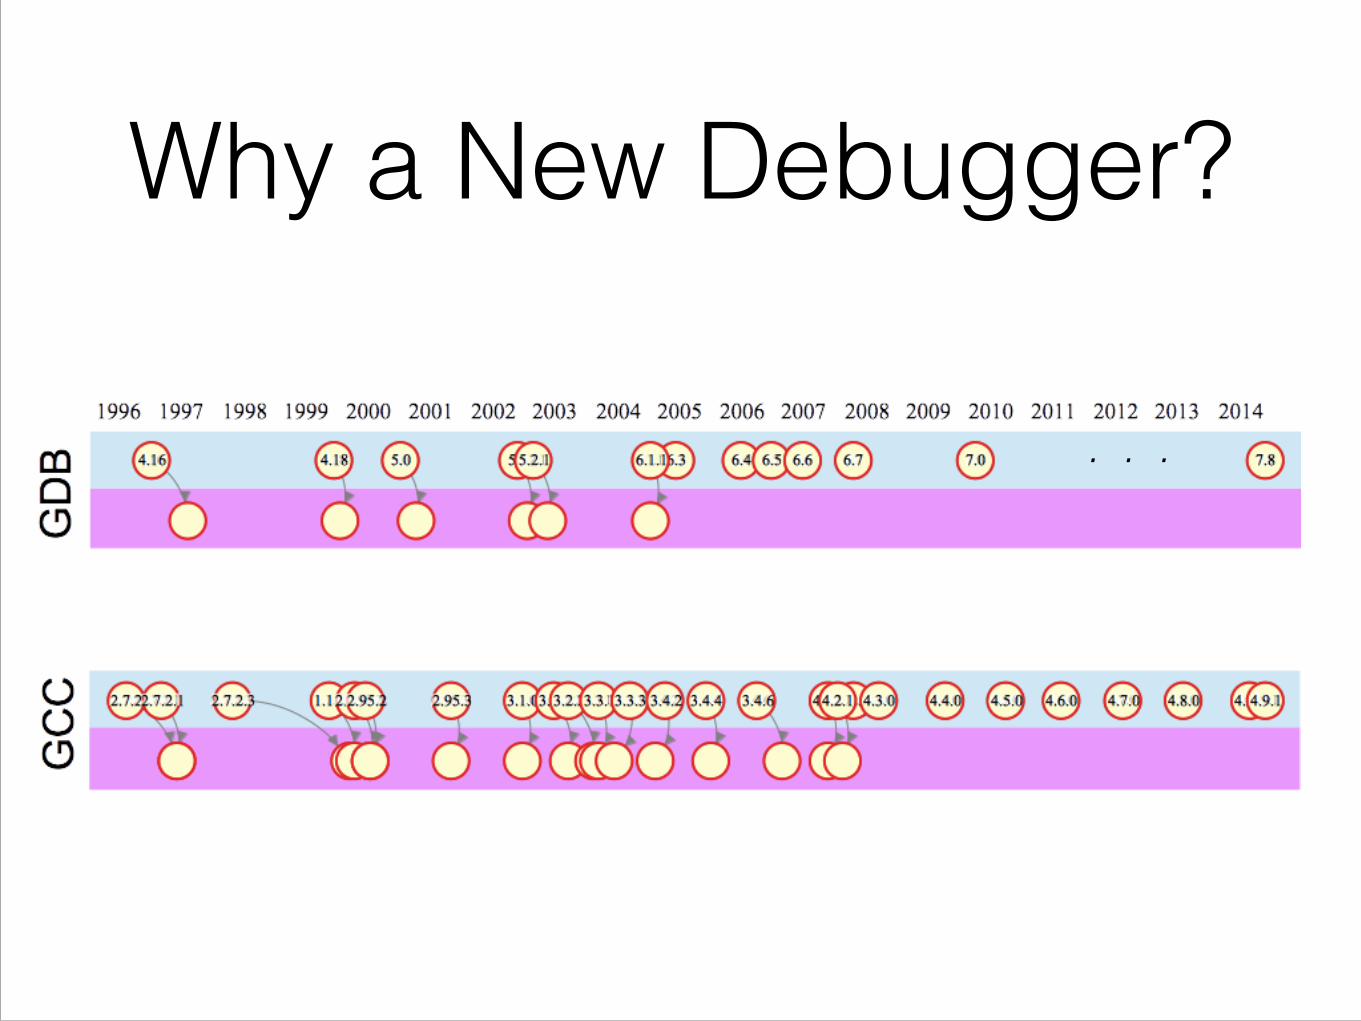
Why a New Debugger?
. . .

Why a New Debugger?

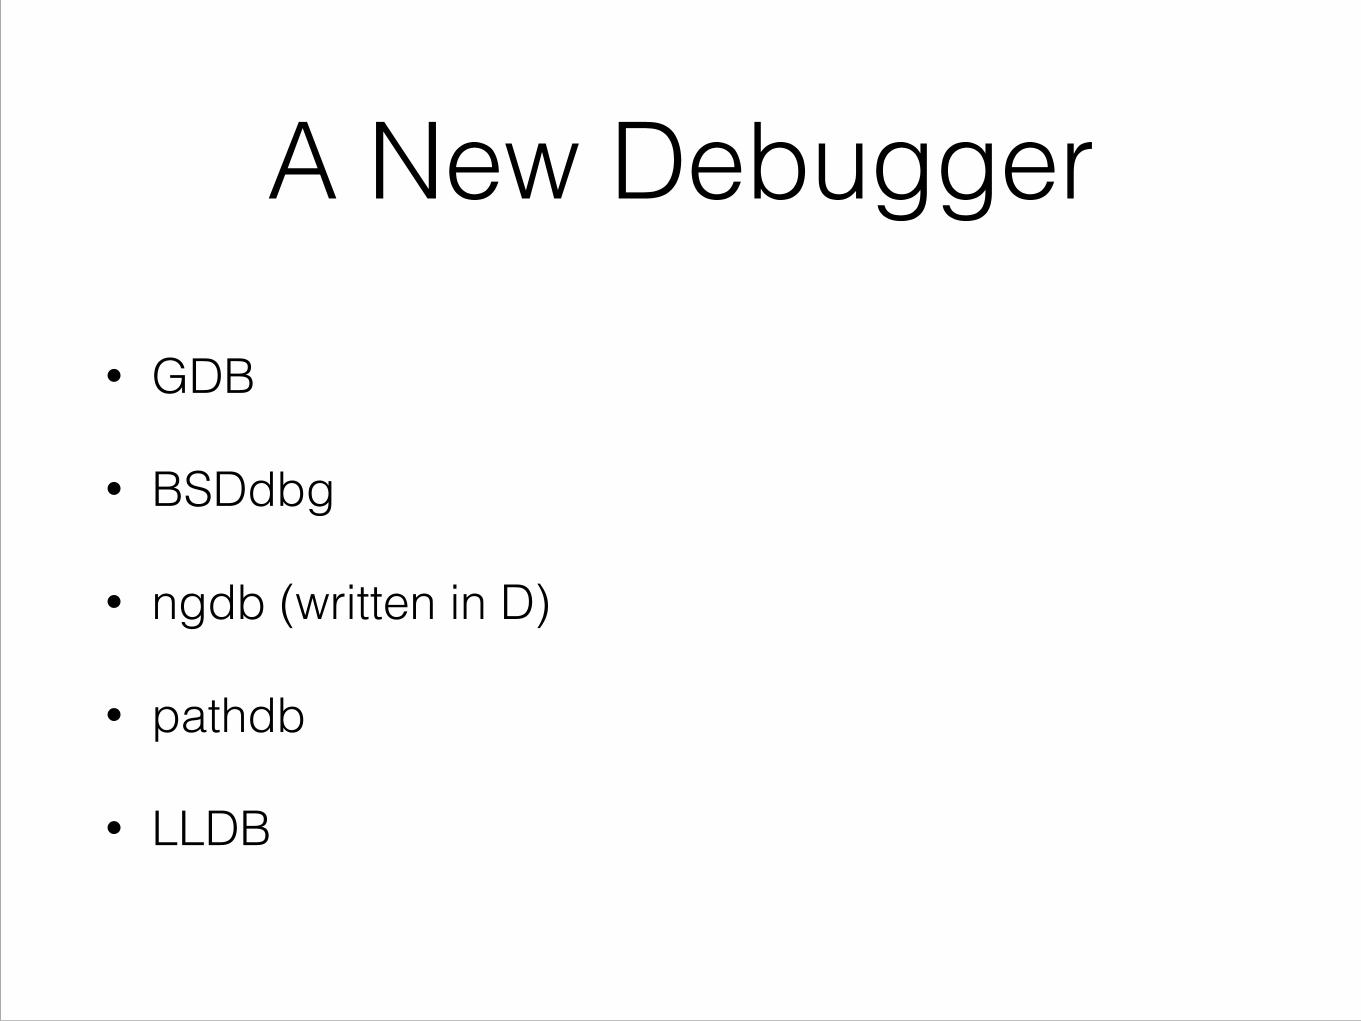
A New Debugger• GDB
• BSDdbg
• ngdb (written in D)
• pathdb
A New Debugger• GDB
• BSDdbg
• ngdb (written in D)
• pathdb
• LLDB
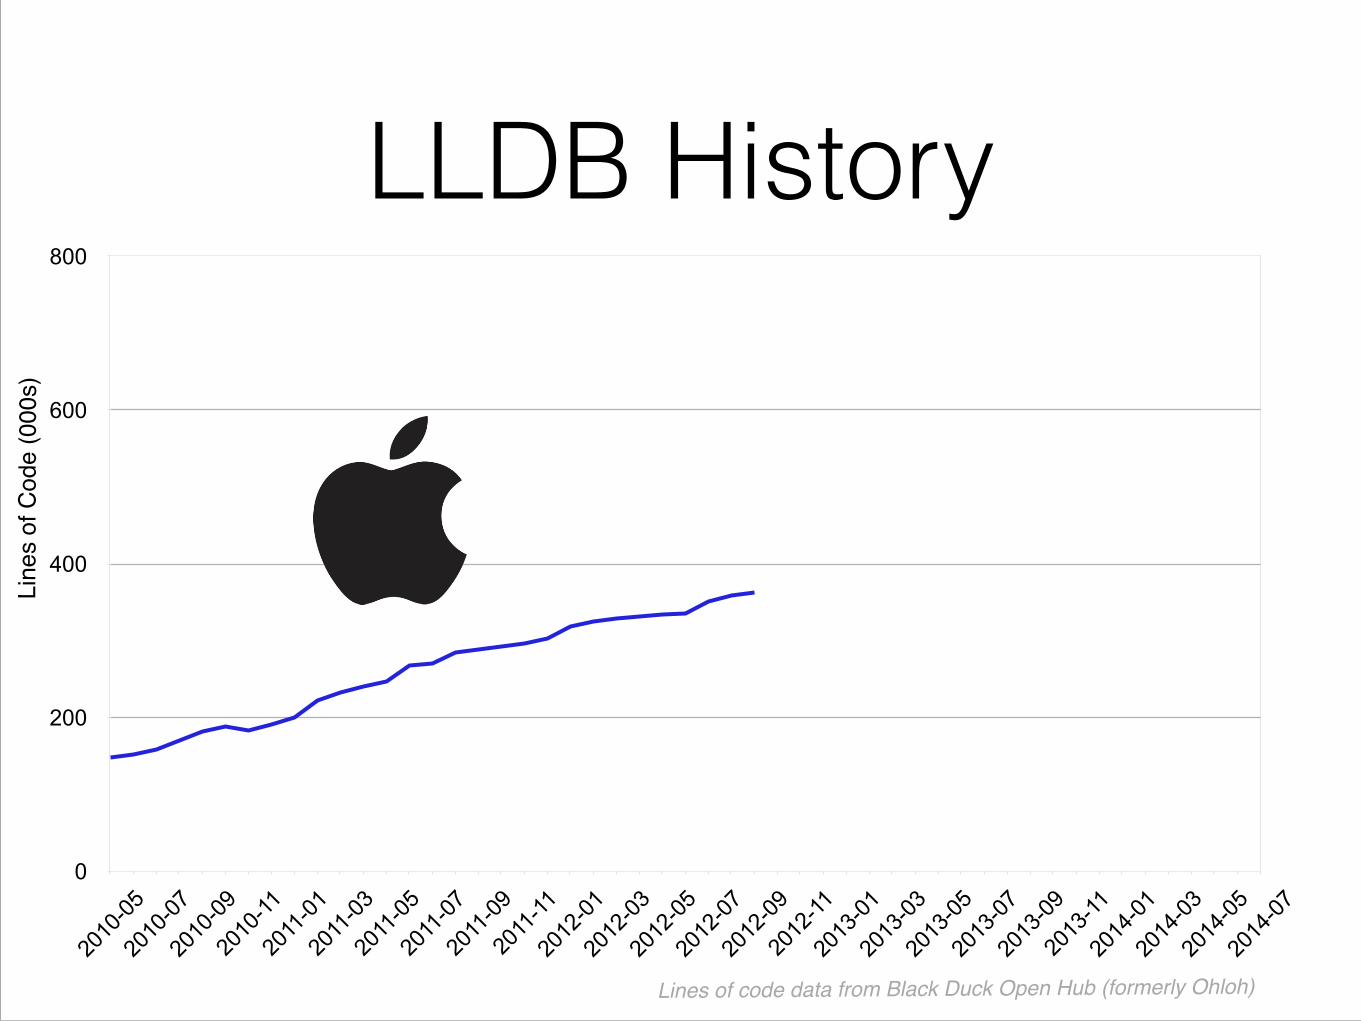
LLDB History
0
200
400
600
800
2010-05
2010-07
2010-09
2010-11
2011-01
2011-03
2011-05
2011-07
2011-09
2011-11
2012-01
2012-03
2012-05
2012-07
2012-09
2012-11
2013-01
2013-03
2013-05
2013-07
2013-09
2013-11
2014-01
2014-03
2014-05
2014-07
Line
s of
Cod
e (0
00s)
Lines of code data from Black Duck Open Hub (formerly Ohloh)
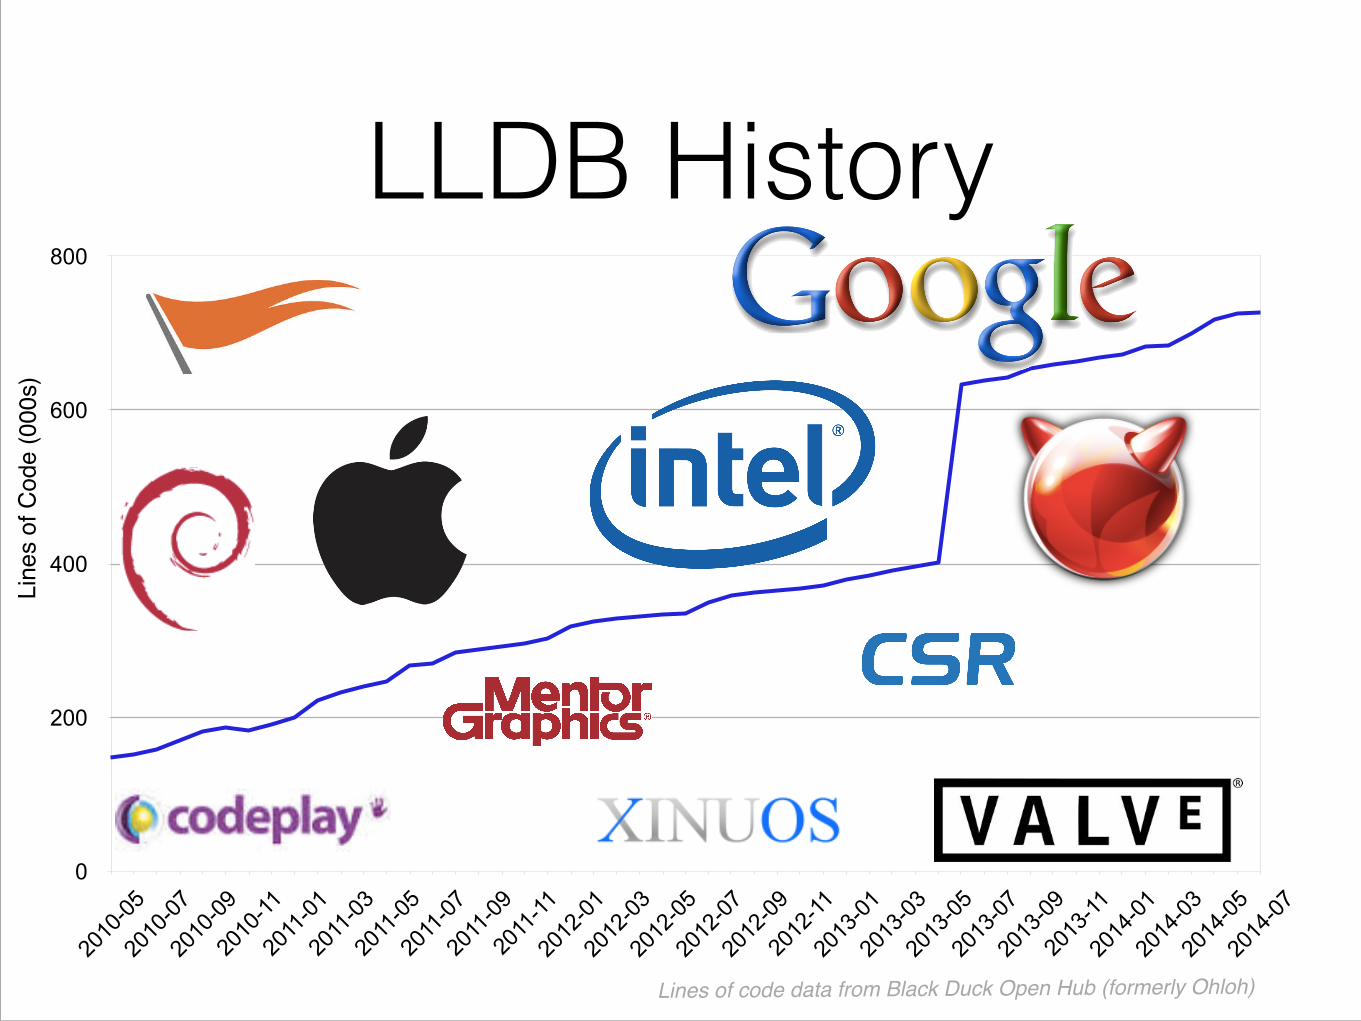

0
200
400
600
800
2010-05
2010-07
2010-09
2010-11
2011-01
2011-03
2011-05
2011-07
2011-09
2011-11
2012-01
2012-03
2012-05
2012-07
2012-09
2012-11
2013-01
2013-03
2013-05
2013-07
2013-09
2013-11
2014-01
2014-03
2014-05
2014-07
LLDB HistoryLi
nes
of C
ode
(000
s)
Lines of code data from Black Duck Open Hub (formerly Ohloh)

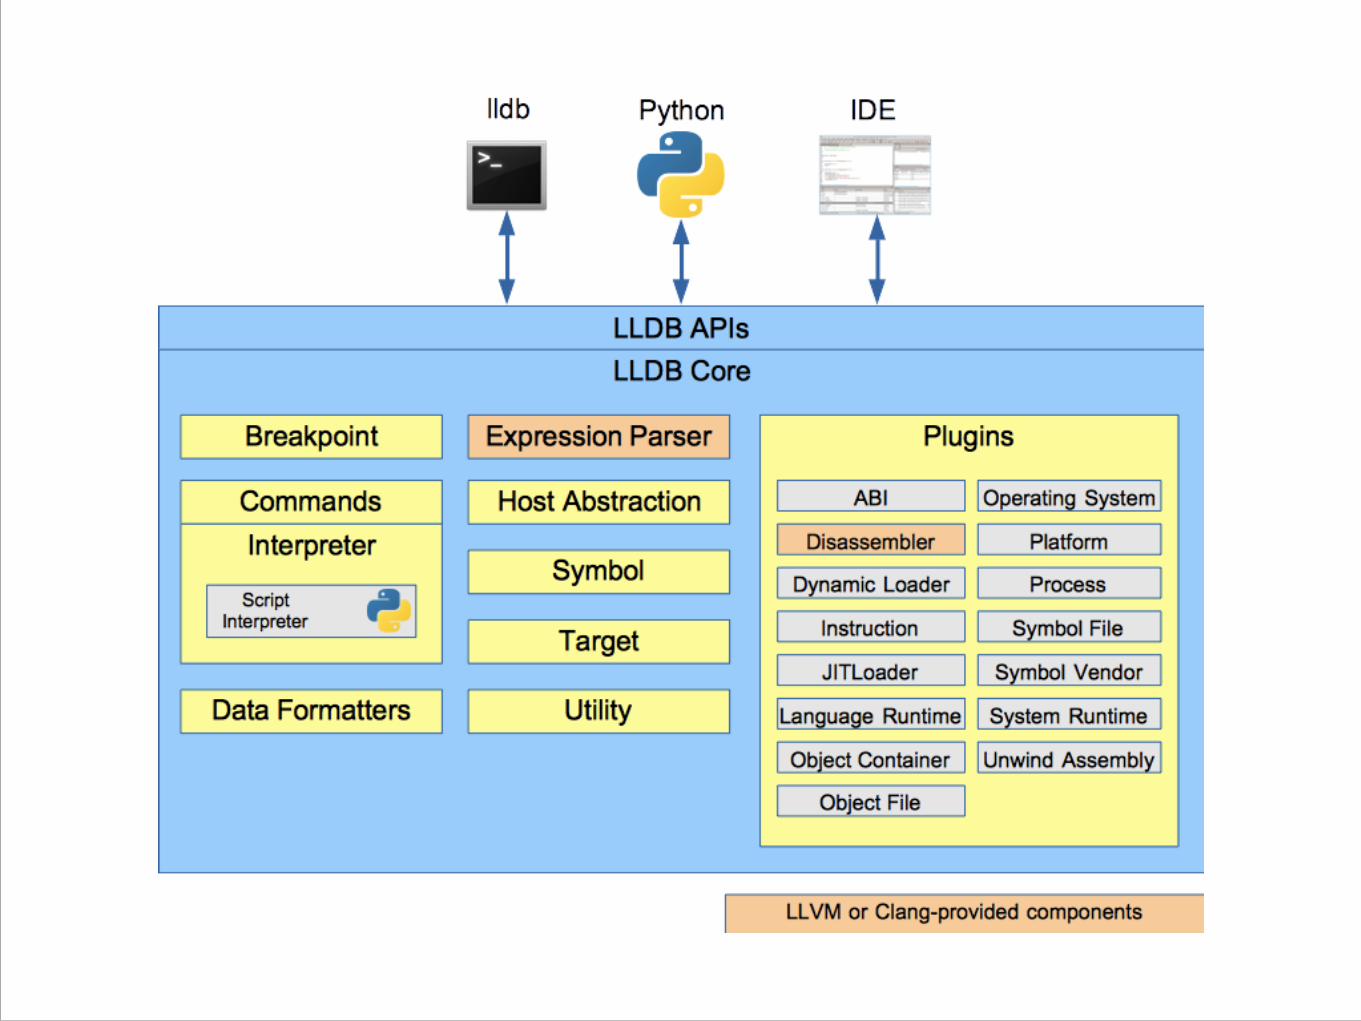
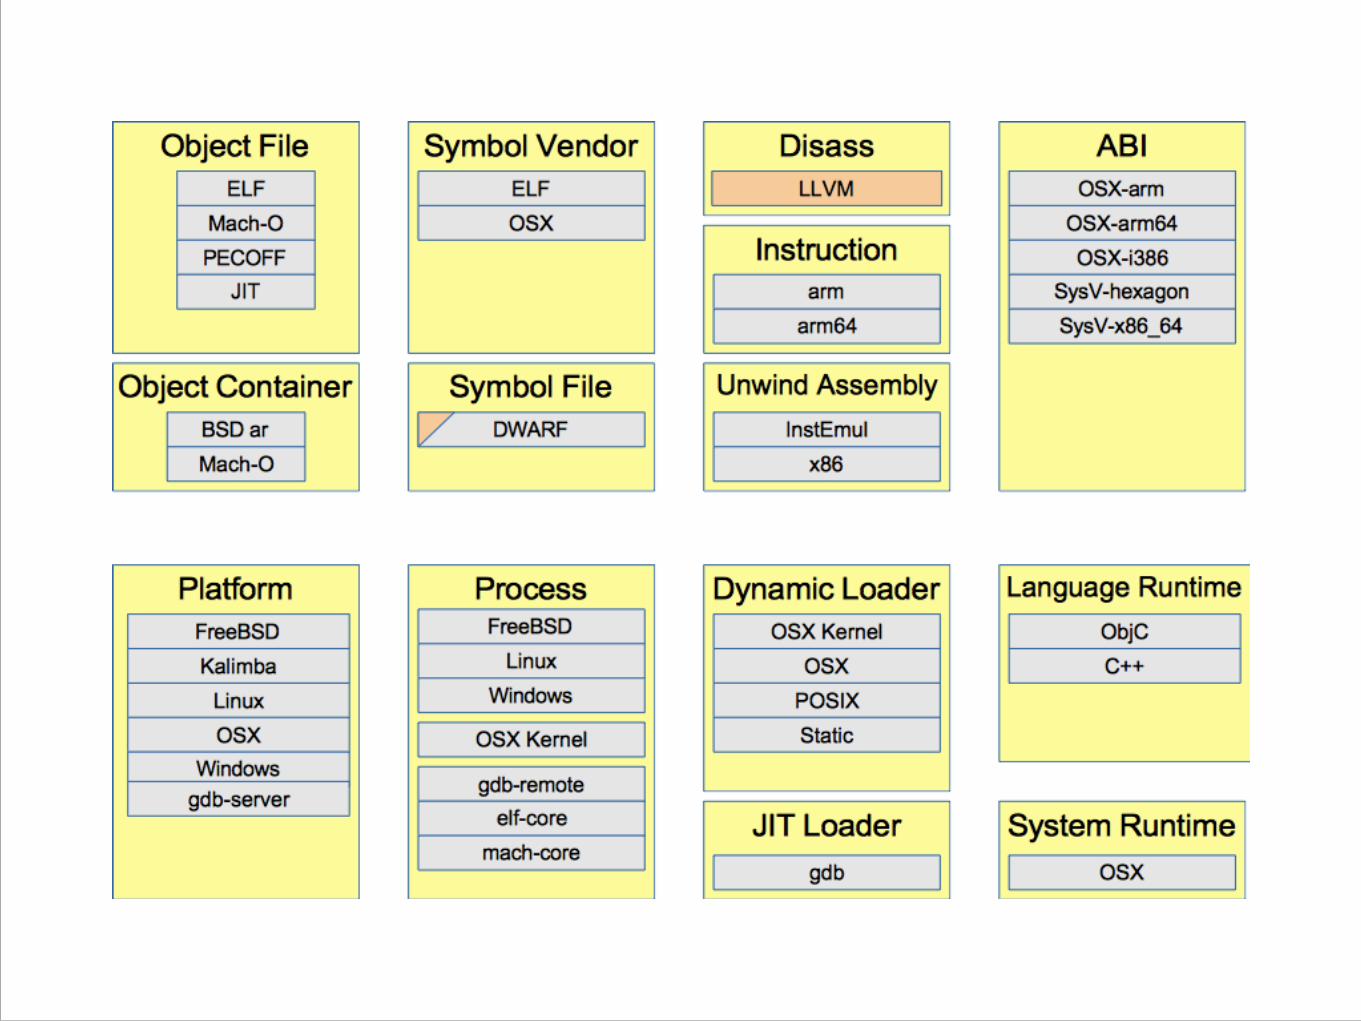
LLDB Design


LLDB Use
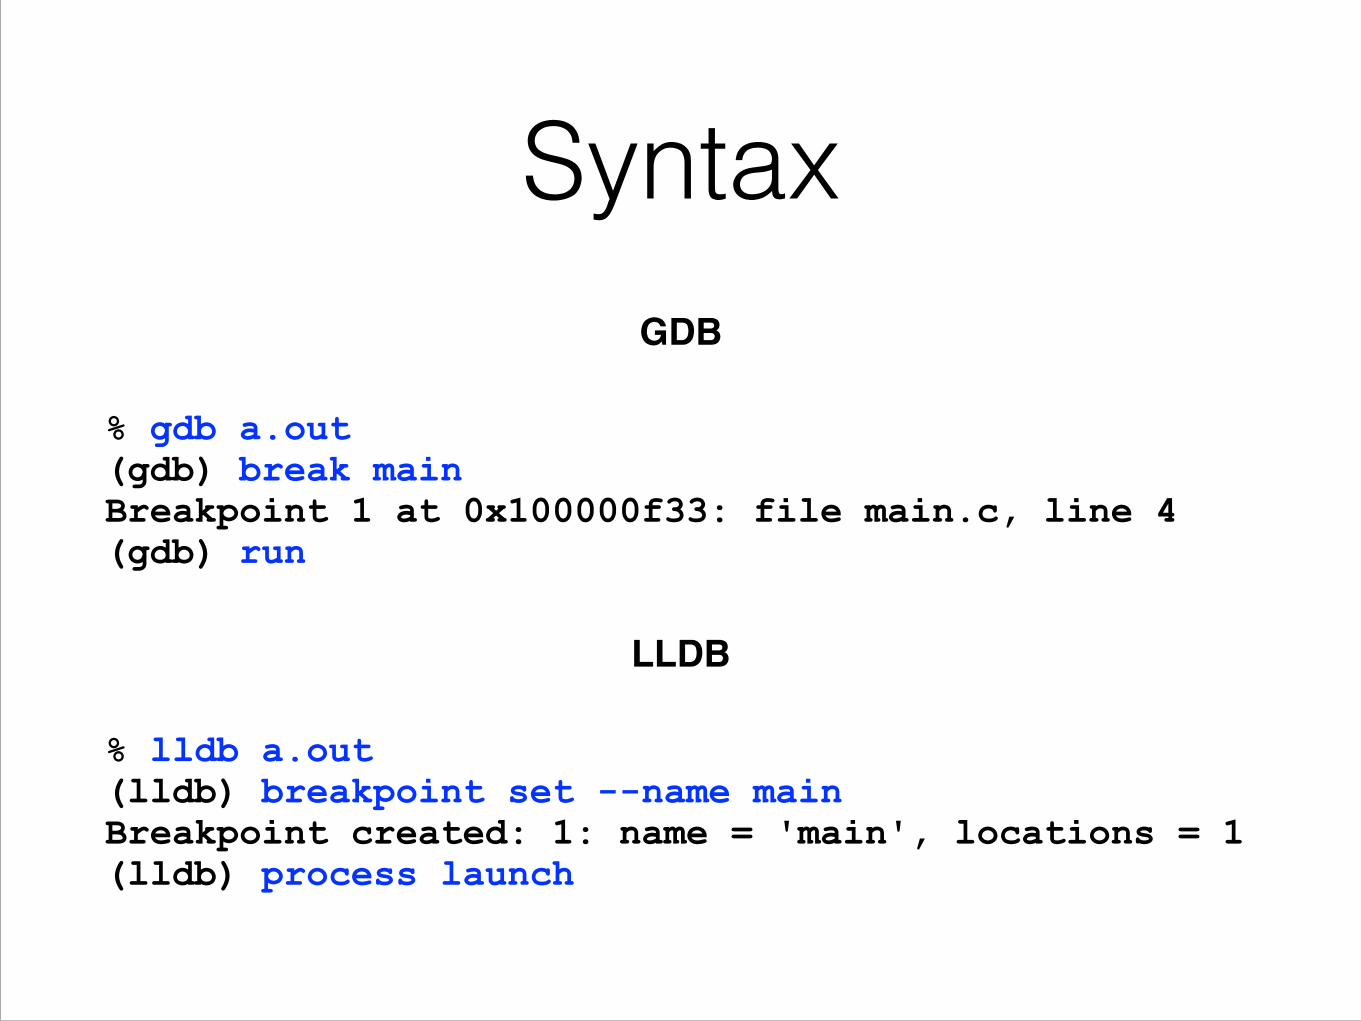
SyntaxGDB!
% gdb a.out (gdb) break main Breakpoint 1 at 0x100000f33: file main.c, line 4(gdb) run
LLDB!
% lldb a.out (lldb) breakpoint set --name main Breakpoint created: 1: name = 'main', locations = 1(lldb) process launch
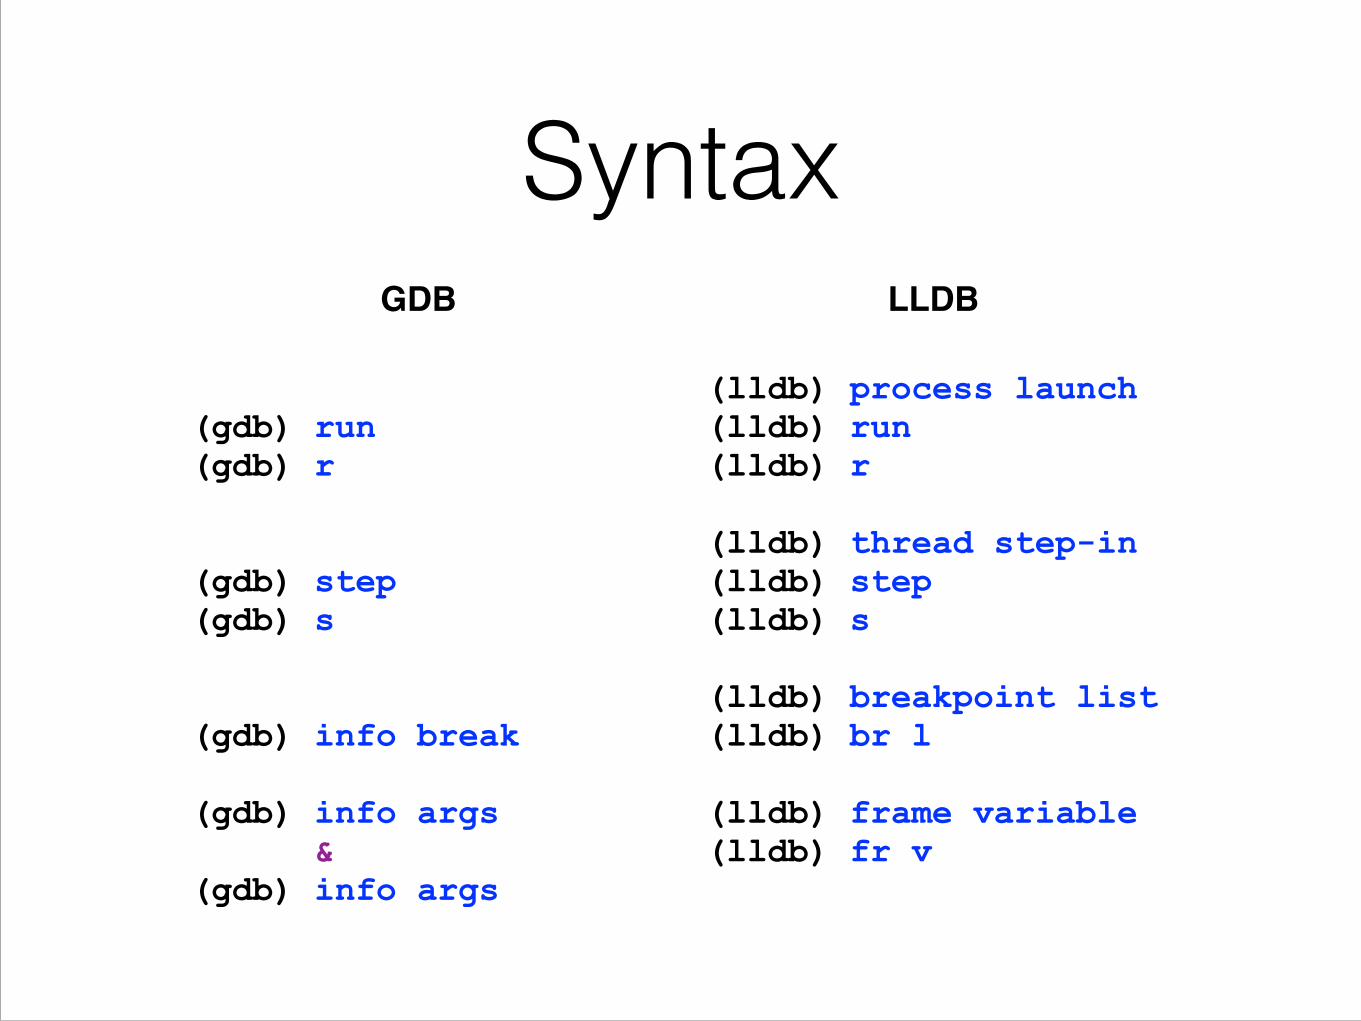
SyntaxGDB!
(gdb) run (gdb) r (gdb) step (gdb) s (gdb) info break (gdb) info args & (gdb) info args
LLDB!
(lldb) process launch (lldb) run (lldb) r (lldb) thread step-in (lldb) step (lldb) s (lldb) breakpoint list (lldb) br l (lldb) frame variable (lldb) fr v

Demo
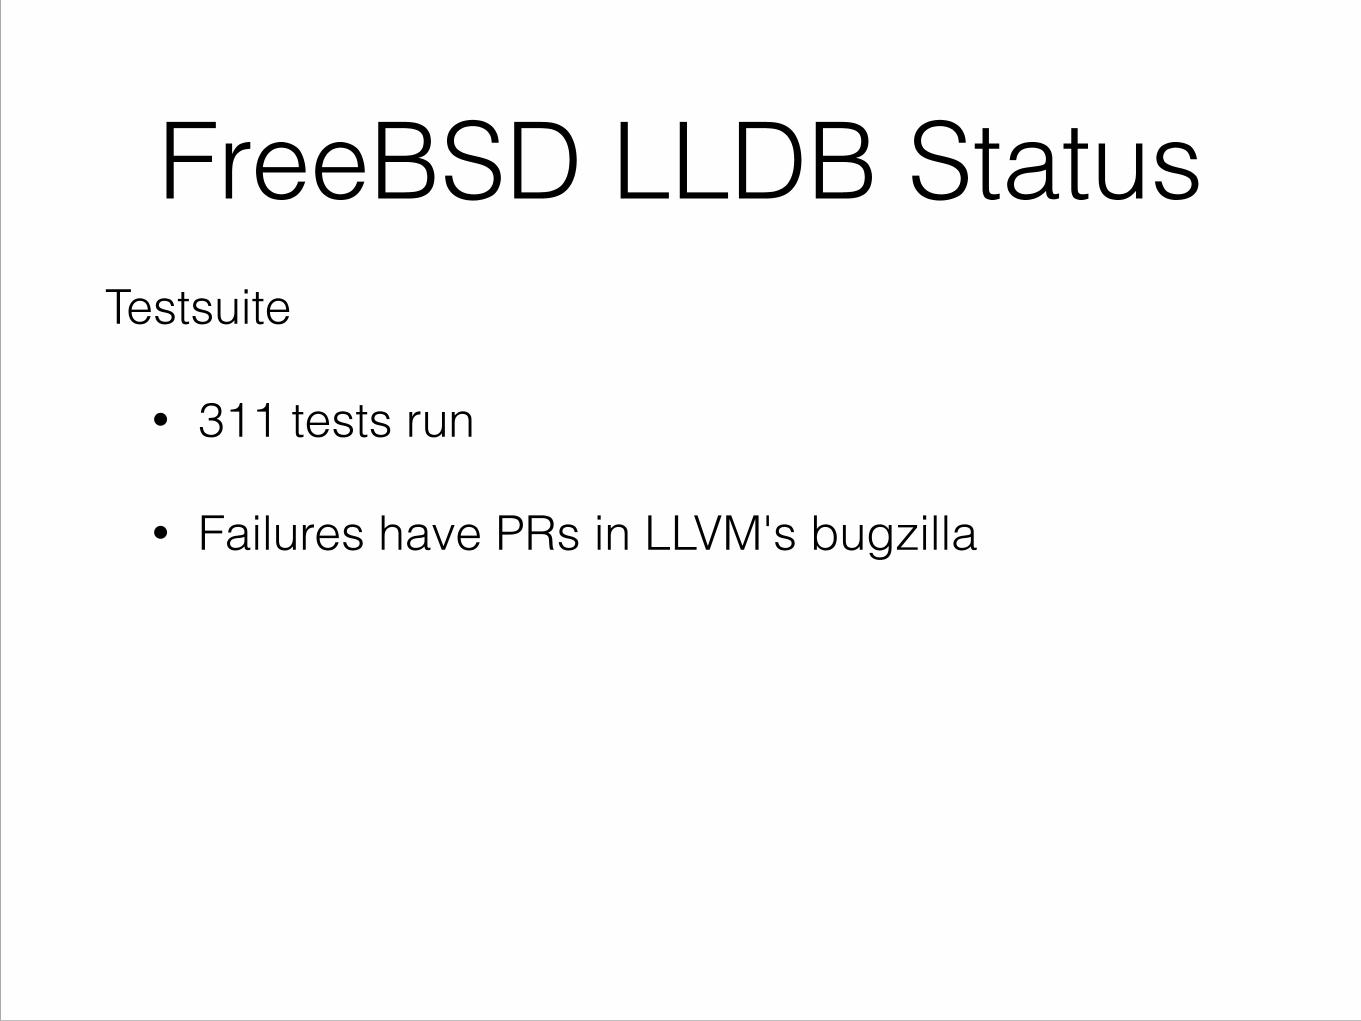
FreeBSD LLDB StatusTestsuite
• 311 tests run
• Failures have PRs in LLVM's bugzilla

FreeBSD LLDB StatusTargets
• amd64 • i386 (code in tree) • MIPS (userland core files) • ARM (in LLDB core, not FreeBSD/Linux) • AArch64 • PowerPC / PowerPC64 • Sparc64 • ia64
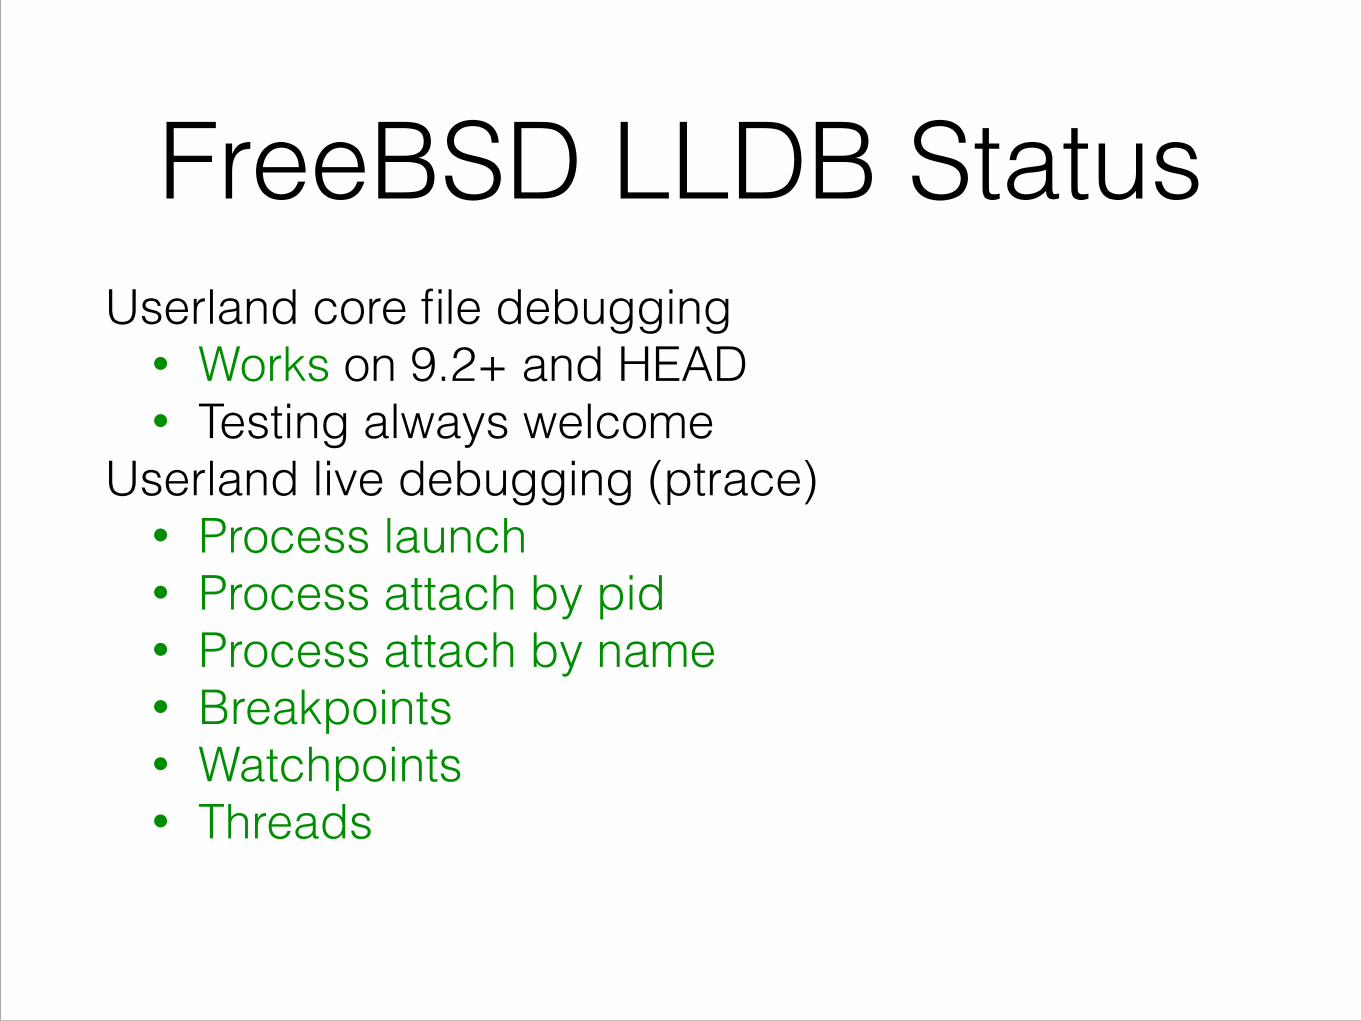
FreeBSD LLDB StatusUserland core file debugging
• Works on 9.2+ and HEAD • Testing always welcome
Userland live debugging (ptrace) • Process launch • Process attach by pid • Process attach by name • Breakpoints • Watchpoints • Threads

FreeBSD LLDB StatusKernel core file debugging
• GSoC proof of concept • Consider switch to ELF dumps
!Kernel live debugging
• GSoC proof of concept • /dev/mem • gdb remote (serial) • remote debugging over Ethernet (TBD)
!

FreeBSD LLDB StatusRemote Debugging - GDB Protocol
• Testing required !Debugserver
• lldb-gdbserver (llgs) in progress on Linux !Cross debugging
• Cross-arch and Cross-OS • Minor issues • Needs testing

FreeBSD LLDB Roadmap• Source in contrib/llvm/tools/lldb • FreeBSD build infrastructure in the tree • Optional build, in /etc/src.conf WITH_LLDB=YES !
• Clang 3.5 import • LLDB update • Enable by default

FreeBSD LLDB RoadmapPython • not in base system • currently a compile-time option • move to a run-time option with a special bridge port


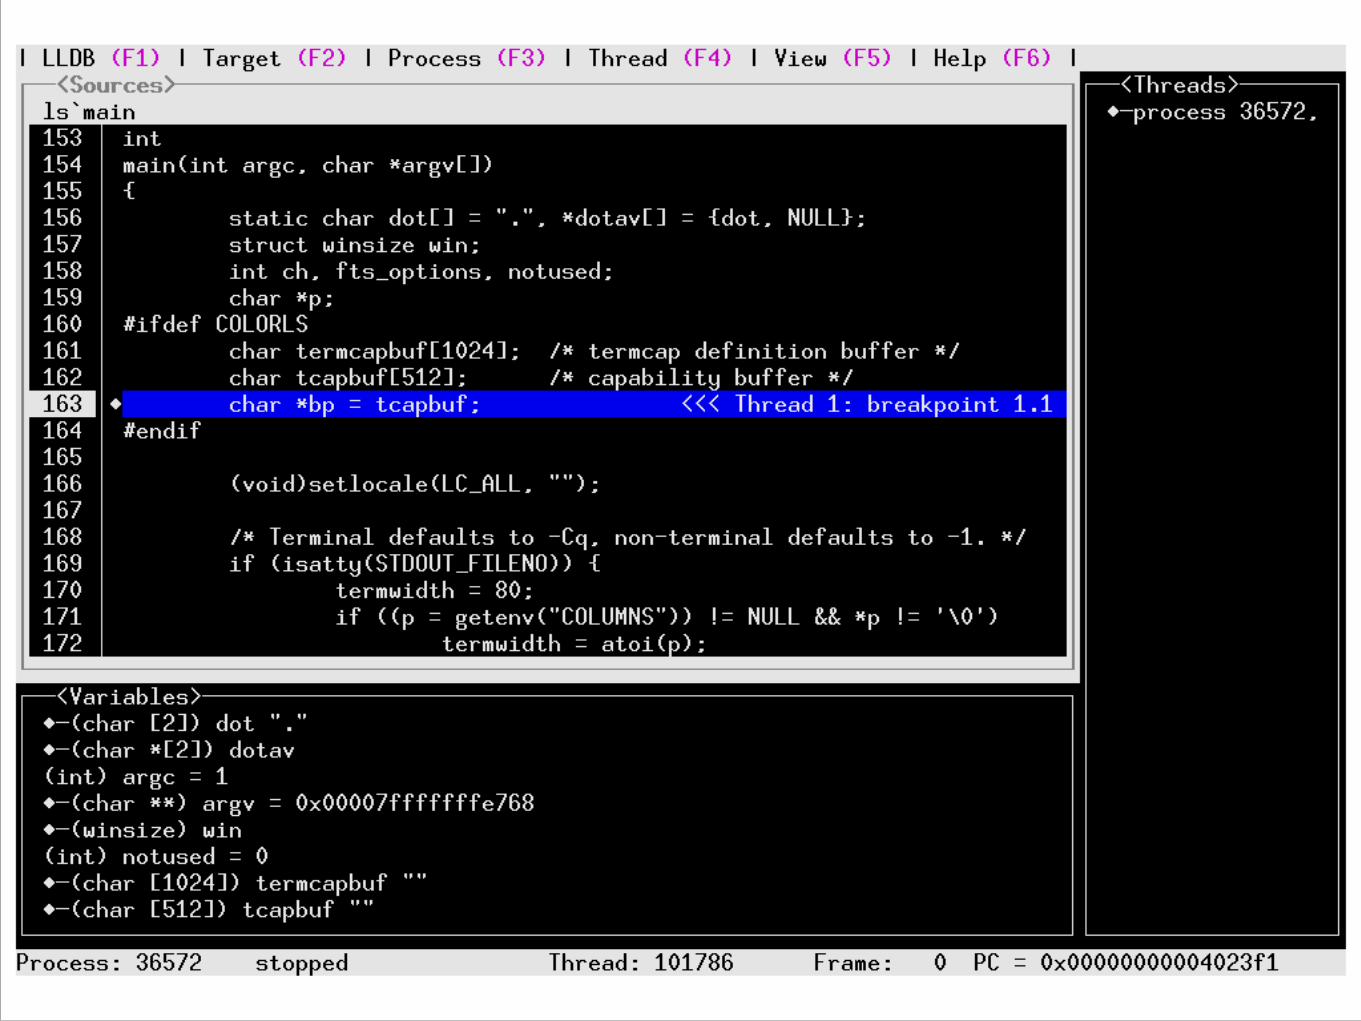
Front Ends• Built-in text user interface
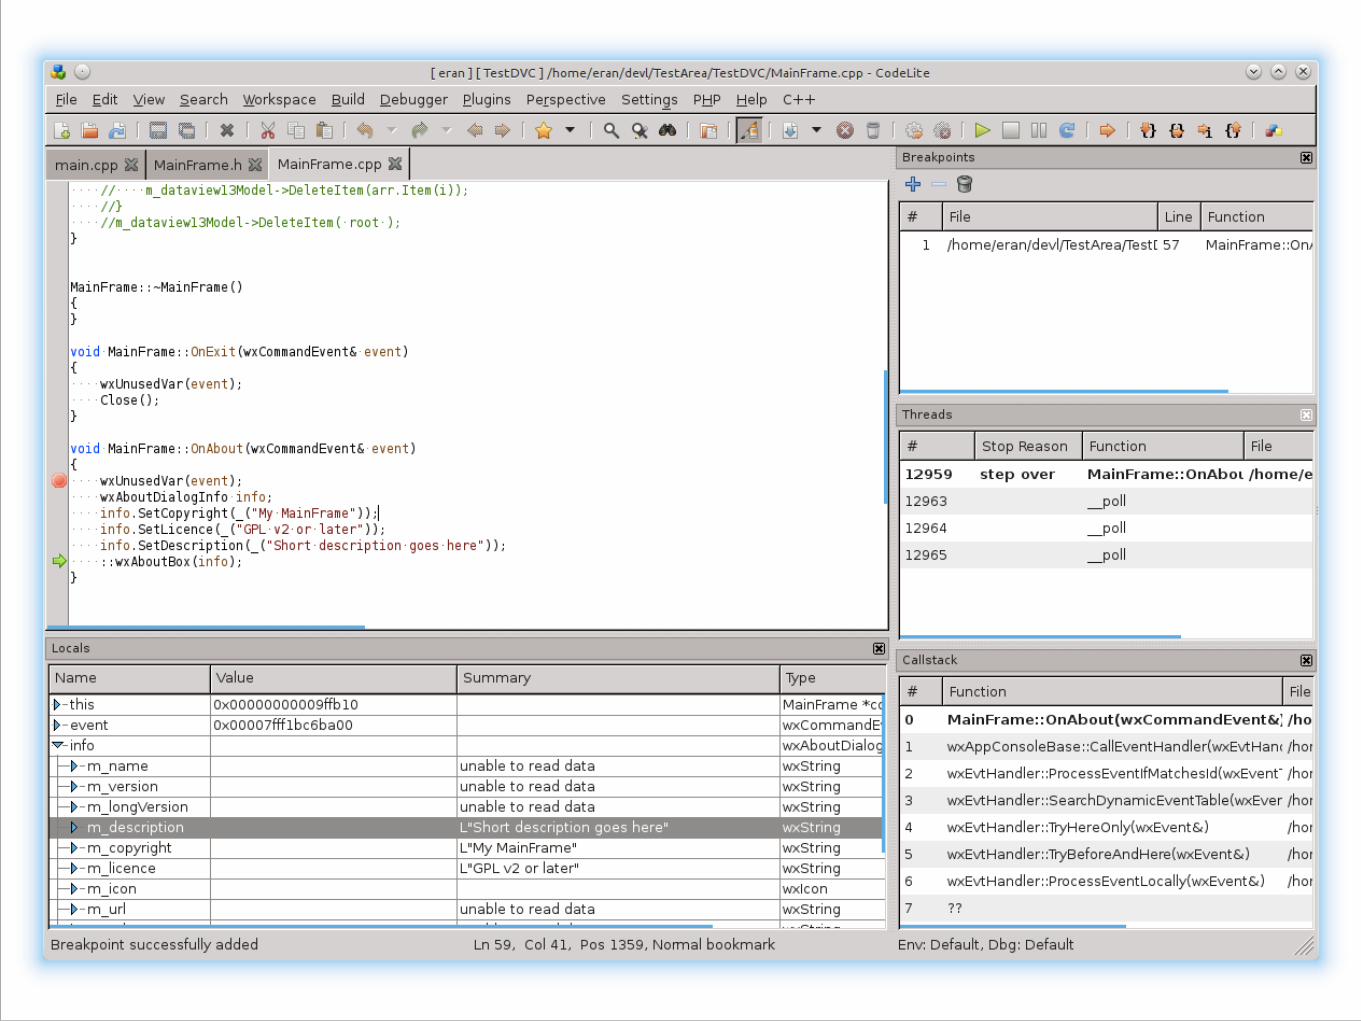
• Codelite
• XCode
• GDB/MI-compatible interface
• Eclipse
• Many others

Expression Evaluation(lldb) expr some_variable

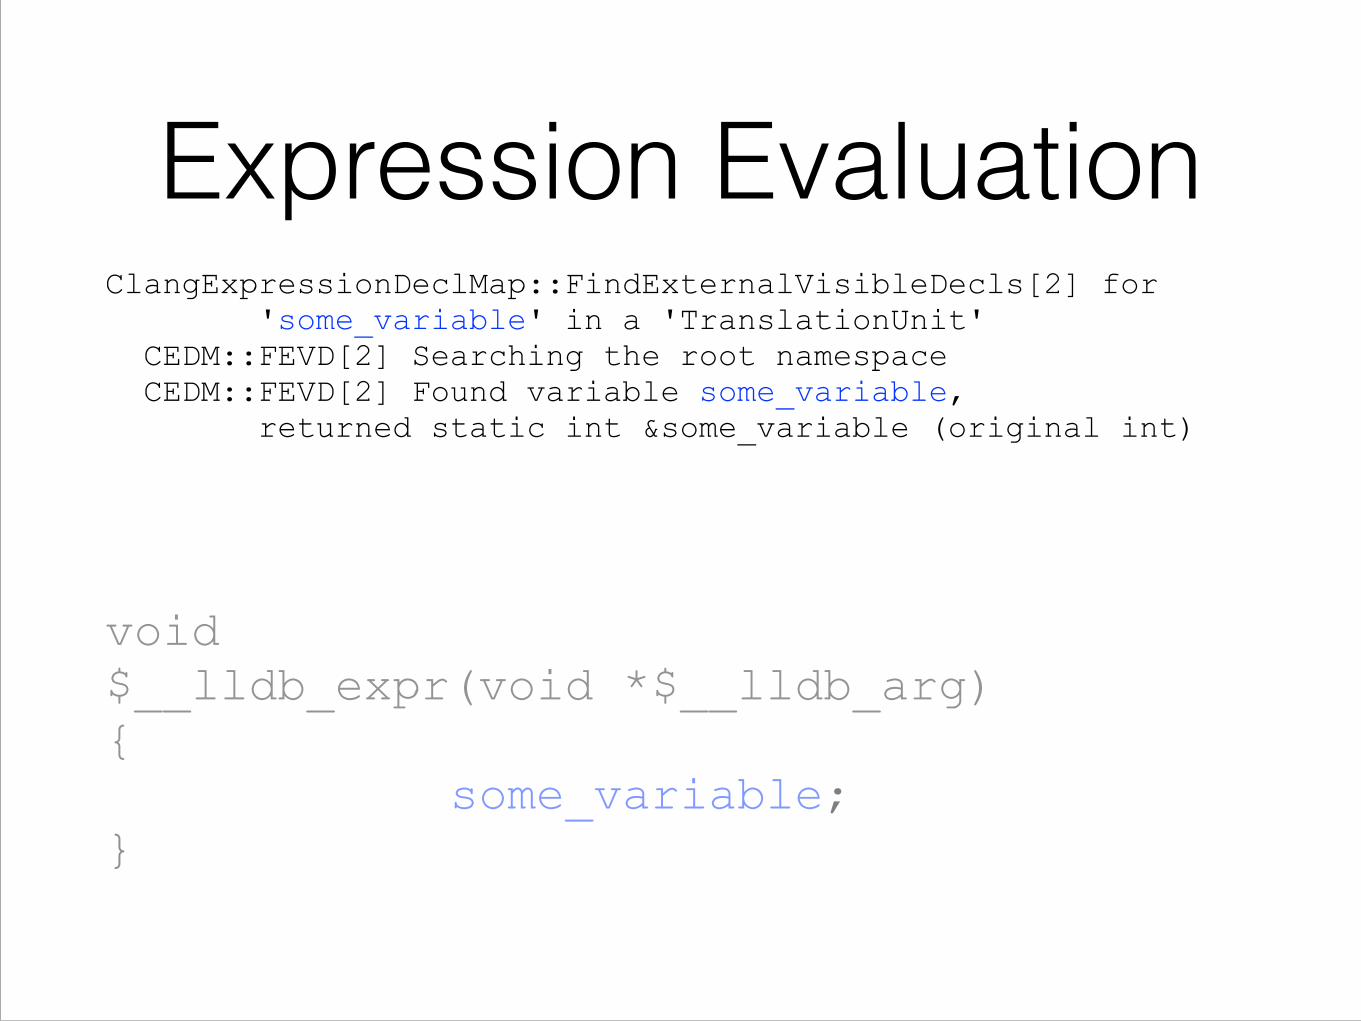
Expression Evaluationvoid $__lldb_expr(void *$__lldb_arg) { some_variable; }

Expression Evaluation#undef NULL #define NULL (__null) typedef signed __INT8_TYPE__ int8_t; typedef unsigned __INT8_TYPE__ uint8_t; … void $__lldb_expr(void *$__lldb_arg) { some_variable; }
void $__lldb_expr(void *$__lldb_arg) { some_variable; }
Expression EvaluationClangExpressionDeclMap::FindExternalVisibleDecls[2] for 'some_variable' in a 'TranslationUnit' CEDM::FEVD[2] Searching the root namespace CEDM::FEVD[2] Found variable some_variable, returned static int &some_variable (original int)

void $__lldb_expr(void *$__lldb_arg) { some_variable; }
Expression EvaluationLast statement is an lvalue with type: intT *$__lldb_expr_result_ptr = …

void $__lldb_expr(void *$__lldb_arg) { some_variable; }
Expression EvaluationLast statement is an lvalue with type: int*(arg + 0) = *(arg + 8)

Expression Evaluation; Function Attrs: nounwind define void @"_Z12$__lldb_exprPv"(i8* %"$__lldb_arg") #0 { %1 = alloca i8*, align 8, !clang.decl.ptr !8 store i8* %"$__lldb_arg", i8** $1, align 8 %2 = load i8* @"_ZGVZ12$__lldb_exprPvE23$__lldb_expr_result_ptr", align 1 %3 = icmp eq i8 %2, 0 br i1 %3, label %4, label %6 ; <label>:4 ; preds = %0 %5 = load i32** @_ZL13some_variable, align 8 store i32* %5, i32** @"_ZZ12$__lldb_exprPvE23$__lldb_expr_result_ptr", align 8 store i8 1, i8* @"_ZGVZ12$__lldb_exprPvE23$__lldb_expr_result_ptr" br label %6 ; <label>:6 ; press = %4, %0 ret void }

Expression Evaluation; Function Attrs: nounwind define void @"_Z12$__lldb_exprPv"(i8* %"$__lldb_arg") #0 { %1 = getelementptr i8* %"$__lldb_arg", i32 8 %2 = bitcast i8* %1 to i32** %3 = getelementptr i8* %"$__lldb_arg", i32 0 %4 = bitcast i8* %3 to i32** %5 = alloca i8*, align 8, !clang.decl.ptr !8 store i8* %"$__lldb_arg", i8** %5, align 8 %6 = icmp eq i8 0, 0 br i1 %6, label %7, label %9 !; <label>:7 ; preds = %0 %8 = load i32** %2, align 8 store i32* %8, i32** %4, align 8 br label %9 !; <label>:9 ; preds = %7, %0 ret void }