the limits of propaganda: national bureau of … · the power of propaganda to mobilize the masses....
TRANSCRIPT

NBER WORKING PAPER SERIES
THE LIMITS OF PROPAGANDA:EVIDENCE FROM CHAVEZ'S VENEZUELA
Brian KnightAna Tribin
Working Paper 22055http://www.nber.org/papers/w22055
NATIONAL BUREAU OF ECONOMIC RESEARCH1050 Massachusetts Avenue
Cambridge, MA 02138March 2016
For helpful comments, we thank seminar participants at Brown University, Rice University, Carnegie Mellon University, Barcelona GSE Summer Forum, Stony Brook Political Economy Conference, and the New York City Media Seminar. The views expressed herein are those of the authors and do not necessarily reflect the views of the National Bureau of Economic Research.
NBER working papers are circulated for discussion and comment purposes. They have not been peer-reviewed or been subject to the review by the NBER Board of Directors that accompanies official NBER publications.
© 2016 by Brian Knight and Ana Tribin. All rights reserved. Short sections of text, not to exceed two paragraphs, may be quoted without explicit permission provided that full credit, including © notice, is given to the source.

The Limits of Propaganda: Evidence from Chavez's VenezuelaBrian Knight and Ana TribinNBER Working Paper No. 22055March 2016JEL No. D6,D70,D8
ABSTRACT
In this paper, we investigate viewer responses to changes in the ideological content of television programming using variation induced by cadenas, unannounced takeovers of the public television airwaves by the government in Venezuela. Using high-frequency ratings data, we find that, consistent with the predictions of our choice model, the drop-off in ratings during cadenas is concentrated among viewers of news programming on opposition private channels, as opposed to viewers of news on pro-government public channels. Also consistent with the predictions of our model, the drop-off in ratings for private channels with moderate ideology takes an intermediate value. In addition, the drop-off is stronger for viewers with access to cable channels, which are not required to air cadenas. Consistent with this result, we also show that viewership of an opposition cable channel rises during cadenas. Complementing this analysis, we then estimate the parameters of the theoretical model in a structural analysis. Using these parameter estimates, we consider counterfactual scenarios, allowing for an examination of the dynamic responses of viewers of differing ideology to cadenas and an analysis of the welfare consequences of cadenas.
Brian KnightBrown UniversityDepartment of Economics, Box B64 Waterman StreetProvidence, RI 02912and [email protected]
Ana TribinCentral Bank of ColumbiaBogota, [email protected]

1 Introduction
The media is often considered essential in the functioning of democracy via the provision of infor-mation to voters. At the same time, there is a temptation for incumbent governments to use mediaoutlets to deliver political propaganda. This propaganda can be used by the government, amongother ways, to promote its policies, increase its standing with the population in advance of elec-tions, and to criticize opposition leaders and parties. If influential, propaganda may lead to moralhazard, via poor monitoring of incumbents by voters, and the re-election of low quality politiciansand parties.
Sophisticated consumers of information may respond to such propaganda in a variety of ways.One possibility involves viewers discounting biased information.1 A second possibility involvesviewers switching to other media outlets that are not delivering government propaganda.2 Witha preference for like-minded information, this second possibility is particularly relevant for con-sumers affiliated with the opposition. Given that the second option will only be available in mediasectors that are pluralistic, a third possibility involves consumers simply “tuning out”, or consum-ing less information overall across all media outlets. Like the second option, tuning out may beespecially relevant for the opposition.
In this paper, we focus on these two latter responses, switching to outlets with like-minded con-tent and tuning out. By their very nature, these responses can limit the influence of propaganda.Given that, as noted above, both switching and tuning out may be especially common among theopposition, then propaganda, if influential, may lead to an increased polarization of the electorate.Likewise, we examine whether or not switching and tuning out are more common among individ-uals with a larger choice set. If so, and given that higher income individuals typically have largerchoice sets, polarization according to income may also increase, with the poor disproportionatelyexposed to and influenced by propaganda.
While Durante and Knight (2012) investigate, in the Italian context, switching over severalyears, we investigate these issues, both switching and tuning out, using high-frequency televisionratings data from the country of Venezuela, where Hugo Chavez and his successor have routinelyused cadenas, speeches by government officials that are required to be aired live by all broad-cast television channels. Thus, during a cadena, viewers watching television face the same pro-gramming on every broadcast channel. Importantly, these cadenas are not announced in advanceto viewers, providing an experiment through which to examine short-run responses, in terms ofchanges in viewership, to government propaganda. In addition, cadenas were not required to beaired by cable channels during our sample period, allowing us to examine whether households with
1See Chiang and Knight (2011).2See Durante and Knight (2012).
2
larger choice sets are more likely to switch to other outlets when faced with propaganda. Finally,broadcast channels in Venezuela during our sample period cover the political spectrum and can benaturally categorized as either opposition or pro-government. This allows us to examine whetherswitching and tuning out are more common among opposition viewers, who, as we document usingsurvey data, are more likely to watch opposition news programming.
To develop a set of testable hypotheses, we begin by building a simple model of consumerchoice of television programming. In the model, there are two types of consumers, oppositionand pro-government, both with a preference for like-minded information, two types of channels,opposition and government, and two types of programming, news and cadenas. We begin byassuming that both channels are required to air cadenas and thus initially focus on tuning out. Themodel predicts that, with positive switching costs and a preference for like-minded news, the drop-off in viewership when transitioning from news to cadena is more significant for the oppositionchannel than for the pro-government channel. This is due to the selection of opposition viewersinto news programming on the opposition channel and the selection of pro-government viewersinto news programming on the government channel. Introducing a third channel, which is moderatein nature, the model predicts that the drop-off in ratings when moving from news programming tocadenas should be most significant for the opposition channel, followed by the moderate channel,followed by the government channel. Finally, we consider an extension of the model to allow forswitching via a cable channel, which is not required to air cadenas, and this extension providestwo additional predictions. First, the model predicts that the drop-off in viewership on the privatenetwork, relative to the public network, should be more significant for households with access tocable, when compared to households without cable. Second, cable viewership, due to its role asan outside option, should be higher during the airing of cadenas on broadcast channels, relative towhen cadenas are not aired on broadcast channels.
We then test these predictions using data on television ratings from Venezuela. These data coverthe years 2006 and 2007 and are high-frequency in nature (i.e. day-by-day and show-by-show).Consistent with the first prediction of the model, we find that the drop-off in viewership whentransitioning from news programming to cadenas is more significant for the opposition channelthan for the government channel. Consistent with the second prediction of the model, we find thatthe drop-off in viewership for news programming on the moderate channel takes an intermediatevalue, between that of opposition channels and that of government channels. Next, focusing on theoutside option, we find that, consistent with switching, cable viewership rises during cadenas andthe drop-off in viewership is more significant for those with access to cable.
Complementing this analysis, we also estimate the underlying structural parameters of themodel; these include switching costs and the value of ideological information. Using these param-eter estimates, we document the dynamic viewer responses to cadenas, which lead, for example, to
3

a persistent reduction in viewership among opposition viewers watching opposition channels. Wealso use the parameter estimates to conduct a normative analysis, in which we measure the welfarecosts of cadenas to opposition and pro-government viewers.
The paper proceeds as follows. Section 2 provides a discussion of the relevant literature. Sec-tion 3 provides an overview of the key institutional details. Section 4 develops our key hypothesesin the context of a simple choice model. Section 5 describes the data, and Section 6 provides ourresults. Section 7 provides the structural estimates and counterfactual exercises. Finally, Section 8offers a brief conclusion.
2 Related Literature
This paper contributes to several literatures on media bias. Several studies have documented a pref-erence for like-minded news. These include Gentzkow and Shapiro (2010), Durante and Knight(2012), Martin and Yurukoglu (2015), and Gentzkow et al. (2014). One difference between ourstudy and this literature involves the frequency of responses. While these studies tend to studylong-run relationships between the choice of media outlets and consumer ideology, our paper mea-sures high-frequency, short-run changes in media consumption associated with a preference forlike-minded news. Given inertia, it is possible that short-run responses are much smaller thanlong-run responses.
In addition, there is a literature that examines the influence of media bias on political outcomes.These include DellaVigna and Kaplan (2007), Enikolopov et al. (2011), George and Waldfogel(2003), Chiang and Knight (2011), Gentzkow et al. (2011), Gerber et al. (2009), Martin and Yu-rukoglu (2015), and Snyder and Stromberg (2010). See DellaVigna and Gentzkow (2010) and Pratand Stromberg (2013) for a comprehensive overview of this literature. To the extent that viewersself-select into channels with like-minded ideological content and to the extent that such ideolog-ical content is influential, then government propaganda may lead to increased polarization in theelectorate, with those already inclined to support the government being disproportionately exposedto and influenced by propaganda.
There is also a related literature focused on government propaganda disseminated by massmedia. DiTella et al. (2012) study the effects of government propaganda against privatizationof water services after the 2006 nationalization in Argentina, finding that the effect is large andsignificant for households that had not experienced expansions in the water network during theperiod of privatization. Qian and Yanagizawa-Drott (2013) document an increase in U.S. newscoverage of human rights abuses in countries not aligned with the U.S. when they rotated ontothe U.N. Security Council during the Cold War, with opposite effects, a reduction in coverage, forcountries aligned with the U.S. They report similar patterns for reports produced by the U.S. State
4

Department, suggesting an important role for government propaganda. Other literature focuses onthe power of propaganda to mobilize the masses. Welch (1993) and Adena et al. (2015) documentthe importance of political propaganda to mobilize support for the Nazis, and Yanagizawa-Drott(2014) provides evidence on the role of propaganda broadcast on radio by the Hutu governmentduring the Rwandan genocide. Finally, DellaVigna et al. (2014) document an instance in whichpropaganda had negative consequences: cross-border exposure to Serbian radio among Croats isassociated with anti-Serbian sentiment and anti-Serbian behavior.
3 Institutional Context
This section covers the political career of Hugo Chavez, the role of the opposition during Chavez’stime in office, and the role of television in the political system of Venezuela. This section drawsupon Wilpert (2007), Corrales and Penfold (2011), Nelson (2009), Republica Bolivariana de Venezuela(2012) and Dinneen (2012).
In 1998, the leftist candidate Hugo Chavez won the presidential elections in Venezuela with 56percent of the vote. Chavez promised a "Bolivarian revolution" designed to lessen social exclusion,poverty and government corruption. Chavez was re-elected in 2000, 2006, and 2012, and he servedas President until his death in 2013.
Since the beginning of Chavez’s time in office, the right-wing opposition was committed toremoving him from power. In April 2002, the opposition led a coup, which failed a few days aftersome initial successes. Later that year, during December 2002, the opposition organized a nationalstrike in the oil industry aimed at toppling Chavez. Then, in 2004, the right-wing coalition tried toremove Chavez from power via a Presidential recall referendum, which ultimately failed, with 59percent of voters supporting Chavez.3
During these confrontations, the private media sector tended to side with the opposition. Forexample, private television channels tended to cover only anti-government protests during the coupand pointed to the government as the cause of violence in the struggle between Pro-Chavez andAnti-Chavez protesters. Once Chavez returned to power, private channels stopped broadcastingnews, and a Chavez speech was aired in split-screen to broadcast anti-Chavez protests in parallelwith the speech by Chavez. During the strike, the media gave priority to this issue for more thantwo months, often suspending regular programming for more extensive coverage of the crisis.Even when the protests were significantly weakened, some private media commentators continuedto call for Chavez’s resignation in order to end the crisis.
3Chang-Tai et al. (2011) document that voters who supported the Presidential recall referendum against Chavezexperienced a significant reduction in earnings and employment following the public release of a list of voters whosigned the recall petition.
5
During these events, tensions between the private media and government were at their peak,with Chavez referring to major private television channels (Venevision, RCTV, Globovision andTeleven) as the "four Horsemen of the apocalypse", and, more generally, his language against theprivate media became very aggressive.4 In 2004, before the recall referendum, Chavez met with theowner of Venevision, leading to a warming in relations between the channel and President Chavez.5
Then, Televen followed the initiative to moderate their anti-Chavez tone around the same period.6
However, Globovision and RCTV (Radio Caracas Television), the oldest and largest televisionstation, remained in opposition to the government.
This partitioning of private channels into opposition (RCTV and Globovision) and moderate(Televen and Venevision) is consistent with media monitoring during the 2006 Presidential elec-tions. In particular, EU-EOM (2006) document that RCTV and Globovision devoted a majority oftheir coverage to the opposition party, whereas Televen and Venevision devoted a majority of theircoverage to Chavez’s party. Not surprisingly, the main public channel, VTV, also devoted dispro-portionate coverage to Chavez’s party. Similar patterns were found with respect to the tone of thecoverage, with positive coverage of the opposition and negative coverage of Chavez on RCTV andGlobovision. Coverage of both Chavez and the opposition by Televen and Venevision, by contrast,was largely positive in nature. Finally, coverage of Chavez on the main public channel VTV wasprimarily positive, with decidedly negative coverage of the opposition.
In May 2007, the broadcasting license of RCTV expired and was not renewed by the govern-ment, and RCTV was replaced overnight by TVES, a government-run channel. The government’srationale for closing RCTV had two key components: alleged violations of broadcast laws andtheir coverage of the coup and the strike in the oil sector. Later that year, during July 2007, RCTVre-emerged as a cable channel under the name RCTV International.7
In addition to not renewing the broadcast license of RCTV, Chavez attempted to influence themedia via government channels and cadenas, speeches by government officials that must be airedlive by all non-cable (i.e. broadcast) channels and which are not announced in advance to stationsor viewers.8 Bisbal (2009) estimates that 1,731 cadenas were broadcast between 1999 and June2008, totaling over 1,000 hours. According to Kitzberger (2010) and Reporters Without Borders(2003), cadenas are used by Chavez to mobilize supporters, criticize and threaten adversaries, and
4Chavez accused the private channels publicly of : “inciting rebellion and disrespect for legitimate institutionsand authorities”, “broadcasting false, misleading or biased news reports”, “harming the reputation and good name ofpersons or institutions” and promoting “subversion of public and social order.” See Reporters Without Borders (2003).
5New York Times (2007).6See Besley and Prat (2006) for an analysis of government capture of the media sector.7RCTV International was later shut down, closing in 2010.8In addition to cadenas, Chavez also hosts a public television program titled “Alo Presidente”, where he promoted
the Bolivarian revolution. The show started at 11 am every Sunday and lasted about 5 hours (Kitzberger (2010)).Frajman (2014) argues that Alo Presidente was a “grand stage for Chavez to promote his position as revolutionaryleader and be cheered by crowds of loyal supporters”.
6

more generally, for political campaigning.
4 Theoretical Model
This section develops a simple theoretical model to provide a set of hypotheses for the empiricalanalysis of ratings data. In addition, the model provides a framework for the structural analy-sis to follow. We begin with the simple case of only two types of viewers (opposition and pro-government), two channels (opposition and government), and two types of programming (newsand cadenas). In extensions of the model, we then introduce a third channel, which is moderatein nature, and then separately consider how the results differ with the presence of a cable channelthat is not required to air cadenas.
4.1 Baseline case
Viewers, indexed by v, are of two types: pro-government (g) and opposition (o). Let the fractionof each type in the population be given by πg and πo = 1−πg, respectively.
News stations, indexed by i, are also of two types: government (g) or opposition (o). Eachoutlet offers news programming (p= n), and both outlets are also required to carry cadenas (p= c).
Viewers differ in the degree to which they value news programming. For pro-government types,the value of government news is θs and the value of opposition news is θd , where we assume thatviewers prefer same-ideology news over different-ideology news (i.e., θd < θs). For oppositiontypes, by contrast, the value of government news is θd and the value of opposition news is θs.Cadenas are assumed to have pro-government content and thus provide payoffs of θd to oppositiontypes and θs to pro-government types. Then, letting uvip ∈ {θd,θs} represent these systematicpayoffs, viewer v receives the following overall payoff from watching programming p on station i:
Uvip = uvip + εvip
where εvip is assumed to be distributed type-1 extreme value.We next consider a scenario in which both stations are airing news and viewers have three
options: 1) watching the government station, 2) watching the opposition station, and 3) watchingneither (which yields a systematic payoff of zero). Then, letting σin be the market share on channeli when both channels are airing news programming, we have the following market shares:
σgn = πgexp(θs)
1+ exp(θs)+ exp(θd)+πo
exp(θd)
1+ exp(θs)+ exp(θd)
7

σon = πgexp(θd)
1+ exp(θs)+ exp(θd)+πo
exp(θs)
1+ exp(θs)+ exp(θd)
Now, suppose that the government airs a cadena and that this is not anticipated by viewers (thatis, viewers do not account for the cadena when choosing whether or not to watch news). Forsimplicity, assume that viewers who are not watching news (the third option described above) donot come back to watch the cadena on either of the two channels. Also, assume a switching cost ofη > 0 so that viewers will not change the channel when the cadena comes on the air. That is, witha positive switching cost and identical programming, no viewers will switch between channels.Instead the only margin involves whether or not to watch the cadena. Then, let the fraction ofpro-government viewers who choose to watch the cadena, conditional on watching the news onthat channel, be given by pg = exp(θs)[1+ exp(θs)]
−1 and the analogous fraction for oppositionviewers is given by po = exp(θd)[1+ exp(θd)]
−1, where po < pd since θd < θs.
Then, we have that market shares for cadenas on the two stations are given by:
σgc = πgexp(θs)
1+ exp(θs)+ exp(θd)pg +πo
exp(θd)
1+ exp(θs)+ exp(θd)po
σoc = πgexp(θd)
1+ exp(θs)+ exp(θd)pg +πo
exp(θs)
1+ exp(θs)+ exp(θd)po
Then, define the drop-off in viewership moving from news to cadena, for government andopposition channels, respectively, as ∆o = ln
[σocσon
]and ∆g = ln
[σgcσgn
]. Given the log transformation,
these measures can be interpreted as the percentage reduction in viewership on a given channelwhen moving from news programming to cadenas.
We first compare the drop-off in viewership on opposition and government channels in thefollowing proposition:
Proposition 1: With positive switching costs (η > 0) and a preference for like-minded news
(θd < θs), the drop-off in viewership moving from news to cadena is more significant for the oppo-
sition channel than for the government channel. That is, ∆o < ∆g.
We provide proofs of all Propositions in the Appendix. The intuition for this proposition issimply that opposition viewers, relative to pro-government viewers, are more likely to watch oppo-sition news, relative to government news. Moreover, these opposition viewers also have a distastefor the content of the cadena, relative to pro-government viewers. Given all of this, viewers ofopposition news are more likely to tune out when a cadena comes on the air.
8

4.2 Moderate Channel Extension
We next extend the model to allow for a third channel, which is assumed to air moderate news.For simplicity, assume that both opposition and pro-government voters get a payoff of θm fromwatching news programming on this channel, with θd < θm < θs. Then, again comparing thedrop-off in viewership across the channels, we have the following proposition:
Proposition 2: With positive switching costs (η > 0) and a preference for like-minded news
(θd < θm < θs), we have that drop-off in viewership for the moderate channel lies in between the
opposition and the government channel. That is, ∆o < ∆m < ∆g.
The intuition for this proposition is simply that the moderate channel attracts a less polarizedaudience for its news programming, whereas the opposition channel disproportionately attractsopposition viewers and the government channel disproportionately attracts pro-government view-ers. Thus, the drop-off in viewership for the moderate channel takes an intermediate value, whencompared to the government and opposition channels.
4.3 Cable Extension
To investigate the possibility of switching to other outlets in a pluralistic media environment, wenext allow for a cable channel, which is assumed to be linked to the opposition and is not required toair cadenas. In the context of this extension, we investigate two questions. First, due to the presenceof this new opposition channel, is the drop-off in viewership, when moving from opposition newsto cadena, more significant for those viewers with cable than for those viewers without cable?Second, consistent with switching, does cable viewership increase during cadenas?
Given the empirical application to the cable channel RCTV International, we assume herethat cable also has opposition news, yielding a payoff of θd to pro-government viewers and θs toopposition types. Now, suppose that the government unexpectedly decides to air a cadena. Asabove, assume that viewers who are not watching do not come back to watch the cadena. Also,as above, assume a switching cost of η > 0 so that viewers will not change the channel when thecadena airs. Finally, for simplicity, we assume that viewers do not switch from cable to either theopposition or the government channel when the cadena comes on the air. They can switch from oneof the broadcast stations to cable but must incur the switching cost. Then, we have the followingresult with respect to the drop-off measures considered above:
Proposition 3: With positive switching costs (η > 0) and a preference for like-minded news
(θd < θs), the drop-off in viewership on the opposition channel, relative to the government channel,
for viewers with cable is larger than for viewers without cable. That is, ∆o−∆g falls when cable
is introduced.
The intuition for Proposition 3 is that, in addition to turning off the television, opposition view-
9

ers with access to cable now have another attractive outside option, switching to watch oppositionnews on cable during the cadena. Given this, even fewer viewers of opposition news will watchthe cadena.
Finally, we consider how viewership of cable changes when a cadena comes on broadcasttelevision, and we have the following result.
Proposition 4: With positive switching costs (η > 0), a preference for like-minded news (θd <
θs), and a cable option, viewership of cable rises during the cadena.The logic behind Proposition 4 is straightforward. Since opposition viewers value cable as an
outside option, viewership of cable programs rises during cadenas.To summarize, the theoretical model makes four predictions. First, the drop-off in viewership
when moving from news to cadenas should be more significant on private channels, when com-pared to the government channel. Second, the drop-off in viewership on moderate channels shouldtake an intermediate value, between the opposition channel and the government channel. Third,the drop-off in viewership for the opposition channel, relative to the government channel, shouldbe more significant for those with access to cable. Fourth, cable viewership should rise duringcadenas.
5 Data
Our data on television ratings were purchased from AGB Nielsen Media Research Venezuela andinclude broadcast ratings of each television show aired on each channel, from January 1, 2006to December 31, 2007, separately for the four largest metropolitan areas (Caracas, Barquisimeto,Maracaibo and Valencia). Our analysis considers the most significant channels, those discussedin Section 2. In particular, and as shown in Table 1, we focus on four private broadcast channels,one of which is news only (Globovision) and three of which mix news and entertainment (Televen,RCTV, and Venevision), one public channel, Venezolana de Television (VTV), and one cable chan-nel, RCTV International.9 In addition to analyzing aggregate ratings for each show, channel, andmetropolitan area, we also test Proposition 3 by employing measures of ratings separately forthose with and without cable subscriptions. Likewise, our structural analysis uses gender-specificratings. In constructing our measure of ratings for each show we use the Average Minute Rating(AMR) measure, and, given their very low ratings, ignore shows aired between midnight and 6am.Finally, we also group show types into three categories: news, entertainment and cadenas.10
9This information is consistent with EU-EOM (2006), which shows that VTV and Globovision devoted greatertime to political information during 2006 elections and the private channels RCTV, Venevision, and Televen devotedfar less time to political information.
10In particular, news programs includes the categories “Information/Opinion” and “Documentaries”. Entertainmentincludes “Sports”, “Entertainment”, “Children”, “Games”, “Micro-series”, “Miniseries” “ Movies” “Series” and “Soap
10

As described in Section 2, television in Venezuela during the sample period is considered to behighly polarized. This political polarization allows us to create three categories for the channelsbased upon their ideology, as discussed above. While the main public channel (VTV) is assumedto be pro-government, private channels are split into opposition (RCTV and Globovision) andmoderate (Venevision and Televen). During the part of the analysis focused on ratings of broadcastchannels, we focus on data from the period prior to the closing of RCTV in May 2007 in orderto have a consistent set of channels. During 2006 and 2007, a total of 229 cadenas were aired onbroadcast television.
Table 1: Channels Analyzed
Name Programming Ideology Coverage Period
RCTV News & Entertainment Opposition NationalUntil
May 27, 2007
VENEVISION News & Entertainment Moderate National Whole period
TELEVEN News & Entertainment Moderate National Whole period
GLOBOVISION News Only OppositionCaracas &
Whole periodValencia
VTV News & Entertainment Government National Whole period
RCTV International News & Entertainment Opposition CableStarting
July 16, 2007
Key to our identification strategy is the assumption that viewers are not aware of cadenas inadvance. The law does not require the government to pre-announce cadenas, and our understandingis that cadenas are not pre-announced in practice. Nonetheless, it is still possible that viewers canpredict the airing of cadenas to the extent that they follow regular patterns. We investigate thisissue by analyzing the distribution of cadenas across days, their starting time, and their duration. Asshown in Figure 1, while cadenas are most commonly aired on Wednesdays, followed by Tuesdays,Thursdays, and Fridays, cadenas may appear on any day of the week, and there is not a noticeablespike on any particular day. Likewise, as shown in Figure 2, while cadenas are most commonlyaired during prime time (i.e. between 7pm and 10pm), cadenas can occur at nearly any hour. Inaddition, as shown in Figure 3, while many cadenas start at the top of the hour, they can also beginat any minute within the hour. Finally, the duration of cadenas is difficult to predict. As shownin Figure 4, cadenas can be either very short in duration, less than 30 minutes, or very long induration, in excess of four or even five hours. To summarize, there is not a specific pattern in termsof the timing of cadenas, and there is thus an important element of surprise for the viewer, who can
Operas”; Finally, we leave the category “cadenas” as is.
11

be exposed to these interruptions by the government at any time, without anticipating the day, thehour, the minute, or the length of the interruption.
Figure 1: Day of the week of cadenas
24
36
49
38 38
19
25
020
4060
(sum
) ca
dena
s
Mon
day
Tue
sday
Wed
nesd
ay
Thu
rsda
y
Frid
ay
Sat
urda
y
Sun
day
Days
12

Figure 2: Starting hour of cadenas
21 1
2
5
3
7
1213 13
43
78
11
27
44
39
23
4
010
2030
40ca
dena
s
0 1 2 3 4 5 6 7 8 9 10 11 12 13 14 15 16 17 18 19 20 21 22 23
hour number
Figure 3: Starting Minute of cadenas
32
12
4
5
4
3 3
1
2
4
1
4
1
5
1
3 3
4
5
2 2
1
2
4
3
2
3
5
9
3
4
2
4
3
2
1
3 3
4
11
9
5 5
3
4
5 5
2
1
3 3
2 2
1
9
010
2030
cade
nas
0 20 40 60minutes
13
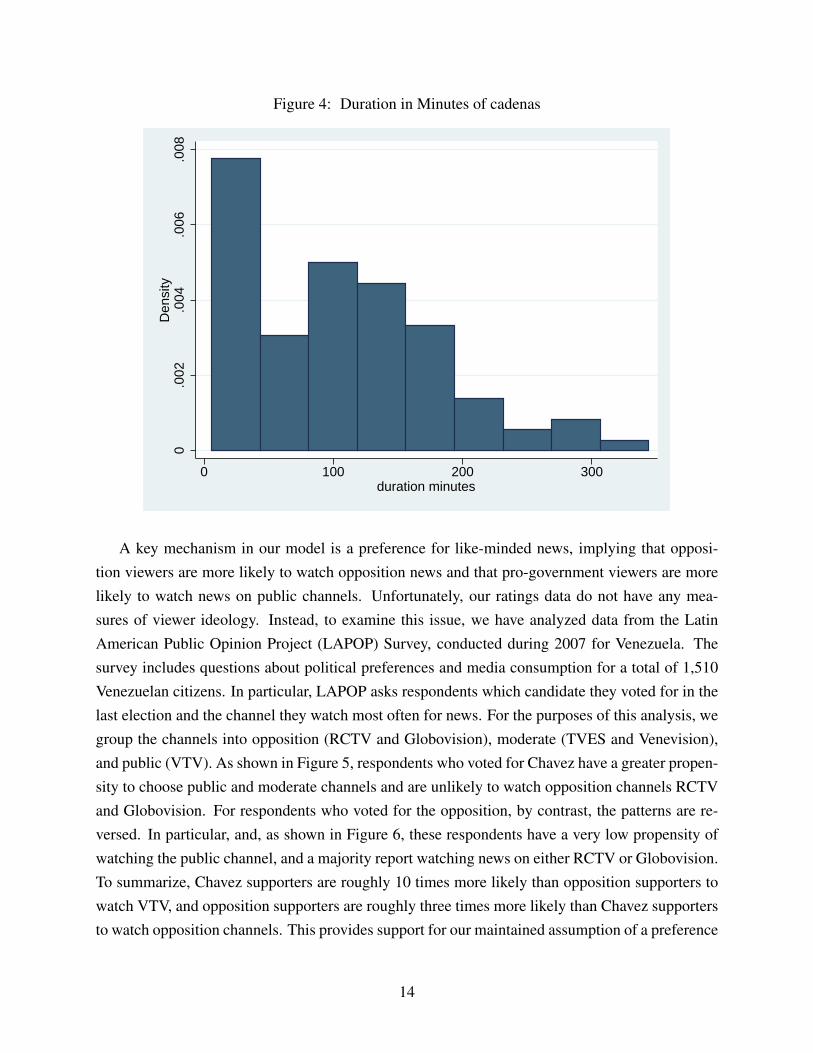
Figure 4: Duration in Minutes of cadenas
0.0
02.0
04.0
06.0
08D
ensi
ty
0 100 200 300duration minutes
A key mechanism in our model is a preference for like-minded news, implying that opposi-tion viewers are more likely to watch opposition news and that pro-government viewers are morelikely to watch news on public channels. Unfortunately, our ratings data do not have any mea-sures of viewer ideology. Instead, to examine this issue, we have analyzed data from the LatinAmerican Public Opinion Project (LAPOP) Survey, conducted during 2007 for Venezuela. Thesurvey includes questions about political preferences and media consumption for a total of 1,510Venezuelan citizens. In particular, LAPOP asks respondents which candidate they voted for in thelast election and the channel they watch most often for news. For the purposes of this analysis, wegroup the channels into opposition (RCTV and Globovision), moderate (TVES and Venevision),and public (VTV). As shown in Figure 5, respondents who voted for Chavez have a greater propen-sity to choose public and moderate channels and are unlikely to watch opposition channels RCTVand Globovision. For respondents who voted for the opposition, by contrast, the patterns are re-versed. In particular, and, as shown in Figure 6, these respondents have a very low propensity ofwatching the public channel, and a majority report watching news on either RCTV or Globovision.To summarize, Chavez supporters are roughly 10 times more likely than opposition supporters towatch VTV, and opposition supporters are roughly three times more likely than Chavez supportersto watch opposition channels. This provides support for our maintained assumption of a preference
14

for like-minded news.11
Figure 5: Favorite News Channels for Chavez Supporters
15.6
61.1
23.3
020
4060
for
peop
le w
ho v
ote
for
Cha
vez
Opposition Balanced Public
11Likewise, using other measures of political preferences, not reported here, we find that people who watch newson public channels report higher levels of trust in Chavez than people who watch private channels.
15

Figure 6: Favorite News Channels for the Opposition
50.5
47.3
2.2
010
2030
4050
for
peop
le w
ho v
ote
for
Ros
ales
Opposition Balanced Public
6 Analysis of Ratings data
In this section, we test the key hypotheses of the theoretical model in an investigation of viewerresponses to political propaganda via cadenas in Venezuela during 2006 and 2007, a key periodduring Chavez’s time in office.
6.1 Drop-off: News to Cadena
Our econometric analysis begins with an investigation of how ratings change when a cadena in-terrupts news programming depending upon the political orientation of the station, under the as-sumption that viewers prefer to watch like-minded news. Given, as shown above, that oppositionviewers have a higher probability of watching opposition news channels and under the assumptionthat opposition viewers dislike cadenas, we expect viewers of opposition news to be more likely totune out when cadenas are aired on television, relative to viewers of pro-government news.
As argued above, we hypothesize that viewers watching the opposition news program willrespond more strongly to cadenas when compared to viewers watching news programming ongovernment channels. To test this hypothesis, we estimate the following econometric model of
16
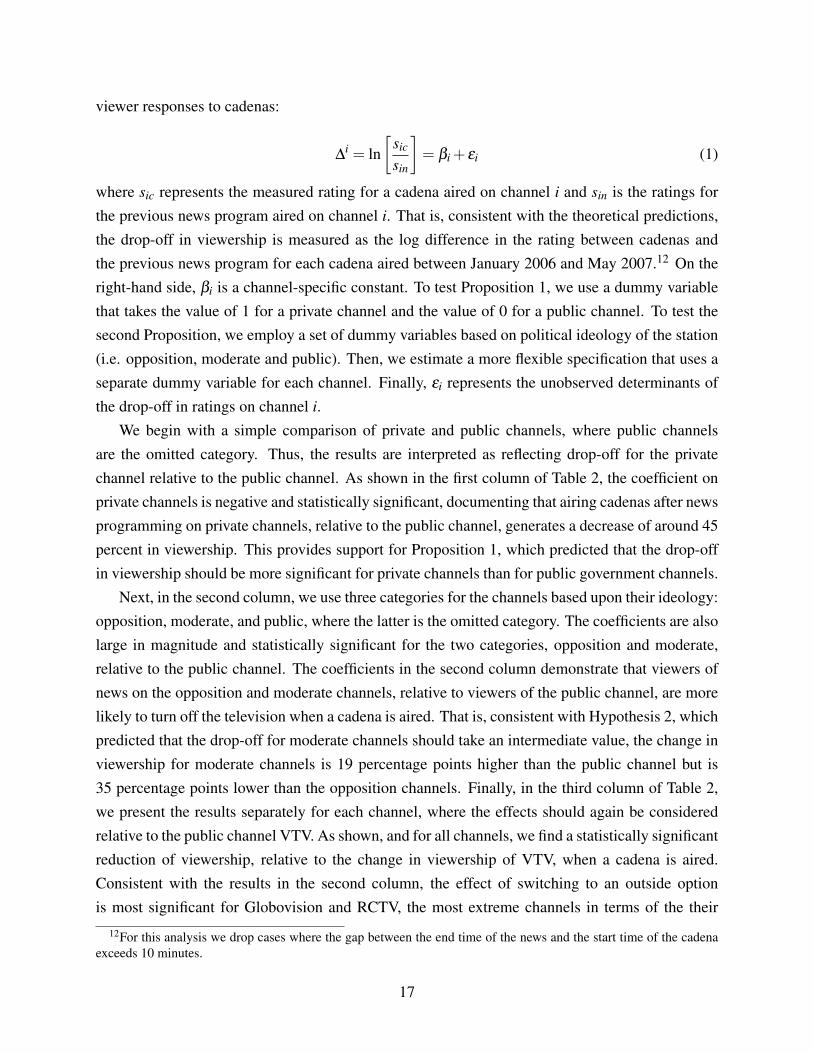
viewer responses to cadenas:
∆i = ln
[sic
sin
]= βi + εi (1)
where sic represents the measured rating for a cadena aired on channel i and sin is the ratings forthe previous news program aired on channel i. That is, consistent with the theoretical predictions,the drop-off in viewership is measured as the log difference in the rating between cadenas andthe previous news program for each cadena aired between January 2006 and May 2007.12 On theright-hand side, βi is a channel-specific constant. To test Proposition 1, we use a dummy variablethat takes the value of 1 for a private channel and the value of 0 for a public channel. To test thesecond Proposition, we employ a set of dummy variables based on political ideology of the station(i.e. opposition, moderate and public). Then, we estimate a more flexible specification that uses aseparate dummy variable for each channel. Finally, εi represents the unobserved determinants ofthe drop-off in ratings on channel i.
We begin with a simple comparison of private and public channels, where public channelsare the omitted category. Thus, the results are interpreted as reflecting drop-off for the privatechannel relative to the public channel. As shown in the first column of Table 2, the coefficient onprivate channels is negative and statistically significant, documenting that airing cadenas after newsprogramming on private channels, relative to the public channel, generates a decrease of around 45percent in viewership. This provides support for Proposition 1, which predicted that the drop-offin viewership should be more significant for private channels than for public government channels.
Next, in the second column, we use three categories for the channels based upon their ideology:opposition, moderate, and public, where the latter is the omitted category. The coefficients are alsolarge in magnitude and statistically significant for the two categories, opposition and moderate,relative to the public channel. The coefficients in the second column demonstrate that viewers ofnews on the opposition and moderate channels, relative to viewers of the public channel, are morelikely to turn off the television when a cadena is aired. That is, consistent with Hypothesis 2, whichpredicted that the drop-off for moderate channels should take an intermediate value, the change inviewership for moderate channels is 19 percentage points higher than the public channel but is35 percentage points lower than the opposition channels. Finally, in the third column of Table 2,we present the results separately for each channel, where the effects should again be consideredrelative to the public channel VTV. As shown, and for all channels, we find a statistically significantreduction of viewership, relative to the change in viewership of VTV, when a cadena is aired.Consistent with the results in the second column, the effect of switching to an outside optionis most significant for Globovision and RCTV, the most extreme channels in terms of the their
12For this analysis we drop cases where the gap between the end time of the news and the start time of the cadenaexceeds 10 minutes.
17
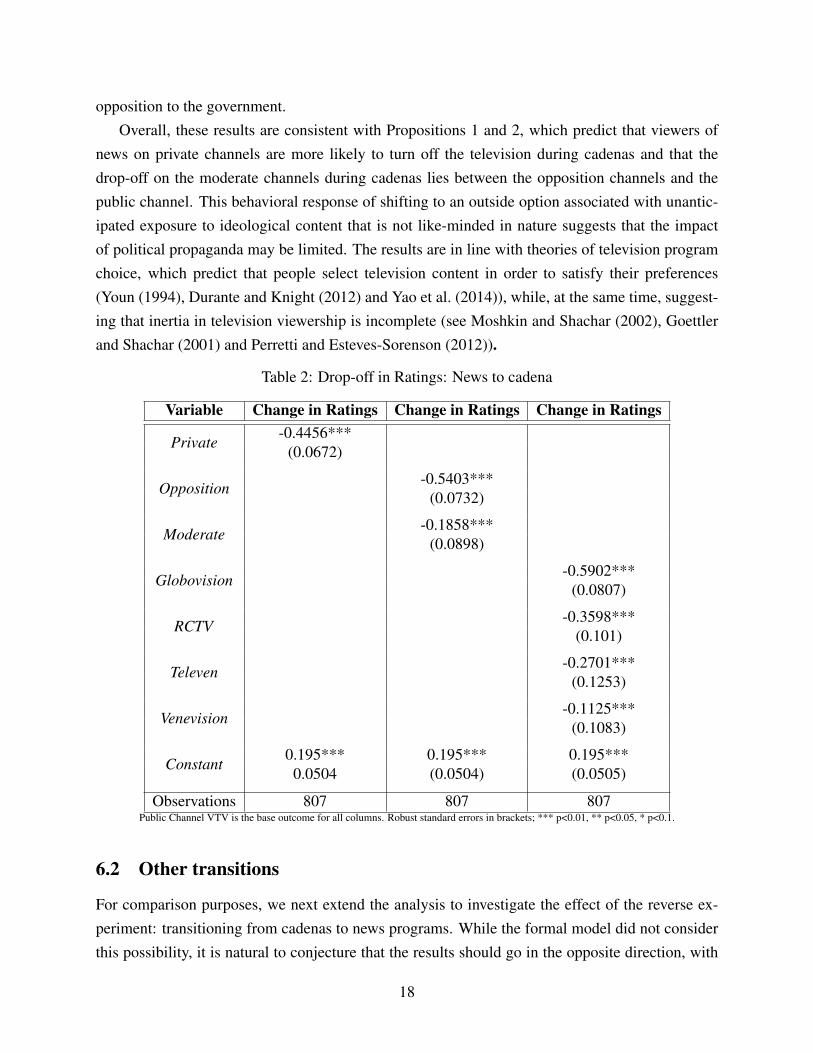
opposition to the government.Overall, these results are consistent with Propositions 1 and 2, which predict that viewers of
news on private channels are more likely to turn off the television during cadenas and that thedrop-off on the moderate channels during cadenas lies between the opposition channels and thepublic channel. This behavioral response of shifting to an outside option associated with unantic-ipated exposure to ideological content that is not like-minded in nature suggests that the impactof political propaganda may be limited. The results are in line with theories of television programchoice, which predict that people select television content in order to satisfy their preferences(Youn (1994), Durante and Knight (2012) and Yao et al. (2014)), while, at the same time, suggest-ing that inertia in television viewership is incomplete (see Moshkin and Shachar (2002), Goettlerand Shachar (2001) and Perretti and Esteves-Sorenson (2012)).
Table 2: Drop-off in Ratings: News to cadena
Variable Change in Ratings Change in Ratings Change in Ratings
Private-0.4456***
(0.0672)
Opposition-0.5403***
(0.0732)
Moderate-0.1858***
(0.0898)
Globovision-0.5902***
(0.0807)
RCTV-0.3598***
(0.101)
Televen-0.2701***
(0.1253)
Venevision-0.1125***
(0.1083)
Constant0.195*** 0.195*** 0.195***0.0504 (0.0504) (0.0505)
Observations 807 807 807Public Channel VTV is the base outcome for all columns. Robust standard errors in brackets; *** p<0.01, ** p<0.05, * p<0.1.
6.2 Other transitions
For comparison purposes, we next extend the analysis to investigate the effect of the reverse ex-periment: transitioning from cadenas to news programs. While the formal model did not considerthis possibility, it is natural to conjecture that the results should go in the opposite direction, with
18

viewership of news rising on private, relative to public, following a cadena. As shown in Table 3,the coefficient in the first column is positive and statistically significant, documenting that privatechannels do experience an increase in viewership of 23 percent, relative to the public channel,when cadenas are followed by a news program. As shown in columns 2 and 3, the effect is drivenby opposition channels, especially Globovision, which is the only channel that has a statisticallysignificant coefficient, re-enforcing the idea that viewers of the opposition channel search for ideo-logical content similar to their own ideology. Overall, these results are consistent with notion thatviewers have preferences for watching like-minded political content.
Table 3: cadena to News
Variable Change in Ratings Change in Ratings Change in Ratings
Private0.2283***(0.0695)
Opposition0.3029***(0.0721)
Moderate-0.0889(0.1531)
Globovision0.3606***(0.0751)
RCTV-0.0691(0.1678)
Televen-0.0008(0.2989)
Venevision-0.1431(0.1588)
Constant-0.1495*** -0.1495*** -0.1495***
(0.0404) (0.0405) (0.0405)
Observations 1014 1014 1014Public Channel VTV is the base outcome for all columns. Robust standard errors in brackets; *** p<0.01, ** p<0.05, * p<0.1.
For comparison purposes, we also analyze the change in viewership when moving from newsto an entertainment program.13 As shown in Table 4, we find that private channels, relative tothe public channel, generate a statistically significant 45 percent increase in ratings when moving
13News audiences are typically smaller than those of entertainment (Webster (1984) and Webster and Newton(1988)), and Prior (2005) documents that many people abandon news for entertainment because they prefer enter-tainment programming.
19

from a news program to an entertainment program. This is similar in magnitude to the result for thedrop-off when moving from news to cadenas, suggesting that our results may be about viewershipof news on different channels per se rather than political ideology. On the other hand, it is not clearthat entertainment programming on public channels is comparable to entertainment programmingon private channels, which is very popular in Venezuela. Moreover, as shown in column 2 and3, the effects are similar for opposition and moderate channels. The similarity of these resultsfor entertainment across these private channels of differing ideology suggests that our baselineresults are driven, at least in part, by channel ideology, rather than other characteristics of newsprogramming on different channels.
Table 4: News to Entertainment
Variable Change in Ratings Change in Ratings Change in Ratings
Private0.4519***(0.0228)
Opposition0.4148***(0.0244)
Moderate0.4713***(0.0237)
Globovision0.1208***(0.0345)
RCTV0.5238***(0.0246)
Televen0.4055***(0.0289)
Venevision0.5207***(0.0238)
Constant-0.2390*** -0.2390*** -0.2390***
(0.0214) (0.0214) (0.0214)
Observations 17721 17721 17721Public Channel VTV is the base outcome for all columns. Robust standard errors in brackets; *** p<0.01, ** p<0.05, * p<0.1.
Finally, in Table 5, we examine the drop-off in rating when entertainment programs are inter-rupted by a cadena. We again find similar results to those in the analysis of a change in content fromnews to cadenas. Nevertheless, as shown in column 2, the results are again similar for oppositionand moderate channels, and, as shown in column 3, the results are economically significant for all
20

four private channels. Taken together, the results for Table 4 and Table 5 suggest that our baselineresults relating to channel ideology are not driven by other channel-specific characteristics.
Table 5: Entertainment to cadena
Variable Change in Ratings Change in Ratings Change in Ratings
Private-0.4371***
(0.1604)
Opposition-0.4160***
(0.1615)
Moderate-0.4479***
(0.1609)
Globovision-0.5953(0.5371)
RCTV-0.4131**(0.1614)
Televen-0.4760***
(0.1632)
Venevision-0.4200***
(0.1612)
Constant0.3853** 0.3853** 0.3853**(0.1596) (0.1597) (0.1598)
Observations 1505 1505 1505Public Channel VTV is the base outcome for all columns. Robust standard errors in brackets; *** p<0.01, ** p<0.05, * p<0.1.
6.3 Cable Television
We next consider Propositions 3 and 4 in the context of cable channels, which were not requiredto broadcast cadenas. Given this, Proposition 3 predicts that the disproportionate drop-off inviewership on the private channel, relative to the public channel, should be more significant forhouseholds with cable subscriptions, relative to households without cable subscriptions. Likewise,Proposition 4 predicts that viewership of cable should rise during cadenas, and we test this predic-tion using data from RCTV International, which began as a cable channel during July 2007.
In terms of Proposition 3, we begin by estimating the following regression:
∆i(cable)−∆
i(nocable) = βi + εi (2)
21

where the drop-off in viewership is now measured separately for cable and non-cable households,and, according to Hypothesis 3, the coefficient for private channels, relative to public channels,should be negative.
Table 6: drop-off for Cable versus no Cable
Variable Difference between Difference between Difference betweencable and no cable cable and no cable cable and no cable
Private-0.2001*(0.1099)
Opposition-0.1385(0.1191)
Moderate-0.3811**(0.1708)
Globovision-0.1974(0.1345)
RCTV0.0409
(0.1660)
Televen-0.4493*(0.2357)
Venevision-0.3280(0.2221)
Constant-0.1218 -0.1218 -0.1218(0.0775) (0.0776) (0.0777)
Observations 632 632 632Public Channel VTV is the base outcome for all columns. Robust standard errors in brackets; *** p<0.01, ** p<0.05, * p<0.1.
As shown in Table 6, and consistent with Proposition 3, the drop-off in ratings for those withcable, relative to households without cable, is indeed more significant for private channels, relativeto public channels. In columns 2 and 3, we break out this effect by type of channel, finding that theeffect is somewhat larger and only statistically significant for moderate channels and is driven inlarge part by Televen. Taken together, these results demonstrate that the opposition may be exposedto political propaganda to an even lesser degree when a source of opposition programming remainsavailable during cadenas. This implies that viewers who are not able to afford cable, especiallythose already inclined to support the government, are disproportionately exposed to propaganda.Moreover, to the extent that cable subscribers are of higher income, this finding suggests thatpolitical polarization may also increase according to income.
22
Using ratings data from RCTV International, a cable channel created following the closing ofRCTV on broadcast television, we next test Proposition 4, which predicts that RCTV cable ratingsshould rise during cadenas as viewers use this channel as a source of opposition programming. Inparticular, we estimate the following regression specification:
∆RCTV = β1ChangeincadenaOverlap+ ε (3)
where the left-hand side variable (∆RCTV ) is the percentage change in ratings for a program airingon RCTV International, when compared to the previous program aired on RCTV International.To compute the key right-hand-side variable, we first compute cadena overlap for each RCTVcable show. Cadena overlap is defined as the fraction of minutes for which the RCTV cable showoverlapped with a cadena. Thus, cadena overlap varies between zero and one, where the formervalue is attained if there is no cadena aired at any point of the show, and the latter value is attainedif the show overlaps entirely with a cadena. Taking first differences of cadena overlap, we thencompute the change in cadena overlap, which ranges in value from negative one to plus one. Forthis analysis, we use the sample from July 2007 to December 2007, the period in which RCTV isaired on cable.
As shown in Table 7, and consistent with Proposition 4, we do find that RCTV cable ratingsrise during cadenas, and the effect is positive and statistically significant. In particular, consideringmoving from no overlap to complete overlap (i.e. change in cadena overlap equal to one), wehave that ratings on RCTV cable rise by an economically significant 69 percent. In the secondcolumn, we investigate whether these results differ according to the type of programming on RCTVcable. As shown, the results are larger for news programming on RCTV cable, when compared toother types of programming on RCTV cable. More concretely, viewership of RCTV cable newsprogramming increases by 171 percent when a cadena comes on broadcast television, whereasviewership of non-news programming increases by only 61 percent. These results provide furthersupport for our hypothesis of viewer choice of like-minded ideological content.
23

Table 7: Cable Channel RCTV International
Variable Change in Ratings Change in Ratings
Change in cadena overlap0.6882*** 0.6087***(0.0945) (0.0986)
News-0.0126(0.0211)
News * Change in cadena overlap1.1047***(0.3188)
Constant0.0206** 0.0259*(0.0105) (0.0137)
Observations 9404 9404All columns show the results for the cable channel RCTV International when a cadena is aired on the broadcast channels.
Robust standard errors in brackets; *** p<0.01, ** p<0.05, * p<0.1.
6.4 Content of cadenas
We next use more detailed information about individual cadenas, as provided by Nielsen in theform of short descriptions of the content of each cadena. Using this description and supplementingthis with information found online, we create five categories of cadena content, and these aredescribed below:
1. Foreign Relations: coverage of foreign policy accomplishments, such as visits of presidents,multilateral agreements, and international travel by Chavez.
2. Delivery: coverage of events involving government promises of the provision of publicgoods, services, etc.
3. Elections: broadcasts focusing on elections, especially coverage of the 2006 Presidentialelections and the 2007 constitutional referendum.
4. Celebrations: coverage of public events, such as the birth of Simon Bolivar, marches, etc.
5. Information: summary of the progress of the country in several areas, such as economic andpolitical
For cadenas that do not meet one of these definitions, we create a sixth category, other.Table 8 examines the drop-off in rating, separately, for each of these categories on the private
channels, compared to the same categories in the public channels, when transitioning from news
24

to cadena. This specification is consistent with the baseline analysis in column 1 of Table 2. Theregression also controls for main effects of these categories, not reported in the Table. Comparingthe magnitude of the coefficients on the interactions, we have that the largest drop-off on private,relative to public, occurs for the categories delivery and elections. The large drop-off for deliv-ery cadenas aired on private television may reflect the fact that many of these broadcasts involveChavez himself delivering promises of public goods and services to his core voters. Given thetargeting of these goods and services, there may be a particular distaste among opposition viewersfor these cadenas. Likewise, cadenas about elections are, by their very nature, politically orientedand may have created polarized responses in terms of viewership. Finally, the smaller coefficienton the information category may reflect the fact that both opposition and pro-government view-ers find these transmissions to be truly informative about the state of the economy or along otherdimensions.
Table 8: Cadenas Content
Variables Change in Ratings
Foreign*Private-0.465***
(0.139)
Delivery*Private-1.056***
(0.261)
Elections*Private-0.758***
(0.265)
Celebrations*Private-0.544***
(0.163)
Information*Private-0.264**
(0.111)
Others*Private-0.482
(0.473)
Observations 807Robust standard errors in parentheses; *** p<0.01, ** p<0.05, * p<0.1
6.5 Summary
To summarize, the results of the empirical analysis are consistent with the four key predictions ofthe model. First, the drop-off in ratings is more substantial for private channels, when comparedto the public channel. Second, this effect is concentrated among opposition channels, and resultsfor the moderate channels take an intermediate value. Third, the drop-off in viewership for the
25

private channel is more significant for households with a cable subscription. Fourth, we show thatviewership of RCTV International, an opposition cable channel opened during 2007, rises signif-icantly during cadenas. Finally, we examine heterogeneity according to the content of cadenas,with the largest drop-off of viewership on private channels for cadenas associated with the deliveryof public goods and services and for cadenas related to elections.
7 Structural Estimation
Building upon this evidence, we next provide estimates of a structural version of the model. Webegin by extending the model and the notation to allow for non-news programming and gender-specific preferences over this programming. We then detail several issues in the empirical imple-mentation and describe identification. After presenting the parameter estimates, we use the modelto conduct no-cadena counterfactual experiments. These experiments will allow us to quantifythe dynamic responses of viewership to cadenas and also to quantify the welfare consequences ofcadenas.
7.1 Approach
As in the first extension of the model, we consider three types of stations: government (i = g),moderate (i=m), and opposition (i= o). As before let v∈ {o,g} index viewer ideology, oppositionand pro-government. Then, viewers receive payoffs equal to θs from same-type programming(cadenas and government news for pro-government viewers and opposition news for oppositionviewers) and payoffs equal to θd from different-type programming (cadenas and government newsfor opposition viewers and opposition news for pro-government viewers). Both opposition andpro-government viewers receive payoffs of θm from moderate news.
To estimate switching costs, we also consider the following additional types of non-news pro-gramming: soap operas (telenovas), sports, and other. Following Esteves-Sorenson and Perretti(2012), we measure switching costs via gender-specific preferences over soaps and sports. Inparticular, let k ∈ {m, f} index viewer gender, and let uvkip represent gender-specific systematicpayoffs for a viewer with ideology v watching programming p on station i.
Table 9 summarizes these payoffs:
26

Table 9: Summary of payoff structure
v = o,k = male v = o,k = f emale v = g,k = male v = g,k = f emalep = n, i = g θd θd θs θsp = n, i = m θm θm θm θmp = n, i = o θs θs θd θd
p = c θd θd θs θsp = sports sportsm sports f sportsm sports fp = soaps soapsm soaps f soapsm soaps fp = other otherm other f otherm other f
As shown, payoffs from news programming and cadenas differ across viewer ideology but notgender, and payoffs from non-news programming, such as sports and soaps, differ across gen-der but not ideology. Likewise, while preferences for news programming vary across stations, asimplifying assumption is that preferences for sports, soaps, and other programming vary acrossviewer types but not across stations.
In the context of this model, we next derive market shares, separately for viewers of ideologyv and gender k. We sequence shows within a day according to the time aired (t= 1,2,3, ...). Then,with positive switching costs (η > 0), market shares for a viewer with ideology v and gender k
watching programming p on station i at time t (σ tvkip), as a function of market shares during the
previous time slot (σ t−1vkip), are given by:
σtvkip = σ
t−1vkip
exp(utvkip)
exp(utvkip)+∑ j 6=i(ut
vk jp−η)+∑
l 6=iσ
t−1vkl p
exp(utvkip−η)
exp(utvkl p)+∑ j 6=l exp(ut
vk jp−η)
The first term represents the likelihood that a viewer is both watching channel i during the previoustime slot (t−1) and does not switch to another channel at time t. The second term represents thelikelihood that a viewer is both watching a different channel (l 6= i) during the previous time slotand switches to channel i at time t, incurring switching costs equal to η . This is then summedacross all other options. This includes the outside option of not watching television, which, asabove, is normalized to provide a systematic payoff of zero.
To illustrate the intuition behind these market shares, consider two special cases. First, withhigh switching costs (η → ∞), market shares do not change between time t−1 and time t; that is,σ t
vkip = σt−1vkip. In this case, inertia is complete, and viewership does not respond to the airing of
cadenas. Second, in the absence of switching costs (η = 0), market shares at time t are independent
27

of market shares at time t−1 and collapse to the standard multinomial logit form:
σtvkip =
exp(utvkip)
exp(utvkip)+∑ j 6=i(ut
vk jp)
In this case, there is no inertia. While viewership does respond to the airing of cadenas, the impactlasts for only one period, with viewership during future periods unchanged. In intermediate cases,with moderate switching costs, inertia exists but is incomplete. In particular, a positive shock toviewership of channel i at time t − 1 leads to higher viewership of that channel at time t. Forexample, if females have a stronger preference for soaps than males, then a soap airing at timet−1 will, all else equal, tend to increase viewership of that channel for females, relative to males,at time t. This is due to the presence of switching costs, resulting in inertia in viewership.
Since our data distinguish between male and female viewers but not between pro-governmentand opposition viewers, we next aggregate market shares across opposition and pro-government.Recalling that πg represents the fraction of pro-government viewers, we have that market sharesamong gender k for station i airing programming p equal:
σtkip = πgσ
tgkip +(1−πg)σ
tokip
For the purposes of estimation, these model-based market shares (σ tkip) are then linked to observed
market (stkip) shares via the following log-odds formulation:
ln(st
kip
1− stkip
) = ln(σ t
kip
1−σ tkip
)+ εtkip
where ε tkip is assumed to be normally distributed. Then, the parameters of the model (e.g. θd,θm,θs,η)
can be estimated via maximum likelihood.
7.2 Empirical Implementation and Identification
Before presenting estimates of the parameters of this model, we first address three issues regardingempirical implementation. We then provide an intuitive overview of identification.
First, while the above formulation assumed that the sequence of programming (t = 1,2,3...)was identical across channels, programming schedules differ across channels within a day. Forexample, RCTV may air a program from 6pm to 6:30pm, whereas Globovision may air a programfrom 5:30pm to 6:20pm and then another show from 6:20pm to 7pm. In this case, for a givenprogram, it is unclear how to define the set of competing shows, those aired on other channels.To do so, we define, for each show, the set of competing shows on other channels as those with
28
the maximal time overlap with the focal program. In the above example, a show airing from 6pmto 6:30pm on RCTV would compete for viewership with the show airing from 5:30pm to 6:20pmon Globovision, which shares 20 minutes of programming, and not a show airing from 6:20pm to7pm, which shares only 10 minutes of programming.
Second, given the recursive formulation above, in which viewership at time t depends uponviewership at time t−1, one must define initial conditions for market shares. To do so, we assumezero viewership before 6am, when most of the population is sleeping, and ratings are consequentlyextremely low. That is, we assume that the entire market is consuming the outside option of notelevision, which provides a systematic payoff of zero, prior to t = 1. This allows us to writeviewership during the first time slot (t = 1) as follows:
σ1vkip =
exp(u1vkip−η)
1+∑ j 6=0 exp(u1vk jp−η)
where u1vkip−η is the payoff from switching from the outside option to channel i airing program-
ming p at t = 1 and j = 0 refers to the outside option. In addition to closing the model, thisassumption implies no dynamic linkages in viewership between midnight and 6am, allowing us totreat each date as an independent observation.
Third, since we do not observe market shares separately for opposition and government view-ers, we must aggregate across these groups, as outlined above. Given this, one must thus measurethe fraction of pro-government viewers (πg) in each municipality. To do so, we measure these viamunicipality-specific vote shares for the opposition party and Chavez, respectively, in the 2006Presidential election.
The intuition for identification is explained in several steps. First, gender-specific preferencesover sports and soap operas are identified simply by comparing ratings for these types of program-ming across male and female viewers. Then, with these estimates of gender-specific programming,switching costs can be identified by examining gender-specific ratings for shows aired on the samechannel but after these sports and soaps programs. Finally, with estimates of these switching costs,one can identify ideology-specific preferences over news and cadenas by examining, similarly tothe reduced form evidence presented above, changes in ratings during cadenas that interrupt newsprogramming across different types of stations (opposition, moderate, and pro-government). Thisidentifies preferences over ideological content, as given by θd , θm, and θs.
Note that this intuition is incomplete, as the model also implies linkages between switchingcosts and preferences over ideological content via the ideological mechanism. That is, in orderto observe a disproportionate drop-off in viewership when a cadena is aired on private channels,it must be the case that switching costs are positive. Otherwise, as noted above, viewership ofcadenas is independent of previous programming, which includes the ideological content of news.
29

Thus, switching costs are identified via both gender-specific preferences over programming andchannel-specific changes in viewership when cadenas are aired.
7.3 Parameter Estimates
Our parameter estimates are provided in Table 10. Note that these coefficients should be consideredrelative to programming other than news, cadenas, sports, and soaps. This includes categories suchas movies and game shows, which receive payoffs equal to the constant term, and the payoff fromnot watching television is normalized to zero.
Following the identification logic from above, we begin by discussing gender-specific prefer-ences over news programming. As seen, and consistent with prior evidence (Esteves-Sorensonand Perretti (2012)), we find overall high viewership for soaps but especially so among femaleviewers. Likewise, we find slightly lower viewership for sports but especially so among femaleviewers. These two gender-specific coefficients are both economically and statistically significant,with females, relative to males, having 56 percent higher viewership for soaps and 18 percent lowerviewership for sports. In addition, females have 18 percent higher viewership across all categories.
30

Table 10: Structural estimates
Variable
Information-0.4812***
(0.0072)
Information×same0.2409***(0.0078)
Information×different-1.6717***
(0.0078)
Female0.1759***(0.0046)
Soaps1.4439***(0.0091)
Sports-0.2854***
(0.0194)
Female×soaps0.5584***(0.0122)
Female×sports-0.1839***
(0.0268)
Switching cost3.8089***
(0.0100)
Constant-2.5179***
(0.0059)
Observations 31081Standard errors in brackets; *** p<0.01, ** p<0.05, * p<0.1.
As noted above, by comparing gender-specific ratings on shows immediately following sportsand soaps, we can identify switching costs. As shown, these estimated switching costs are alsostatistically significant, and evidence on their economic significance will be documented in a coun-terfactual analysis to follow, in which we trace out the dynamic response to cadenas for viewersand channels of differing ideology.
Finally, using these estimates of switching costs to identify preferences over ideological con-tent, we have that payoffs from information are associated with lower viewership overall. Thisis the payoff for both pro-government and opposition viewers from consuming moderate news.As shown, this negative effect is partially offset for same-type information, cadenas and news ongovernment channels for pro-government viewers and news on opposition channels for opposition
31
viewers. Conversely, payoffs are substantially lower for different-type information, cadenas andnews on government channels for opposition viewers and news on opposition channels for pro-government viewers. Note also the asymmetry between same-type and different-type ideology,with the benefits associated with same-type information (0.2409) smaller than the costs associatedwith different-type information (1.6717). Taken together, these estimates thus provide additionalsupport for the hypothesis of preferences for like-minded information.
7.4 Counterfactuals and Welfare Analysis
Using these parameter estimates, we then conduct a counterfactual scenario in which cadenasare replaced with news programming. That is, propaganda is replaced by opposition content onopposition channels and moderate content on moderate channels, with no change in content ongovernment channels. We then examine the dynamic responses to viewership and also considerthe welfare consequences of propaganda for opposition and pro-government viewers.
This analysis proceeds in the following three steps. First, we focus on the set of days on whicha single cadena was broadcast. This allows us to measure the dynamic response to a single changein ideological content. Second, using this sample of days and normalizing the time slot of thecadena to equal zero, we use the estimated model to predict viewership of shows aired throughoutthe day. For simplicity, we focus on viewership among females and in cities with the full set ofavailable channels (i.e., Caracas and Valencia). Third, we use the model to predict how viewershipwould have evolved during and after the airing of a cadena were it replaced by news programming,with ideological content depending upon the channel under consideration. Only programming inthe focal time slot (t = 0) is altered, and programming during the other time slots is unchangedunder the counterfactual.
32

Figure 7: Counterfactual Viewership0
.04
.08
0.0
4.0
80
.04
.08
-2 0 2 4 6 -2 0 2 4 6
pro-government viewers, oppositon channel
pro-government viewers, moderate channel
pro-government viewers, government channel
opposition viewers, oppositon channel
opposition viewers, moderate channel
opposition viewers, government channel
predicted counterfactual
time to cadena
The results from this exercise are provided in Figure 7, in which we plot viewership duringthe two shows aired before the cadena, the cadena, and the six shows aired after the cadena. Thex-axis is time to cadena and is normalized to equal zero during the cadena time slot. The y-axis is the viewership market share, separately by channel and viewer ideology. The upper panelprovides results for ratings on the opposition channel, with pro-government viewers on the left andopposition viewers on the right. The middle and bottom panels provide corresponding results formoderate and government channels. Finally, we consider both predicted market shares, as giventhe solid line, and market shares under the no-cadena counterfactual, as given by the dashed line.
As shown by the solid line, and consistent with the evidence provided above, there is a sharpdrop in viewership for opposition viewers when the cadena is broadcast on opposition channels.This drop is not apparent under the counterfactual, in which the cadena is replaced by oppositionnews. For pro-government viewers, by contrast, the pattern is reversed, with a slight increase inviewership of opposition channels when a cadena is aired and a sharp decrease in viewership whenthe cadena is replaced by opposition news.
These results also shed light on the magnitude of the estimated switching costs and the associ-
33
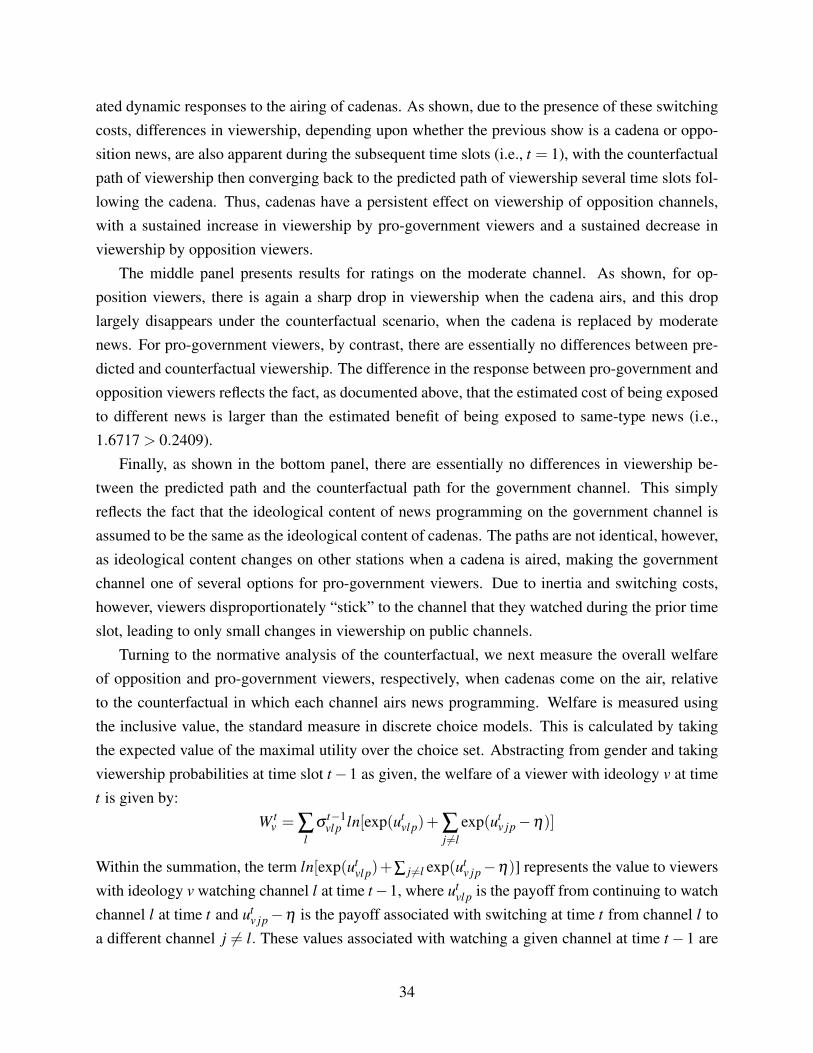
ated dynamic responses to the airing of cadenas. As shown, due to the presence of these switchingcosts, differences in viewership, depending upon whether the previous show is a cadena or oppo-sition news, are also apparent during the subsequent time slots (i.e., t = 1), with the counterfactualpath of viewership then converging back to the predicted path of viewership several time slots fol-lowing the cadena. Thus, cadenas have a persistent effect on viewership of opposition channels,with a sustained increase in viewership by pro-government viewers and a sustained decrease inviewership by opposition viewers.
The middle panel presents results for ratings on the moderate channel. As shown, for op-position viewers, there is again a sharp drop in viewership when the cadena airs, and this droplargely disappears under the counterfactual scenario, when the cadena is replaced by moderatenews. For pro-government viewers, by contrast, there are essentially no differences between pre-dicted and counterfactual viewership. The difference in the response between pro-government andopposition viewers reflects the fact, as documented above, that the estimated cost of being exposedto different news is larger than the estimated benefit of being exposed to same-type news (i.e.,1.6717 > 0.2409).
Finally, as shown in the bottom panel, there are essentially no differences in viewership be-tween the predicted path and the counterfactual path for the government channel. This simplyreflects the fact that the ideological content of news programming on the government channel isassumed to be the same as the ideological content of cadenas. The paths are not identical, however,as ideological content changes on other stations when a cadena is aired, making the governmentchannel one of several options for pro-government viewers. Due to inertia and switching costs,however, viewers disproportionately “stick” to the channel that they watched during the prior timeslot, leading to only small changes in viewership on public channels.
Turning to the normative analysis of the counterfactual, we next measure the overall welfareof opposition and pro-government viewers, respectively, when cadenas come on the air, relativeto the counterfactual in which each channel airs news programming. Welfare is measured usingthe inclusive value, the standard measure in discrete choice models. This is calculated by takingthe expected value of the maximal utility over the choice set. Abstracting from gender and takingviewership probabilities at time slot t−1 as given, the welfare of a viewer with ideology v at timet is given by:
W tv = ∑
lσ
t−1vl p ln[exp(ut
vl p)+∑j 6=l
exp(utv jp−η)]
Within the summation, the term ln[exp(utvl p)+∑ j 6=l exp(ut
v jp−η)] represents the value to viewerswith ideology v watching channel l at time t−1, where ut
vl p is the payoff from continuing to watchchannel l at time t and ut
v jp−η is the payoff associated with switching at time t from channel l toa different channel j 6= l. These values associated with watching a given channel at time t−1 are
34
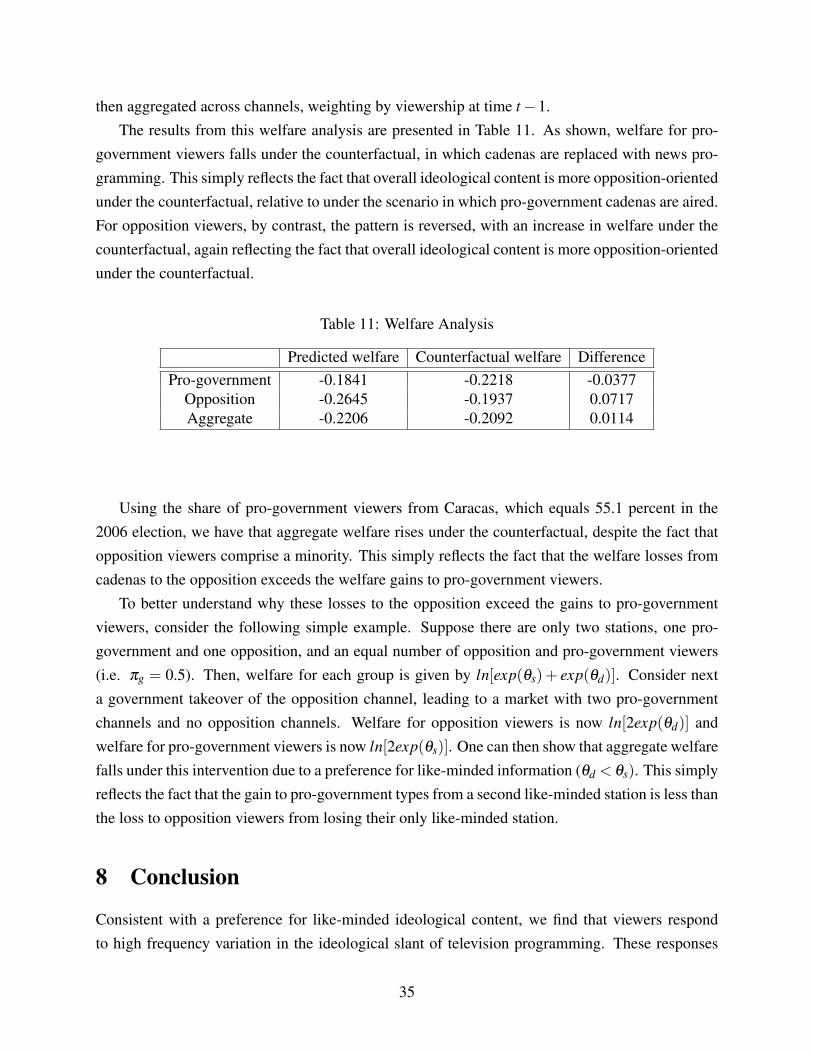
then aggregated across channels, weighting by viewership at time t−1.The results from this welfare analysis are presented in Table 11. As shown, welfare for pro-
government viewers falls under the counterfactual, in which cadenas are replaced with news pro-gramming. This simply reflects the fact that overall ideological content is more opposition-orientedunder the counterfactual, relative to under the scenario in which pro-government cadenas are aired.For opposition viewers, by contrast, the pattern is reversed, with an increase in welfare under thecounterfactual, again reflecting the fact that overall ideological content is more opposition-orientedunder the counterfactual.
Table 11: Welfare Analysis
Predicted welfare Counterfactual welfare DifferencePro-government -0.1841 -0.2218 -0.0377
Opposition -0.2645 -0.1937 0.0717Aggregate -0.2206 -0.2092 0.0114
Using the share of pro-government viewers from Caracas, which equals 55.1 percent in the2006 election, we have that aggregate welfare rises under the counterfactual, despite the fact thatopposition viewers comprise a minority. This simply reflects the fact that the welfare losses fromcadenas to the opposition exceeds the welfare gains to pro-government viewers.
To better understand why these losses to the opposition exceed the gains to pro-governmentviewers, consider the following simple example. Suppose there are only two stations, one pro-government and one opposition, and an equal number of opposition and pro-government viewers(i.e. πg = 0.5). Then, welfare for each group is given by ln[exp(θs)+ exp(θd)]. Consider nexta government takeover of the opposition channel, leading to a market with two pro-governmentchannels and no opposition channels. Welfare for opposition viewers is now ln[2exp(θd)] andwelfare for pro-government viewers is now ln[2exp(θs)]. One can then show that aggregate welfarefalls under this intervention due to a preference for like-minded information (θd < θs). This simplyreflects the fact that the gain to pro-government types from a second like-minded station is less thanthe loss to opposition viewers from losing their only like-minded station.
8 Conclusion
Consistent with a preference for like-minded ideological content, we find that viewers respondto high frequency variation in the ideological slant of television programming. These responses
35

are stronger for private channels, when compared to public channels, and for the most ideologicalchannels. The responses are stronger for viewers with larger choice sets, as proxied via cable.Consistent with this result, we also show that viewership of cable increases during cadenas. Theresults are also stronger for the most polarizing cadenas, those involving the delivery of goodsand services and those related to elections. Building upon this evidence, we structurally estimatethe model, documenting dynamic responses to viewership following cadenas. We also conduct anormative analysis, documenting welfare losses associated with cadenas.
This analysis has several implications. First, to the extent that discounting of biased informa-tion by viewers is incomplete and propaganda is thus influential, our results suggest that viewerresponses, as documented in this paper, may lead to increased political polarization. This polariza-tion may increase according to ideology, with pro-government viewers disproportionately exposedto propaganda, and according to income due to the fact that high-income viewers are more likelyto have access to cable, which were not required to air cadenas. Second, government propagandamay lead to welfare losses due to the reduction in media pluralism. This follows from the fact thatthe welfare losses to opposition viewers may exceed the welfare gains to pro-government viewers.
36

References
Adena, M., R. Enikolopov, M. Petrova, V. Santarosa, and E. Zhuravskaya (2015).Radio and the rise of the nazis in pre-war germany. Quarterly Journal of
Economics.
Besley, T. and A. Prat (2006). Handcuffs for the grabbing hand? media capture andgovernment accountability. The American Economic Review, 720–736.
Bisbal, M. (2009). La comunicacion masiva como politica de gobierno de hugochavez frias. In M. Bisbal (Ed.), Hegemonia y control comunicacional. EditorialAlfa.
Chang-Tai, H., E. Miguel, D. Ortega, and F. Rodriguez (2011). The price of politicalopposition: Evidence from venezuela’s maisanta. American Economic Journal:
Applied Economics 3(2), 196–214.
Chiang, C.-F. and B. Knight (2011). Media bias and influence: Evidence fromnewspaper endorsements. The Review of Economic Studies 78(3), 795–820.
Corrales, J. and M. Penfold (2011). Dragon in the Tropics: Hugo Chavez and the
Political Economy of Revolution in Venezuela. Washington D.C.,U.S: BrookingsLatin America Initiative Books.
DellaVigna, S., R. Enikolopov, V. Mironova, M. Petrova, and E. Zhuravskaya (2014).Cross-border media and nationalism: Evidence from serbian radio in croatia.American Economic Journals: Applied Economics 6(3), 103–132.
DellaVigna, S. and M. Gentzkow (2010). Persuasion: Empirical evidence. Annual
Review of Economics 2(1), 643–669.
DellaVigna, S. and E. Kaplan (2007). The fox news effect: Media bias and voting.The Quarterly Journal of Economics 122(3), 1187–1234.
Dinneen, M. (2012). The chavez government and the battle over the media invenezuela. Asian Journal of Latin American Studies 25(2), 27–53.
DiTella, R., S. Galiani, and E. Schargrodsky. (2012). Reality versus propaganda in theformation of beliefs about privatization. Journal of Public Economics 96, 553–567.
37
Durante, R. and B. Knight (2012). Partisan control, media bias, and viewerresponses: Evidence from berlusconi’s italy. Journal of the European Economic
Association 10(3), 451–481.
Enikolopov, R., M. Petrova, and E. Zhuravskaya (2011). Media and politicalpersuasion: Evidence from russia. The American Economic Review 101(7),3253–3285.
EU-EOM (2006). Final report: Presidential elections venezuela 2006. Technicalreport, European Union Election Observation Mission.
Frajman, E. (2014). Broadcasting populist leadership: Hugo chavez and alopresidente. Journal of Latin American Studies 43(3), 501–526.
Gentzkow, M. and J. M. Shapiro (2010). What drives media slant? evidence from usdaily newspapers. Econometrica 78(1), 35–71.
Gentzkow, M., J. M. Shapiro, and M. Sinkinson (2011). The effect of newspaperentry and exit on electoral politics. American Economic Review 101(7),2980–3018.
Gentzkow, M., J. M. Shapiro, and M. Sinkinson (2014). Competition and ideologicaldiversity: Historical evidence from us newspapers. The American Economic
Review 104(10), 3073–3114.
George, L. and J. Waldfogel (2003). Who affects whom in daily newspaper markets?Journal of Political Economy 111(4), 765–784.
Gerber, A. S., D. Karlan, and D. Bergan (2009). Does the media matter? a fieldexperiment measuring the effect of newspapers on voting behavior and politicalopinions. American Economic Journal: Applied Economics 1(2), 35Ð52.
Goettler, R. L. and R. Shachar (2001). Spatial competition in the network televisionindustry. RAND Journal of Economics 32(4), 624–656.
Kitzberger, P. (2010). The media activism of latin america’s leftist governments:Does ideology matter? Working paper 151, GIGA.
Martin, G. and A. Yurukoglu (2015). Bias in cable news: Real effects andpolarization. NBER Working Paper No. 20798.
38
Moshkin, N. and R. Shachar (2002). The asymmetric information model of statedependence. Marketing Science 21(4), 435–454.
Nelson, B. A. (2009). The Silence and the Scorpion: The Coup Against Chavez and
the Making of Modern Venezuela. New York, U.S: Nation Books.
Perretti, F. and C. Esteves-Sorenson (2012). In micro-costs: Inertia in televisionviewing. The Economic Journal 122(563), 867–902.
Prat, A. and D. Stromberg (2013). The political economy of mass media. InAdvances in Economics and Econometrics: Volume 2, Applied Economics: Tenth
World Congress, Volume 50, pp. 135. Cambridge University Press.
Prior, M. (2005). News v. entertainment: How increasing media choice widens gapsin political knowledge and turnout. American Journal of Political Science 49(3),594–609.
Qian, N. and D. Yanagizawa-Drott (2013). Government distortion in independentlyowned media: Evidence from u.s. cold war news coverage of human rights.Working Paper.
Republica Bolivariana de Venezuela (2012). Memorias de un golpe de estado.Republica Bolivariana de Venezuela.
Snyder, J. M. and D. Stromberg (2010). Press coverage and political accountability.Journal of Political Economy 118(2), 355–408.
Webster, J. G. (1984). Cable television’s impact on audience for local news.Journalism Quarterly 61(2), 419–422.
Webster, J. G. and G. D. Newton (1988). Structural determinants of the televisionnews audience. Journal of Broadcasting & Electronic Media 32(4), 381–389.
Welch, D. (1993). The Third Reich: Politics and Propaganda. London: Routledge.
Wilpert, G. (2007). Changing Venezuela by Taking Power: The History and Policies
of the Chavez Government. London, England: Verso Books.
Yanagizawa-Drott, D. (2014). Propaganda and conflict: Evidence from the rwandangenocide. Quarterly Journal of Economics 129(4).
Yao, S., W. Wang, and Y. Chen (2014). The value of sampling: The case of tvcommercial breaks. Working Paper.
39

Youn, S.-M. (1994). Program type preference and program choice in a multichannelsituation. Journal of Broadcasting & Electronic Media 38(4), 465–475.
40

A Appendix
Proof of Proposition 1: Note that the ratios σocσon
and σgcσgn
can be re-written as follows:
σoc
σon=
πg exp(θd)pg +πo exp(θs)po
πg exp(θd)+πo exp(θs)
σgc
σgn=
πg exp(θs)pg +πo exp(θd)po
πg exp(θs)+πo exp(θd)
We require that:σoc
σon<
σgc
σgn
Inserting the above expressions, cross-multiplying, and dividing through by πgπo, we requirethat:
exp(θs)2 po + exp(θd)
2 pg < exp(θs)2 pg + exp(θd)
2 po
Re-arranging, we require that:
exp(θd)2(pg− po)< exp(θs)
2(pg− po)
Since (pg− po)> 0, we simply require that θd < θs, which is satisfied by assumption.Proof of Proposition 2. With three channels, note that market shares for news and cadenas are
given by:
σgn = πgexp(θs)
1+ exp(θs)+ exp(θd)+ exp(θm)+πo
exp(θd)
1+ exp(θs)+ exp(θd)+ exp(θm)
σon = πgexp(θd)
1+ exp(θs)+ exp(θd)+ exp(θm)+πo
exp(θs)
1+ exp(θs)+ exp(θd)+ exp(θm)
σmn = πgexp(θm)
1+ exp(θs)+ exp(θd)+ exp(θm)+πo
exp(θm)
1+ exp(θs)+ exp(θd)+ exp(θm)
σgc = πgexp(θs)
1+ exp(θs)+ exp(θd)+ exp(θm)pg +πo
exp(θd)
1+ exp(θs)+ exp(θd)+ exp(θm)po
41
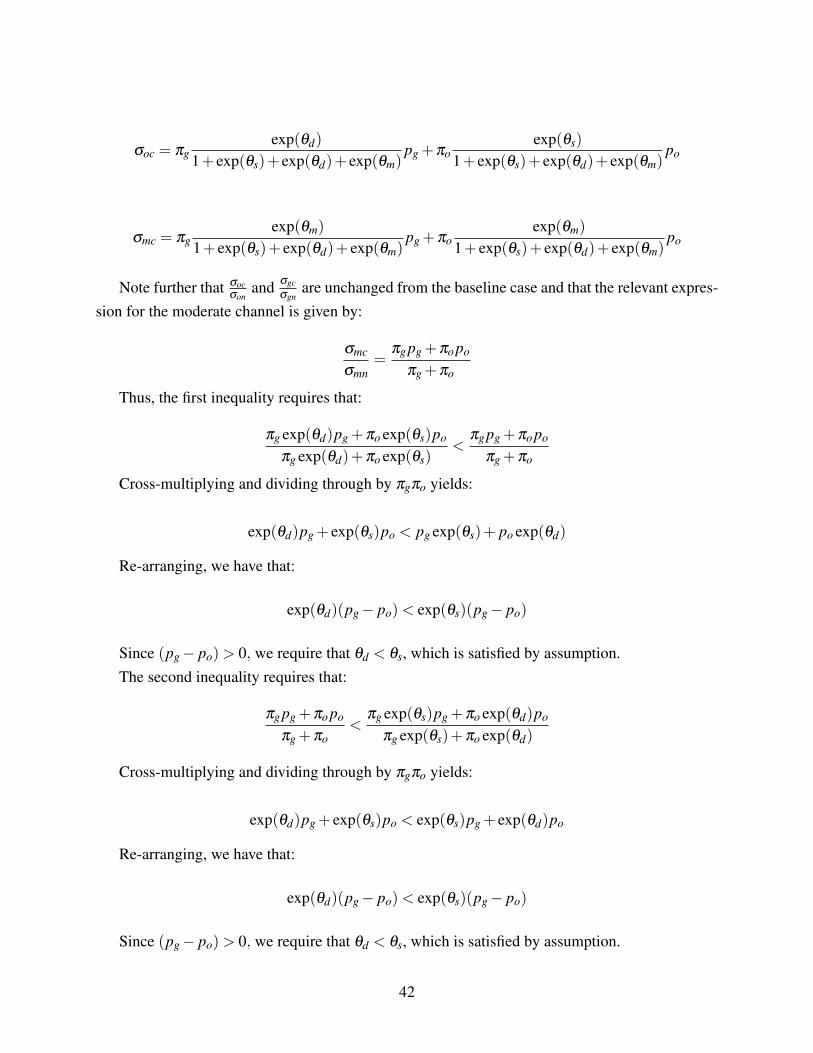
σoc = πgexp(θd)
1+ exp(θs)+ exp(θd)+ exp(θm)pg +πo
exp(θs)
1+ exp(θs)+ exp(θd)+ exp(θm)po
σmc = πgexp(θm)
1+ exp(θs)+ exp(θd)+ exp(θm)pg +πo
exp(θm)
1+ exp(θs)+ exp(θd)+ exp(θm)po
Note further that σocσon
and σgcσgn
are unchanged from the baseline case and that the relevant expres-sion for the moderate channel is given by:
σmc
σmn=
πg pg +πo po
πg +πo
Thus, the first inequality requires that:
πg exp(θd)pg +πo exp(θs)po
πg exp(θd)+πo exp(θs)<
πg pg +πo po
πg +πo
Cross-multiplying and dividing through by πgπo yields:
exp(θd)pg + exp(θs)po < pg exp(θs)+ po exp(θd)
Re-arranging, we have that:
exp(θd)(pg− po)< exp(θs)(pg− po)
Since (pg− po)> 0, we require that θd < θs, which is satisfied by assumption.The second inequality requires that:
πg pg +πo po
πg +πo<
πg exp(θs)pg +πo exp(θd)po
πg exp(θs)+πo exp(θd)
Cross-multiplying and dividing through by πgπo yields:
exp(θd)pg + exp(θs)po < exp(θs)pg + exp(θd)po
Re-arranging, we have that:
exp(θd)(pg− po)< exp(θs)(pg− po)
Since (pg− po)> 0, we require that θd < θs, which is satisfied by assumption.
42

Proof of Proposition 3: Then, we have the following market shares for news and for cadenason the three channels:
σgn = πgexp(θs)
1+ exp(θs)+2exp(θd)+πo
exp(θd)
1+2exp(θs)+ exp(θd)
σon = πgexp(θd)
1+ exp(θs)+2exp(θd)+πo
exp(θs)
1+2exp(θs)+ exp(θd)
σcn = πgexp(θd)
1+ exp(θs)+2exp(θd)+πo
exp(θs)
1+2exp(θs)+ exp(θd)
σgc = πgexp(θs)
1+ exp(θs)+2exp(θd)p′g +πo
exp(θd)
1+2exp(θs)+ exp(θd)p′o
σoc = πgexp(θd)
1+ exp(θs)+2exp(θd)p′g +πo
exp(θs)
1+2exp(θs)+ exp(θd)p′o
σcc = πgexp(θd)
1+ exp(θs)+2exp(θd)+πo
exp(θs)
1+2exp(θs)+ exp(θd)
+πgexp(θs)
1+ exp(θs)+2exp(θd)
exp(θd−η)
1+ exp(θs)+ exp(θd−η)
+πoexp(θd)
1+2exp(θs)+ exp(θd)
exp(θs−η)
1++exp(θd)+ exp(θs−η)
+πgexp(θd)
1+ exp(θs)+2exp(θd)
exp(θd−η)
1+ exp(θs)+ exp(θd−η)
+πoexp(θs)
1+2exp(θs)+ exp(θd)
exp(θs−η)
1++exp(θd)+ exp(θs−η)
where p′g = exp(θs)[1+ exp(θs)+ exp(θd −η)]−1 and p′o = exp(θd)[1+ exp(θd)+ exp(θs−η)]−1.
For cable viewership, the second and third lines represent the viewers that switch from thegovernment channel to cable during the cadena, and the fourth and fifth lines represent the viewersthat switch from the opposition channel to cable during the cadena.
Then, with cable, we have that:
σoc
σon=
πg exp(θd)p′g +πo exp(θs)p′oπg exp(θd)+πo exp(θs)
σgc
σgn=
πg exp(θs)p′g +πo exp(θd)p′oπg exp(θs)+πo exp(θd)
43

Then, comparing this expression to the one in the Proof of Proposition 1, we require that:
πg exp(θd)p′g +πo exp(θs)p′oπg exp(θs)p′g +πo exp(θd)p′o
<πg exp(θd)pg +πo exp(θs)po
πg exp(θs)pg +πo exp(θd)po
Cross-multiplying and dividing through by πgπo yields:
exp(θd)2 p′g po + exp(θs)
2 p′o pg < exp(θd)2 pg p′o + exp(θs)
2 po p′g
Re-arranging, we require that:
[exp(θs)2− exp(θd)
2](p′o pg− po p′g)< 0
Since the first term is positive, we require that p′o pg < po p′g.Substituting in the definitions for p′o, pg, po, and p′g, we require that:
11+ exp(θd)+ exp(θs−η)
11+ exp(θs)
<1
1+ exp(θd)
11+ exp(θs)+ exp(θd−η)
Cross multiplying, we require that:
[1+ exp(θd)][1+ exp(θs)+ exp(θd−η)]< [1+ exp(θs)][1+ exp(θd)+ exp(θs−η)]
Canceling like terms, we require that:
[1+ exp(θd)]exp(θd−η)< [1+ exp(θs)]exp(θs−η)
This is satisfied since θd < θs.
Proof of Proposition 4: Direct inspection of the two market shares σcn and σcc in the previousproof provides a proof.
44