the l train shutdown - transalt.org planning international, llc january 2018 . the l train shutdown:...
TRANSCRIPT

The L Train Shutdown: A preliminary assessment of proposed NYC DOT and MTA mitigation measures
Annie Weinstock and Walter Hook BRT Planning International, LLC January 2018
The L Train Shutdown: A preliminary assessment of NYC DOT and MTA mitigation measures Page 2
Contents The L Train Shutdown: .................................................................................................................................. 1
Forward ......................................................................................................................................................... 3
Executive Summary ....................................................................................................................................... 4
Introduction .................................................................................................................................................. 6
What if NYC DOT and MTA “Do Nothing”? ................................................................................................... 6
Gridlock for Cars and Trucks ..................................................................................................................... 6
A Very Long Commute for L Train Riders .................................................................................................. 7
MTA / NYC DOT Will "Do Something" ........................................................................................................... 9
Transit Routing .......................................................................................................................................... 9
Subway Stations ...................................................................................................................................... 12
Street Design ........................................................................................................................................... 14
Design for 14th Street .......................................................................................................................... 15
Brooklyn Shuttle Bus Street Designs ....................................................................................................... 23
Grand Street ........................................................................................................................................ 24
Other Brooklyn Streets ....................................................................................................................... 27
Delancey, Kenmare, and Allen Streets ................................................................................................ 27
Williamsburg Bridge HOV .................................................................................................................... 27
Fare Collection ........................................................................................................................................ 28
Conclusion ................................................................................................................................................... 31

The L Train Shutdown: A preliminary assessment of NYC DOT and MTA mitigation measures Page 3
Forward Transportation Alternatives contracted BRT Planning International (BRTPlan) to evaluate the
ramifications of the pending L Train shutdown and assess the adequacy of the proposed New York City
Department of Transportation (NYCDOT) and Metropolitan Transportation Authority (MTA) response.
This report contains that evaluation as of January 2018. It is based on the information that has been
released by NYCDOT and MTA to the public, supplemented by BRTPlan's own data collection. As NYC
DOT and MTA release additional data and plans, the conclusions will be updated, and some changes
may be made.

The L Train Shutdown: A preliminary assessment of NYC DOT and MTA mitigation measures Page 4
Executive Summary The L Train, between Eighth Avenue in Manhattan and Bedford Avenue in Brooklyn, will be closed for
approximately 15 months, beginning in April of 2019. This shutdown is necessary to finalize repairs to
damages caused by flooding from Superstorm Sandy. The potential cataclysm that this represents
cannot be overstated. The L Train, which moves an estimated 400,000 passengers a day, is one of
highest demand subway lines in New York City and the US.
In December 2017, NYCDOT and MTA jointly released an L Train shutdown mitigation plan. The street
design measures included in this plan are bold and necessary. The replacement bus routes serve the
most adversely affected commuters and are direct and short. With minor changes, this plan could
significantly mitigate the problem.
However, the scale of the shutdown is so considerable that even these bold measures do not go far
enough. If more is not done to increase transit speeds, many L Train passengers will switch to cars and
taxis, significantly worsening today's already severe congestion. The current response to the problem
relies heavily on Select Bus Services (SBS). Most SBS routes operate at between 6 and 7 mph. New York
City can do better.
Bus Rapid Transit (BRT) systems across the US average speeds between 11 mph and 17 mph. If the L
Train replacement services take the form of SBS, this will be a significant improvement over standard
shuttle buses, but not sufficient to avoid severe bus congestion on 14th Street. Bus speeds will drop
below normal SBS speeds to under 3 mph; there will be severe traffic impacts across the city; and
significant time loss for up to a hundred thousand daily commuters.
We therefore make the following key recommendations:
Recommendation 1: 24/7 operation of exclusive bus facilities.
High ridership on the L Train is not clearly limited to peak hours. L Trains are often packed throughout
the day, and on nights and weekends, and congestion on 14th Street is constant throughout the day.
Many of the sidewalk improvements included in NYCDOT/MTA's plan are only viable if the exclusive
busway operates 24 hours. If the peak period can handle the loss of a mixed traffic street, so too can the
off-peak, when traffic is lighter. Local deliveries and parking garage access will still be possible via the
busway.
Recommendation 2: Extend the 14th Street busway and add more bus lanes in Brooklyn.
The proposed routes extend well beyond the dedicated bus lanes. The 14th Street busway should extend
from the Ferry Terminal to 9th Avenue and if extending it that far is too challenging, then to at least
Avenue A. The highest bus ridership on 14th Street will be between the Ferry Terminal on the far east
side, and Union Square in the AM peak. Berry and Roebling Streets in Williamsburg should also have
dedicated bus lanes or bus speeds in Williamsburg will be extremely slow: Today, the Bedford L Station
is one of the highest volume subway stations in New York City. The Grand Street shuttles should have a
stop at or nearby Borinquen Place to better serve the large segment of population currently boarding at
Lorimer Station, as well as many passengers displaced by overcrowding at the Marcy Avenue J/M/Z.

The L Train Shutdown: A preliminary assessment of NYC DOT and MTA mitigation measures Page 5
Recommendation 3: Design bus stops to handle much higher passenger volumes.
All bus stops on the 14th Street SBS and the Brooklyn shuttles will have very heavy passenger volumes.
There will need to be two places where each bus can allow passengers to board and alight, with enough
space in between for bus passing.
NYCDOT/MTA's plan shows bus stops right up against the intersection, which can quickly jam up the
busway. Bus stops should be set back at least 65’ and ideally 130’ from the nearest intersection to allow
buses to clear the station for the next bus.
Bus stops should be level with the bus floor. At-level boarding can cut the boarding time for each
passenger by about half a second and can save more than a minute and a half for each wheelchair user.
It also makes for a more pleasant boarding experience.
Recommendation 4: Restrict vehicular turns across bus lanes.
Bus lanes in New York City allow mixed traffic to enter them to turn right. Wherever right turns are
allowed across bus lanes (i.e., all planned bus lanes outside of the 14th Street busway), they will cause
significant delay to buses. Hence, all turning movements that can be practicably forbidden across the
proposed bus lanes should be removed.
Recommendation 5a: Make all 14th Street and Brooklyn shuttles free.
NYCDOT/MTA's plan on the 14th Street Select Bus (SBS) Route is for passengers to pay off-board, with
periodic inspections once onboard. As with the other SBS routes, inspectors must stop the whole bus to
perform the inspection. Any delay on 14th Street will to lead to gridlock in the busway at those volumes.
Further, it is not clear from the plans whether or not the M14A and M14D will also benefit from off-
board fare collection. If not, they will continue to operate as pay on board, front-door only, meaning
that the 14A and 14D will block the 14th Street busway, even if the other 14th Street recommendations
are taken. No fare payment plan has been released for the Brooklyn shuttle bus routes.
Normally when a subway line is shut for repairs, it is replaced by a free shuttle bus. This helps offset the
inconvenience of losing a subway line, but also greatly hastens the boarding process.
Recommendation 5b: Alternatively, implement pre-paid zones at all bus stops: If the MTA determines
that it cannot afford to make all the services free, the other way to address the boarding delay is to
create pre-paid zones. Like in a subway station, bus passengers would enter a bus stop or station by
paying their fares, and then passing through a barrier (a turnstile, or even a painted line). This would
allow all buses, including the 14A and D, to benefit from pre-paid all-door boarding and would avoid the
problem of periodic inspection delays.
If these measures are implemented, travel time for passengers adversely affected by the L Train could
be minimized to the maximum extent technically feasible given the time and budget. Moreover, as these
measures would have the greatest chance of retaining transit passengers inside the transit system, they
have the greatest chance of minimizing traffic congestion. Finally, they would also allow NYCDOT and
MTA to simultaneously pilot several key innovations. Implementing these measures will be the
difference between a mild inconvenience and a stuck-on-the-bus nightmare.

The L Train Shutdown: A preliminary assessment of NYC DOT and MTA mitigation measures Page 6
Introduction
The Manhattan section of the L Train, and the Canarsie Tunnel of the L train between 1st Avenue in
Manhattan and Bedford Avenue in Brooklyn, will be closed for approximately 15 months, starting in
April 2019.
The potential cataclysm that this represents cannot be overstated. The L train which moves an
estimated daily 400,000 passengers1, is one of the highest volume single subway lines in the United
States.
Approximately 225,000 daily passengers,2 or about 22,500 peak hour passengers3, that currently enter
Manhattan from Brooklyn through the L Train’s Canarsie Tunnel, will now have to reach their
destinations in some other way. Even with the L Train in operation, it is frequently heavily overcrowded,
the nearby bridges and tunnels across East River are badly congested, and most of the subway services
that cross the East River are nearing capacity. What's more, the extensive up-zoning of the Brooklyn
waterfront has led to an unprecedented scale of new development and new transit trips dependent on
the L Train, many of them Manhattan-bound.
In addition, the 50,000 daily passengers that currently use the L Train within Manhattan only, will have
to make their trip in another way; most likely by walking, cycling or surface bus.
What if NYC DOT and MTA “Do Nothing”? While many cities such as London, Washington DC, and even New York have faced major subway line
repairs in the past, these problems have almost always been dealt with by evening and weekend
closures. The authors of this report could discover no precedent for such a major subway line to be
closed entirely for such an extended period of time. No one, including at the MTA or NYC DOT, is really
sure what is going to happen.
Gridlock for Cars and Trucks Given that the Williamsburg Bridge is already heavily congested, not only in the morning but pretty
much all day (
Figure 1), even a very small increase in car traffic on the bridge can have dire consequences. If all the
displaced L Train passengers tried to take an Uber or Lyft into Manhattan, there would need to be
between 12 and 19 additional bridge and tunnel lanes,4 and since there is zero additional bridge and
road capacity, the result would be miles of gridlock lasting much of the day.
1 MTA and NYC DOT "Fixing the L Line's Canarsie Tunnel." June 8, 2017. 2 Ibid. 3 Absent better data, it is typical to estimate peak hour, peak direction ridership at 1/10 daily ridership 4 The capacity of a mixed traffic lane is a function of the expected speed or 'level of service' (LOS) for a given number of passenger car units (PCUs), which will carry a variable number of passengers. If one assumes 1,000 PCUs per hour per lane and 1.2 passengers per vehicle, which is fairly typical, this would be a reasonably good LOS (B, more or less), as according to the Highway Capacity Manual. This yields 1,200 passengers per lane per hour. Either a lower LOS (D) or a greater number of

The L Train Shutdown: A preliminary assessment of NYC DOT and MTA mitigation measures Page 7
Figure 1: Current typical peak hour traffic conditions on the East River Bridges at 9:05am on Thursday. The Manhattan-bound direction of the Williamsburg Bridge is the darkest red, indicating that traffic is at a near standstill.
On the Manhattan side, there are currently about 3,000 peak hour peak direction bus passengers
traveling along 14th Street on the M14A and M14D5, and another 5,000 peak hour peak direction L Train
passengers6 with origins and destinations within Manhattan. If the 5,000 L Train passengers switched to
private cars, taxis, or Ubers, it would require between three and four extra lanes in the peak flow
direction to keep the road from gridlock. Clearly, it is impossible to widen 14th Street; neither of these
scenarios are realistic, but very significant gridlock is a real possibility even if only a few passengers
switch to cars.
Traffic congestion on 14th Street, like most Manhattan crosstown streets, is ubiquitous throughout the
day, with no clear peak during rush hour and no clear decrease except in the early morning and late
evening7.
In other words, it takes only a few people becoming frustrated with the L Train replacement services to
make a bad traffic situation a nightmare.
A Very Long Commute for L Train Riders
If NYC DOT and the MTA “Do Nothing”, L Train riders that choose to remain on transit will be greatly
impacted. Trips between Williamsburg, Greenpoint, and inner Bushwick and the 14th Street corridor in
Manhattan will be worst affected. Figure 2 shows the likely shortest path transit trips in the "Do
Nothing" scenario.
passengers per vehicle would yield a higher number of passengers per lane per hour, yielding a reasonable maximum of about 2,000. So 22,500/2000 = 12 and 22,500/1200 = 19. The number is for illustration purposes only. 5 http://web.mta.info/nyct/facts/ridership/ridership_bus.htm 6 MTA and NYC DOT "Fixing the L Line's Canarsie Tunnel." June 8, 2017. 7 The authors used Google Maps "Typical Traffic" to view traffic speeds on 14th Street at various times throughout the day.

The L Train Shutdown: A preliminary assessment of NYC DOT and MTA mitigation measures Page 8
Figure 2: New trips / shortest path for existing trips between L Train stations
Figure 3 shows the estimated increases in travel times that L Train riders, traveling between L Train
stations and other common destinations, are likely to face once the L Train shuts down. This table was
created based on a shortest path analysis, using the existing MTA system, as well as existing ferries.
Figure 3: Additional travel time (minutes) during L train closure8
L Train riders (around 55,000 daily) from East Williamsburg and the Williamsburg waterfront to the East
Village face up to 35 minutes of additional travel time. This is because there are few ways to get to First
Avenue and 14th Street besides the L Train. Many other trips are also adversely affected.
Over the course of 15 months, this results in a loss of roughly 25 million person-hours9. Using a
reasonable value of travel time10, this is going to cost the residents of North Brooklyn and the 14th Street
Corridor about $125 million. Impacts to businesses are much higher.
8 This analysis assumes new 6 minute headways on remaining L Train but does not account for slower bus and subway speeds due to higher frequencies and ridership. 9 55,000 L passengers affected * 35 minutes of average additional travel time * two (i.e., 2 times a day) * 300 days a year * over the course of 15 months (or 1.25 years) / 60 (i.e., minutes into hours) = 25 million person-hours 10 Transport economists typically use 1/3 of hourly per capita income to estimate a value of travel time. This works out to $5.00 an hour for New York City.
Wilson Jefferson Graham Lorimer Bedford 1st Av Union Sq 6th Av 8th Av 1st & 34th Park & 34th 6th & 34th 8th & 34th Bway/Lfyte W. 4th Wall St
Canarsie 2 2 2 2 2 18 18 12 2 13 16 11 0 2 2 2
Wilson 2 2 2 2 26 19 13 9 21 19 12 7 2 1 1
Jefferson 0 0 2 32 25 19 24 27 21 18 22 10 16 16
Graham 0 2 44 35 31 29 27 33 30 25 22 22 23
Lorimer 2 34 28 23 23 21 27 20 19 13 14 14
Bedford 37 31 26 34 19 28 23 30 16 17 17
1st Av 8 10 14 0 6 6 12 0 10 6
Union Sq 4 7 0 0 0 0 0 0 0
6th Av 4.5 5 0 0 0 0 0 0
8th Av 10 14 0 0 0 0 0
1st & 34th 0 0 0 0 0 0
Park & 34th 0 0 0 0 0
6th & 34th 0 0 0 0
8th & 34th 0 0 0
Bway/Lfyte 0 0
W. 4th 0

The L Train Shutdown: A preliminary assessment of NYC DOT and MTA mitigation measures Page 9
MTA / NYC DOT Will "Do Something"
In December 2017, MTA and NYC DOT jointly released an L Train shutdown mitigation plan.
The plan can be broken down into four main areas, with the responsibility for each area resting on
either MTA or NYC DOT:
Transit routing (MTA)
Subway Stations (MTA)
Street design (NYC DOT)
Fare collection (MTA/NYC DOT)
Transit Routing As MTA is responsible for operating transit services, the agency developed a service plan, then analyzed
which services - rail and bus - would become the most prominent alternatives for L Train riders.
Figure 4: MTA's map of planned transit services (bus, subway, ferry) to operate during the L Train shutdown
MTA's service plan map depicts the following service plan affecting existing L Train riders:

The L Train Shutdown: A preliminary assessment of NYC DOT and MTA mitigation measures Page 10
1. L Train: The L Train will still be operational between Bedford Avenue Station and points east, but
out of service from Bedford, under the East River, and across 14th Street in Manhattan.
2. G Train: The G Train is shown as a major subway-based alternative, with improvements at
several stations which allow displaced L Train riders to transfer from the G Train onto a
Manhattan-bound subway alternative.
3. J/M/Z Trains: The J/M/Z Trains are also shown prominently in the MTA's service plan as major
Manhattan-bound subway alternatives offering a direct ride into Manhattan.
4. Shuttle Buses: The most notable addition to the MTA service plan map is a set of new shuttle
bus replacement services. These include:
a. A shuttle bus route from the Grand Street L Station in Brooklyn, across Grand Street and
the Williamsburg Bridge, and up 1st Avenue (down 2nd) to terminate at 14th Street
b. A shuttle bus route operating as a one-way pair on Bedford Avenue and Roebling Street,
across the Williamsburg Bridge, and terminating at the Spring Street 6 Train Station.
c. A new Select Bus Service (SBS) route picking up passengers from a new East River Ferry
terminal at East 20th Street in Manhattan, traveling south to 14th Street, and across 14th
Street to the West Side Highway.
5. Ferry services: A new ferry route will operate from North Williamsburg to East 20th Street in
Manhattan.
The MTA's service plan, taken on its own, is reasonable for replacing the lost trips. The routes serve
the most severely impacted areas well, with direct trips providing extensive connections to subway
lines. The main concern we have with the services is that the Grand Street shuttle bus route makes no
stops in Brooklyn other than at the Grand Street L Station. The Grand Street shuttle bus route is
designed as if most of its passengers are coming the still-operating eastern portion of the L Train, and
transferring in order to get into Manhattan. This will indeed account for some of the Grand Street
shuttle bus passengers; however, L Train passengers coming from points east have the alternative of
using the Canarsie-bound L Train to transfer to the M or A Trains. At least as affected, will be those
passengers currently boarding the L Train at Lorimer Station as well as passengers attempting to board
the J/M/Z at Marcy station but unable to access the platform due to crowding conditions (see section
"Subway Stations"). An additional stop on the Grand Street shuttle bus routes near Borinquen Place or
elsewhere on Grand Street is recommended.
After developing these services, the MTA ran its transit model to estimate passenger volumes on each of
the major bus and subway alternatives. The MTA assumed that its subway lines have enough capacity to
absorb about 85% of the demand from former L Train passengers11, and that the remaining 15% percent
would need to be accommodated with shuttle buses.
11 MTA and NYC DOT "Fixing the L Line's Canarsie Tunnel." June 8, 2017.

The L Train Shutdown: A preliminary assessment of NYC DOT and MTA mitigation measures Page 11
Figure 5 shows the results of MTA's model run (the thicker the line, the more expected passengers). The
speeds assumed by this modeling exercise are unknown.
Figure 5: AM peak hour volumes of displaced L Train passengers on each routing alternatives, as predicted by MTA's transit model
These model results indicate that the most popular alternative for displaced L Train riders will be to shift
to the M and J Trains, beginning their trips at the Lorimer, Hewes, and Marcy J/M/Z Stations. The next
most popular alternative for displaced L Train riders will be to shift to the G Train and transfer at Court
Square for the M, E, and 7 Trains.
Our visual estimate of the new travel paths for the 22,500 AM peak hour Manhattan-bound L Train
passengers, based on MTA’s map in Figure 5, is as follows:
J/M/Z: 10,000
G to Court Square: 5,000
Shuttle buses: 3,800
Ferry: 1,500
Other: 2,300
This analysis seems largely correct; however, while the trains may have the capacity to absorb 85% of
the former demand, several critical station platforms do not, and will constitute bottlenecks. The next
section describes in detail the capacity constraints of Marcy and Court Square Stations, concluding that
only 75% of current L Train Riders, can actually be accommodated by the subway system.

The L Train Shutdown: A preliminary assessment of NYC DOT and MTA mitigation measures Page 12
While 75% of L Train passengers can be accommodated on the subway system (with some increased
frequencies and additional cars on the G Train) they will be significantly inconvenienced. Passengers
traveling between North Brooklyn (Williamsburg, Greenpoint, and Bushwick) and the 14th Street
Corridor between Union Square and points east, are the most inconvenienced, with additional travel
times of between 30 and 40 minutes.
If the speeds on the shuttle bus replacement services are increased as a result of including various
design elements, then they would draw even more passengers from cars and the subway alternatives.
Since MTA released only the map shown in Figure 5 and not an explanation of what speeds it assumed
the shuttle buses would travel (nor the design elements it assumed would be included in order to
achieve those speeds), the number of passengers it assumes will take the buses could vary significantly.
As the shuttle bus routes are highly direct, they would also mitigate a lot of the time loss caused by the L
Train shutdown, and after the L Train service is restored, they may prove worth retaining as a way of
alleviating ever worsening overcrowding on the L Train.
Subway Stations The Marcy J/M/Z Station is by far the closest alternative to the Bedford L station for a vast number of L
Train riders in Central Williamsburg and the Williamsburg waterfront. After measuring the platforms and
calculating the platform capacity, we estimated that the platform is currently at about 56% capacity.
Figure 6: Current platform crowding, Marcy Station, 10am
The basis of this calculation is shown in Figure 7. The results are sensitive to how one defines the space
required per waiting passenger. In the US, capacity is commonly defined as 10 square feet per waiting
passenger, while internationally even 3 square feet per person is sometimes considered capacity. The
calculations below already consider a very tight 5 feet per waiting passenger.
BRT Planning International, 2018
Currently: 1,380 passengers AM peak hourOnce L Train closes, additional Pax / Hour: 2,113 (½ Bedford L & ½ Lorimer L pax)Over Capacity: 136% Diverted from Marcy: 800- 1000 pax will be pushed onto the Shuttles or walk to Hewes
DIVERSIONS TO THE SUBWAY

The L Train Shutdown: A preliminary assessment of NYC DOT and MTA mitigation measures Page 13
Figure 7. Marcy Station Platform Capacity Calculations
The current level of platform saturation is calculated based on a waiting capacity which requires two
feet of width for a safety zone (the yellow stripe) and three feet of width for circulation up to 2,000
passengers per hour. Given Marcy’s 8-foot wide platforms, this leaves only 3 feet for waiting passengers
times the usable platform length (392-feet) or 1176 square feet of usable space. Divided by five feet per
passenger yields 235 passengers that can wait per train. Irregularity diminishes the platform capacity,
and we used a standard irregularity index of 0.3 which means that the average deviation from the
scheduled headway is around 30%. Passenger capacity per train is adjusted downward by this 30%, or
165 passengers per train. We estimate that the maximum frequency that the J/M/Z can handle is about
15 trains per hour, so 165 * 15 = 2,470 passengers per hour. Given an estimated 1,380 passengers per
hour, this yields a current level of station saturation at 56%.
With the L Train shutdown, we estimate that another 1,872 passengers would attempt to use Marcy
Station (half of the Bedford peak hour boardings and one third of the Lorimer peak hour boardings). We
estimate that about 800 passengers will be unable to access the station due to overcrowding during the
peak hour. Though the MTA plans some improvements to Marcy Station, we do not see how the
platforms can be significantly expanded.
Another significant bottleneck exists on the E/M platform at Court Square Station (Figure 8). Using a
similar methodology as above, we estimate that about 1,200 passengers will be unable to use the Court
Square E/M platform.
Value Units Source/Calculation
Current AM Peak Hr Passengers Marcy1380 passengers/hr
1/10 of daily station boardings from
http://web.mta.info/nyct/facts/ridership/ridership_sub.htm
Total Platform Length 482 feet Authors estimate
Usable platform length 392 feet Authors estimate
Unusable platform 90 feet Authors estimate
Width, Usable Section 8 feet Authors estimate
Width, Unusable Section 4.5 feet Authors estimate
Square Feet Per passenger (Capacity) 5 feet Varies between 3 and 10
Safety Zone 2 feet (width)
Circulating Zone 3 feet (width) per 2000 pax/hr
Remaining space for waiting passengers 3 feet (width)
Usable Area for waiting passengers 1176 sq. ft. Space for waiting * Usable Length
Capacity for waiting passengers per train 235 pax/train Usable area/Sq.Ft. per pax
Irregularity Index (IRR) 0.3 index variance from scheduled arrivals
Capacity for passengers per train w/ irregularity 165 pax/train Capacity - (Capacity * IRR)
Max frequency 15 trains/hour 4 minute headways
Hourly capacity 2470 passengers/hr Capacity Per train * frequency
Current level of station saturation 56% % Pax/Capacity
Half of Beford Peak hour boardings 1374 passengers http://web.mta.info/nyct/facts/ridership/ridership_sub.htm
1/3 of Lorimer Peak Hour Boardings 498 passengers http://web.mta.info/nyct/facts/ridership/ridership_sub.htm
Total Additional Passengers 1872 passengers
Total New Passengers 3252 passengers New Pax + Existing Pax
Projected Over Capacity 236% % Total New Pax/Station Capacity
Passengers Displaced 782 passengers Total New Pax - Station Capacity
Marcy Station Capacity Calculation

The L Train Shutdown: A preliminary assessment of NYC DOT and MTA mitigation measures Page 14
Figure 8: Current platform crowding, Court Square Station E/M platform, 9am
In total, only about 75% of the current Manhattan-bound L passengers can be accommodated by the
existing subway services, due to platform bottlenecks. This is in line with the MTA’s recently revised
estimate of 70% - 80% can be accommodated by other subway lines. In other words, another 2,000 peak
hour passengers will be unable to access their nearest alternative subway station due to overcrowding.
Whether they are drawn to take shuttle buses or end up in cars causing a massive additional traffic jam
will largely depend on the speed and convenience of the shuttle services.
Street Design While bus and subway operation is the realm of MTA New York City Transit, street design is managed by
New York City Department of Transportation (NYC DOT). As such, street treatments to prioritize the
shuttle bus replacement services are the responsibility of NYC DOT.
While NYC DOT has not released conceptual designs for the roads on which these services will operate,
some sketch-level designs have been released for 14th Street and for Grand Street in Brooklyn.
One commonality across all of the designs and plans is the uncertainty regarding the hours of operation
for exclusive bus facilities, including bus lanes.
Recommendation 1: All bus exclusive bus lanes should operate 24 hours a day, 7 days a week. High
ridership on the L Train is not limited to peak hours. L Trains are often packed throughout the day,
including on nights and weekends. Many of the sidewalk improvements included in NYCDOT/MTA's plan
are only viable if the 14th Street busway operates 24 hours. If the peak period can handle the loss of a
mixed traffic street, so too can the off-peak, when traffic is lighter. Local deliveries and parking garage
access will still be possible on most, if not all, of the planned bus lanes.

The L Train Shutdown: A preliminary assessment of NYC DOT and MTA mitigation measures Page 15
Design for 14th Street
Preliminary information released by NYC DOT shows that 14th Street between 8th and 3rd Avenues is
planned to be bus- and local deliveries-only. The hours of these restrictions is yet to be determined.
Figure 9: General strategy for 14th St. busway, NYC DOT and MTA
Discussions with NYC DOT indicate that this 14th Street busway will include one lane for buses in each
direction except at stops where there will be two lanes in the direction served by the bus stop. Due to
significantly heightened pedestrian volumes, NYC DOT is proposing widened sidewalks and pull-over
areas for delivery vehicles. The stops are depicted as being immediately before or after the
intersection. No bike lanes are included; two directional parking-protected bike lanes have been
included on 13th Street. University Place and Union Square West would no longer function as through
streets and would become new public spaces. Finally, there are no plans to make the bus stop
platforms level with the bus floor.
MTA predicts that there will be about 70,000 daily passengers using 14th Street buses under the current
plan. These come from the following three sources:
Ferry passengers
Current M14A and M14D passengers, which will continue
Former L Train passengers
The following are our recommendations for modifying the 14th Street designs in order to ensure that the
buses move at speeds approaching those of the L Train:
Recommendation 2: Extend the 14th Street busway from the Ferry Terminal to 9th Avenue, or
otherwise, at least to Avenue A. The highest bus volumes on 14th Street buses will be between the Ferry
Terminal and Union Square in the morning peak (see "Combined Maximum Load" in Table 1). If 14th
Street is open to mixed traffic between 3rd and 1st Avenues, as is currently planned, buses will get stuck
in traffic. Moreover, high volumes of vehicles will need to turn off of 14th Street before the start of the
busway, creating a significant risk that turning vehicles will block the buses, and causing significant
delays.
After Union Square, the highest volume boarding station on the 14th Street busway in the morning peak
will be at First Avenue (see "Combined Boardings" in Table 1). This station should ideally be situated
The L Train Shutdown: A preliminary assessment of NYC DOT and MTA mitigation measures Page 16
between First Avenue and Avenue A in the westbound direction to avoid forcing transferring passengers
to cross the street. 14th Street also widens significantly east of 1st Avenue. The station should be
between 1st and 2nd Avenue in the eastbound direction for the same reason (i.e., the Brooklyn shuttle
buses will use 2nd Avenue in the southbound direction). As additional road width is needed to provide
passing lanes at this station, the busway is going to already consume a minimum of four lanes. 14th
Street remains two traffic lanes and a parking lane per direction from 1st Avenue to the East River, but
there is a wide service lane that could theoretically be reconfigured.
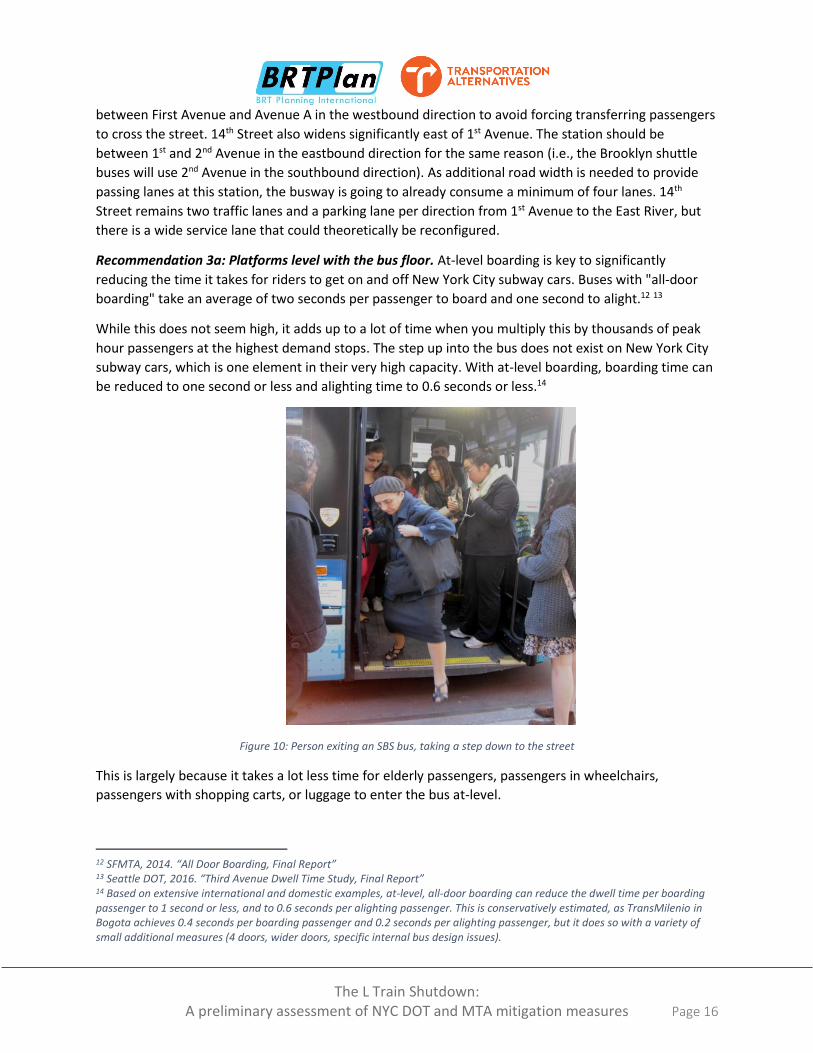
Recommendation 3a: Platforms level with the bus floor. At-level boarding is key to significantly
reducing the time it takes for riders to get on and off New York City subway cars. Buses with "all-door
boarding" take an average of two seconds per passenger to board and one second to alight.12 13
While this does not seem high, it adds up to a lot of time when you multiply this by thousands of peak
hour passengers at the highest demand stops. The step up into the bus does not exist on New York City
subway cars, which is one element in their very high capacity. With at-level boarding, boarding time can
be reduced to one second or less and alighting time to 0.6 seconds or less.14
Figure 10: Person exiting an SBS bus, taking a step down to the street
This is largely because it takes a lot less time for elderly passengers, passengers in wheelchairs,
passengers with shopping carts, or luggage to enter the bus at-level.
12 SFMTA, 2014. “All Door Boarding, Final Report” 13 Seattle DOT, 2016. “Third Avenue Dwell Time Study, Final Report” 14 Based on extensive international and domestic examples, at-level, all-door boarding can reduce the dwell time per boarding passenger to 1 second or less, and to 0.6 seconds per alighting passenger. This is conservatively estimated, as TransMilenio in Bogota achieves 0.4 seconds per boarding passenger and 0.2 seconds per alighting passenger, but it does so with a variety of small additional measures (4 doors, wider doors, specific internal bus design issues).

The L Train Shutdown: A preliminary assessment of NYC DOT and MTA mitigation measures Page 17
This does not even factor in the impact of wheelchair access. Wheelchair boardings were measured and
counted in Seattle. We observed the amount of time caused by each wheelchair ramp deployment on
14th St, and every boarding or alighting wheelchair-bound passenger added approximately two minutes
of extra time.
Figure 11: Seattle measured delay per wheelchair boarding and total wheelchair boardings
NYC DOT should count the number of wheelchair deployments on 14th Street during the peak hour and
time them so that a better estimate can be made of the time wheelchair-bound passengers add to
boarding and alighting time without at-level boarding.
At-level boarding is increasingly widespread in BRT systems in the US. Cleveland, Eugene, San
Bernardino, Hartford/New Britain, Grand Rapids, and Albuquerque have all successfully designed station
platforms at-level with the bus floor.
Figure 12. There are six US BRT systems with at-level boarding
At-level boarding, with such a short timeframe, will require the fabrication of temporary rubber or steel
platforms that can be built remotely and bolted to the roadway rapidly in the same manner as the Citi
BRT Planning International, 2018
14th STREET: Station Design
More US bus systems with at-level boarding

The L Train Shutdown: A preliminary assessment of NYC DOT and MTA mitigation measures Page 18
Bike docking stations and the bus bulbs on the Bedford/Nostrand SBS Corridor (which, incidentally, were
not raised to the level of the bus floor). Portions of the at-level boarding platforms in Grand Rapids,
Michigan were prefabricated.
Figure 13. Example of a bus bulb in Brooklyn that can easily be installed and removed. It could easily be made level with the bus floor.
In the early phases of SBS planning, there were concerns about drainage with platform level boarding.
NYC DOT has since resolved the drainage issue by the design used on 34th Street SBS.
Figure 14. Bus bulb on 34th Street SBS set away from the curb to allow drainage. This platform could have been raised to the level of the bus floor to help wheelchair users.
Recommendation 3b: Set the stations back from the intersections. Placing bus stops close to
intersections seems like a good idea because of the convenience to the cross street where there may be

The L Train Shutdown: A preliminary assessment of NYC DOT and MTA mitigation measures Page 19
other bus routes or subway stations. However, once bus headways drop, the risk of conflict between the
bus stop and the intersection increases significantly. This is why the BRT Standard recommends setting
stations back from intersections by at least 85 feet. 15
In Kunming, China (Figure 15, left), the bus stop is placed just after the intersection. When the traffic
light changes, only three of the six buses waiting will be able to move through the intersection as the
station still contains buses. The remaining three will need to wait at the traffic signal despite the green
light. While they are waiting, the next series of buses will arrive, generating a bus queue.
In Taipei (Figure 15, right), the station is before the intersection. The buses in front have already finished
boarding passengers but they are waiting for the signal to change. The buses behind are not able to
access the station because they cannot reach the bus stop.
Figure 15. Busways in Kunming, China (left) and Taipei, Taiwan (right) saturate due to bus stop being just after (left) or just before (right) traffic light.
Either configuration reduces the capacity of the busway to three buses per signal phase. The problem is
easily solved by setting the station back from the intersection by two bus lengths. Unless NYC DOT sets
its 14th Street stations back from the intersections, major backups, like those in Kunming and Taipei, will
occur.
Estimated Impact of 14th Street Recommendations
In order to estimate the impacts of the above recommendations, we first estimate how many of the
roughly 7,000 peak hour, peak direction passengers will board and alight at each proposed bus stop
(Table 1).
These figures are estimated from boarding and alighting counts on the 14A and 14D and estimated
boarding and alighting percentages on the L Train. We assume that the faster SBS 14th Street Shuttle
would draw away passengers from the 14A and 14D local services, so that only about 2,000 are left, and
15 The BRT Standard, 2016. (New York: ITDP) p. 52. https://3gozaa3xxbpb499ejp30lxc8-wpengine.netdna-ssl.com/wp-content/uploads/2014/07/BRT2016-REV7.75.pdf
Saturated busway in Kunming (left): Stations right after intersection, no setbackSaturated busway in Taipei (right): Stations right before intersection, no setback
BRT Planning International, 2018
14th STREET: Stations Should Be Set Back

The L Train Shutdown: A preliminary assessment of NYC DOT and MTA mitigation measures Page 20
the remaining 5,000 peak hour passengers will be on the SBS 14th Street Shuttle. The MTA should be
able to generate more accurate numbers which would improve the quality of the estimate.
Table 1: Estimated Boarding, Alighting, and Loads, 14th St AM peak
In Table 2, the variable dwell time at each station under the MTA/NYC DOT plan is shown. First, the
boardings for the 14A and 14D from Table 1 are multiplied by 4.6 seconds per boarding passenger based
on empirical counts of the time it took each person to board, in the absence of the need to deploy a
wheelchair lift. The alightings are then multiplied by one second per passenger based on empirical
observation. For the 14th Street SBS service, we do not have locally collected information about how
much time boarding takes per passenger. However, two studies of similar systems in the United States,16 17 conclude that dwell time per passenger for all-door boarding in a three door bus in a dense urban area
is roughly two seconds per boarding passenger and about one second per alighting passenger.
The necessary frequency is derived by dividing the maximum "Load" from the combined services (Table
1) by the bus capacity (assumption is that the buses will be articulated buses with a capacity of 128
passengers). This results in a required frequency of eight per hour for the 14A and 14D and 17 per hour
for the new shuttle bus service, or 25 buses per hour in total on 14th Street.
Each time a bus pulls up to a bus stop it must slow down, and open and close its doors, which takes
about 16 seconds per bus. This is known as fixed dwell time and calculating total fixed dwell time per
station over the course of an hour is a matter of multiplying the total frequency times the fixed dwell
time. The total dwell time is then derived by adding the variable dwell times for the 14A and 14D and
the 14th Street SBS service to the total fixed dwell time.
Next, as it may be the case that all critical stations have more than one sub-stop where a bus can board
and discharge passengers, the total dwell time is divided in two assuming the buses will be divided
equally between the two sub-stops.
Presented next is the total dwell time if all-door-boarding is also introduced onto the 14A and 14D ("All
SBS" in Table 2). To do this, the boarding time per 14A and 14D passenger is reduced from 4.6 to 2.
Finally, the dwell time is calculated in the case that the bus stops are also level with the bus floor ("Level
Boarding" in Table 2). Based on extensive international and domestic examples, 18at-level, all-door-
boarding can reduce the dwell time per boarding passenger to one second or less, and to 0.6 seconds
16 SFMTA, 2014. “All Door Boarding, Final Report” 17 Seattle DOT, 2016. “Third Avenue Dwell Time Study, Final Report” 18 BRT Planning Guide, 4th Edition (2017), Chapter 7.6, Table 7-13: https://brtguide.itdp.org/branch/master/guide/system-speed-and-capacity/optimizing-the-station-to-vehicle-interface
Bus Stop Boarding Alighting Loads Boarding Alighting Loads Boarding Alighting Loads
Ave C, Ferry 1,794 0 1,794 294 0 294 1500 0 1500
Ave B, A 574 0 2,368 574 0 868 0 0 1500
1st Ave 1,691 875 3,184 441 250 1059 1250 625 2125
3rd Ave 482 593 3,073 132 169 1022 350 423 2052
Union Square 1,529 4065 538 279 1161 140 1250 2903 398
6th Ave 826 734 631 176 210 107 650 524 524
8th Ave 103 565 169 103 161 48 0 403 121
10th Ave 0 169 0 0 48 0 0 121
Total 7,000 7,000 - 2000 2000 - 5000 5000 -
14A and 14D 14th St. SBSCombined

The L Train Shutdown: A preliminary assessment of NYC DOT and MTA mitigation measures Page 21
per alighting passenger. This is conservatively estimated, as TransMilenio in Bogota achieves 0.4 seconds
per boarding passenger and 0.2 seconds per alighting passenger, but it does so with a variety of small
additional measures (four doors on buses, wider doors, specific internal bus design issues).
Table 2: Calculation of dwell time, Current Proposal
The result is that with each additional measure accepted into MTA/NYC DOT's plan, the total dwell time
drops at each station. The lower the dwell time, the faster the buses will move and the less likely the
14th Street busway is to saturate.
Next, the degree of station saturation for each planned stop along the 14th Street busway is presented.
To do this, we take the total dwell time per bus stop per hour and divide it by the number of seconds
available per hour (3,600). Due to the irregularity of the arrival of buses, a bus stop is considered to be
at risk at a saturation rate of anything over 0.4.19
Table 3: Estimated bus stop saturation and speeds under different scenarios
The results show that with two sub-stops at each platform and both 14th Street SBS services and 14A and
14D local services operating as planned, the 1st Avenue station is at grave risk of saturation and the
Union Square station is almost certainly going to saturate, meaning that buses will be severely backed
19 BRT Planning Guide, 4th Edition, Chapter 7, Figure 7.5: https://brtguide.itdp.org/branch/master/guide/system-speed-and-capacity/understanding-station-saturation
M14AD 14 SBSAll 14th St
Routes
MTA/DOT
Plan
MTA/DOT Plan +
2 substops
MTA/DOT Plan +
All SBS +
2 substops
MTA/DOT Plan +
All SBS +
2 substops +
Level Boarding
Ave C, Ferry 1,353 3,000 4,353 4,752 2,376 1,994 1,097
Ave B, A 2,638 - 2,638 3,038 1,519 773 487
1st Ave 2,279 3,125 5,404 5,804 2,902 2,328 1,308
3rd Ave 778 1,123 1,902 2,301 1,151 978 619
Union Square 2,447 5,403 7,850 8,249 4,125 3,761 2,184
6th Ave 1,021 1,824 2,846 3,245 1,623 1,393 833
8th Ave 635 403 1,038 1,438 719 585 421
10th Ave 48 121 169 569 284 284 251
Variable Dwell Time Total Dwell Time
Bus Stop
Bus StopMTA/NYCDOT
Plan
MTA/NYCDOT
Plan
2 substops
All SBS
2 substops
All SBS
Level boarding
2 substops
Ave C, Ferry 132% 66% 55% 30%
Ave B, A 84% 42% 21% 14%
1st Ave 161% 81% 65% 36%
3rd Ave 64% 32% 27% 17%
Union Square 229% 115% 104% 61%
6th Ave 90% 45% 39% 23%
8th Ave 40% 20% 16% 12%
10th Ave 16% 8% 8% 7%
Speed (mph) 2 3 6 12

The L Train Shutdown: A preliminary assessment of NYC DOT and MTA mitigation measures Page 22
up there during the peak hour, slowing bus speeds to a crawl. We estimate bus speeds at 3 mph but
they could be lower.20
If the all-door boarding of the SBS service is also introduced onto the 14A and 14D, then 1st Avenue
would still saturate but less so, and Union Square would still badly saturate, but less so. It is possible
that in this case, the SBS speeds achieved elsewhere in New York City (6 mph) could be achieved.
With at level boarding, however, there is very limited risk of station saturation, and a reasonably good
chance that bus speeds could be increased to 12 mph.
Table 4: Comparative observed speeds on other Bus Rapid Transit corridors
Table 5 shows the impact of these same measures on station saturation in the eastbound PM peak. It is
roughly similar to the westbound AM peak except the 8th Avenue stop is at greater risk of saturation.
20 It is difficult to project speeds in a hyper-congested situation as an equilibrium will be reached where people simply give up on using transit. Speeds are estimated in the following way: For ‘Do nothing’, since the corridor would be hyper-saturated, speeds are assumed to reach equilibrium at walking speed. Speeds for the current plan are assumed to be 3 mph, slightly below the current 4.1 mph due to the heavy saturation of the corridor. Speeds with all SBS treatments are estimated based on SBS speeds in other corridors in New York. Speeds in full BRT conditions are estimated from similar BRT systems listed in Table 4.
Corridor Speed (mph) Source
Pittsburgh West Busway Pennsylvania, 34 [ii]
Pittsburgh Martin Luther King, Jr. East Busway 34 [vi]
Pittsburgh South Busway, Pennsylvania, 34 [iii]
Ottawa Transitway, Canada 32 [i]
Orange Line, Los Angeles 20 [v]
Bogotá, Colombia, TransMilenio 17 [vi]
Curitiba, Brazil, Linha Verde 16 [vi]
Beijing (Lines 1, 2, 3, 4) 15 [iv]
Ahmedabad, India, Janmarg 15 [vi]
Guangzhou, China, GBRT 14 [vi]
Las Vegas Metropolitan Area Express (MAX) 14 [vi]
Curitiba, Brazil, RIT corridors 11 [vi]
Cleveland HealthLine 11 [vi]
Mexico City, Mexico, Insurgentes 11 [vi]
Eugene Emerald Express Green Line (EmX) 11 [vi]
Sources:
[vi] "More Development for your transit dollar", 2013 ITDP. https://www.itdp.org/more-development-for-your-transit-
dollar-an-analysis-of-21-north-american-transit-corridors/, derived from interviews with transit authority staff.
[i]Ottawa Ontario BRT Case Study." Transportation Research Board.
http://onlinepubs.trb.org/onlinepubs/tcrp/tcrp90v1_cs/Ottawa.pdf.
[iii] "Pittsburgh, Pensylvania South, East, and West Busways." Transportation Research Board.
http://onlinepubs.trb.org/onlinepubs/tcrp/tcrp90v1_cs/Pittsburgh.pdf
[iv] National BRT Institute. "Perspectives on Bus Rapid Transit (BRT) Developments in China." Presentation. National
BRT Institute. May 1, 2006. http://www.nbrti.org/docs/pdf/Darido_China BRT_051106_presentation.pdf.[v] Flynn, Jennifer, Cheryl Thole, Victoria Perk, Joseph Samus, Caleb Van Nostrand, National Bus Rapid Transit
Institute, and Center for Urban Transportation Research. Metro Orange Line BRT Project Evaluation . Vol.
Comparative Observed Speeds, BRT
[ii] US Department of Transportation. Evaluation of Port Authority of Allegheny County's West Busway Bus
Rapid Transit Project . Washington DC, 2003. Report No. FTA-PA-26-7010-03.1

The L Train Shutdown: A preliminary assessment of NYC DOT and MTA mitigation measures Page 23
Table 5: Estimated bus stop saturation on 14th St, eastbound PM Peak
With these estimated impacts on speed, the impact on travel times is estimated as shown in Table 6.
Table 6: Projected travel times (minutes) from the 1st Avenue L Station under different scenarios
Table 6 indicates that a full BRT option on 14th Street, which requires only modest revisions to NYC
DOT’s current plans, could help to maintain existing L Train travel times on 14th Street. Current 14A and
14D passengers would even experience an improvement in travel time due to the 14A and 14D buses
benefiting from the new treatments.
For trips between Williamsburg and east side of the 14th Street corridor, the new services could not
match the current L Train but it could roughly cut the travel times resulting from NYC DOT / MTA's plan
in half, minimizing the number of passengers who switch to cars with generally positive effects on
overall traffic congestion. For this to be achieved, the Brooklyn-side street designs must also be
implemented and expanded.
Brooklyn Shuttle Bus Street Designs NYC DOT has proposed the following street designs to improve the speed and reliability of the proposed
Brooklyn shuttles:
Grand Street in Brooklyn will be dedicated to buses, bikes, and local deliveries (hours of operation
TBD)
Additional streets will have dedicated bus lanes to accommodate the Brooklyn shuttles:
o Delancey Street (Manhattan)
o Kenmare (Manhattan)
Bus Stop MTA/NYCDOT
Plan
MTA/NYCDOT
Plan
2 substops
All SBS
2 substops
All SBS
Level Boarding
2 substops
10th Ave 23% 12% 8% 7%
8th Ave 179% 89% 69% 37%
6th Ave 148% 74% 60% 34%
Union Square 217% 109% 89% 50%
3rd Ave 18% 9% 9% 8%
1st Ave 138% 69% 55% 31%
Speed (mph) 2 4 6 12
Scenario Union Sq 6th Av 8th Av Bedford Lorimer/G Graham
Current L Train 4 6 7 6 8 10
Current 14A & 14D bus 10 17 24 n.a. n.a. n.a.
Do Nothing 15 25 36 42 41 53
Current Plan 10 17 24 24 40 35
All SBS, Stop at Borinquen 5 8 12 24 29 35
BRT 3 5 7 18 23 28
Travel Times from 1st Avenue and 14th St

The L Train Shutdown: A preliminary assessment of NYC DOT and MTA mitigation measures Page 24
o Allen Street (Manhattan)
The Williamsburg Bridge will be HOV-3 and truck-only, perhaps with HOV-3 on the inner lanes and
bus- and truck-only on the outer two lanes.
Figure 16: Street design measures for Brooklyn shuttle bus routes
Grand Street
Grand Street is a narrow commercial street that currently has one parking lane, one bike lane, and one
through travel lane in each direction. It currently carries extensive truck traffic, both through trips and
local delivery.21
21 Author’s field observations

The L Train Shutdown: A preliminary assessment of NYC DOT and MTA mitigation measures Page 25
Figure 17. Traffic congestion on Grand St, AM peak, is mostly commercial vehicles and TNCs
Today, the main cause of delay is the saturation of the road and turning movements. The bottleneck
tends to dissipate under the Williamsburg Bridge access road. The NYC DOT plan is shown in Figure 18.
Figure 18. The NYC DOT plan for Grand Street is bold and necessary for handling displaced L Train riders
NYC DOT proposes that Grand Street from the Grand Street L Station at Bushwick Avenue to Rodney
Street be open only to buses and trucks. Whether this Grand Street busway will be limited to trucks
making local deliveries or trucks more generally has yet to be defined. We support this bold approach,

The L Train Shutdown: A preliminary assessment of NYC DOT and MTA mitigation measures Page 26
with the caveat that all of the measures proposed for the 14th Street busway should also be applied to
Grand Street, namely the platform-level boarding at stations.
Grand Street widens at Borinquen Place, creating the possibility of adding an additional bus stop for the
Grand Street Shuttles that would better serve displaced L Train passengers from Lorimer Station and
those unable to board at the overcrowded Marcy J/M/Z Station.
Figure 19 shows a cross section we developed to demonstrate how a Borinquen Place station might be
sited.
Figure 19: TA/BRTPlan proposal for a Brooklyn Shuttle Station at Borinquen Place
Designing the bike lane behind the bus stop would significantly reduce conflicts between cyclists and
passengers boarding the bus.
BRT Planning International, 2018
GRAND ST: Borinquen Place
Cross section at BorinquenStation

The L Train Shutdown: A preliminary assessment of NYC DOT and MTA mitigation measures Page 27
Figure 20. Example of bike lane passing behind bus stop, Loop Link BRT, Chicago
Other Brooklyn Streets
The shuttle bus routes that will serve the Bedford L Station are currently scheduled to operate in mixed
traffic on Berry and Roebling. Ideally, bus lanes would also be put on these streets. Roebling is one of
the few wide streets in the area and could handle a bus lane.
Delancey, Kenmare, and Allen Streets
Bus lanes have also been promised on Delancey, Kenmare and Allen Streets. We support this proposal.
For these streets with parallel mixed traffic, an additional measure becomes critical:
Recommendation 4: Restrict turning movements.
The Manhattan side exit of the Williamsburg Bridge backs up for much of the day, not primarily because
of the capacity of the bridge, but because of the capacity of Delancey and Kenmare Streets. At every
intersection, a lane is lost for every turning movement allowed. Vehicles turning right are generally stuck
behind crossing pedestrians, and right turns are allowed with a busway in the right lane, the busway will
be blocked by the turning movements in the same manner the current M15 SBS is blocked at many
intersections. One way to minimize the risk that the Williamsburg Bridge will congest is to disallow right
turning movements along Delancey Street, at least as far as Allen Street. Similarly, turning movements
should be disallowed on Allen and Kenmare Streets.
Williamsburg Bridge HOV
The MTA/NYC DOT plan is to convert the Williamsburg Bridge into HOV-3 and truck-only. The details
have not been released. The Williamsburg Bridge badly congests, in part due to capacity constraints on
Delancey Street as discussed above. We support this plan, though recognize that the Williamsburg
Bridge may saturate anyway due to the heavy volume of light commercial vehicles. The definition of
truck may need to be restricted to trucks of a certain minimum size.

The L Train Shutdown: A preliminary assessment of NYC DOT and MTA mitigation measures Page 28
Fare Collection One of the most important causes of delay on buses is the time it takes for passengers to pay their fares.
SBS has partially solved this problem with the introduction of off-board fare validation and proof-of-
payment inspection. This innovation has significantly reduced per passenger dwell times on SBS services.
Precisely how much this method reduces boarding delay should be further studied by NYC DOT and
MTA, but studies from other systems indicate it reduces delay to about two seconds per boarding
passenger; about a 50% improvement over standard payment methods.22
However, the current proof-of-payment inspection regime has some disadvantages:
1. Inspection Delay: Each time there is an inspection of the M15 SBS route, the bus is stopped
while the inspectors walk through the bus checking ticket vouchers. This causes significant
delay and is particularly problematic on heavy congested routes where inspectors have a
hard time working their way through a crowded bus. It also creates passenger anxiety as
there is always the risk of losing the voucher.
Figure 21. B44 SBS buses backing up during a ticket inspection
2. Inability to integrate other routes: Because proof-of-payment does not have an option to
pay off-board at some stations and on-board at others, it requires fare kiosks to be installed
at all stops along a route. In the case of the 14th Street busway, this means that were
NYCDOT to allow all bus routes to benefit from off-board fare collection, every stop along
the M14A and M14D would need kiosks, which means many stops that go well beyond the
reaches of 14th Street. As a result, it is less costly and administratively complicated to
separate the M14A and M14D from the M14 SBS route. This comes at a very large loss of
time cost, however, as slow boarding on the M14A and D will result in all buses congesting
along 14th Street.
22 SFMTA, 2014, op. cit, Seattle DOT 2016, op cit.

The L Train Shutdown: A preliminary assessment of NYC DOT and MTA mitigation measures Page 29
For these reasons, two alternatives should be considered:
Recommendation 5a: Make all 14th Street bus routes and Brooklyn shuttle routes free
Normally when a subway line is closed for repairs, the route is replaced by a free shuttle bus. The
simplest way to remove passenger boarding delay is to make the service free. This would address the
problem of delay related to ticket inspection, and the administrative burden of installing ticket vending
machines on 14th Street. Normal fare payment could also continue to be required for stations off of 14th
Street on the M14A and D. The same is true for potential heavy delays at the stops on the Brooklyn
shuttle shuttles. Free services will also go part of the way towards compensating displaced passengers
for the inconvenience.
Recommendation 5b: Install pre-paid zones at all stops along 14th Street & the Brooklyn shuttle routes
If the MTA determines that it cannot afford to make all the services free, the other way to address
boarding delay and include the M14A and D is to create pre-paid zones along 14th Street. Like in a
subway station, bus passengers would pay their fares before entering a bus stop via a barrier (anything
from a turnstile to a painted line). This would benefit all bus routes on 14th Street, as the M14A and D
would not require fare kiosks off of 14th Street (passengers could pay on-board off of 14th Street).
Figure 22: Pre-paid zone, Orange Line BRT, Los Angeles
Pre-paid fare zones are much easier for inspectors who can check tickets inside the fare zone, which is
generally less crowded than inside a bus, so it allows the inspection process to occur without stopping
the bus. Given that the proposed L train shuttles will have very few stops, it is not particularly
complicated to deploy inspectors randomly at each stop.
Pre-paid zones can be made of temporary materials, as has been done in Santiago de Chile (Figure 23).
These pre-paid zones are only demarcated with airport tape, and fare validators are placed at a few

The L Train Shutdown: A preliminary assessment of NYC DOT and MTA mitigation measures Page 30
entrances. These facilities need to be manned, which can be expensive for permanent use, but can only
be deployed during the peak hour and removed when not in use.
Figure 23: Temporary pre-paid zones as used in Transantiago, Santiago, Chile, might be a good option
Either option would solve the problems inherent to proof-of-payment fare collection, as found in SBS.
Either option would go a long way in reducing the risk of the 14th Street busway saturating. It is critical,
then, that MTA and NYC DOT work together to determine which of these options is more feasible.
Because Recommendation 5a would be within the purview of MTA and Recommendation 5b the
purview of NYC DOT, both agencies must take responsibility for this critical issue.

The L Train Shutdown: A preliminary assessment of NYC DOT and MTA mitigation measures Page 31
Conclusion Increasing the speeds on L Train replacement services is the key to weathering the L Train shutdown.
With higher speeds, more people will use the bus services, keeping them out of private cars and off the
congested alternative subway platforms. Higher speeds will also reduce the MTA’s operating costs and
the amount of buses they will need in order to provide these alternative services.
Table 7: Variance in speed, trip time, and fleet by scenario23
The MTA/NYC DOT plan already nearly cuts in half the estimated trip time and required fleet over a
standard replacement bus shuttle. If MTA and NYC DOT provide SBS-style improvements for the 14A and
14D services, the trip times and bus fleet required for the 14th Street routes would drop by another 33%,
a significant improvement. If at-level boarding and the other street design measures recommended are
implemented, the fleet required would drop by another 43% and travel time by another nearly 50%.
How many passengers these higher speeds would draw out of private cars and out of the congested
subway system is impossible to tell without modeling, but the benefits would be significant.
Most of the differences between the current MTA/NYC DOT plan and the recommendations included in
this report are not the issues that are the most likely to cause political controversy. The issues that will
be the heaviest political lift are mostly already included in the plan and the two agencies should be
commended and supported for their political courage.
23 Fleet requirements are calculated in the following manner: The maximum loads per service are taken from Table 2. Routes were measured for length, and the full trip cycle time is calculated based on the speed (per scenario), derived as explained above, the distance, and a five minute assumed layover at the terminus. The fleet calculation is the (Maximum Load * Cycle Time) / bus capacity, following the recommended methodology in The BRT Planning Guide, 4th Edition, Chapter 6.4, op. cit.
Estimated
Trip Time
14A & 14D 2 108 31 4 52 16 6 34 11 12 16 6
14th St. SBS 2 57 56 4 26 18 6 17 12 12 7 7
Grand to First Ave & 14th 4 56 44 9 23 13 9 23 13 12 16 10
Bedford to Broadway Lafayette 4 65 41 9 26 12 9 26 12 12 19 9
Grand to Broadway Lafayette 4 52 41 9 21 12 9 21 12 12 15 9
Total Fleet 126 71 60 41
All SBSCurrent Proposal
Estimated
Speed
No Street Improvements
Estimated
Trip Time
Proposed Service Estimated
Speed
Full BRT Scenario
Estimated
Trip Time
Estimated
Speed
Estimated
Fleet
Estimated
Fleet
Estimated
Fleet
Estimated
Speed
Estimated
Fleet
Estimated
Trip Time