the korean economy: resilience amid turbulence15.1% asean 10.4% japan 7.1% others 19.8% central...
TRANSCRIPT

November 17, November 17, 20082008
The Korean Economy: Resilience amid TurbulenceThe Korean Economy: Resilience amid Turbulence
Dr. Il Dr. Il SaKongSaKong
Special Economic Adviser to the PresidentSpecial Economic Advisor to the President
Republic of KoreaRepublic of Korea
November 17, 200November 17, 2008
2
1. Recent Macroeconomic Developments
2. Korea’s External Position & Financial Strengths
3. Government’s Policy Responses
4. Korea : Economic Outlook for 2009 envisioned by Korean Government

3
GDP Growth Trend : Gradual Slowdown
GDP Growth Trend (%)
12.1
10.8
1.6
11.0
4.4
4.9(1.7)
Q2 Q3Q2Q1Q4Q3Q1
8.98.69.016.96.911.411.911.37.3Import
9.712.511.817.09.311.012.111.88.5Export
-0.9-1.2-1.1-0.4-0.13.71.20.10.2Construction Investment
4.90.71.46.52.310.97.67.85.7Facility Investment
1.12.33.44.64.84.14.54.53.6Private Consumption
3.9(0.6)
4.8(0.8)
5.8(0.8)
5.71.6
5.1(1.5)
4.0(1.0)
5.05.14.2GDP Growth(qoq, %)
2008200720062005
44
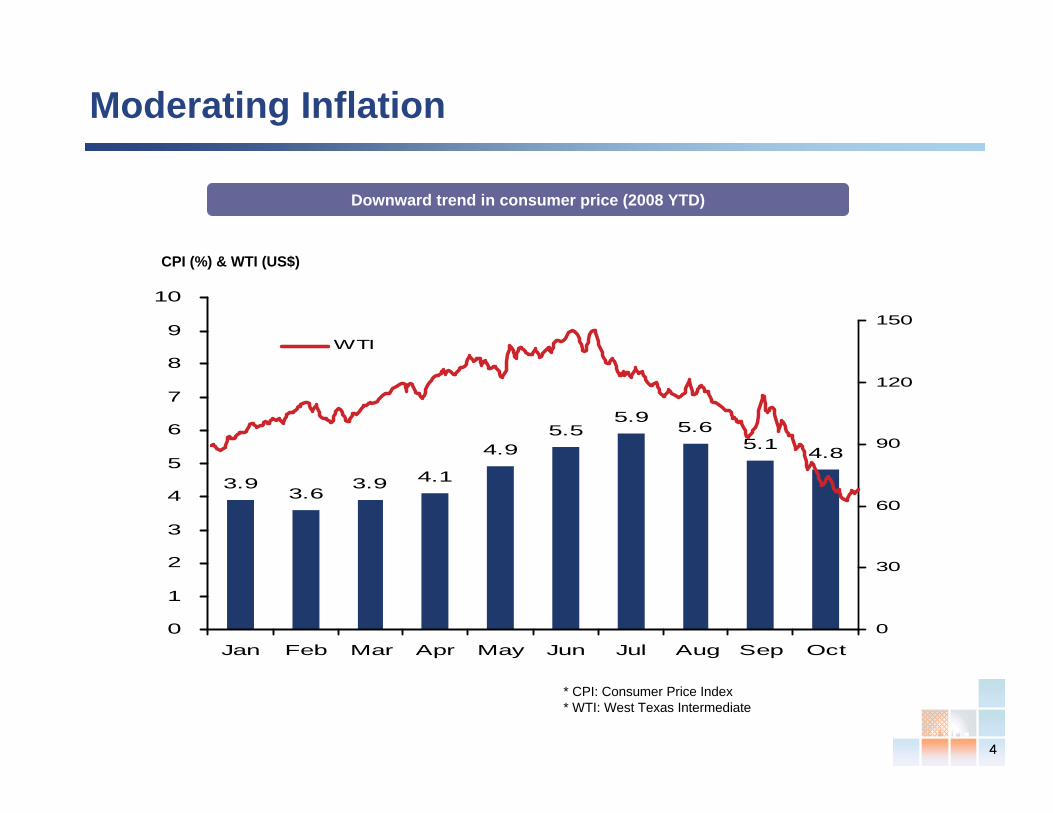
Moderating Inflation
CPI (%) & WTI (US$)
Downward trend in consumer price (2008 YTD)
3.93.6
3.9 4.1
4.95.5
5.95.6
5.1 4.8
0
1
2
3
4
5
6
7
8
9
10
Jan Feb Mar Apr May Jun Jul Aug Sep Oct0
30
60
90
120
150
WTI
* CPI: Consumer Price Index* WTI: West Texas Intermediate

5
Job Market Situation
Unemployment Rate Job Creation Trend
299282
296
210
173
141
295 289264 279
0
50
100
150
200
250
300
350
2005 2006 2007 Q107 Q207 Q307 Q407 Q108 Q208 Q308
3.1%
3.2%
3.4%
3.7%
3.1%3.1%
3.5%
3.2%
3.6%
3.0%
0.0%
1.0%
2.0%
3.0%
4.0%
5.0%
6.0%
2005 2006 2007 Q107 Q207 Q307 Q407 Q108 Q208 Q308
Unemployment Rate (%) New Jobs Created (YoY, ‘000)

6
-0.13
5.0(e)
-5.20
Q1 08 Q2 08 Q3 08 Q4 08 (e,KDI)
2009 (e,KDI)
Trade and Current Account Balance
2008 Current account and Trade balance (US$ bn)
Current account surplus is expected in 4Q08
Robust export growth Diversified export products
Diversified export markets
Source: Bank of Korea
China22.1%
North America13.3%
EU15.1%
ASEAN10.4%
Japan 7.1%
Others19.8%
Central &South America
6.9%
Middle East5.3%
Source: KITA (as of 2007)
Semiconductor11%
Chemicals10%
Automobile10%
Mobile communication
8%
Machinery8%
Others26%
Textile4%
Shipbuilding7%
Home appliance5% Steel 6%
Computer 5%
Exports (US$ bn, YoY Growth, %)
23.0%
Export (USD billion)
36721.3%
37114.1%325
14.4%28411.8%254
30.9%19419.8%162
8.0%0
100
200
300
400
2002 2003 2004 2005 2006 2007 Jan-Oct2008
7
1. Macroeconomic Performance
2. Korea’s External Position & Financial Strengths
3. Government’s Policy Responses
4. Korea : Economic Outlook for 2009 envisioned by Korean Government

8
Foreign Reserves, Bank & Corporate Sector’s Soundness
Asian Financial Crisis (late 1997) 1
Foreign Exchange
Banking Sector
173% 386% 368% 3
US$ 212.3bn 2Foreign Currency Reserves US$ 8.9bn
ST External Debt a / FX Reserves 717%
Current External Debt b / FX reserves 973%
Total External Debt / FX Reserves 1,957%
11.6% 30.7% 3
7.0%
6.0%Bank NPL Ratio
BIS Ratio
1 as of end of 19972 as of October 20083 as of June 2008, Basel I4 as of end of 2007
Corporate Sector404.8% 4106.5% 4
115.0%
424.6%Debt to Equity Ratio
Interest Coverage Ratio
a. Short-Term Debt: Debt with original maturity shorter than 1 year b. Current Debt: Debt with remaining maturity shorter than 1 year
Current

9
Bonds Deposits Others
Korea’s Foreign Reserves
74 96 103 121155
199 210239 262 264 258 239
212
4086
132178224270
1999 2000 2001 2002 2003 2004 2005 2006 2007 Q108 Q2 Q3 Oct
Total foreign exchange reserves
FX reserves (US$ bn)
161169
281286
556996
212
Hong KongSingapore
KoreaTaiwan
IndiaRussiaJapanChina
Largest global reserve holders (October 2008)
1 Includes Hong Kong (AA+), Slovenia (AA), Portugal (AA-), Italy (A+), Chile (A+), Czech Republic (A) and Estonia (A). Credit ratings by S&P. Source: IMF.
Median of peers1: US$ 29.2bn
FX reserves (US$ bn)
Source: Bank of Korea
Are Korea’s FX reserves liquid enough?
Deposit19.3
(9.1%)
Total reserves (US$ bn)
Bonds mostly rated AA or above
192.5(90.7%)
1,906 Others 0.5 (0.2%)
1 Primarily due to government’s provision of FX reservesto banking sector
1

10
Korea’s External Debt Total External Debt and Short-term Debt
419.8
175.7
222.3
0
50
100
150
200
250
300
350
400
450
Total Debt Current debt Short term debt
(86.1% of Reserves)
* Short-term debt: Debt with original maturity shorter than 1 year * Current debt: Debt with remaining maturity shorter than 1 year
(68.1% of Reserves)
(US$ bn)
(39% of GDP)
Hedges forshipbuilders'export andoverseasfinancialinvestment (22%)
Cash Advances forShipbuiling Contracts (12%)
Hea
Proportion of total debt without default risk
No default risk(34%)
External debt structure (US$ bn)
External debt owed by banks (US$ bn)
127.4( 61%)
83.1(39%)
Domestic banks
Foreign bank branches

1111
Soundness of Banking Sector
Moderate Loan-to-Deposit Ratio
Moderating Loan Growth Low Delinquency Ratio
4.2
2.92
1.11.6 1.8
5.04.2
Q4 07 Q1 08 Q2 08 Q3 08
SME Leding HH Lending
Loan Growth (%)
128.2%124.2%126.5%123.7% 126.8%
103.2%104.6%105.4%104.2%104.2%
2007 Jun-08 Jul-08 Aug-08 Sep-08
꺾은선형 1 Deposits including CDs
Loan-to-Deposit Ratio (%)
Delinquency Ratio (%)
Source: Financial Supervisory Services
1.0%
1.4% 1.5%
1.1%
1.5%1.5%
0.7% 0.6%0.7%0.6%0.5%0.5%
0.0%
0.5%
1.0%
1.5%
2.0%
2007 May-08 Jun-08 Jul-08 Aug-08 Sep-08
SME Lending HH Lending
Sufficient Room to Withstand Default Risks
Absorptive Capacity for the impact of default risk
─ Coverage ratio is approximately 186%
─ LTV ratio is approximately 47%
Well-diversified lending
─ Manufacturing (35.2%), Real estate (17.1%), Wholesale and Retail (14.3%), Construction (9.7%)
Stringent risk management system implemented after Asian Financial Crisis

1212
Household Debt and Real Estate Bubble?
Household Financial Debt to Financial Asset Ratio (%)
Household Debt to GDP Ratio (%)
83
67
99100
0
20
40
60
80
100
120
Korea(08 June) U.S.(07 Mar) U.K.(07 Mar) Japan(07 Mar)
45
23
3532
0
20
40
Korea (Jun 08) U.S. (Dec 07) U.K. (Dec 07) Japan (Dec 07)
Real Estate to HH Asset Ratio (%)77
4246
34
0
20
40
60
80
Korea (Jun 08)) U.S. (Dec 05) U.K. (Dec 05) Japan (Dec 05)

1313
Improving loan to value ratio Stricter regulation on mortgage than other countries
Source: Bank of Korea Financial Stability Report, April 20081 Financial Surplus = Financial Asset Increase - Financial Liability Increase.2 Financial assets and liabilities exclude trade credits and other miscellaneous non-interest-bearing financial assets and debts.
LTV ratio (%)
60%
60-70%
Direct
37.3%
Hong Kong
-
60%(Portion)
Mixed
52.4%
Germany
--40%DTI Limit
Korea U.S. Japan
Mortgage/ GDP 33.4% 72.3% 36.2%
Regulation System Direct Indirect Indirect
LTV Limit 40-60% - Indirect
47.9
49.5
52.2
47.547
44
48
52
56
2005 2006 2007 1Q08 2Q08
Household Debt and Real Estate Bubble (II)

14
Why then Some Negative Perceptions?
(a) High trade dependency (Export / Import as % of GDP, as of 2007)Korea (38.7 / 37.2), US (8.4 / 14.6), Japan (16.3 / 14.2), China (37.5 / 29.4), UK (15.9 / 22.5), Germany (41.1 / 33.0), Spore (185.5 / 163.2), HK (166.4 / 177.7)
(b) Open capital market- Foreign investors’ share in Korea’s KOSPI: 42% (2004) → 29% (Nov 2008)cp) US (11.3%, Jun 07), Taiwan (30.9%, Oct 08), France (38.2%, Sep 07),
Mexico (35.5%, Jun 08), UK (40.0%, end 06), OECD average (25%)
(1) Korea’s high openness
- The 1997-98 currency crisis and impact on investors’ psychology
(2) Psychological
factors
Two Main Reasons
Performance of KOSPI (2008 YTD)
1,124
900
1,100
1,300
1,500
1,700
1,900
Jan Feb Mar Apr May Jun Jul Aug Sep Oct Nov
Clo
sing
Pric
e (K
RW
)
KOSPI

15
1. Macroeconomic Performance
2. Korea’s External Position & Financial Strengths
3. Government’s Policy Responses
4. Korea : Economic Outlook for 2009 envisioned by Korean Government
16
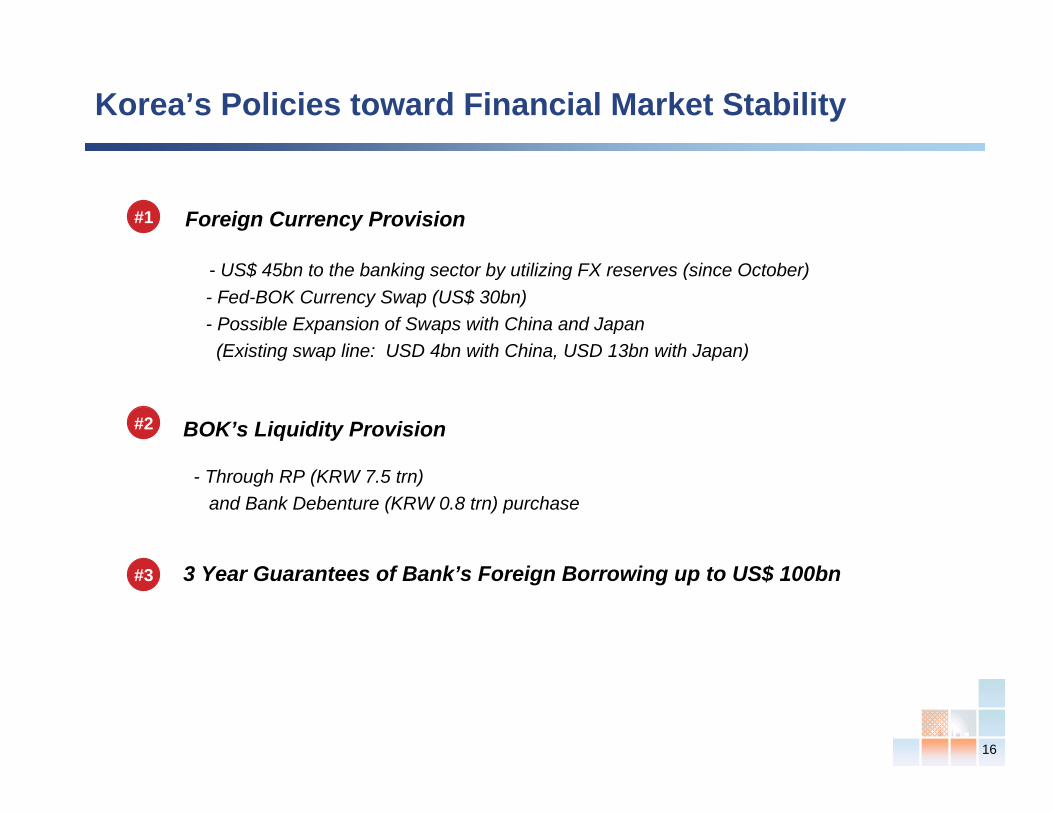
Korea’s Policies toward Financial Market Stability
Foreign Currency Provision
- US$ 45bn to the banking sector by utilizing FX reserves (since October)- Fed-BOK Currency Swap (US$ 30bn) - Possible Expansion of Swaps with China and Japan
(Existing swap line: USD 4bn with China, USD 13bn with Japan)
BOK’s Liquidity Provision
- Through RP (KRW 7.5 trn)and Bank Debenture (KRW 0.8 trn) purchase
3 Year Guarantees of Bank’s Foreign Borrowing up to US$ 100bn
#1
#2
#3
17
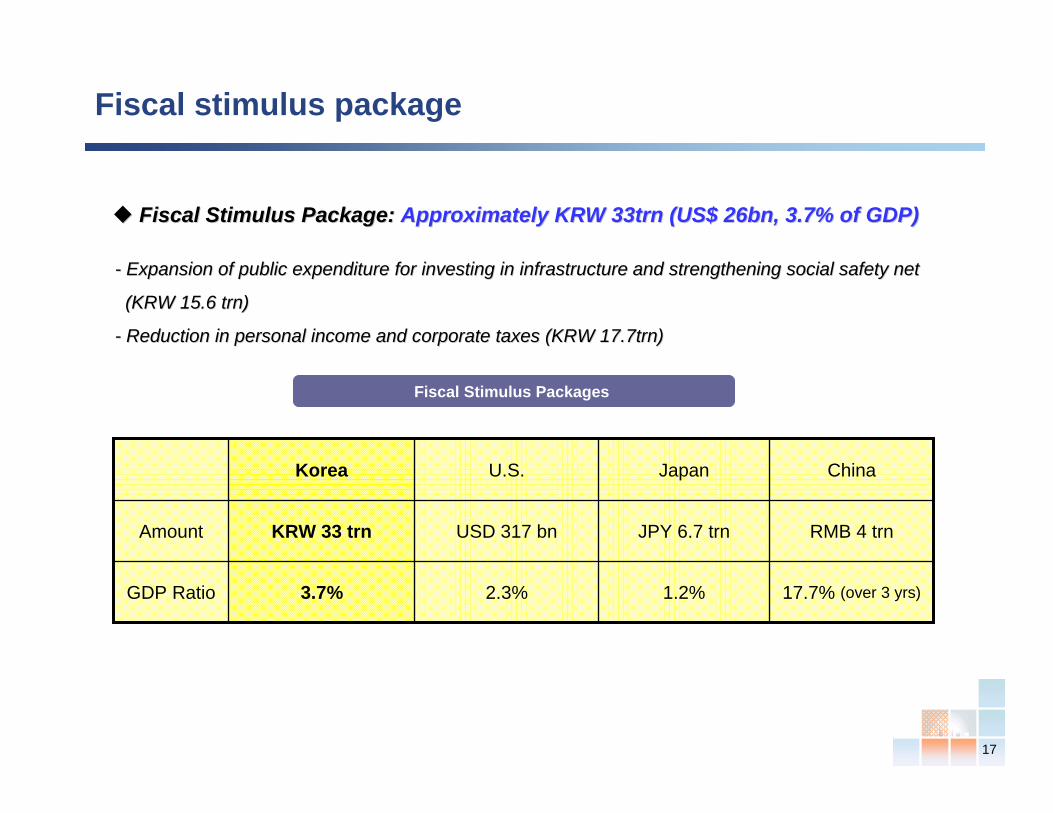
Fiscal Stimulus Package: Fiscal Stimulus Package: Approximately KRW 33trn (US$ 26bn, 3.7% of GDP)Approximately KRW 33trn (US$ 26bn, 3.7% of GDP)
-- Expansion of public expenditure for investing in infrastructureExpansion of public expenditure for investing in infrastructure and strengthening social safety net and strengthening social safety net
(KRW 15.6 (KRW 15.6 trntrn))
-- Reduction in personal income and corporate taxes (KRW 17.7trn)Reduction in personal income and corporate taxes (KRW 17.7trn)
Fiscal stimulus package
1.2%
JPY 6.7 trn
Japan
17.7% (over 3 yrs)2.3%3.7%GDP Ratio
RMB 4 trnUSD 317 bnKRW 33 trnAmount
ChinaU.S.Korea
Fiscal Stimulus Packages

1818
Korea’s Strong Fiscal Strength enabling Further Stimulus
Relatively Low Debt LevelTrend of Korea’s fiscal balance
1.2%
3.3%
1.0% 0.7% 0.4% 0.4%
3.8%
2.1%
1.1%
0%
1%
2%
3%
4%
2000 2001 2002 2003 2004 2005 2006 2007 2Q08
Source: Ministry of Strategy and Finance
Comparison with other countries
-0.4-1.3
-0.5 -0.3
-2.5
-0.7
-2.9
-0.4
-2
2.1
(4)
(2)
0
2
4
Korea (A
)AA m
edian
A med
ian
Hong K
ong (AA+)
Slovenia
(AA)
Portugal
(AA-)
Taiwan
(AA-)
Italy
(A+)
China (A+)
Iceland
(A)
Source: S&P Sovereign Risk Indicator, July 2008
180.0%
33.0%
62.0%
72.0%66.0%
0%
20%
40%
60%
80%
100%
120%
140%
160%
180%
200%
Korea US Japan Germany France
OECD Average: 77%
Fiscal surplus (% of GDP)
Consolidated fiscal balance (% of GDP) Government debt to GDP (%)
Source: OECD and IMF
19
0.0
0.5
1.0
1.5
2.0
2.5
3.0
3.5
4.0
4.5
5.0
5.5
6.0
Jan/07 Aug/07 Mar/08 Oct/08
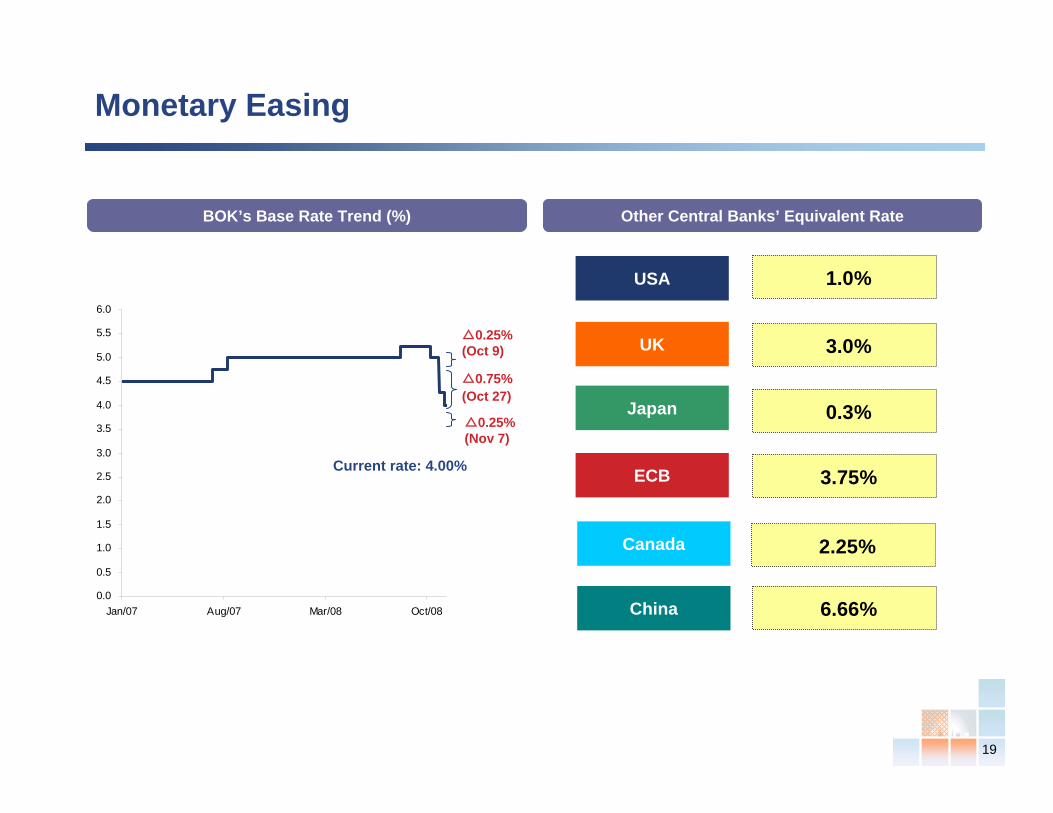
Monetary Easing
Current rate: 4.00%
△0.25%(Nov 7)
BOK’s Base Rate Trend (%) Other Central Banks’ Equivalent Rate
△0.75%(Oct 27)
△0.25%(Oct 9)
USA
Japan
UK
Canada
ECB
China
1%1.0%
1%3.0%
1%0.3%
1%3.75%
1%2.25%
1%6.66%
20
1. Recent Macroeconomic Developments
2. Current Issues & Answers
3. Government’s Policy Responses
4. Korea : Economic Outlook for 2009 envisioned by Korean Government

21
4. Korea: Economic Outlook for 2009 envisioned by Korean Government
Around 1%p
•Continued deregulations
•Enhancement of labor market flexibility
70,000 ~ 80,000
Around 3% 120,000 ~ 130,000Original Forecast
Policy Effect
0.3%p● Tax cut (2009 : KRW 10.3tn)
+α● Deregulation & monetary easing
0.5%p
0.4%p0.03%p0.1%p
● Additional Fiscal Measures (Nov. 3)
- Expenditure (KRW 11 tn) - Tax cut (09: KRW 0.9 tn) - Front-loading of Expenditure
0.2%p● Tax credit (KRW4.4 tn)
● Supplementary budget (KRW 4.6 tn)
Around 4% 190,000 ~ 210,000
GDP Growth Job Creation
After Stimulus

22
Thank You