the kinematic standard deviation index
TRANSCRIPT
Introduction
Purpose
Methods
Acknowledgements & References
To examine sensitivity of the KSDI and compare it to the GDI, a consecutive dataset of 51 ambulatory patients (102 limbs) with diplegic cerebral palsy having undergone multi-level lower extremity surgery, with pre-op, 1-year post-op, and long-term (LT) follow-up studies was compiled from our institution.
At pre-op, 3 were rated as GMFCS I, 23 were GMFCS II, and 25 were GMFCS III. Both the KSDI and GDI were calculated using our MAL’s benchmark data of 30 TD children. Mean and SD values are shown in Table 1. Differences in the GMFCS levels were also compared, as shown in Table 2.
The purpose of this project was to develop a gait index that was intuitively understandable and useful for clinical and research applications.
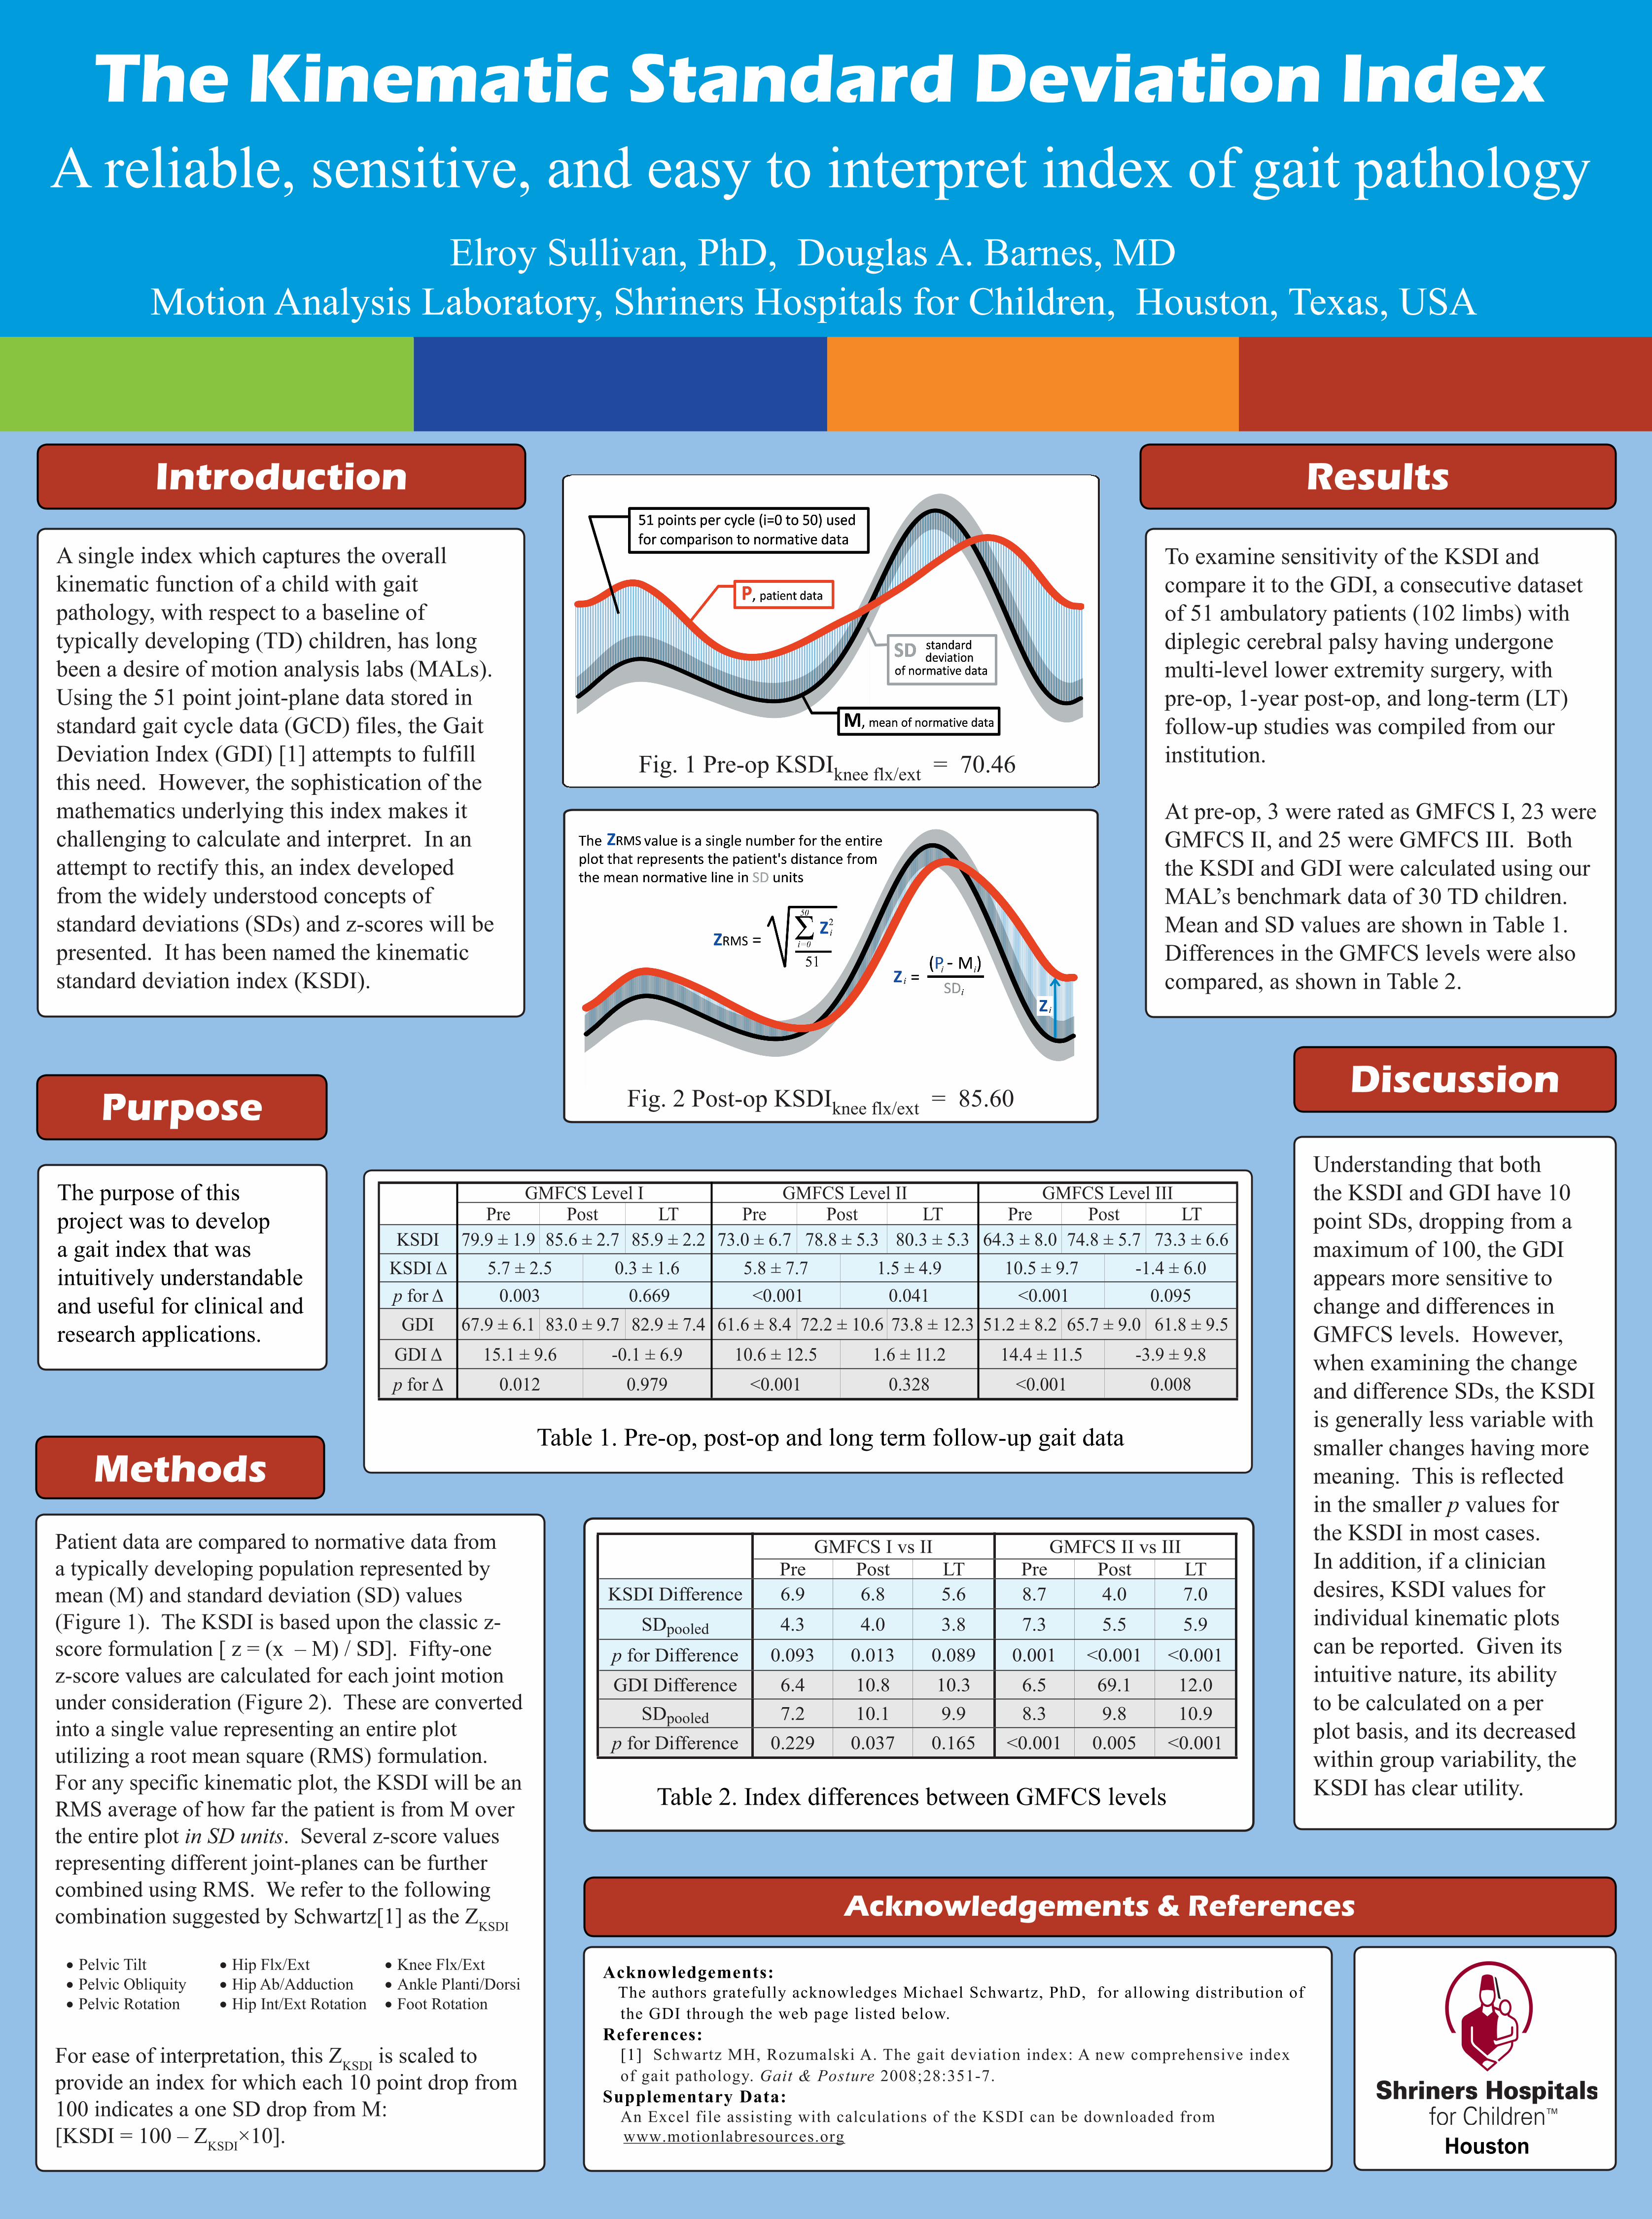
Patient data are compared to normative data from a typically developing population represented by mean (M) and standard deviation (SD) values (Figure 1). The KSDI is based upon the classic z-score formulation [ z = (x – M) / SD]. Fifty-one z-score values are calculated for each joint motion under consideration (Figure 2). These are converted into a single value representing an entire plot utilizing a root mean square (RMS) formulation. For any specific kinematic plot, the KSDI will be an RMS average of how far the patient is from M over the entire plot in SD units. Several z-score values representing different joint-planes can be further combined using RMS. We refer to the following combination suggested by Schwartz[1] as the ZKSDI
• Pelvic Tilt • Hip Flx/Ext • Knee Flx/Ext• Pelvic Obliquity • Hip Ab/Adduction • Ankle Planti/Dorsi• Pelvic Rotation • Hip Int/Ext Rotation • Foot Rotation
For ease of interpretation, this ZKSDI is scaled to provide an index for which each 10 point drop from 100 indicates a one SD drop from M:[KSDI = 100 – ZKSDI×10].
Understanding that both the KSDI and GDI have 10 point SDs, dropping from a maximum of 100, the GDI appears more sensitive to change and differences in GMFCS levels. However, when examining the change and difference SDs, the KSDI is generally less variable with smaller changes having more meaning. This is reflected in the smaller p values for the KSDI in most cases. In addition, if a clinician desires, KSDI values for individual kinematic plots can be reported. Given its intuitive nature, its ability to be calculated on a per plot basis, and its decreased within group variability, the KSDI has clear utility.
The Kinematic Standard Deviation Index A reliable, sensitive, and easy to interpret index of gait pathology
Elroy Sullivan, PhD, Douglas A. Barnes, MDMotion Analysis Laboratory, Shriners Hospitals for Children, Houston, Texas, USA
A single index which captures the overall kinematic function of a child with gait pathology, with respect to a baseline of typically developing (TD) children, has long been a desire of motion analysis labs (MALs). Using the 51 point joint-plane data stored in standard gait cycle data (GCD) files, the Gait Deviation Index (GDI) [1] attempts to fulfill this need. However, the sophistication of the mathematics underlying this index makes it challenging to calculate and interpret. In an attempt to rectify this, an index developed from the widely understood concepts of standard deviations (SDs) and z-scores will be presented. It has been named the kinematic standard deviation index (KSDI).
Discussion
Results
Acknowledgements: The authors gratefully acknowledges Michael Schwartz, PhD, for allowing distribution of
the GDI through the web page listed below.References: [1] Schwartz MH, Rozumalski A. The gait deviation index: A new comprehensive index
of gait pathology. Gait & Posture 2008;28:351-7.Supplementary Data: An Excel file assisting with calculations of the KSDI can be downloaded from www.motionlabresources.org
Table 1. Pre-op, post-op and long term follow-up gait data
GMFCS I vs II GMFCS II vs IIIPre Post LT Pre Post LT
KSDI Difference 6.9 6.8 5.6 8.7 4.0 7.0SDpooled 4.3 4.0 3.8 7.3 5.5 5.9
p for Difference 0.093 0.013 0.089 0.001 <0.001 <0.001GDI Difference 6.4 10.8 10.3 6.5 69.1 12.0
SDpooled 7.2 10.1 9.9 8.3 9.8 10.9p for Difference 0.229 0.037 0.165 <0.001 0.005 <0.001
Table 2. Index differences between GMFCS levels
Houston
Fig. 1 Pre-op KSDIknee flx/ext = 70.46
Fig. 2 Post-op KSDIknee flx/ext = 85.60
GMFCS Level I GMFCS Level II GMFCS Level IIIPre Post LT Pre Post LT Pre Post LT
KSDI 79.9 ± 1.9 85.6 ± 2.7 85.9 ± 2.2 73.0 ± 6.7 78.8 ± 5.3 80.3 ± 5.3 64.3 ± 8.0 74.8 ± 5.7 73.3 ± 6.6KSDI Δ 5.7 ± 2.5 0.3 ± 1.6 5.8 ± 7.7 1.5 ± 4.9 10.5 ± 9.7 -1.4 ± 6.0p for Δ 0.003 0.669 <0.001 0.041 <0.001 0.095GDI 67.9 ± 6.1 83.0 ± 9.7 82.9 ± 7.4 61.6 ± 8.4 72.2 ± 10.6 73.8 ± 12.3 51.2 ± 8.2 65.7 ± 9.0 61.8 ± 9.5
GDI Δ 15.1 ± 9.6 -0.1 ± 6.9 10.6 ± 12.5 1.6 ± 11.2 14.4 ± 11.5 -3.9 ± 9.8p for Δ 0.012 0.979 <0.001 0.328 <0.001 0.008