the j.p. morgan covered bond handbook 2011 - wikileaks · europecredit research 12 september 2011...
TRANSCRIPT

www.morganmarkets.com
EuropeCredit Research12 September 2011
The J.P. Morgan Covered Bond Handbook 2011Taking the strain
European ABS & CB Research
Gareth Davies, CFA AC
(44-20) 7325-7283
Flavio Marco Rusconi AC
(44-20) 7777-4461
J.P. Morgan Securities Ltd.
See page 302 for analyst certification and important disclosures.J.P. Morgan does and seeks to do business with companies covered in its research reports. As a result, investors should be aware that the firm may have a conflict of interest that could affect the objectivity of this report. Investors should consider this report as only a single factor in making their investment decision.
We write this year’s Handbook from something of a position of strength for the industry. Over the course of the past twelve months we have seen product expansion across many metrics: from the number of jurisdictions providing a stable regulatory framework for covered bond issuance; to the number of originators relying on covered bonds as part of their funding mix; and of course to the number of investors, both credit- and rates-focused who now engage with the asset class.
This is an even greater achievement when considering the broad market themes that have characterised the past twelve months. With the continuing peripheral European sovereign crisis elevating concerns about the health of the region’s banks, and further exacerbated by what is proving to be a relatively weak economic recovery (at best), the appetite for adding bank debt (even when secured) has been tested severely. Covereds as an asset class appear to have passed this test.
That being said however, we remain aware of potential roadbumps in the medium-term outlook. We identify the developing regulatory regime as the primary protagonist – we believe the regulatory backdrop is potentially becoming skewed in favour of covered bonds to such a degree, that it is damaging the diversity of alternate bank funding opportunities, and by derivation, potentially harming the ability of today’s covered product to grow at a more measured and sustainable pace. We would welcome a more balanced environment where covereds play a role in bank funding, but not the role.
As usual, we split the Handbook into two discrete sections, first providing an overview of market and product themes, followed by the larger, second segment which provides a jurisdiction-by-jurisdiction, issuer-by-issuer overview of those institutions that have accessed the international capital markets.
Hard copies of this publication are available by contacting the analysts.

2
Europe Credit Research12 September 2011
Gareth Davies, CFA(44-20) [email protected]
Flavio Marco Rusconi(44-20) [email protected]
Foreword
What a difference a year makes! At the time of publication of our last Handbook in September 2010, we wrote something of a ‘love letter’ to credit investors; suggesting they increase their engagement with an asset class that had historically been outside their traditional investment criteria. The onslaught of the European sovereign crisis augmented our investment rationale, with pricing pushing a number of covered sub-segments to levels where value could also be identified from a credit perspective. In last year’s publication, we welcomed the opportunity that both regulatory support and pricing linked more closely to alternative bank funding instruments in a number of jurisdictions had brought to the market.
We therefore write this year’s Handbook from something of a position of strength for the industry. Over the course of the past twelve months we have seen product expansion across many metrics: from the number of jurisdictions providing a stable regulatory framework for covered bond issuance; to the number of originators relying on covered bonds as part of their funding mix; and of course to the number of investors, both credit- and rates-focused who now engage with the asset class.
This is an even greater achievement when considering the broad market themes that have characterised the past twelve months. With the continuing peripheral European sovereign crisis elevating concerns about the health of the region’s banks, and further exacerbated by what is proving to be a relatively weak economic recovery (at best), the appetite for adding bank debt (even when secured) has been tested severely. Covereds as an asset class appear to have passed this test.
That being said however, we remain aware of potential roadbumps in the medium-term outlook (as credit analysts the glass is always half empty). While analysts responsible for other products may envy the relative health of the covered bond markets, our caution stems from what we see as the potential for over-reliance on the asset class.
In this, we identify the developing regulatory regime as the primary protagonist–we believe the regulatory backdrop is potentially becoming skewed in favour of covered bonds to such a degree, that it is damaging the diversity of alternate bank funding opportunities, and by derivation, potentially harming the ability of today’s covered product to grow at a more measured and sustainable pace. Looking ahead to the next twelve months, we would welcome a more balanced environment where covereds play a role in bank funding, but not the role.
Document structureAs usual, we split the Handbook into two discrete sections, first providing an overview of market and product themes, followed by the larger, second segment which provides a jurisdiction-by-jurisdiction, issuer-by-issuer overview of those institutions that have accessed the international capital markets.
We hope this Handbook proves useful for investors over the course of the next twelve months, and of course welcome any feedback on its form and content.
Credit where credit is due
The last year has demonstrated the increasing appeal of covered
bonds on a global basis…
…despite substantial headwinds
Can one have too much of a good thing? Yes…
Lots of eggs. Lots of baskets. Please!

3
Europe Credit Research12 September 2011
Gareth Davies, CFA(44-20) [email protected]
Flavio Marco Rusconi(44-20) [email protected]
Table of ContentsForeword ...................................................................................2
Primary Market Outlook ...........................................................9
The last twelve months–‘the boy done good' ............................................................9
The next twelve months–Magic 8 ball time............................................................14
Secondary Market Outlook ....................................................15
The last twelve months–Vow to thee, my country ..................................................15
The next twelve months–More of the same ............................................................17
Our covered bond recommendations...................................18
Product overview....................................................................20
Covered Bonds: a “bluffer’s guide” .......................................................................20
What exactly is a covered bond?............................................................................21
Covered bonds vs. RMBS......................................................................................23
Rating Agencies .....................................................................25
DBRS ...................................................................................................................25
Fitch Ratings.........................................................................................................25
Moody’s ...............................................................................................................28
Standard & Poor’s.................................................................................................29
Austrian Covered Bonds .......................................................36
Legislative snapshot ..............................................................................................36
Austrian covered bond & macro backdrop .............................................................37
BAWAG PSK.......................................................................................................38
Erste Bank Group..................................................................................................39
HYPO NOE Gruppe..............................................................................................40
Kommunalkredit Austria AG.................................................................................41
UniCredit Bank Austria.........................................................................................42
Canadian Covered Bonds......................................................44
Legislative snapshot ..............................................................................................44
Canadian covered bond & macro backdrop ............................................................45
Bank of Montreal ..................................................................................................46
Caisse Centrale Desjardins du Quebec ...................................................................48
CIBC ....................................................................................................................50
National Bank of Canada.......................................................................................52
Royal Bank of Canada...........................................................................................53
Scotiabank ............................................................................................................55
Toronto Dominion Bank........................................................................................57
Danish Covered Bonds ..........................................................60
Legislative snapshot ..............................................................................................60
Danish covered bond & macro backdrop................................................................61
BRF Kredit AS......................................................................................................62
Danske Bank AS...................................................................................................63
DLR Kredit AS.....................................................................................................65

4
Europe Credit Research12 September 2011
Gareth Davies, CFA(44-20) [email protected]
Flavio Marco Rusconi(44-20) [email protected]
Nordea Kredit AS..................................................................................................66
Nykredit Realkredit AS (‘Nykredit’)......................................................................67
Realkredit Danmark AS (‘Realkredit’)...................................................................68
Dutch Covered Bonds............................................................70
Legislative snapshot ..............................................................................................70
Dutch covered bond & macro backdrop .................................................................71
ABN Amro Bank NV (‘ABN’)..............................................................................72
Achmea Hypotheekenbank NV ('Achmea’)............................................................73
ING Bank NV (‘ING’) ..........................................................................................74
NIBC Bank NV (‘NIBC’)......................................................................................75
SNS Bank NV (‘SNS’)..........................................................................................77
Finnish Covered Bonds .........................................................80
Legislative snapshot ..............................................................................................80
Finnish covered bond & macro backdrop...............................................................81
Aktia Real Estate Mortgage Bank plc ....................................................................82
Nordea Bank Finland Oyj......................................................................................83
OP Mortgage Bank (‘OP’).....................................................................................84
Sampo Housing Loan Bank ...................................................................................85
French Covered Bonds ..........................................................88
Legislative snapshot ..............................................................................................88
French covered bond & macro backdrop................................................................92
AXA Bank Europe SCF ........................................................................................93
Banques Populaires SCF .......................................................................................94
BNP Paribas Home Loan SFH...............................................................................95
BNP Paribas Public Sector SCF.............................................................................96
BPCE SFH............................................................................................................97
Caisse de Refinancement de l’Habitat....................................................................98
CIF Euromortgage SCF.........................................................................................99
Compagnie de Financement Foncier SCF ............................................................100
Crédit Agricole Home Loans SFH .......................................................................101
Crédit Mutuel Arkéa Home Loans SFH ...............................................................102
Crédit Mutuel-CIC Home Loans SFH..................................................................103
Dexia Municipal Agency SCF .............................................................................104
General Electric SCF...........................................................................................105
Groupe Caisse d’Épargne Covered Bonds............................................................106
HSBC France Covered Bonds..............................................................................107
Société Générale SCF..........................................................................................108
Société Générale SFH .........................................................................................109
German Covered Bonds ......................................................112
Legislative snapshot ............................................................................................112
German covered bond & macro backdrop ............................................................113
Aareal Bank AG..................................................................................................114
Bayerische Landesbank (BayernLB)....................................................................116
Berlin-Hannoversche Hypothekenbank................................................................118
Bremer Landesbank ............................................................................................119

5
Europe Credit Research12 September 2011
Gareth Davies, CFA(44-20) [email protected]
Flavio Marco Rusconi(44-20) [email protected]
Corealcredit Bank AG.........................................................................................121
DekaBank Deutsche Girozentrale ........................................................................122
Deutsche Apotheker und Aertzebank...................................................................123
Deutsche Bank ....................................................................................................124
Deutsche Genossenshafts-Hypothekenbank (DG Hyp) .........................................125
Deutsche Hypo Hannover (Deutsche Hypothekenbank) .......................................126
Deutsche Postbank ..............................................................................................127
Deutsche Schiffsbank..........................................................................................128
Dexia Kommunalbank Deutschland.....................................................................129
Duesseldorfer Hypothekenbank...........................................................................130
Eurohypo ............................................................................................................131
HSH Nordbank ...................................................................................................133
ING DiBa ...........................................................................................................135
Landesbank Baden Württemberg (LBBW)...........................................................136
Landesbank Berlin ..............................................................................................137
Landesbank Hessen-Thueringen ..........................................................................139
Landesbank Saar .................................................................................................140
Muenchener Hypothekenbank .............................................................................141
Norddeutsche Landesbank...................................................................................142
pbb (Deutsche Pfandbriefbank)............................................................................144
SEB AG..............................................................................................................146
Unicredit Bank AG (HypoVereinsbank) ..............................................................147
Westdeutsche Immobilienbank ............................................................................148
WestLB ..............................................................................................................149
WL Bank ............................................................................................................150
Greek Covered Bonds..........................................................152
Legislative snapshot ............................................................................................152
Greek macro backdrop ........................................................................................153
National Bank of Greece .....................................................................................154
Hungarian Covered Bonds ..................................................156
Legislative snapshot ............................................................................................156
Hungarian covered bond & macro backdrop ........................................................157
FHB Bank...........................................................................................................158
OTP Bank...........................................................................................................159
Irish Covered Bonds ............................................................162
Legislative snapshot ............................................................................................162
Irish covered bond & macro backdrop .................................................................163
AIB Mortgage Bank (‘AIBMB’)..........................................................................164
Bank of Ireland Mortgage Bank (‘BoIMB’) .........................................................165
Depfa ACS Bank (‘DACS’) ................................................................................166
EBS Mortgage Finance (‘EBS’)...........................................................................167
Italian Covered Bonds..........................................................170
Legislative snapshot ............................................................................................170
Italian covered bond & macro backdrop...............................................................171

6
Europe Credit Research12 September 2011
Gareth Davies, CFA(44-20) [email protected]
Flavio Marco Rusconi(44-20) [email protected]
Banca Carige (‘Carige’) ......................................................................................172
Banca Monte dei Paschi di Siena (‘BMPS’) .........................................................173
Banca Popolare di Milano (‘BPM’) .....................................................................174
Banco Popolare (‘Popolare’)................................................................................175
Credito Emiliano (‘Credem’)...............................................................................176
Intesa Sanpaolo (‘Intesa’) ....................................................................................177
UBI Banca (‘UBI’)..............................................................................................179
Unicredit Group (‘Unicredit’)..............................................................................180
Korean Covered Bonds........................................................182
Legislative snapshot ............................................................................................182
Korean covered bond & macro backdrop .............................................................183
Kookmin Bank....................................................................................................184
Korea Housing Finance Corporation....................................................................185
Luxembourgish Covered Bonds .........................................188
Legislative snapshot ............................................................................................188
Luxembourgish covered bond backdrop...............................................................189
Dexia LdG Banque..............................................................................................190
Erste Europaeische Pfandbrief und Kommunalbank (EEPK) ................................191
Eurohypo Luxembourg SA..................................................................................192
Nord/LB Covered Finance Bank SA....................................................................194
New Zealand Covered Bonds ..............................................196
Legislative snapshot ............................................................................................196
New Zealand covered bond & macro backdrop ....................................................197
Bank of New Zealand..........................................................................................198
Westpac New Zealand.........................................................................................199
Norwegian Covered Bonds..................................................202
Legislative snapshot ............................................................................................202
Norwegian covered bond & macro backdrop .......................................................203
DnB NOR Boligkreditt ASA (‘DNB’) .................................................................204
Nordea Eiendomskreditt ......................................................................................205
SpareBank 1 Boligkreditt ASA............................................................................206
Sparebanken Vest Boligkreditt AS.......................................................................207
Terra Boligkreditt AS..........................................................................................208
Portuguese Covered Bonds ................................................210
Legislative snapshot ............................................................................................210
Portuguese covered bond & macro backdrop .......................................................211
Banco Comercial Portugues (‘Millennium bcp’) ..................................................212
Banco Espirito Santo (‘BES’)..............................................................................213
Banco Portugues de Investimento (‘BPI’) ............................................................214
Caixa Economica Montepio Geral (‘Montepio’)...................................................215
Caixa Geral de Depositos (‘CGD’) ......................................................................216
Santander Totta (‘Totta’) .....................................................................................217
Spanish Covered Bonds ......................................................220
Legislative snapshot ............................................................................................220

7
Europe Credit Research12 September 2011
Gareth Davies, CFA(44-20) [email protected]
Flavio Marco Rusconi(44-20) [email protected]
Spanish covered bond & macro backdrop ............................................................222
Standalone programmes: .....................................................................................223
Banco Bilbao Vizcaya Argentina (‘BBVA’) ........................................................223
Banco CAM........................................................................................................225
Banco Espanol de Credito (‘Banesto’) .................................................................227
Banco Pastor .......................................................................................................228
Banco Popular Espanol........................................................................................230
Banco Sabadell ...................................................................................................232
Banco Santander .................................................................................................234
Bankia ................................................................................................................236
Bankinter ............................................................................................................238
Bilbao Bizkaia Kutxa (‘BBK’) ............................................................................240
Caixa d’Estalvis de Catalunya, Tarragona i Manresa (‘CatalunyaCaixa’)..............242
CaixaBank ..........................................................................................................244
Caja de Ahorros y Monte de Piedad de Guipúzcoa y San Sebastián (‘Kutxa’).......246
Caja Vital Kutxa .................................................................................................247
Cajamar Caja Rural .............................................................................................248
Ibercaja ...............................................................................................................250
Santander Consumer Finance ..............................................................................251
Unicaja ...............................................................................................................252
Multi-Cedulas .....................................................................................................253
Programmes........................................................................................................253
Swedish Covered Bonds .....................................................260
Legislative snapshot ............................................................................................260
Swedish covered bond & macro backdrop ...........................................................261
Landshypotek AB ...............................................................................................262
Länsförsäkringar Hypotek AB.............................................................................263
Nordea Hypotek AB............................................................................................264
Skandinaviska Enskilda Banken AB....................................................................265
Stadshypotek Mortgage AB.................................................................................266
Swedbank Mortgage AB .....................................................................................267
Swedish Covered Bond Corporation ....................................................................268
Swiss Covered Bonds..........................................................270
Legislative snapshot ............................................................................................270
Swiss covered bond backdrop..............................................................................271
Credit Suisse Group AG......................................................................................272
UBS AG .............................................................................................................273
UK Covered Bonds...............................................................276
Legislative snapshot ............................................................................................276
UK covered bond & macro backdrop...................................................................277
Barclays Bank PLC (‘Barclays’)..........................................................................278
Bradford & Bingley PLC (‘Bradbi’) ....................................................................280
Coventry Building Society (‘Coventry’) ..............................................................281
HSBC Bank PLC (‘HSBC’) ................................................................................282
Leeds Building Society (‘Leeds’).........................................................................283

8
Europe Credit Research12 September 2011
Gareth Davies, CFA(44-20) [email protected]
Flavio Marco Rusconi(44-20) [email protected]
Lloyds Banking Group PLC (‘Lloyds’)................................................................284
Nationwide Building Society (‘Nationwide’) .......................................................285
Northern Rock Asset Management (‘NRAM’) .....................................................287
Royal Bank of Scotland PLC (‘RBS’)..................................................................289
Santander UK plc (‘Santander’)...........................................................................291
Yorkshire Building Society (‘Yorkshire’) ............................................................293
US Covered Bonds...............................................................296
Legislative snapshot ............................................................................................296
US covered bond & macro backdrop ...................................................................297
Bank of America .................................................................................................298
J.P. Morgan Chase ..............................................................................................299

9
Europe Credit Research12 September 2011
Gareth Davies, CFA(44-20) [email protected]
Flavio Marco Rusconi(44-20) [email protected]
Primary Market Outlook
The past twelve months–‘the boy done good'
Recent issuance trends
We have recorded benchmark covered bond issuance of €255bn to the 1st September (see Figure 1). This compares to full-year issuance of €276bn in 2010, or an increase of 31% over the comparable eight-month period last year. Even when considering that 2011 has seen a number of months with minimal levels of issuance owing to broad macro market dislocation (see Figure 2), it remains impressive that the amount issued in the ‘functioning’ 5 months has still exceeded 2010 levels.
Figure 1: Covered Bonds issuance, €mm
Source: Dealogic, J.P. Morgan Covered Bonds Research. Benchmark issuance only
Even when adjusting for newer issuance jurisdictions (in particular Canada where issuance volumes have picked up dramatically), we see 2011 levels comparing favourably to those of 2010. Looking further back to issuance volumes in 2007 as a representative ‘steady state’ year (i.e. pre credit crisis), total issuance amounts were approximately €200bn, showing significant progression in market size since 2007 (potentially by FY2011, +€100bn or +50% over four years).
Figure 2: Monthly Covered Bonds issuance, €mm
Source: Dealogic, J.P. Morgan Covered Bonds Research. Benchmark issuance only
Figure 3: Covered bonds outstanding, top 5 jurisdictions, €mm
Source: ECBC. All issuance
Issuance–digging a little deeper
Breaking the aggregate issuance figures down into 'tiers' of countries, we take as a starting point the classifications proposed in 2010’s Handbook, with the caveat of a few ‘jurisdictional switches’ (we redesignate the ‘Peripheral’ category which previously contained only smaller issuance markets in 2010, as now including markets affected by the European sovereign crisis. We switch the smaller countries into the ‘Outer Core’ grouping). Our amended classifications are set as follows:
0
50,000
100,000
150,000
200,000
250,000
300,000
350,000
2007 2008 2009 2010 2011 YTD
Cov. Bonds (Not retained)
0
10,000
20,000
30,000
40,000
50,000
60,000
Oct
-10
Nov
-10
Dec
-10
Jan-
11
Feb
-11
Mar
-11
Apr
-11
May
-11
Jun-
11
Jul-1
1
Aug
-11
Sep
-11
0
300,000
600,000
900,000
1,200,000
1,500,000
1,800,000
2,100,000
2,400,000
2,700,000
2003 2004 2005 2006 2007 2008 2009 2010
Germany Spain Denmark France Sweden Other
Covered bond issuance
continues to expand its role in funding the world's banks

10
Europe Credit Research12 September 2011
Gareth Davies, CFA(44-20) [email protected]
Flavio Marco Rusconi(44-20) [email protected]
‘Inner core’ jurisdictionsThree jurisdictions jump to the fore when considering the longest-standing and most established covered bond markets: Denmark, France and Germany. Most covered bonds issued out of these jurisdictions offer a greater degree of liquidity and are supported by a strong domestic investor base.
These bonds tend to price the tightest in the new issue market. Individual issuer credit risk is often perceived to be of less importance in these markets owing to the systemic importance of the product to the respective jurisdiction.
‘Outer core’ jurisdictionsThis classification includes all other Western European jurisdictions along with jurisdictions recently joining or about to join the covered bond community, including Canada, Korea, New Zealand and the US.
Peripheral jurisdictionsWe aggregate exposures to those markets most affected by the European sovereign crisis: Greece, Ireland, Italy, Portugal and Spain.
Figure 4: Issuance volumes by country tier, €mm
Source: J.P. Morgan Covered Bonds Research. Benchmark issuance only
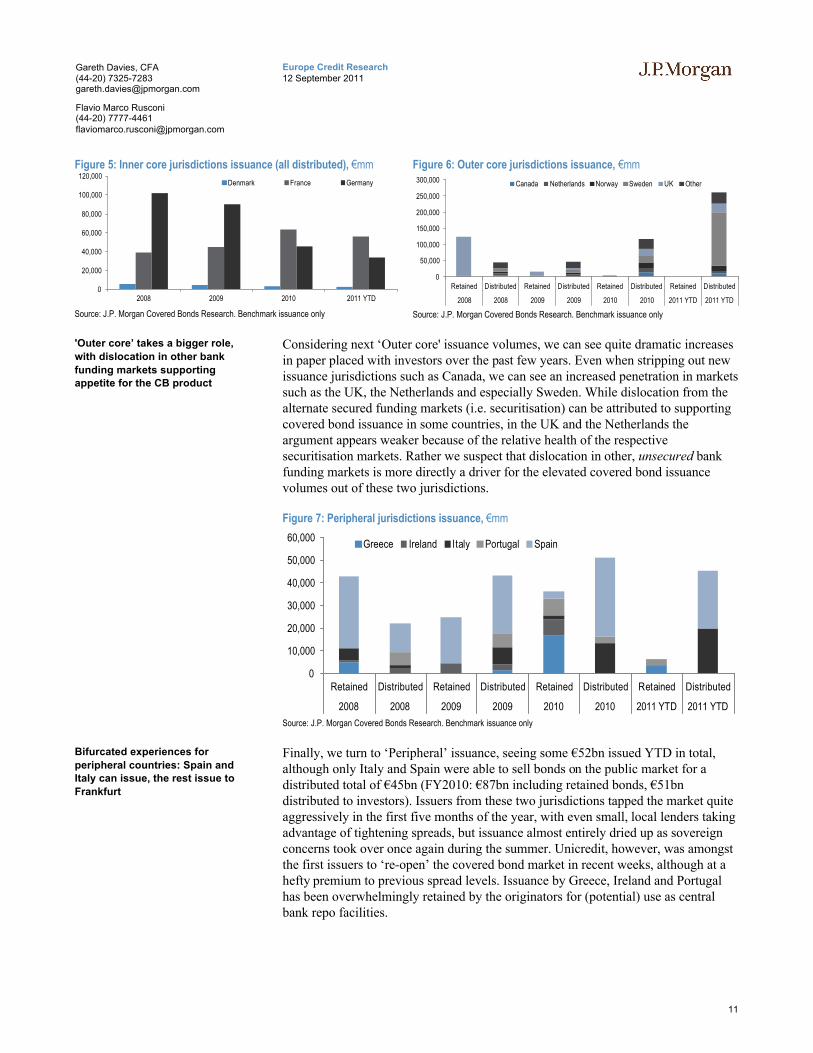
Turning first to the ‘Inner core’ we see that issuance over time has been consistently increasing out of France, with Danish issuers mostly active on the domestic, non-benchmark DKK market (see Figure 5). Significantly, the issuance of public-sector backed pfandbrief has fallen over time–exacerbating a trend that started pre-2007 and driving the German contribution to annual issuance down to just €45bn in 2010 vs €102bn in 2008.
0
50,000
100,000
150,000
200,000
2008 2009 2010 2011 YTD
Inner core Outer core Periphery
‘Traditional’ issuance jurisdictions have become less
prolific issuers
11
Europe Credit Research12 September 2011
Gareth Davies, CFA(44-20) [email protected]
Flavio Marco Rusconi(44-20) [email protected]
Figure 5: Inner core jurisdictions issuance (all distributed), €mm
Source: J.P. Morgan Covered Bonds Research. Benchmark issuance only
Figure 6: Outer core jurisdictions issuance, €mm
Source: J.P. Morgan Covered Bonds Research. Benchmark issuance only
Considering next ‘Outer core' issuance volumes, we can see quite dramatic increases in paper placed with investors over the past few years. Even when stripping out new issuance jurisdictions such as Canada, we can see an increased penetration in markets such as the UK, the Netherlands and especially Sweden. While dislocation from the alternate secured funding markets (i.e. securitisation) can be attributed to supporting covered bond issuance in some countries, in the UK and the Netherlands the argument appears weaker because of the relative health of the respective securitisation markets. Rather we suspect that dislocation in other, unsecured bank funding markets is more directly a driver for the elevated covered bond issuance volumes out of these two jurisdictions.
Figure 7: Peripheral jurisdictions issuance, €mm
Source: J.P. Morgan Covered Bonds Research. Benchmark issuance only
Finally, we turn to ‘Peripheral’ issuance, seeing some €52bn issued YTD in total, although only Italy and Spain were able to sell bonds on the public market for a distributed total of €45bn (FY2010: €87bn including retained bonds, €51bn distributed to investors). Issuers from these two jurisdictions tapped the market quite aggressively in the first five months of the year, with even small, local lenders taking advantage of tightening spreads, but issuance almost entirely dried up as sovereign concerns took over once again during the summer. Unicredit, however, was amongst the first issuers to ‘re-open’ the covered bond market in recent weeks, although at a hefty premium to previous spread levels. Issuance by Greece, Ireland and Portugal has been overwhelmingly retained by the originators for (potential) use as central bank repo facilities.
0
20,000
40,000
60,000
80,000
100,000
120,000
2008 2009 2010 2011 YTD
Denmark France Germany
0
50,000
100,000
150,000
200,000
250,000
300,000
Retained Distributed Retained Distributed Retained Distributed Retained Distributed
2008 2008 2009 2009 2010 2010 2011 YTD 2011 YTD
Canada Netherlands Norway Sweden UK Other
0
10,000
20,000
30,000
40,000
50,000
60,000
Retained Distributed Retained Distributed Retained Distributed Retained Distributed
2008 2008 2009 2009 2010 2010 2011 YTD 2011 YTD
Greece Ireland Italy Portugal Spain
'Outer core’ takes a bigger role,
with dislocation in other bank
funding markets supporting appetite for the CB product
Bifurcated experiences for
peripheral countries: Spain and Italy can issue, the rest issue to
Frankfurt

12
Europe Credit Research12 September 2011
Gareth Davies, CFA(44-20) [email protected]
Flavio Marco Rusconi(44-20) [email protected]
Pricing patterns: it’s all in the brand
Launch spreads and origination patterns give a clear indication of the ability of issuers from each jurisdictional tier to access the market. Issuers from the ‘Inner core’ jurisdictions appear able to tap the market at virtually any time, regardless of periods of broad market volatility (Figure 8). Furthermore, as shown for France, within-jurisdiction tiering seems to be primarily driven by bond maturity, rather than by the issuer itself (more akin to a ‘rates perspective’).
‘Outer core’ jurisdictions offer a more diverse mix. Certain jurisdictions, such as the Nordics, display a pattern closer to that of ‘Inner core’ ones, while others, such as the UK, do not seem to be able to brave the markets on their own and often come to the market in clusters. Furthermore, in the UK, launch spreads seem to be primarily driven by issuer name, rather than by maturity: some of the smaller building societies have to offer wider spreads than those paid by the larger banks, regardless of maturity (a ‘credit’ perspective). Interestingly, Santander UK also appears to price wider than other more ‘domestic' names.
Figure 8: French launch spreads vs MS, bp
Source: J.P. Morgan Covered Bonds Research. Benchmark issuance only
Figure 9: UK launch spreads vs MS, bp
Source: J.P. Morgan Covered Bonds Research. Benchmark issuance only
The ‘open-closed’ pattern seen in the UK is even more in evidence in the peripheral countries, where issuers are particularly sensitive to the tone of the broader market. Both Spanish and Italian issuers have taken advantage of the window of opportunity offered by the relative calm on the sovereign front earlier in the year and issuers of all sizes and shapes came to the market. There is also very little differentiation in terms of maturity, but there is a significant gap between spreads offered by large, more established financial institutions and smaller, regional lenders. In Spain in particular, issuers such as BBVA or Santander are able to pay much tighter spreads on longer maturity bonds than those paid by the savings banks (Figure 11) as an example.
Figure 10: Italian launch spreads vs MS, bp
Source: J.P. Morgan Covered Bonds Research. Benchmark issuance only
Figure 11: Spanish launch spreads vs MS, bp
Source: J.P. Morgan Covered Bonds Research. Benchmark issuance only
0
20
40
60
80
100
Sep
-10
Sep
-10
Oct
-10
Oct
-10
Nov
-10
Nov
-10
Dec
-10
Dec
-10
Dec
-10
Jan-
11
Jan-
11
Feb
-11
Feb
-11
Mar
-11
Mar
-11
Apr
-11
Apr
-11
May
-11
May
-11
Jun-
11
Jun-
11
Jun-
11
Jul-1
1
Jul-1
1
Aug
-11
Aug
-11
Sep
-11
<3yrs 3-5yrs 5-7yrs 7-10yrs >10yrs0
50
100
150
200
Sep
-10
Sep
-10
Oct
-10
Oct
-10
Nov
-10
Nov
-10
Dec
-10
Dec
-10
Dec
-10
Jan-
11
Jan-
11
Feb
-11
Feb
-11
Mar
-11
Mar
-11
Apr
-11
Apr
-11
May
-11
May
-11
Jun-
11
Jun-
11
Jun-
11
Jul-1
1
Jul-1
1
Aug
-11
Aug
-11
Sep
-11
<3yrs 3-5yrs 5-7yrs 7-10yrs >10yrs
0
50
100
150
200
250
Sep
-10
Sep
-10
Oct
-10
Oct
-10
Nov
-10
Nov
-10
Dec
-10
Dec
-10
Dec
-10
Jan-
11
Jan-
11
Feb
-11
Feb
-11
Mar
-11
Mar
-11
Apr
-11
Apr
-11
May
-11
May
-11
Jun-
11
Jun-
11
Jun-
11
Jul-1
1
Jul-1
1
Aug
-11
Aug
-11
<3yrs 3-5yrs 5-7yrs 7-10yrs >10yrs
0
50
100
150
200
250
300
350
Sep
-10
Sep
-10
Oct
-10
Oct
-10
Nov
-10
Nov
-10
Nov
-10
Dec
-10
Dec
-10
Jan-
11
Jan-
11
Feb
-11
Feb
-11
Mar
-11
Mar
-11
Apr
-11
Apr
-11
May
-11
May
-11
May
-11
Jun-
11
Jun-
11
Jul-1
1
Jul-1
1
Aug
-11
Aug
-11
<3yrs 3-5yrs 5-7yrs 7-10yrs >10yrs
Inner core jurisdictions look to have market access even in
periods of volatility
The most ‘credit-linked’ jurisdictions appear to have
more occasional market access

13
Europe Credit Research12 September 2011
Gareth Davies, CFA(44-20) [email protected]
Flavio Marco Rusconi(44-20) [email protected]
How does this compare to the performance of other bank funding instruments?
As we have noted above, covered bond issuance volumes have shown significant progression over the past four years. In Figure 12 below we set out the issuance volumes of two equally important bank funding instruments to see whether the absolute success of covered bonds is also observable in relative terms.
Figure 12: ABS, Senior Unsecured, Covered Bonds issuance, €mm
Source: J.P. Morgan Covered Bonds Research. Benchmark issuance only
Readers can clearly see that while covered bond issuance has gone from strength to strength over the period in question, the two largest alternative bank funding sources have recorded significant declines in issuance. Turning to each separately, we have seen senior unsecured issuance volumes decline from €264bn in 2007, to €159bn in 2010 (and €127bn YTD 2011). Undoubtedly some of this decline can be attributed to an investor aversion to specific issuers or jurisdictions, but equally important in our view has been the uncertainty created by proposed regulatory initiatives surrounding the senior unsecured product itself. We note that the proposed adoption of explicit bail-in language for senior unsecured bonds from 2013 has undermined investor confidence in the risk profile of the instrument. While this uncertainty persists, investors will naturally demand additional compensation for the perceived additional risk, making economically feasible senior unsecured issuance out of the reach of most (European) issuers.
Turning to the securitisation market, we see a dramatic change in issuance volumes following the onset of the credit crunch, with €325bn of bonds placed with investors in the first eight months of 2007, compared to €51bn over the same period in 2011. Furthermore, there has been a significant divergence in the fortunes of individual issuing jurisdictions, with the UK and the Netherlands (and to a lesser extent, Italy) able to access the distributed RMBS markets at regular intervals, while other countries have been frozen out of the market owing to the basis between current asset spreads and required liability costs. Furthermore, as we noted in last year’s Handbook, the regulatory environment for both securitisation issuance and investment has been tightened since 2007 from a myriad of sources (CRD III, IV, BIS Liquidity Regime, Solvency II etc). Much as for senior unsecured debt, this has undoubtedly skewed the landscape in favour of covered bonds.
As we noted in our introduction, we remain aware of potential roadbumps in the medium-term outlook for the asset class (as credit analysts the glass is always half empty), seeing the developing regulatory regime as skewing the incentives in favour of covered bonds to such a degree, that it is damaging the diversity of alternate bank funding opportunities, and by derivation, potentially harming the ability of today’s covered product to grow at a more measured and sustainable pace.
0
50,000
100,000
150,000
200,000
250,000
300,000
350,000
2007 2008 2009 2010 2011 YTD
ABS (Not retained) Snr unsec. Cov. Bonds (Not retained)
Covered bonds do well both absolutely and relatively
Uncertainty as to the risk profile of senior unsecured debt has
translated into additional supply
of covered bonds
Securitisation markets remain open for Northern European
issuers, but regulatory initiatives
have also altered the incentives in these markets
Regulatory backdrop could put too much pressure on the asset
class

14
Europe Credit Research12 September 2011
Gareth Davies, CFA(44-20) [email protected]
Flavio Marco Rusconi(44-20) [email protected]
The next twelve months–Magic 8 ball time
We are either brave or foolish to try and predict the next twelve months, recognising the close link between sentiment for covered bonds and that for financial and government risk more broadly. Letting the reader decide which is the more appropriate interpretation, we set out our thoughts on the next 12 months below:
Who is going to be doing what?
From the issuer perspective, we expect the ‘Inner core’ jurisdictions to be relatively unaffected by the vagaries of peripheral crisis (barring a significant event). Danish, German and French issuers are likely to be able to continue accessing the markets relatively uninterrupted, albeit with potentially wider access points in particular for French issuers, where sentiment appears less resilient to continued sovereign crisis uncertainty.
For 'Outer core' countries, we see a number of subsets in expected ability to access the markets. For the Scandinavian issuers, we would expect them to be able to access both the Euro and Dollar markets (largely US, but also AUD) broadly uninterrupted over the course of the next twelve months (assuming the same caveat as above). For the UK and Netherlands, we continue to expect to see a greater reliance on the covered product – less as an alternative to RMBS, which still remains a functioning market in both jurisdictions, but more likely as an alternative to senior unsecured issuance. For non-European issuers, including Canadian, New Zealand and (shortly) Australian institutions, we expect to see ever increasing issuance predominantly targeted at the domestic or quasi-domestic markets.
For peripheral countries, we need to split the group into two: those already in the epicentre of the sovereign storm (Greece, Ireland and Portugal) and those one or two steps removed (Italy and Spain). Somewhat perversely, the outlook for issuance from Greece, Ireland and Portugal is easier to communicate, with our hypothesis that we will see no distributed issuance from any of the three jurisdictions for the foreseeable future. For Italy and Spain, we can adopt the same approach, seeing 'national champions' as able to fund over the majority of the year, alongside smaller players being able to fund only in times of market stability.
From the investor perspective, we expect to see a continuation of recent trends with respect to investor engagement. If we bifurcate the investor base into traditional 'rates' and newer 'credit' investors, we would expect the rates subset to show a larger appetite in terms of notionals from broadly the same number of accounts, driven largely by regulatory incentives (particularly Solvency II). In comparison, for credit investors we would expect both the breadth, in terms of number of accounts, and depth, in terms of the willingness of these accounts to invest in the covered asset class, to continue to expand over the course of the next twelve months.
In aggregate, with forecast total benchmark issuance of approximately €300bn for FY2011, it would not seem outlandish to expect between €325-350bn in FY2012 given continued dislocation in alternative bank funding sources and an expanding international footprint for the product.
‘Inner core’ and colder ‘Outer core’ countries to have almost
uninterrupted access to covered
bond funding
Wetter ‘Outer core’ countries to rely more on CB as a
replacement for senior
unsecured bonds, with Commonwealth countries
relying more on investors closer
to home
No market access for those at the centre of the peripheral
storm, occasional access for
those one or two steps away
More investors expected

15
Europe Credit Research12 September 2011
Gareth Davies, CFA(44-20) [email protected]
Flavio Marco Rusconi(44-20) [email protected]
Secondary Market Outlook
The last twelve months–Vow to thee, my country
After stabilising in the second half of 2010 and actually seeing some tightening in the opening months of 2011 as sovereign concerns initially subsided, covered bond spreads succumbed to broader financial market deterioration as the peripheral saga continued to play out in front of the market’s eyes. Despite the absolute widening evident in many jurisdictions, covered bonds as an asset class have significantly outperformed the broader ‘financials’ sector (Figure 13), although some of the more liquid RMBS asset classes, such as UK prime RMBS, have proved to be even more resilient in price terms.
Figure 13: Cross-asset class spreads comparison, bp
Source: J.P. Morgan Covered Bonds Research
Figure 14: Selected Covered Bond spreads, bp
Source: J.P. Morgan Covered Bonds Research
Understandably, not all covered bonds were affected in the same way by the sovereign headwinds: while French, German and UK spreads proved relatively resilient and widened only modestly during the latest bout of volatility, Spanish prices have been a lot more sensitive to the mood swings of the wider market. Figure 14 shows how these have spiked initially in May-June 2010, during the first Greek crisis, then again in December 2010-January 2011, on the back of the Irish crisis and finally resumed rising in June 2011, when sovereign concerns spread to Spain itself along with Italy.
The different relationship between covered bond spread performance and trends in broader market sentiment in the various jurisdictions is perhaps more clear in the charts below. We compare sovereign CDS, used as a measure of stress on a specific jurisdiction, with senior unsecured and covered bond spreads from selected issuers in those countries.
In Germany (Figure 15), covered bonds are clearly the most resilient of all asset classes considered, even more so than sovereign CDS, which has gapped wider over the summer months.
0
50
100
150
200
250
300
Jan-
10
Feb
-10
Mar
-10
Apr
-10
May
-10
Jun-
10
Jul-1
0
Aug
-10
Sep
-10
Oct
-10
Nov
-10
Dec
-10
Jan-
11
Feb
-11
Mar
-11
Apr
-11
May
-11
Jun-
11
Jul-1
1
Aug
-11
Sep
-11
iTraxx Europe Senior Fin. 5yrs JPM Maggie CB 3 - 5 Yr
UK RMBS AAA Euro FL 5 Yr
0
50
100
150
200
250
300
350
Jan-
10
Feb
-10
Mar
-10
Apr
-10
May
-10
Jun-
10
Jul-1
0
Aug
-10
Sep
-10
Oct
-10
Nov
-10
Dec
-10
Jan-
11
Feb
-11
Mar
-11
Apr
-11
May
-11
Jun-
11
Jul-1
1
Aug
-11
Sep
-11
France CB 3 - 5 Years Germany CB 3 - 5 Years
UK CB 3 - 5 Years Spain CB 3 - 5 Yr
Although wider, not as wide as other instruments
Tiered price performance for
those jurisdictions with feet ‘closest to the fire’
Pfandbrief appear more
defensive than even the sovereign

16
Europe Credit Research12 September 2011
Gareth Davies, CFA(44-20) [email protected]
Flavio Marco Rusconi(44-20) [email protected]
Figure 15: German CDS, Senior unsecured and Covered bond spreads, bp
Source: Bloomberg
Figure 16: UK CDS, Senior unsecured and Covered bond spreads, bp
Source: Bloomberg
Similarly, in the UK, covered bond spreads have remained broadly stable (Figure 16), whereas senior unsecured prices have significantly widened whilst even the sovereign CDS has come under pressure, although by a lesser degree than elsewhere in Europe.
In Italy and Spain, on the other hand, there is a much closer link between the various asset classes, with CDS, senior unsecured and covered spreads moving more or less in unison. Interestingly, in Italy and even more so in Spain, the traditionally tight differential between senior unsecured and covered bonds seems to have widened significantly over the recent months, perhaps suggesting that investors have started better appreciating the extra layer of security offered by the cover pool.
Figure 17: Italian CDS, Senior unsecured and Covered bond spreads, bp
Source: Bloomberg
Figure 18: Spanish CDS, Senior unsecured and Covered bond spreads, bp
Source: Bloomberg
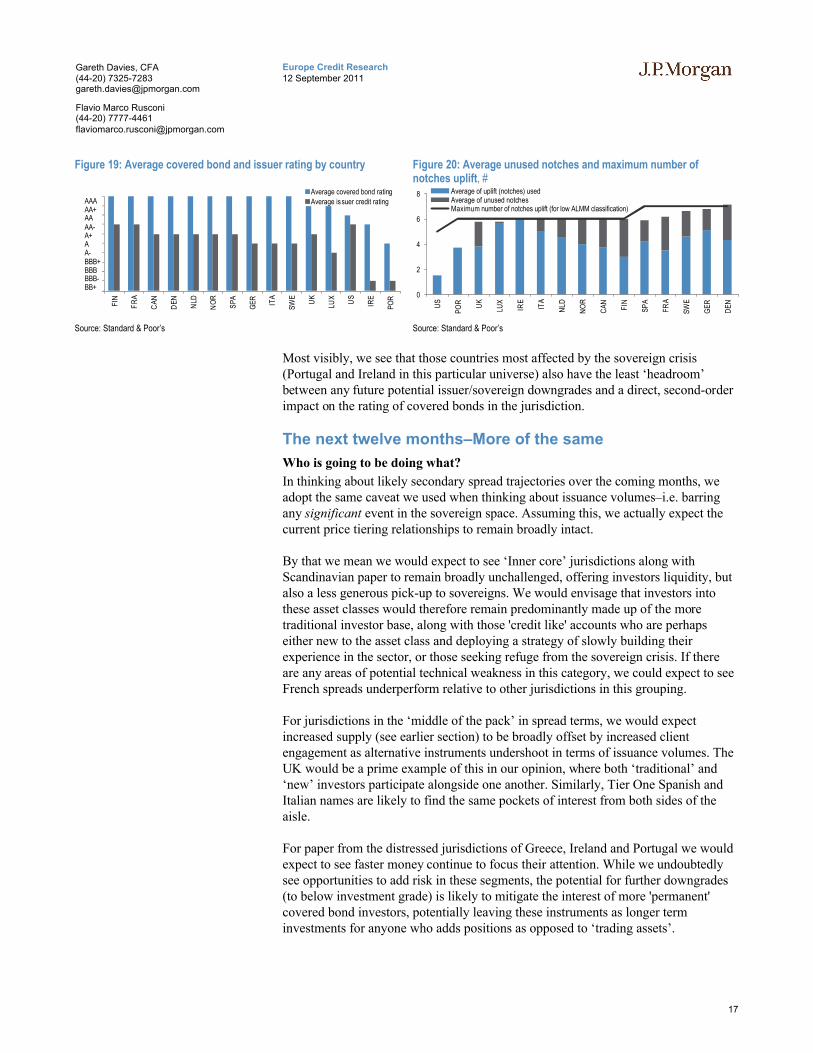
And another thing…The close links between sovereign, issuer and the covered bond spread are also reflected in the ratings of the three instruments (see later Rating Agency section for an explicit explanation of the relationships), which in turn often have a second order consequence on the pricing of the covered instrument (as in, the lower the rating, the lower the price). While Figure 19 sets out the average covered bond rating by jurisdiction according to data from S&P, Figure 20 shows the direct impact that the rating of the sovereign (and in turn on the domestic banks) can have on the ratings of outstanding covered bond programmes.
-20
0
20
40
60
80
100
120
140
160
Jan-
10
Feb
-10
Mar
-10
Apr
-10
May
-10
Jun-
10
Jul-1
0
Aug
-10
Sep
-10
Oct
-10
Nov
-10
Dec
-10
Jan-
11
Feb
-11
Mar
-11
Apr
-11
May
-11
Jun-
11
Jul-1
1
Aug
-11
Deutsche Bank CB 2016 Deutsche Bank Snr. Unsec. 2017
Germany 5yrs CDS
0
50
100
150
200
250
300
350
400
Jan-
10
Feb
-10
Mar
-10
Apr
-10
May
-…
Jun-
10
Jul-1
0
Aug
-10
Sep
-10
Oct
-10
Nov
-10
Dec
-10
Jan-
11
Feb
-11
Mar
-11
Apr
-11
May
-…
Jun-
11
Jul-1
1
Aug
-11
BoS CB 2016 Lloyds Snr. Unsec. 2016 UK 5yrs CDS
0
100
200
300
400
500
Jan-
10
Feb
-10
Mar
-10
Apr
-10
May
-10
Jun-
10
Jul-1
0
Aug
-10
Sep
-10
Oct
-10
Nov
-10
Dec
-10
Jan-
11
Feb
-11
Mar
-11
Apr
-11
May
-11
Jun-
11
Jul-1
1
Aug
-11
Sep
-11
Intesa CB 2017 Intes Sen. Unsec. 2017 Italy 5yrs CDS
0
100
200
300
400
500
Jan-
10
Feb
-10
Mar
-10
Apr
-10
May
-…
Jun-
10
Jul-1
0
Aug
-10
Sep
-10
Oct
-10
Nov
-10
Dec
-10
Jan-
11
Feb
-11
Mar
-11
Apr
-11
May
-…
Jun-
11
Jul-1
1
Aug
-11
Sep
-11
BBVA CB 2016 BBVA Sen. Unsec. 2015 Spain 5yrs CDS
Close relationship between
government, bank and covered
debt in peripheral markets
17
Europe Credit Research12 September 2011
Gareth Davies, CFA(44-20) [email protected]
Flavio Marco Rusconi(44-20) [email protected]
Figure 19: Average covered bond and issuer rating by country
Source: Standard & Poor’s
Figure 20: Average unused notches and maximum number of notches uplift, #
Source: Standard & Poor’s
Most visibly, we see that those countries most affected by the sovereign crisis (Portugal and Ireland in this particular universe) also have the least ‘headroom’ between any future potential issuer/sovereign downgrades and a direct, second-order impact on the rating of covered bonds in the jurisdiction.
The next twelve months–More of the same
Who is going to be doing what?
In thinking about likely secondary spread trajectories over the coming months, we adopt the same caveat we used when thinking about issuance volumes–i.e. barring any significant event in the sovereign space. Assuming this, we actually expect the current price tiering relationships to remain broadly intact.
By that we mean we would expect to see ‘Inner core’ jurisdictions along with Scandinavian paper to remain broadly unchallenged, offering investors liquidity, but also a less generous pick-up to sovereigns. We would envisage that investors into these asset classes would therefore remain predominantly made up of the more traditional investor base, along with those 'credit like' accounts who are perhaps either new to the asset class and deploying a strategy of slowly building their experience in the sector, or those seeking refuge from the sovereign crisis. If there are any areas of potential technical weakness in this category, we could expect to see French spreads underperform relative to other jurisdictions in this grouping.
For jurisdictions in the ‘middle of the pack’ in spread terms, we would expect increased supply (see earlier section) to be broadly offset by increased client engagement as alternative instruments undershoot in terms of issuance volumes. The UK would be a prime example of this in our opinion, where both ‘traditional’ and ‘new’ investors participate alongside one another. Similarly, Tier One Spanish and Italian names are likely to find the same pockets of interest from both sides of the aisle.
For paper from the distressed jurisdictions of Greece, Ireland and Portugal we would expect to see faster money continue to focus their attention. While we undoubtedly see opportunities to add risk in these segments, the potential for further downgrades (to below investment grade) is likely to mitigate the interest of more 'permanent' covered bond investors, potentially leaving these instruments as longer term investments for anyone who adds positions as opposed to ‘trading assets’.
910111213141516171819
FIN
FR
A
CA
N
DE
N
NLD
NO
R
SP
A
GE
R
ITA
SW
E
UK
LUX
US
IRE
PO
R
Average covered bond rating
Average issuer credit ratingAAAAA+AAAA-A+AA-BBB+BBBBBB-BB+
0
2
4
6
8
US
PO
R UK
LUX
IRE
ITA
NLD
NO
R
CA
N
FIN
SP
A
FR
A
SW
E
GE
R
DE
N
Average of uplift (notches) usedAverage of unused notchesMaximum number of notches uplift (for low ALMM classification)

18
Europe Credit Research12 September 2011
Gareth Davies, CFA(44-20) [email protected]
Flavio Marco Rusconi(44-20) [email protected]
Our covered bond recommendations
Table 1: Selected Covered Bond recommendations by jurisdiction
Sector Outlook Commentary Investment recommendations
Germany Technical Fundamentals ‘Rates’ perspective ‘Credit’ perspective
The core jurisdiction in the European CB market. Overwhelmingly a “rates buyer” market, and owing to the relatively tight levels of pfandbrief will offer little interest to a credit investor unless liquidity (or the perception of liquidity) is the over-arching driver of investment). Significant redemptions of bonds (particularly public sector backed outstandings) combined with a loyal investor base will likely support pfandbrief levels, despite our view that investors are not being compensated appropriately for the credit risk assumed in the underlying pools.
Neutral Underweight
France
The ‘second’ internationally active market in Europe, with a combination of both ‘legislative’ and ‘structured’ (although now also legislative) products available to investors (OF or OH). While supply has been elevated during the past twelve months, spreads have been relatively resilient. Generically we prefer OH to OF based on our preference for mortgage assets over public sectorexposures, compounded by the typical premium which OH bonds tend to come at in relation to OFs. Furthermore, we would expect OH bonds to perform better than OF bonds over the next few months, owing to some accounts approaching line limits on the more frequent OF names.
Underweight Underweight
Scandinavia
Solidly performing covered markets, with few 'credit' concerns with respect to sovereign or issuer strength. Has benefitted in spread terms both from the addition of northern European demand to the domestic investor base, along with the tapping of overseas dollar markets (US, Australia). Could see some mild spread tightening in EUR as paper diverted to further afield investors. Positions in these markets offer both liquidity and remain relatively removed from the European sovereign crisis.
Overweight Neutral
Netherlands
The last predominantly “rates” market. With the current pick-up of senior unsecured paper relative to Dutch covered bonds, we do not expect any significant pricing revisions over the next few months. As ‘hybrid' secured researchers, we see more value in adding securitisation exposure in the Netherlands however.
Neutral Neutral
UK
We remain overweight UK covered bonds, appreciating the strength of the guarantor structure (as for Netherlands and Italy). Furthermore, owing to the nascent start of a domestic, GBP covered bond market, we also recognise the potential for performance in the existing largely EUR-denominated UK covered bonds, as both future supply is directed into the GBP market and continental investors appreciate the pick-up to some of the tighter, northern European markets. For the more ‘adventurous’ investors, we also see particular appeal in covered bonds of now state-supported institutions (Bradbi and NRAM) which benefit from HM Treasury guarantees (Bradbi to runoff, NRAM revocable with 3 months notice).
Overweight Overweight
Italy
While we very much appreciate the SPV structure deployed in OBGs, like the underlying mortgage collateral and the financial health of most Italian households, and see the predominantly domestically funded Italian banks as unlikely to ‘over issue’ OBGs, we switch our overweight recommendation to an underweight based on the seemingly significant potential for political backflips with respect to adopting credible austerity measures to stem sovereign contagion. On a HTM perspective, we would remain overweight based on technicals, but on a MTM basis, we see the political backdrop as too volatile to justify further investment.
Underweight Underweight
19
Europe Credit Research12 September 2011
Gareth Davies, CFA(44-20) [email protected]
Flavio Marco Rusconi(44-20) [email protected]
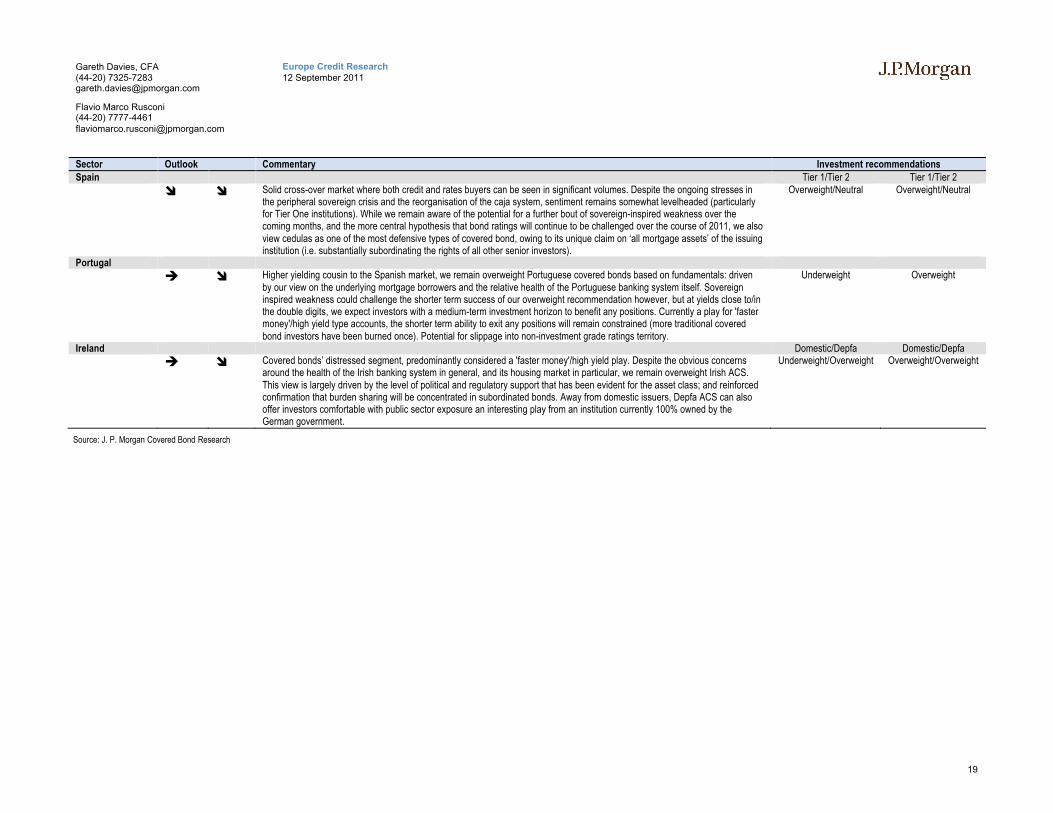
Sector Outlook Commentary Investment recommendationsSpain Tier 1/Tier 2 Tier 1/Tier 2
Solid cross-over market where both credit and rates buyers can be seen in significant volumes. Despite the ongoing stresses in the peripheral sovereign crisis and the reorganisation of the caja system, sentiment remains somewhat levelheaded (particularly for Tier One institutions). While we remain aware of the potential for a further bout of sovereign-inspired weakness over the coming months, and the more central hypothesis that bond ratings will continue to be challenged over the course of 2011, we also view cedulas as one of the most defensive types of covered bond, owing to its unique claim on ‘all mortgage assets’ of the issuing institution (i.e. substantially subordinating the rights of all other senior investors).
Overweight/Neutral Overweight/Neutral
Portugal
Higher yielding cousin to the Spanish market, we remain overweight Portuguese covered bonds based on fundamentals: driven by our view on the underlying mortgage borrowers and the relative health of the Portuguese banking system itself. Sovereign inspired weakness could challenge the shorter term success of our overweight recommendation however, but at yields close to/in the double digits, we expect investors with a medium-term investment horizon to benefit any positions. Currently a play for 'faster money'/high yield type accounts, the shorter term ability to exit any positions will remain constrained (more traditional covered bond investors have been burned once). Potential for slippage into non-investment grade ratings territory.
Underweight Overweight
Ireland Domestic/Depfa Domestic/Depfa
Covered bonds’ distressed segment, predominantly considered a 'faster money'/high yield play. Despite the obvious concerns around the health of the Irish banking system in general, and its housing market in particular, we remain overweight Irish ACS. This view is largely driven by the level of political and regulatory support that has been evident for the asset class; and reinforced confirmation that burden sharing will be concentrated in subordinated bonds. Away from domestic issuers, Depfa ACS can also offer investors comfortable with public sector exposure an interesting play from an institution currently 100% owned by the German government.
Underweight/Overweight Overweight/Overweight
Source: J. P. Morgan Covered Bond Research

20
Europe Credit Research12 September 2011
Gareth Davies, CFA(44-20) [email protected]
Flavio Marco Rusconi(44-20) [email protected]
Product overview
Covered Bonds: a “bluffer’s guide”
We set out below a cheat-sheet for readers new to the asset class, providing a synopsis of the main characteristics of the product and an overview of the major markets.
Table 2: Covered bond cheat-sheet
What is a covered bond? Covered bonds are secured, senior, bullet instruments of an issuer (typically a bank), that provide investors with recourse to both the issuing institution and the underlying, revolving collateral pool.
How do CBs differ from RMBS? The main differences between RMBS and covered bonds can be summarised as: a) amortisation: RMBS generally have a pass-through structure based on the repayment of collateral, while CBs generally have a hard or soft bullet profile; b) credit enhancement: covered bonds have much simpler structures than ABS and rely on over-collateralisation as a form of credit enhancement. This can vary according to the usage of the programme by the issuer but a minimum OC has to be maintained; this is monitored through asset and interest coverage tests typically monitored by third parties, which ensure that the asset pool and its proceeds are enough to match the issuer's CB liabilities. In RMBS, credit enhancement is given by subordination and structural features and, except for certain structures, it generally increases as the deal de-levers; c) unlike securitisation, where investors benefit from recourse to the collateral pool only, CB investors benefit from dual recourse to both the issuer and the cover pool.
What types of CB structures exist? There are three broad CB structures: a) CB can be issued off the balance sheet of the originator, with the collateral pool remaining with the originator, albeit ring-fenced for covered bond investors (for example in Austria and Germany); b) a financial institution establishes a limited function subsidiary, which in turn issues covered bonds (for example France’s OF, Norway); c) in countries without specific CB legislation, CB are typically unsecured obligations of the issuer, with funds raised from the issuance of CB lent to a guarantor (typically a limited liability SPV), which uses the loan to acquire collateral from the originator. This entity then acts as guarantor to the unsecured bonds, agreeing to repay bondholders on insolvency of the issuer (for example UK, Canada, Netherlands, Italy).
What type of collateral is accepted? CB legislation (or transactions docs when no CB legislation exists) typically definesthe list of collateral eligible to be included in the cover pool. The main types of assets used as primary collateral are public sector exposures, residential and commercial mortgages and shipping loans. In some cases, a max LTV is specified. The EC’s CRD also allows senior MBS (both residential and commercial) issued by securitisation entities, where at least 90% of the underlying mortgages comply with the above rules for unsecured mortgage exposures. The MBS must be rated Credit Quality Step 1, and can only form 10% of the collateral pool (self-originated MBS receive a waiver from the 10% cap). Substitute assets up to a given threshold (typically 10-15%) can also be included in cover pools.
What type of risk are investors exposed to? Investors are generally exposed to issuer's risk until its default, after which they are exposed to the credit risk of the cover pool. If there are CBs outstanding after the cover pool has been extinguished, CB investors will have a residual claim to the bankruptcy estate of the issuer which will rank pari passu with that of senior unsecured bondholders
Do cover bonds accelerate upon the issuer’s default? No, CBs do not necessarily accelerate on insolvency of the issuing institution. Only the failure of the programme to make payments as and when due results in the acceleration of the obligations.
Which jurisdictions are the largest issuers? The largest issuer, by outstanding amount, is Germany, followed by Spain, Denmark, France and Sweden. As CBs gain popularity with regulators, issuers and investors, more jurisdictions are starting to push for dedicated covered bond legislation (for example Canada and the US).
Source: J.P. Morgan Covered Bond Research
21
Europe Credit Research12 September 2011
Gareth Davies, CFA(44-20) [email protected]
Flavio Marco Rusconi(44-20) [email protected]
As in last year’s Handbook, we once again set out below to define the core characteristics of the covered bond product, despite recognising that by making some generic statements, we ignore some of the multiple nuances that issuance from hundreds of issuers and tens of jurisdictions necessarily implies. We update this segment to reflect changes to legislative frameworks and the rating methodologies of the main agencies.
For more detail on individual jurisdictions, please see the respective country sectionstowards the back of this publication.
What exactly is a covered bond?
In a sentence…Covered bonds are secured, senior, bullet instruments of an issuer (typically a bank), that provide investors with recourse to both the issuing institution and the underlying, revolving collateral pool.
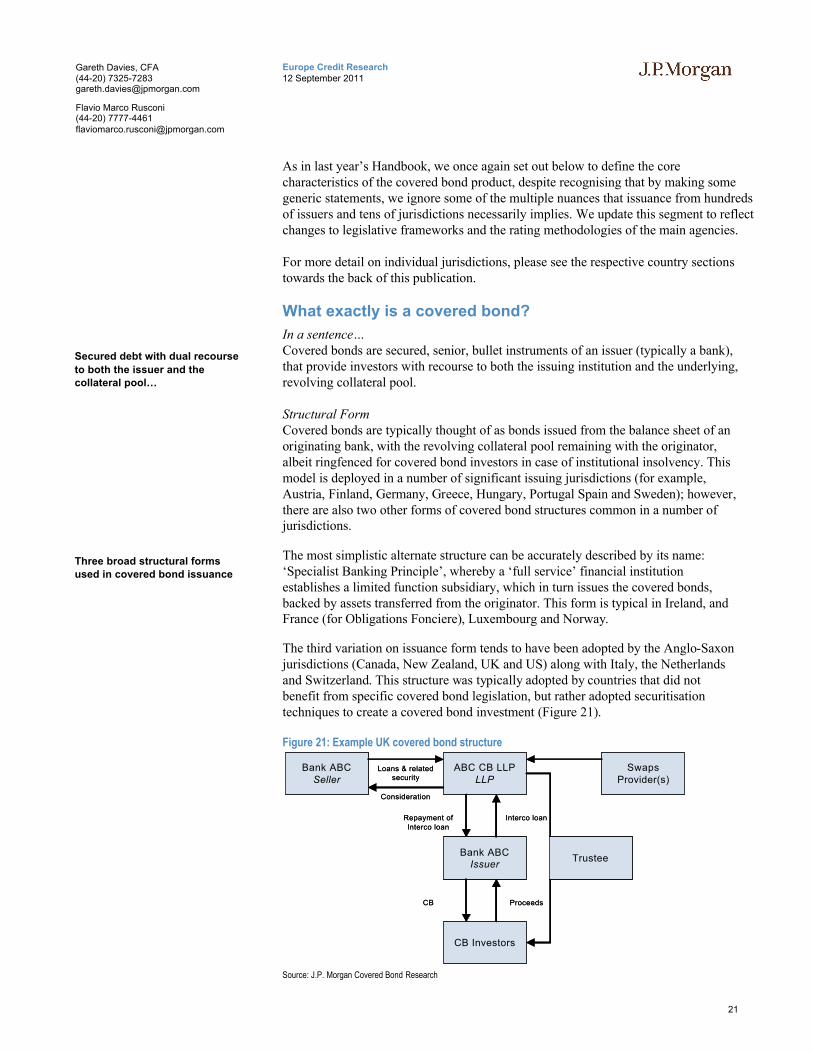
Structural FormCovered bonds are typically thought of as bonds issued from the balance sheet of an originating bank, with the revolving collateral pool remaining with the originator, albeit ringfenced for covered bond investors in case of institutional insolvency. This model is deployed in a number of significant issuing jurisdictions (for example, Austria, Finland, Germany, Greece, Hungary, Portugal Spain and Sweden); however,there are also two other forms of covered bond structures common in a number of jurisdictions.
The most simplistic alternate structure can be accurately described by its name: ‘Specialist Banking Principle’, whereby a ‘full service’ financial institution establishes a limited function subsidiary, which in turn issues the covered bonds, backed by assets transferred from the originator. This form is typical in Ireland, andFrance (for Obligations Fonciere), Luxembourg and Norway.
The third variation on issuance form tends to have been adopted by the Anglo-Saxon jurisdictions (Canada, New Zealand, UK and US) along with Italy, the Netherlandsand Switzerland. This structure was typically adopted by countries that did not benefit from specific covered bond legislation, but rather adopted securitisation techniques to create a covered bond investment (Figure 21).
Figure 21: Example UK covered bond structure
Source: J.P. Morgan Covered Bond Research
Bank ABCSeller
ABC CB LLPLLP
Bank ABCIssuer
CB Investors
SwapsProvider(s)
Consideration
Loans & related security
ProceedsCB
Interco loanRepayment of Interco loan
Trustee
Bank ABCSeller
ABC CB LLPLLP
Bank ABCIssuer
CB Investors
SwapsProvider(s)
Consideration
Loans & related security
ProceedsCB
Interco loanRepayment of Interco loan
Trustee
Secured debt with dual recourse
to both the issuer and the collateral pool…
Three broad structural forms used in covered bond issuance

22
Europe Credit Research12 September 2011
Gareth Davies, CFA(44-20) [email protected]
Flavio Marco Rusconi(44-20) [email protected]
Under this approach, covered bonds are actually unsecured obligations of the issuer. Funds raised from the issuance of covered bonds are then on-lent to a guarantor entity (typically a limited liability SPV), which uses the loan to acquire collateral from the originator. This entity then acts as guarantor to the unsecured bonds, agreeing to repay bondholders on insolvency of the issuer.
Market participants often refer to 'legislative' and 'structured' covered bond markets, distinguishing between the first two forms described above and the latter (although these terms can be something of a misnomer since many 'structured' markets now also have legislation).
Recourse & seniorityCovered bond investors benefit from dual recourse, whereby they have recourse to both the collateral pool backing the specific programme as well as to the estate of the originator on its default. Securitisation investors on the other hand have recourse only to the collateral pool.
Covered bonds remain the obligation of the issuing institution prior to its default,similar to any unsecured obligation and irrespective of the collateral performance in the cover pool (non-payment of a covered bond constitutes a default of the institution). Only after an institution’s default does the primary source of programme payments switch to the cover pool itself. Subsequently, should the pool prove insufficient to repay all outstanding obligations under the programme, covered bond investors will have further recourse to the bankruptcy estate of the issuer. These residual claims would rank pari passu with those of other senior (unsecured) bondholders.
CollateralCovered bond legislation typically defines the list of collateral eligible to be included in a cover pool. The main types of assets used as primary collateral (substitute assets are also eligible in cover pools up to a pre-defined threshold, typically 10-15%) are public sector exposures, residential and commercial mortgages and shipping loans. As the product expands its geographic reach beyond its traditional home in Europe, the list of eligible (primary) assets looks set to expand. Legislative proposals currently winding their way through the US Congress look set to expand the definition of eligible assets to include student loans, credit cards, auto loans and leases and SME loans. Kookmin Bank of Korea has also issued a covered bond backed by both mortgage and credit card collateral (although this has now been replaced with cash holdings).
In the EU, the primary source of guidance is provided in the Capital Requirement Directive1 (CRD), which sets out the following:
Exposures to public sector entities (central governments, central banks, PSEs, regional governments and local authorities in the EU)
Exposures to public sector entities (central governments, central banks and MDBs qualifying as Credit Quality Step 1, PSE, regional governments and local authorities not in the EU falling into Credit Quality Step 2 cannot exceed 20%)
Exposures to institutions in Credit Quality Step 1, not to exceed 15%
1 http://register.consilium.europa.eu/pdf/en/10/st11/st11527.en10.pdf
Only after issuer default does
the primary source of investor
cashflows become the cover pool
Most common form of collateral
used remains mortgages, followed by public sector assets
23
Europe Credit Research12 September 2011
Gareth Davies, CFA(44-20) [email protected]
Flavio Marco Rusconi(44-20) [email protected]
Residential (80% LTV limit) and commercial mortgage loans (60% LTV limit, or 70% if an issuer provides a minimum of 10% over-collateralisation)
Senior MBS (both residential and commercial) issued by securitisation entities, where at least 90% of the underlying mortgages comply with the above rules for unsecured mortgage exposures. The MBS must be rated Credit Quality Step 1, and can only form 10% of the collateral pool. For the 10% limit to be waived, the MBS must be self-originated and the originator must retain the first loss piece
Loans secured by ships (60% LTV limit)
Derivatives are also permitted in certain jurisdictions to hedge specific risks,including interest and foreign exchange exposures.
Cover pools backing covered bonds are dynamic in nature, with investors essentially assuming the credit risk of the cover pool only upon issuer default.
InsolvencyCovered bonds do not necessarily accelerate on insolvency of the issuing institution. Only on the failure of the programme to make payments as and when due results in the acceleration of the obligations.
Covered bonds vs. RMBS
Mortgage-backed covered bonds and RMBS have more than a passing similarity to each other (especially when considering the market-reopening UK master trustRMBS bonds which contained an originator put at maturity). However, there are also some notable structural differences between the two products. We set out to highlight the most prominent below.
DefinitionsThe ECBC2 sets out a definition of a covered bond as follows:
‘Covered bonds are debt instruments secured by a cover pool of mortgage loans (property as collateral) or public-sector debt to which investors have a preferential claim in the event of default.’
More fully, the BIS sets out a definition of securitisation in its ‘International Convergence of Capital Markets and Capital Standards’3 document:
‘A traditional securitisation is a structure where the cash flow from an underlying pool of exposures is used to service at least two different stratified risk positions or tranches reflecting different degrees of credit risk. Payments to the investors depend upon the performance of the specified underlying exposures, as opposed to being derived from an obligation of the entity originating those exposures.’
As we can see from the above BIS definition, covered bonds fail to meet this test on a number of fronts. First, as we have already noted, cashflows from the underlying pool are not necessarily used to service the covered bonds, but rather the general resources of the issuing institution are utilised. Second, with the exception of Danish junior
2 http://ecbc.hypo.org/Objects/9/Files/ECBC%20Fact%20Book%202010.pdf3 http://www.bis.org/publ/bcbs128.pdf?noframes=1
Credit risk of the cover pool
remains with the issuer until
default, upon which it transfers to the investor
Covered bonds do not meet the
international definition of
securitisation

24
Europe Credit Research12 September 2011
Gareth Davies, CFA(44-20) [email protected]
Flavio Marco Rusconi(44-20) [email protected]
covered bonds, there are no stratified risk positions or tranches reflecting different credit risk profiles in covered bonds. Finally, payments to investors do not depend on the performance of the underlying exposures while the issuing entity remains solvent. The credit risk of the cover pool is not transferred until issuer insolvency.
AmortisationEuropean securitisation bonds typically amortise over time through the repayment of the underlying exposures (notable exceptions to this are UK credit card and UK and Dutch mortgage master trusts which offer investors soft-bullet bonds). Distributed covered bonds typically utilise a hard or soft-bullet redemption profile (there are some pass-through covered bonds, but these have typically been retained by originators for use as central bank repo collateral).
Credit enhancement & Investor protectionsCovered bonds are less structurally engineered than even the simplest type of pass-through securitisation vehicles (even setting aside the complexities of ABS master trusts). To this end, covered bonds do away with much of the credit enhancements offered to securitisation investors (subordinated tranches, reserve funds, excess spread etc). Rather, covered bond investors’ main form of credit enhancement stems from programme over-collateralisation, (which is naturally dynamic based on issuer actions, including collateral additions and the programme issuance/redemptionsprofile). Unlike in securitisations, where credit enhancement tends to increase over time as the structure delevers (barring collateral credit issues and the specific case of master trusts), over-collateralisation in covered bond programmes can increase or decrease as the programme is utilised by the issuer.
Further investor protection is provided to CB investors by tests adopted in local legislation or programme terms. For example, structured covered bond programmes (i.e. Canada, Netherlands, UK etc) typically require that the assets of the guarantor entity are subject to an Asset Coverage Test (ACT) on a regular basis. The test is designed to ensure a minimum level of over-collateralisation in the cover pool to protect investors from market and liquidity risks. The guarantor must therefore ensure that on each calculation date, the ‘Adjusted Aggregate Loan Amount’ (i.e. the aggregate loan amount haircut by predefined criteria) is at least equal to the outstanding amount of the programme’s CB. The ACT is conducted by the Cash Manager, with annual third party asset monitor reviews. Failure to remedy a breached ACT by the next calculation date usually results in an Issuer Event of Default.
Similarly, programmes from these jurisdictions also typically include an Amortisation Test (AT) which is designed to ensure that the cover pool exceeds the outstanding notional of CB at all times. The adoption of an AT serves to minimise time subordination within the structure for outstanding noteholders. Following service of a Notice to Pay on the guarantor, it must ensure that on each calculation date following an Issuer Event of Default, the Amortisation Test Aggregate Loan Amount will at least equal the aggregate outstanding amount of the CB.
Other tests offering protection to bondholders include ‘Pre-maturity Tests’ (which are designed to ensure the borrower can provide sufficient liquidity in case of downgrade (i.e. pre-defined period prior to scheduled bond redemption, if a borrower's short-term rating is below a prescribed threshold, the borrower must fund a cash collateral account to ensure redemption)); and ‘Interest Coverage Tests’ to ensure interest from the cover pool after hedges always exceeds interest payments due on the covered bonds over a given period.
Repayment profiles differ
between the two secured products
Over-collateralisation and
programme tests are the main types of credit enhancement for
CB investors
25
Europe Credit Research12 September 2011
Gareth Davies, CFA(44-20) [email protected]
Flavio Marco Rusconi(44-20) [email protected]
Rating Agencies
We set out below an overview of the ratings approaches adopted by the four agencies with respect to covered bonds. All four agencies link the rating of covered bonds to the rating of the issuing bank, providing further scope for uplift from the issuer rating based on both collateral and cover pool cashflow characteristics. We have updated the following overviews to reflect amendments from Fitch, proposed amendments from S&P, as well as adding DBRS' rating methodology.
DBRS
The following is a synopsis of the methodology used by DBRS to rate covered bonds. For a complete overview of the Agency’s approach, please see ‘Rating European Covered Bonds’, published 29th August 2011.
DBRS sees covered bonds as being akin to senior secured bank debt, therefore deploying a 'linked approach' to its ratings methodology. The ratings process is built around three steps: the rating of the issuer, an assessment of the legal & structuring framework and an assessment of the cover pool. In more detail:
Step 1 utilises the issuer's rating, seeing it as the primary source of the timely payment and ultimate repayment of a programme’s outstanding covered bonds.
Step 2 focuses on the Legal and Structuring Framework ('LSF') under which the respective covered bond programme operates. This assessment is the most significant of the three individual Steps, and once completed, determines the maximum achievable rating for a specific programme. Assigning a LSF grade requires a review of the respective legislation and the legal environment in the relevant country. Where legislation does not exist, the analysis is conducted at the individual programme term level instead. The LSF can be categorised in four assessments: Very Strong, Strong, Adequate, and Modest
Step 3 focuses on an assessment of the cover pool, following similar collateral analysis methodologies to those deployed in securitisation analysis. It is undertaken by incorporating the cover pool analysis along with reviews of hedging contracts, expected cash flows from the pool and the payment profile of the programme, as well as cashflow stress analysis.
Fitch Ratings
The following is a synopsis of the methodology used by Fitch Ratings to rate covered bonds. For a complete overview of the Agency’s approach, please see Fitch Rating’s ‘Covered Bond Rating Criteria', published 11th August 2011.
Fitch Ratings uses a three-stage process in arriving at the ratings it gives to covered bonds. First, it combines the Issuer Default Rating (IDR) with the programme’s Discontinuity Factor (D-Factor) to calculate a maximum rating on a probability of default (PD) basis. Second, it tests the programme’s overcollateralisation, and finally calculates a recovery uplift.
The D-Factor is designed to capture the level of expected difficulty in transitioning from the issuer to the cover pool, after issuer default. The D-Factor is itself derived from five separate attributes, each given a contributory weighting: Asset Segregation
All agencies use the unsecured
rating of the issuer as a rating‘s
floor for its covered bonds
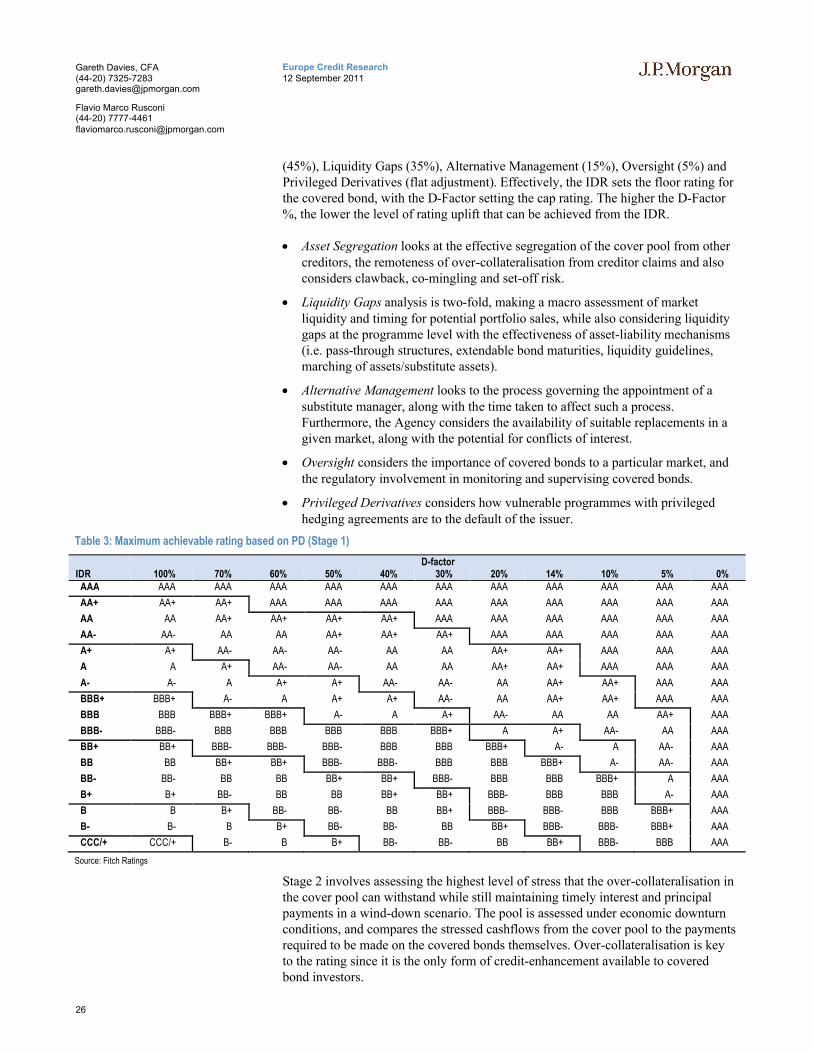
26
Europe Credit Research12 September 2011
Gareth Davies, CFA(44-20) [email protected]
Flavio Marco Rusconi(44-20) [email protected]
(45%), Liquidity Gaps (35%), Alternative Management (15%), Oversight (5%) and Privileged Derivatives (flat adjustment). Effectively, the IDR sets the floor rating for the covered bond, with the D-Factor setting the cap rating. The higher the D-Factor %, the lower the level of rating uplift that can be achieved from the IDR.
Asset Segregation looks at the effective segregation of the cover pool from other creditors, the remoteness of over-collateralisation from creditor claims and also considers clawback, co-mingling and set-off risk.
Liquidity Gaps analysis is two-fold, making a macro assessment of market liquidity and timing for potential portfolio sales, while also considering liquidity gaps at the programme level with the effectiveness of asset-liability mechanisms (i.e. pass-through structures, extendable bond maturities, liquidity guidelines, marching of assets/substitute assets).
Alternative Management looks to the process governing the appointment of a substitute manager, along with the time taken to affect such a process. Furthermore, the Agency considers the availability of suitable replacements in a given market, along with the potential for conflicts of interest.
Oversight considers the importance of covered bonds to a particular market, and the regulatory involvement in monitoring and supervising covered bonds.
Privileged Derivatives considers how vulnerable programmes with privileged hedging agreements are to the default of the issuer.
Table 3: Maximum achievable rating based on PD (Stage 1)
D-factorIDR 100% 70% 60% 50% 40% 30% 20% 14% 10% 5% 0%AAA AAA AAA AAA AAA AAA AAA AAA AAA AAA AAA AAA
AA+ AA+ AA+ AAA AAA AAA AAA AAA AAA AAA AAA AAA
AA AA AA+ AA+ AA+ AA+ AAA AAA AAA AAA AAA AAA
AA- AA- AA AA AA+ AA+ AA+ AAA AAA AAA AAA AAA
A+ A+ AA- AA- AA- AA AA AA+ AA+ AAA AAA AAA
A A A+ AA- AA- AA AA AA+ AA+ AAA AAA AAA
A- A- A A+ A+ AA- AA- AA AA+ AA+ AAA AAA
BBB+ BBB+ A- A A+ A+ AA- AA AA+ AA+ AAA AAA
BBB BBB BBB+ BBB+ A- A A+ AA- AA AA AA+ AAA
BBB- BBB- BBB BBB BBB BBB BBB+ A A+ AA- AA AAA
BB+ BB+ BBB- BBB- BBB- BBB BBB BBB+ A- A AA- AAA
BB BB BB+ BB+ BBB- BBB- BBB BBB BBB+ A- AA- AAA
BB- BB- BB BB BB+ BB+ BBB- BBB BBB BBB+ A AAA
B+ B+ BB- BB BB BB+ BB+ BBB- BBB BBB A- AAA
B B B+ BB- BB- BB BB+ BBB- BBB- BBB BBB+ AAA
B- B- B B+ BB- BB- BB BB+ BBB- BBB- BBB+ AAA
CCC/+ CCC/+ B- B B+ BB- BB- BB BB+ BBB- BBB AAA
Source: Fitch Ratings
Stage 2 involves assessing the highest level of stress that the over-collateralisation in the cover pool can withstand while still maintaining timely interest and principal payments in a wind-down scenario. The pool is assessed under economic downturn conditions, and compares the stressed cashflows from the cover pool to the payments required to be made on the covered bonds themselves. Over-collateralisation is key to the rating since it is the only form of credit-enhancement available to covered bond investors.

27
Europe Credit Research12 September 2011
Gareth Davies, CFA(44-20) [email protected]
Flavio Marco Rusconi(44-20) [email protected]
Fitch gives credit for over-collateralisation in the following order: contractual commitments, if legally binding and enforceable; non-contractual public statements and covenants; and issuer’s internal guidelines. For issuers without any of the above:
For institutions rated at least F2, the lowest level of over-collateralisation during the last twelve months
For institutions rated F3 or below, the minimum level of over-collateralisation required by legislation
To achieve this analysis, the Agency runs scenario analysis from the highest achievable rating under Stage 1, down to the IDR. If over-collateralisation is insufficient to avoid a payment default on the covered bonds in the first scenario at the cap rating, the test is re-run again at each rating down to the IDR. The first rating where over-collateralisation is sufficient to support the payments required under the programme, is the rating under Stage 2.
Stage 3 is to recognise the positive impact of higher recoveries from the underlying collateral in the cover pool. Recoveries are calculated by comparing the NPV of cashflows from the cover pool against the NPV of privileged liabilities (the covered bonds themselves along with privileged swaps).
Table 4: Maximum uplift from Step 1 due to recovery considerations
Recovery range (in %) Investment grade Non-IGOutstanding 91-100 +2 +3
Superior 71-90 +1 +2Good 51-70 +1 +1
Average 31-50 - -Below average 11-30 -1 -1
Poor 0-10 -1/-2 -2/-3
Source: Fitch Ratings
Criteria for CB secured on commercial real estate loans
Fitch believes that the risks inherent in pools, whether wholly or partially backed by commercial real estate exposures, are significant enough to warrant specific analysis when rating programmes. These analysis steps form part of its overall covered bond rating process defined above.
DefinitionsFitch defines loans as commercial real estate exposures if they are secured on property types which include office, retail or industrial, alongside exposures to multi-family housing units and more specialised property types such as hotels. Multi-property (>4 units) buy-to-let loans are also considered under this approach.
ApproachFitch requires loan level data analysis to be conducted to most accurately capture the risk of commercial property portfolios. Should loan level data be unavailable, the Agency will apply the most conservative assumptions when modeling. Calculations are then conducted on the default likelihood and recovery rate of each exposure, and rolled up into a total commercial property default and recovery rating.

28
Europe Credit Research12 September 2011
Gareth Davies, CFA(44-20) [email protected]
Flavio Marco Rusconi(44-20) [email protected]
Moody’s
The following is a synopsis of the methodology used by Moody’s to rate covered bonds. For a complete overview of the Agency’s approach, please see ‘Moody’s Rating Approach to Covered Bonds’, published 4th March 2010.
Moody’s employs a joint default methodology, capturing both the credit strength of the issuing bank along with that of the cover pool. The rating of the issuing bank is the starting point of the Agency’s analysis, with the final rating of the covered bond programme determined by the quality of the collateral pool, the strength of the legal framework under which the programme is issued, and any other pertinent contractual commitments. Similar to its approach to other asset classes, the Agency uses an Expected Loss approach, combining the issuer PD based on the senior unsecured rating and the expected LGD to CB investors in the event of such a default.
Moody’s uses a four-stage process for determining its covered bond ratings, looking first at the rating of the issuer, followed by consideration around the credit quality of the cover pool, modeling refinancing risks and finally computing market risks.
Similar to the approach of the other agencies, analysis starts at the rating of the issuer. Step 2 results in the analysis of the pool on either a loan-by-loan or stratified basis. A collateral score is given to act as a guide to the strength of the cover pool, considering the amount of collateral that can be refinanced at different rating levels and the amount of collateral written off on issuer default. The higher the collateral score, the higher the risk-free credit enhancement required by the programme (i.e. a lower collateral score implies higher collateral quality). Collateral scores can be reduced based on the (lower) correlation between the cover pool and the issuer itself.
Step 3 involves the modeling of refinancing risks, owing to the fact that natural amortisation of the pool is likely to be insufficient to meet the repayment profile of the programme. Moody’s looks to the securitisation market to calculate the discount that should be applied to the cover pool when calculating a stress refinancing margin. Finally, under Step 4, the agency looks to calculate market risks post-default of the issuer.
Moody’s also utilises a metric called the Timely Payment Indicator (or TPI), which is used in conjunction with the issuer’s rating to calculate the final covered bond programme rating. The TPI is designed to capture an assessment of the timeliness of payment of interest and principal following issuer default. TPI drivers are split over five categories, as follows:
Legislation/contract considerations
Hedging considerations
Asset type considerations
Nature of liabilities considerations
Other considerations

29
Europe Credit Research12 September 2011
Gareth Davies, CFA(44-20) [email protected]
Flavio Marco Rusconi(44-20) [email protected]
Table 5: Maximum achievable rating based onTPI
TPISponsor rating Very improbable Improbable Probable Probable-High High Very HighA1 Aaa Aaa Aaa Aaa Aaa Aaa
A2 Aa1 Aa1 Aaa Aaa Aaa Aaa
A3 Aa2 Aa2 Aaa Aaa Aaa Aaa
Baa1 Aa3 Aa3 Aa1 Aa1 Aaa Aaa
Baa2 A1 A1 Aa2 Aa2 Aa1 Aaa
Baa3 A3 A2 A1 Aa3 Aa2 Aa1
Ba1 Baa3 Baa2 Baa1 A3 A2 A1
Ba2 Baa3 Baa2 Baa1 A3 A2 A1
Ba3 Baa3 Baa2 Baa1 A3 A2 A1
B1 Ba3 Ba2 Ba1 Baa3 Baa2 Baa1
B2 Ba3 Ba2 Ba1 Baa3 Baa2 Baa1
B3 Ba3 Ba2 Ba1 Baa3 Baa2 Baa1
Source: Moody’s
Standard & Poor’s
The following is a synopsis of the methodology used by Standard & Poor’s to rate covered bonds. For a complete overview of the Agency’s approach, please see ‘Revised Methodology And Assumptions For Assessing Asset-Liability Mismatch Risk In Covered Bonds’, published 16th December 2009.
Figure 22: S&P covered bond ratings approach
Source: Standard and Poor’s
S&P’s ratings methodology uses a five-stage process to calculate a programme’s ultimate rating. First the Agency looks to calculate a programme’s maximum ALMM (asset liability mismatch) along with its timing, then under Stage 2 segregates programmes based on their issuance jurisdiction. The ALMM classification is determined as the maximum cumulative net ALMM as a percentage of outstanding liabilities. To calculate the ALMM, S&P stresses the periodic cashflows from the collateral pool and compares these to the stressed outflows of the programme. The net difference (‘net stressed periodic cashflow’) is then scaled based on its timing. The ALMM percentage is then calculated as the maximum cumulative scaled ALMM amount, divided by the outstanding balance of programme liabilities. Based
ALMM Classification
Programme Categorisation
Maximum Potential
CB rating
Cashflow & Market Value
Analysis
CB Rating
Asset Risk Cashflow
Risk
Legal Risk Operational &
Administrative
Risk
Counterparty
Risk
Zero
Low
Moderate
HighCategory 1
Category 2
Category 3Category 1 2 3
Zero Unrestricted
Low 7 6 5
Moderate 6 5 4
High 5 4 3
Max. #
notc
hes
Determine target credit enhancement to
achieve maximum potential ratings uplift
Compare target credit enhancement with
available credit enhancement
1
2
3
4
5
ALMM Classification
Programme Categorisation
Maximum Potential
CB rating
Cashflow & Market Value
Analysis
CB Rating
Asset Risk Cashflow
Risk
Legal Risk Operational &
Administrative
Risk
Counterparty
Risk
Zero
Low
Moderate
HighCategory 1
Category 2
Category 3Category 1 2 3
Zero Unrestricted
Low 7 6 5
Moderate 6 5 4
High 5 4 3
Max. #
notc
hes
Determine target credit enhancement to
achieve maximum potential ratings uplift
Compare target credit enhancement with
available credit enhancement
1
2
3
4
5
Table 6: Scaling factorsTiming of mismatch
Scaling factor
0-1yr 100%1-2y 95%2-3y 90%3-4y 85%4-5y 80%5-6y 75%6-7y 70%7-8y 65%8-9y 60%9-10y 55%>10y 50%Source: Standard & Poor’s

30
Europe Credit Research12 September 2011
Gareth Davies, CFA(44-20) [email protected]
Flavio Marco Rusconi(44-20) [email protected]
on the calculated percentage, the programme will sit in one of four available classification buckets.
Table 7: ALMM classifications and potential maximum uplift
ALMM Classification ALMM Percentage Max. Potential UpliftZero N/A UnrestrictedLow <15% 5-7 notchesModerate 15-30% 4-6 notchesHigh >30% 3-5 notches
Source: Standard & Poor’s
Rated covered bonds will therefore benefit from a minimum three notch uplift over the issuer’s own rating, and a maximum seven notch upgrade. For programmeswithout ALMM risk, such as pass-through bonds, a covered bond’s rating is unconstrained by the issuer’s rating.
Step 2 allocates programmes into one of three categories based primarily on their jurisdiction of issuance.
Table 8: Programme categorisation
Category 1 Category 2 Category 3Range of funding options Can raise funds from both
asset sales and borrowing. No restrictions on when or how funds can be raised
Can raise funds either through asset sales or borrowing. No restrictions on when or how funds can be raised
Access to funding is restricted so sale of assets is forced
Strength of funding sources
Long, well-established history for the CB market. Systematic importance is high. Broad range of banks able to lend, and adequate investor demand among a broad range of investors for the assets backing the programme
Limited history for the CB market. Not as systematic as Category 1. Broad range of banks able to lend, and adequate investor demand among a broad range of investors for the assets backing the programme
Newly established CB market. Systematic importance is low. Uncertain investor demand among a broad range of investors for the assets backing the programme
Jurisdictions Denmark; France (OFs); Germany; Spain, Sweden
Canada; Finland; France (structured CB); Ireland; Italy; Luxembourg; Netherlands; Norway; Portugal; UK
Greece; US
Maximum potential ratings uplift
5 to 7 4 to 6 3 to 5
Range of funding options Can raise funds from both asset sales and borrowing. No restrictions on when or how funds can be raised
Can raise funds either through asset sales or borrowing. No restrictions on when or how funds can be raised
Access to funding is restricted so sale of assets is forced
Source: Standard & Poor’s
Step 3 sees the combination of ALMM Classification (Stage 1) and Programme Categorisation (Stage 2), giving the maximum potential covered bond rating.
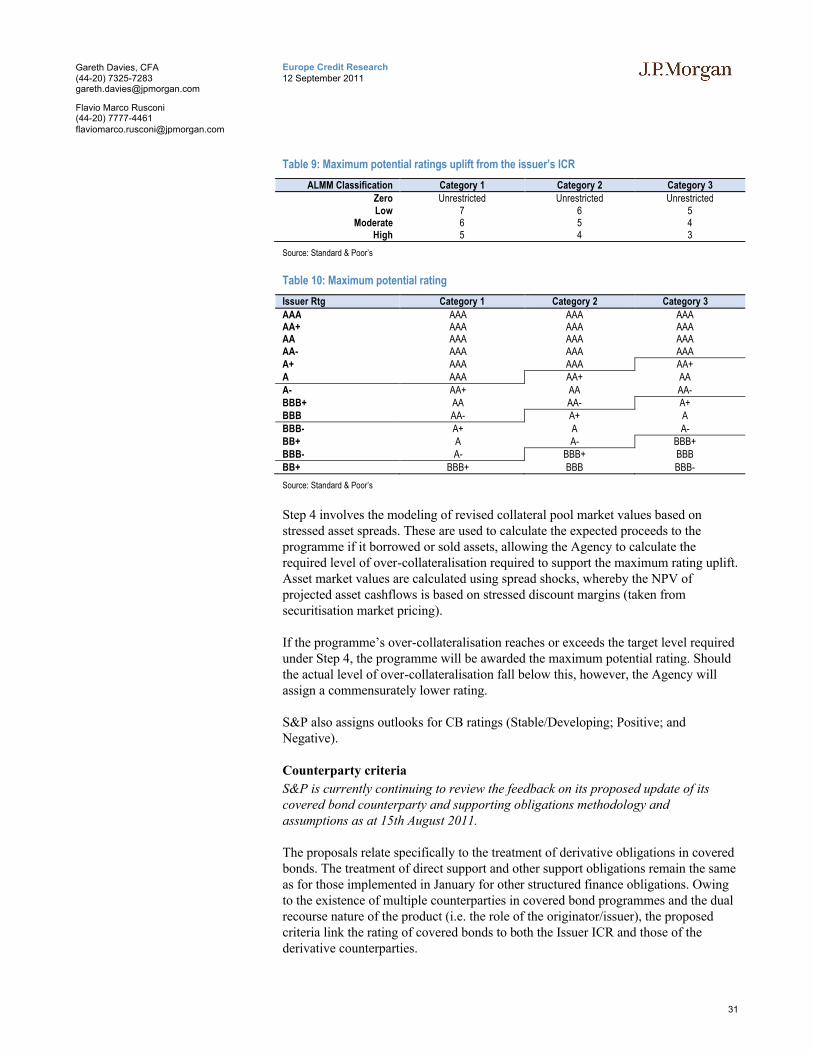
31
Europe Credit Research12 September 2011
Gareth Davies, CFA(44-20) [email protected]
Flavio Marco Rusconi(44-20) [email protected]
Table 9: Maximum potential ratings uplift from the issuer’s ICR
ALMM Classification Category 1 Category 2 Category 3Zero Unrestricted Unrestricted UnrestrictedLow 7 6 5
Moderate 6 5 4High 5 4 3
Source: Standard & Poor’s
Table 10: Maximum potential rating
Issuer Rtg Category 1 Category 2 Category 3
AAA AAA AAA AAAAA+ AAA AAA AAAAA AAA AAA AAAAA- AAA AAA AAAA+ AAA AAA AA+A AAA AA+ AAA- AA+ AA AA-BBB+ AA AA- A+BBB AA- A+ ABBB- A+ A A-BB+ A A- BBB+BBB- A- BBB+ BBBBB+ BBB+ BBB BBB-
Source: Standard & Poor’s
Step 4 involves the modeling of revised collateral pool market values based on stressed asset spreads. These are used to calculate the expected proceeds to the programme if it borrowed or sold assets, allowing the Agency to calculate the required level of over-collateralisation required to support the maximum rating uplift. Asset market values are calculated using spread shocks, whereby the NPV of projected asset cashflows is based on stressed discount margins (taken from securitisation market pricing).
If the programme’s over-collateralisation reaches or exceeds the target level required under Step 4, the programme will be awarded the maximum potential rating. Should the actual level of over-collateralisation fall below this, however, the Agency will assign a commensurately lower rating.
S&P also assigns outlooks for CB ratings (Stable/Developing; Positive; and Negative).
Counterparty criteria
S&P is currently continuing to review the feedback on its proposed update of its covered bond counterparty and supporting obligations methodology and assumptions as at 15th August 2011.
The proposals relate specifically to the treatment of derivative obligations in covered bonds. The treatment of direct support and other support obligations remain the same as for those implemented in January for other structured finance obligations. Owing to the existence of multiple counterparties in covered bond programmes and the dual recourse nature of the product (i.e. the role of the originator/issuer), the proposed criteria link the rating of covered bonds to both the Issuer ICR and those of the derivative counterparties.
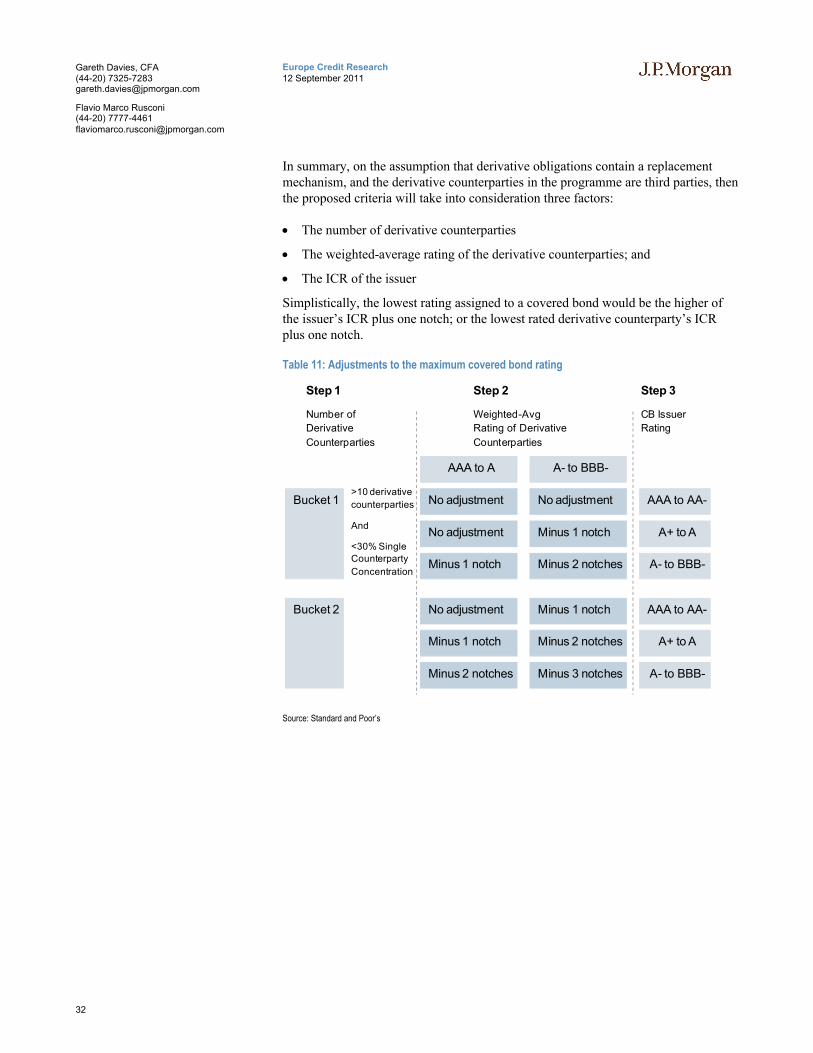
32
Europe Credit Research12 September 2011
Gareth Davies, CFA(44-20) [email protected]
Flavio Marco Rusconi(44-20) [email protected]
In summary, on the assumption that derivative obligations contain a replacement mechanism, and the derivative counterparties in the programme are third parties, then the proposed criteria will take into consideration three factors:
The number of derivative counterparties
The weighted-average rating of the derivative counterparties; and
The ICR of the issuer
Simplistically, the lowest rating assigned to a covered bond would be the higher of the issuer’s ICR plus one notch; or the lowest rated derivative counterparty’s ICR plus one notch.
Table 11: Adjustments to the maximum covered bond rating
Source: Standard and Poor’s
No adjustment No adjustment
No adjustment Minus 1 notch
Minus 1 notch Minus 2 notches
No adjustment Minus 1 notch
Minus 1 notch Minus 2 notches
Minus 2 notches Minus 3 notches
AAA to AA-
A+ to A
A- to BBB-
AAA to AA-
A+ to A
A- to BBB-
AAA to A A- to BBB-
Bucket 1
Bucket 2
>10 derivative
counterparties
And
<30% Single
Counterparty
Concentration
Step 1
Number of
Derivative
Counterparties
Step 2
Weighted-Avg
Rating of Derivative
Counterparties
Step 3
CB Issuer
Rating

33
Europe Credit Research12 September 2011
Gareth Davies, CFA(44-20) [email protected]
Flavio Marco Rusconi(44-20) [email protected]
Issu
er
Pro
file
s

34
Europe Credit Research12 September 2011
Gareth Davies, CFA(44-20) [email protected]
Flavio Marco Rusconi(44-20) [email protected]

35
Europe Credit Research12 September 2011
Gareth Davies, CFA(44-20) [email protected]
Flavio Marco Rusconi(44-20) [email protected]
Au
str
ian
Co
ve
red
Bo
nd
s

36
Europe Credit Research12 September 2011
Gareth Davies, CFA(44-20) [email protected]
Flavio Marco Rusconi(44-20) [email protected]
Austrian Covered Bonds
Legislative snapshot
We set out in Table 12 a snapshot of key covered bond attributes in Austria.
Table 12: Austrian Covered Bond legislative overview
Attribute CommentaryFrameworkLegislative Framework Three different frameworks for covered bond issuance: Mortgage Banking Law of 1899
(Hypothekenbankgesetz); Law on Secured Bank Bonds (Gesetz betrffend fundierte Bankschuldverschreibungen (FBS) 1905) and Mortgage Bond Act (Pfandbriefgesetz as amended 2005).
Types of covered bonds The current framework gives the option to issue two types of covered bonds: Pfandbriefe are issued under the Mortgage Banking and Mortgage Bond Acts that apply to commercial and public sector banks; Fundierte Bankschuldverschreibungen (FBS) are issued under the Law of Secured Bank Bonds, which applies to all other issuers. There are mortgage-backed bonds and public sector-backed bonds.
Structure of Issuer Direct issuance? Yes, the bonds are issued directly off the balance sheet of the issuer. Comments (if any) The issuer does not necessarily have to be the originator under the Pfandbriefe framework and assets
originated outside the issuer can be included. ABS and MBS are not allowed as collateral.Bankruptcy remoteness Issuers are required to record assets backing the bonds in the cover register. Dual claim Yes, pari passu with unsecured creditors. Bond format Generally fixed rate (although there are small size floating rate issues) bullets. Supervision Financial Market Authority and Ministry of Finance, along with both a primary and secondary (back-up)
trustee. For FBS, the collateral pool is monitored by a government commissioner.Cover pool
Eligible assets Mortgage The property must be located in Austria, EEA or Switzerland. Residential, commercial and agricultural loans allowed under Pfandbriefe. The preferential claim of the cover bonds must be recognised by the local laws; if not, there is a 10% limit on collateral from that jurisdiction.
LTV caps For FBS it s according to the statutes, although in practice this is 60%. For Pfandbriefe it is 60% LTV soft cap.
Public Sector Exposures to public sector entities located in Austria, other EEA or Switzerland with maximum risk weighting of 20%. FBS may also include bonds with “Mundelgelder” (“safe bond”) status.
Non-performing collateral Not given credit towards OC calculations. Substitution Assets Cash, credit institution debt, assets available for use at the ECB, public sector debt from acceptable
jurisdictions (see above) are available for use as substitution assets, up to a cap of 15%.Hedging Derivatives are only allowed for hedging of market, interest and FX risk. Valuation Individual market values. The issuer monitors the property value and regular audits are undertaken. The
valuation of the property cannot exceed its resale value and valuation guidelines need to be approved by the regulator.
Other comments (if any)
Requirements
ALM matching Asset coverage Natural matching and stress testing. Pfanbriefe use nominal cover, while FBS uses nominal cover as a min but can be replaced by NPV cover. Minimum 2% OC has to be maintained.
Interest coverage Interest income from the assets must at least cover interest paid on the bonds. Other (if any)
Consequence of breach Regulatory or rule-based actions. Monitoring Periodic reporting required. The cover pool monitor performs audits on the pool, verifies any breach of
coverage test and has reporting duties to the supervisory authority.Other
Compliance with EU legislation
Both types of bonds are UCITS and CRD compliant.
Source: National legislation, J.P. Morgan Covered Bond Research

37
Europe Credit Research12 September 2011
Gareth Davies, CFA(44-20) [email protected]
Flavio Marco Rusconi(44-20) [email protected]
Austrian covered bond & macro backdrop
Figure 23: CB issuance, €mm
Source: ECBC. Latest data available displayed
Figure 24: CB outstanding, €mm
Source: ECBC. Latest data available displayed
Figure 25: Austrian real GDP growth, y-on-y, %
Source: Bloomberg
Figure 26: Austrian unemployment level, %
Source: Bloomberg
Figure 27: Austrian CPI and base rate, %
Source: Bloomberg
Figure 28: Austrian consumer confidence, balance of survey
Source: Bloomberg
Figure 29: Austrian outstanding mortgage stock (€mm) and annual change, % (RHS)
Source: ECB
Figure 30: Austrian average mortgage rate, %
Source: ECB
0
2,000
4,000
6,000
8,000
10,000
12,000
14,000
2003 2004 2005 2006 2007 2008 2009 2010
Mortgage Public Sector
0
5,000
10,000
15,000
20,000
25,000
30,000
2003 2004 2005 2006 2007 2008 2009 2010
Mortgage Public Sector
-8
-6
-4
-2
0
2
4
6
Mar
-00
Mar
-01
Mar
-02
Mar
-03
Mar
-04
Mar
-05
Mar
-06
Mar
-07
Mar
-08
Mar
-09
Mar
-10
Mar
-11
Real GDP growth
0
1
2
3
4
5
6
Mar
-00
Mar
-01
Mar
-02
Mar
-03
Mar
-04
Mar
-05
Mar
-06
Mar
-07
Mar
-08
Mar
-09
Mar
-10
Mar
-11
Unemployment
-1
0
1
2
3
4
5
Mar
-01
Mar
-02
Mar
-03
Mar
-04
Mar
-05
Mar
-06
Mar
-07
Mar
-08
Mar
-09
Mar
-10
Mar
-11
Inflation Base rate
-25-20-15-10-505
101520
Mar
-00
Mar
-01
Mar
-02
Mar
-03
Mar
-04
Mar
-05
Mar
-06
Mar
-07
Mar
-08
Mar
-09
Mar
-10
Mar
-11
Cons. Confidence
0%
5%
10%
15%
20%
25%
30%
010,00020,00030,00040,00050,00060,00070,00080,00090,000
Dec
-02
Jun-
03
Dec
-03
Jun-
04
Dec
-04
Jun-
05
Dec
-05
Jun-
06
Dec
-06
Jun-
07
Dec
-07
Jun-
08
Dec
-08
Jun-
09
Dec
-09
Jun-
10
Dec
-10
Jun-
11
Outstanding mortgage stock Annual change in mtge stock (RHS)
0
1
2
3
4
5
6
7
Jan-
03
Jul-0
3
Jan-
04
Jul-0
4
Jan-
05
Jul-0
5
Jan-
06
Jul-0
6
Jan-
07
Jul-0
7
Jan-
08
Jul-0
8
Jan-
09
Jul-0
9
Jan-
10
Jul-1
0
Jan-
11
Avg mortgage rate

38
Europe Credit Research12 September 2011
Gareth Davies, CFA(44-20) [email protected]
Flavio Marco Rusconi(44-20) [email protected]
BAWAG PSK
(BBG: BAWAG)Snapshot
Bank für Arbeit und Wirtshaft (BAWAG) PSK is one of the largest banking groups in Austria and is mostly focused on retail finance and deposit-taking.
BAWAG and PSK were founded as separate entities; in 2000 BAWAG acquired PSK, creating the third largest banking group in Austria at the time and the most extensive centrally managed distribution network in the country.
In 2004, the Austrian Trade Union acquired the remaining non-Austrian-owned 46% stake in the bank from Bayern LB but it was forced to sell in October 2005, following the collapse of Refco, a broker that was used to hide significant losses in derivatives transactions. The bank subsequently received a support package in order to avoid defaulting. In 2007, the bank was sold to Cerberus and a consortium of lenders and insurers.
In 2009, in exchange for an increase in capital and a guarantee for certain assets by the Republic of Austria, the bank agreed to provide lending to SMEs and households for a total of €1.7bn over three years.
Financial performance
We set out below some of the key financial performance metrics:
Table 13: Key profit & loss figures, €mm
FY 2008 FY 2009 FY 2010Net interest income 653 564 650Provisions for loan losses 281 237 200NII less provisions 371 328 450
Comm.& fee income 144 155 159Other operating income 14 30 -4Non-interest expense 684 608 618Operating profit -751 230 154
PBT -804 222 149Taxes -89 57 13Net profit (loss) -548 165 137
Source: Bloomberg
Table 14: Key balance sheet figures, €mm
FY 2008 FY 2009 FY 2010Loans 20,697 21,066 22,288 Total Assets 41,578 41,225 38,556 Deposits 22,585 22,674 21,733 Short-term borrowings 3,268 6,811 6,290 Other short-term borrowings 3,312 3,017 3,169 Long-term borrowings 10,957 6,371 4,900 Equity 1,326 2,292 2,424
Source: Bloomberg
Table 15: Select financial metrics
FY 2008 FY 2009 FY 2010
ROA -1.3 0.4 0.3ROE -37.9 10.8 6.9ROC -5.6 1.1 0.9C:I 318.9 56.6 63.6
Source: Bloomberg
Cover pool overview
We set out below some of the key cover pool characteristics:
Table 16: Covered bond characteristics
As at April 2011Ratings S/M/FCovered Bond rating -/Aa1/-Issuer rating -/Baa2/-
Cover poolCover pool size (€) 3,408,000,000Bonds outstanding (€bn) 2,527,000,000Nominal OC (%) 28.0Mandatory OC (%) 15.5
Currency split (%)EUR 91.0CHF 9.0
Debtor distribution (in %)Municipalities 70.0Republic of Austria 25.0Federal States 5.0
Ratings split (%)AAA 54.5AA 32.5 A 9.4 BBB and below 3.6
Source: Investor report

39
Europe Credit Research12 September 2011
Gareth Davies, CFA(44-20) [email protected]
Flavio Marco Rusconi(44-20) [email protected]
Erste Bank Group
(BBG: ERSTBK)Snapshot
The Erste Bank Group operates across eight markets in Central and Eastern Europe, with over 17 million customers, of which 95% are EU residents. Through the acquisition of 10 local banks between 1997 and 2007 it has significantly increased its presence in 8 Central and Eastern European jurisdictions.
The group is primarily a savings bank and uses deposits to finance the majority of its lending activities: the bank relies on deposits for 60% of its funding needs and has a loan-to-deposits ratio of 111%.
Erste issues both mortgage and public-sector-backed Pfandbriefe.
Financial performance
We set out below some of the key financial performance metrics:
Table 17: Key profit & loss figures, €mm
FY 2008 FY 2009 FY 2010Net interest income 4,892 5,208 5,391Provisions for loan losses 1,071 2,057 2,031NII less provisions 3,820 3,152 3,360
Comm.& fee income 2,426 2,320 2,488Other operating income 217 185 140Non-interest expense 4,885 4,856 4,949Operating profit (loss) 1,123 1,288 1,494
PBT 576 1,261 1,515Taxes 177 285 329Net profit (loss) 860 903 1,015
Source: Bloomberg
Table 18: Key balance sheet figures, €mm
FY 2008 FY 2009 FY 2010Commercial Loans 70,000 70,296 70,526 Consumer Loans 49,753 51,702 54,364 Other Loans 6,432 7,136 7,839 Total Assets 201,441 201,710 205,938 Deposits 109,305 112,042 117,016 Short-term borrowings 38,971 27,683 22,304 Other ST borrowings 7,940 9,488 12,631 Long-term borrowings 26,185 34,372 30,709 Equity 11,095 16,123 17,129
Source: Bloomberg
Table 19: Select financial metrics
FY 2008 FY 2009 FY 2010NIM 2.7 2.8 2.9ROA 0.4 0.4 0.5ROE 10.4 8.7 7.7ROC 1.3 1.3 1.6C:I 66.9 56.3 55.5Core capital 7.2 10.8 11.8
Source: Bloomberg
Cover pool overview
We set out below some of the key cover pool characteristics:
Table 20: Covered bond characteristics
Public-sectorAs at June 2011
MortgageAs at June 2011
Ratings S/M/F S/M/FCovered Bond rating -/Aaa/- -/Aaa/-Issuer rating A/A1/A A/A1/A
Cover poolCover pool size (€) 3,518,185,014 7,124,153,368Outstanding CB (€) 2,826,602,922 5,358,027,905Nominal OC (%) 24.5 33.0Number of loans 6,442 38,067Avg loan size (€) 2,013,748 226,471
WA original LTV (in %) 50.1Remaining tenor (yrs) 14.2 17.1WA seasoning (yrs) 4.5 6.0Fixed rate assets (in %) 21.3 10.8
Geographical split (in %)Austria – Vienna 20.0 32.0Austria – Lower Austria 20.0 18.0Austria – Styria 16.0 16.0Austria – Other 37.2 27.2Germany 2.0 6.7Other Europe 0.0 0.1
Property type (in %)Private housing 36.0Subsidised tenant associations
22.0
Commercial housing 16.0Commercial properties 26.0
Borrower type (in %)Municipalities 36.0Provinces 22.0Guaranteed by Provinces 17.0G.teed by Municipalities 14.0
Source: Investor report

40
Europe Credit Research12 September 2011
Gareth Davies, CFA(44-20) [email protected]
Flavio Marco Rusconi(44-20) [email protected]
HYPO NOE Gruppe
(BBG: NDOLB)Snapshot
The HYPO NOE Gruppe is one of Austria’s largest state banks and the bank’s sole owner is the State of Lower Austria, rated Aaa by Moody’s. The group focuses mostly on providing public sector and real estate finance in Lower Austria but is increasingly active in the rest of Austria and abroad, particularly in Germany and CEE countries.
The HYPONOE group operates along three business lines: HYPO NOE Landesbank is a universal bank with private and corporate clients in Lower Austria and Vienna. HYPO NOE Real Consult and HYPO NOE Leasing are regional market leaders in the real estate and public finance sectors.
Currently 50% of the funding needs of the bank are satisfied on the debt capital markets, with another 41% coming from customers and credit institutions deposits. Going forward HYPO NOE expects to rely more significantly on public sector covered bonds for the funding of its lending activities.
Financial performance
We set out below some of the key financial performance metrics:
Table 21: Key profit & loss figures, €mm
FY 2009 FY 2010Net interest income 139 135Provisions for loan losses 34 18NII less provisions 105 117
Comm.& fee income 10 10Other operating income 4 -48Non-interest expense 77 82
PBT 25 8Taxes 5 1Net profit (loss) 20 7
Source: Annual report 2010
Table 22: Key balance sheet figures, €mm
FY 2009 FY 2010Real Estate Loans 1,154 1,217Commercial Loans 2,113 1,565Consumer Loans 5,314 6,096Other Loans 1,154 1,217Total Assets 11,645 12,004Deposits 2,461 2,327Short-term borrowings 3,065 2,624Long-term borrowings 6,011 5,945Equity 404 382
Source: Annual report 2010
Table 23: Select financial metrics
FY 2009 FY 2010ROE 5.4 1.8C:I 57.3 76.4Core capital 11.1 11.5
Source: Annual report 2010
Cover pool overview
We set out below some of the key cover pool characteristics:
Table 24: Covered bond characteristics
As at April 2011Ratings S/M/FCovered Bond rating -/Aaa/-Issuer rating A/-/-
Cover poolCover pool size (€) 2,976,864,895Bonds outstanding (€bn) 1,922,646,234Nominal OC (%) 51.8
Geographical split (in %)Austria 94.8Hungary 5.2
Debtor distribution (in %)Guaranteed by Federal States 60.9Federal States 17.7Municipalities 11.6Guaranteed by Municipalities 4.5Other 5.3
Source: Investor report
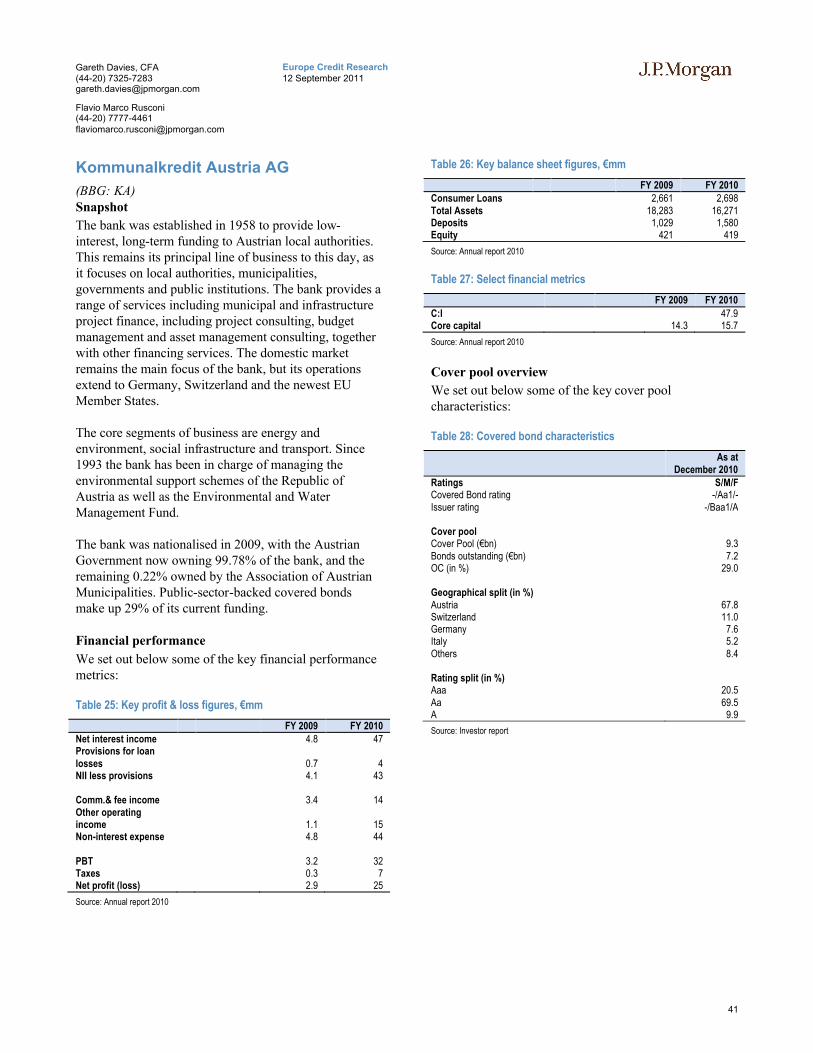
41
Europe Credit Research12 September 2011
Gareth Davies, CFA(44-20) [email protected]
Flavio Marco Rusconi(44-20) [email protected]
Kommunalkredit Austria AG
(BBG: KA)Snapshot
The bank was established in 1958 to provide low-interest, long-term funding to Austrian local authorities. This remains its principal line of business to this day, as it focuses on local authorities, municipalities, governments and public institutions. The bank provides a range of services including municipal and infrastructure project finance, including project consulting, budget management and asset management consulting, together with other financing services. The domestic market remains the main focus of the bank, but its operations extend to Germany, Switzerland and the newest EU Member States.
The core segments of business are energy and environment, social infrastructure and transport. Since 1993 the bank has been in charge of managing the environmental support schemes of the Republic of Austria as well as the Environmental and Water Management Fund.
The bank was nationalised in 2009, with the Austrian Government now owning 99.78% of the bank, and the remaining 0.22% owned by the Association of Austrian Municipalities. Public-sector-backed covered bonds make up 29% of its current funding.
Financial performance
We set out below some of the key financial performance metrics:
Table 25: Key profit & loss figures, €mm
FY 2009 FY 2010Net interest income 4.8 47Provisions for loan losses 0.7 4NII less provisions 4.1 43
Comm.& fee income 3.4 14Other operating income 1.1 15Non-interest expense 4.8 44
PBT 3.2 32Taxes 0.3 7Net profit (loss) 2.9 25
Source: Annual report 2010
Table 26: Key balance sheet figures, €mm
FY 2009 FY 2010Consumer Loans 2,661 2,698 Total Assets 18,283 16,271 Deposits 1,029 1,580 Equity 421 419
Source: Annual report 2010
Table 27: Select financial metrics
FY 2009 FY 2010
C:I 47.9Core capital 14.3 15.7
Source: Annual report 2010
Cover pool overview
We set out below some of the key cover pool characteristics:
Table 28: Covered bond characteristics
As at December 2010
Ratings S/M/FCovered Bond rating -/Aa1/-Issuer rating -/Baa1/A
Cover poolCover Pool (€bn) 9.3 Bonds outstanding (€bn) 7.2 OC (in %) 29.0
Geographical split (in %)Austria 67.8 Switzerland 11.0 Germany 7.6 Italy 5.2 Others 8.4
Rating split (in %)Aaa 20.5 Aa 69.5 A 9.9
Source: Investor report
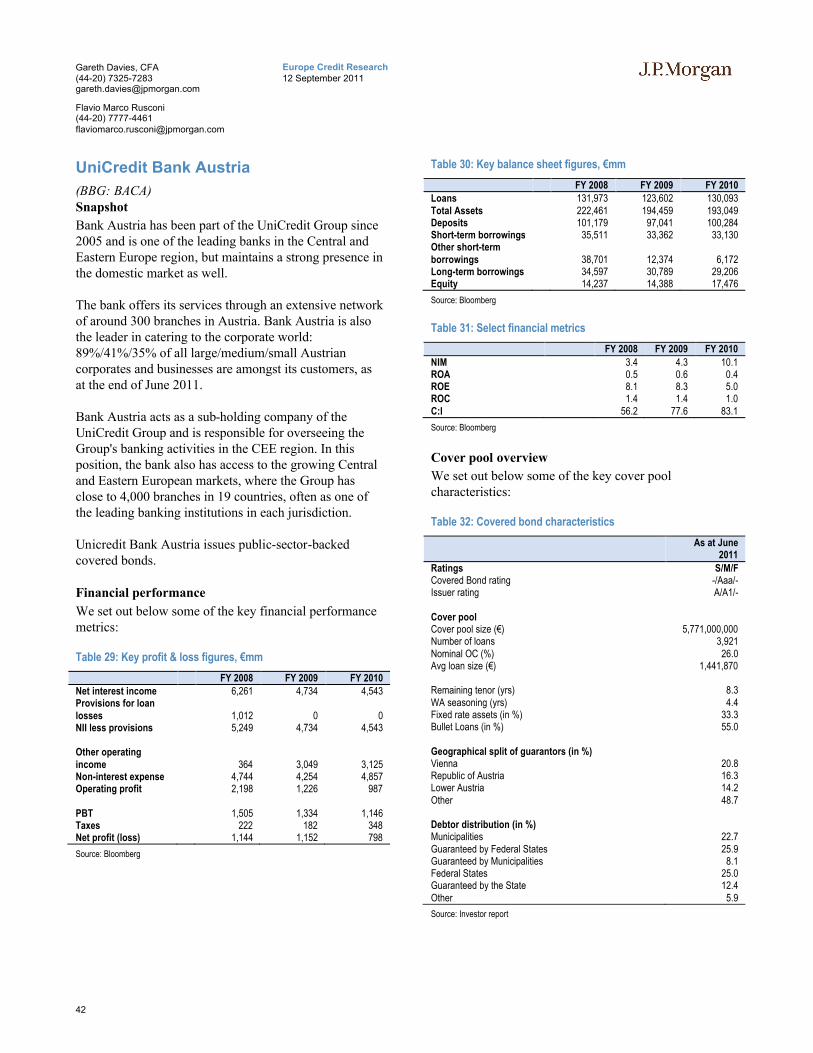
42
Europe Credit Research12 September 2011
Gareth Davies, CFA(44-20) [email protected]
Flavio Marco Rusconi(44-20) [email protected]
UniCredit Bank Austria
(BBG: BACA)Snapshot
Bank Austria has been part of the UniCredit Group since 2005 and is one of the leading banks in the Central and Eastern Europe region, but maintains a strong presence in the domestic market as well.
The bank offers its services through an extensive network of around 300 branches in Austria. Bank Austria is also the leader in catering to the corporate world: 89%/41%/35% of all large/medium/small Austrian corporates and businesses are amongst its customers, as at the end of June 2011.
Bank Austria acts as a sub-holding company of the UniCredit Group and is responsible for overseeing the Group's banking activities in the CEE region. In this position, the bank also has access to the growing Central and Eastern European markets, where the Group has close to 4,000 branches in 19 countries, often as one of the leading banking institutions in each jurisdiction.
Unicredit Bank Austria issues public-sector-backed covered bonds.
Financial performance
We set out below some of the key financial performance metrics:
Table 29: Key profit & loss figures, €mm
FY 2008 FY 2009 FY 2010Net interest income 6,261 4,734 4,543Provisions for loan losses 1,012 0 0NII less provisions 5,249 4,734 4,543
Other operating income 364 3,049 3,125Non-interest expense 4,744 4,254 4,857Operating profit 2,198 1,226 987
PBT 1,505 1,334 1,146Taxes 222 182 348Net profit (loss) 1,144 1,152 798
Source: Bloomberg
Table 30: Key balance sheet figures, €mm
FY 2008 FY 2009 FY 2010Loans 131,973 123,602 130,093 Total Assets 222,461 194,459 193,049 Deposits 101,179 97,041 100,284 Short-term borrowings 35,511 33,362 33,130 Other short-term borrowings 38,701 12,374 6,172 Long-term borrowings 34,597 30,789 29,206 Equity 14,237 14,388 17,476
Source: Bloomberg
Table 31: Select financial metrics
FY 2008 FY 2009 FY 2010
NIM 3.4 4.3 10.1ROA 0.5 0.6 0.4ROE 8.1 8.3 5.0ROC 1.4 1.4 1.0C:I 56.2 77.6 83.1
Source: Bloomberg
Cover pool overview
We set out below some of the key cover pool characteristics:
Table 32: Covered bond characteristics
As at June 2011
Ratings S/M/FCovered Bond rating -/Aaa/-Issuer rating A/A1/-
Cover poolCover pool size (€) 5,771,000,000Number of loans 3,921Nominal OC (%) 26.0Avg loan size (€) 1,441,870
Remaining tenor (yrs) 8.3WA seasoning (yrs) 4.4Fixed rate assets (in %) 33.3Bullet Loans (in %) 55.0
Geographical split of guarantors (in %)Vienna 20.8Republic of Austria 16.3Lower Austria 14.2Other 48.7
Debtor distribution (in %)Municipalities 22.7 Guaranteed by Federal States 25.9 Guaranteed by Municipalities 8.1 Federal States 25.0 Guaranteed by the State 12.4 Other 5.9
Source: Investor report

43
Europe Credit Research12 September 2011
Gareth Davies, CFA(44-20) [email protected]
Flavio Marco Rusconi(44-20) [email protected]
Ca
na
dia
n C
ove
red
Bo
nd
s

44
Europe Credit Research12 September 2011
Gareth Davies, CFA(44-20) [email protected]
Flavio Marco Rusconi(44-20) [email protected]
Canadian Covered Bonds
Legislative snapshot
We set out in Table 33 a snapshot of key covered bond attributes in Canada.
Table 33: Canadian Covered Bond legislative overview
Attribute CommentaryFrameworkLegislative Framework There is currently no covered bond framework in Canada and as a result covered bonds are based on
contractual agreements within general law. The government has however expressed the intention of introducing a special covered bond law and to this purpose published a consultation paper in May 2011. The consultation period ended in June 2011.
Types of covered bonds So far only mortgage and mortgage+MBS backed bonds. Eligible collateral includes public sector loans, mortgages, MBS.
Structure of Issuer Direct issuance? Yes and no. The current construct is similar to that used in the Netherlands and in the UK, whereby a securitisation technique is used to recreate a traditional covered bond structure using common and contract law. The assets are purchased by a bankruptcy-remote vehicle, the Guarantor, via an intercompany loan granted by the issuer; the Guarantor then provides a guarantee on the issuer's covered bonds.
Comments (if any) In the May 2011 consultation paper, the government expressed the intention of keeping the SPV framework in order to better guarantee asset segregation, rather than switching to a register-based framework.
Bankruptcy remoteness The assets are sold via a legal true sale to the Guarantor and therefore segregated from the issuer. Legal title to the assets remains with the issuer until the breach of a trigger.
Dual claim YesBond format Typically fixed. Bonds can be extended by up to 12mths if the issuer fails to repay in full on original maturity.Supervision Office of the Superintendent of Financial Institutions (OSFI).Cover pool
Eligible assets Mortgage Existing covered bond programmes are secured on residential mortgages, MBS and home equity lines of credit (TD Bank programme only). Mortgages can be guaranteed (generally by the CMHC).
LTV caps For the calculation of the LTV-adjusted balance, only the first 80%/90% of non-guaranteed/guaranteed loans is taken into account.
Public Sector No public sector CB for the moment. Non-performing collateral 0% weight in calculation of LTV-adjusted balance. Substitution Assets Not allowed to exceed 10%. Exposure to institutions that qualify for 10% risk weight; exposure to 20% risk
weight institutions limited to 10% of pool. Hedging Derivatives are allowed to hedge interest and exchange rate risk. Valuation Individual asset market value, estimated during underwriting process. When conducting the Asset Coverage
Test (ACT) a different multiplier is used depending on whether each loan is performing or not.Other comments (if any) The new legislation is looking to restrict mortgage collateral to Canadian properties only. The consultation
paper also proposes to have a uniform valuation system. Requirements
ALM matching Asset coverage The issuer is required to stress the cover pool when carrying out an ACT in order to ensure the cover pool is enough to cover all covered bonds claims. OC depends on the contractual agreement, but the current issuers generally have a maximum OC of 10%. The consultation paper is looking to impose 10% OC as a maximum. In Canada, creditors of the insolvent issuer can claim back the extra assets over the ACT limit. The consultation paper is looking to incorporate this in the legal framework.
Interest coverage n/aOther (if any) There is also a reserve fund that needs to be funded by the Guarantor upon downgrade of the issuer below a
specified threshold. If hard bullets are issued, these have to be cash collateralised 6 months before maturity.Consequence of breach If breach of ACT there is an issuer EoD. If a pre-maturity test in case of a hard bullet is breached, then Issuer
EoD. Monitoring Independent monitor will check ACT. Consultation paper looking to introduce role of registrar. OtherCompliance with EU legislation
Neither UCITS nor CRD compliant.
Source: National legislation, J.P. Morgan Covered Bond Research

45
Europe Credit Research12 September 2011
Gareth Davies, CFA(44-20) [email protected]
Flavio Marco Rusconi(44-20) [email protected]
Canadian covered bond & macro backdrop
Figure 31: Mortgage CB Issuance, €mm
Source: ECBC. Latest data available displayed
Figure 32: Mortgage CB outstanding, €mm
Source: ECBC. Latest data available displayed
Figure 33: Canada real GDP growth, y-on-y, %
Source: Bloomberg
Figure 34: Canada unemployment level and mortgage arrears (RHS), %
Source: Bloomberg, Canadian Banker Association
Figure 35: Canada CPI and base rate, %
Source: Bloomberg
Figure 36: Canada consumer confidence index, #
Source: Bloomberg
Figure 37: Canada house price growth, %
Source: Bloomberg
Figure 38: Canada housing permits issued and housing starts index (RHS), #
Source: Bloomberg
0
2,000
4,000
6,000
8,000
10,000
12,000
14,000
2003 2004 2005 2006 2007 2008 2009 2010
Mortgage
0
5,000
10,000
15,000
20,000
2003 2004 2005 2006 2007 2008 2009 2010
Mortgage
-10-8-6-4-202468
Mar
-00
Mar
-01
Mar
-02
Mar
-03
Mar
-04
Mar
-05
Mar
-06
Mar
-07
Mar
-08
Mar
-09
Mar
-10
Mar
-11
Real GDP growth
0.000.050.100.150.200.250.300.350.400.450.50
0123456789
10
Jan-
00
Jan-
01
Jan-
02
Jan-
03
Jan-
04
Jan-
05
Jan-
06
Jan-
07
Jan-
08
Jan-
09
Jan-
10
Jan-
11
Unemployment Mortgage arrears (RHS)
-2-101234567
Mar
-00
Mar
-01
Mar
-02
Mar
-03
Mar
-04
Mar
-05
Mar
-06
Mar
-07
Mar
-08
Mar
-09
Mar
-10
Mar
-11
Inflation Base rate
0
20
40
60
80
100
120
Jan-
02
Jan-
03
Jan-
04
Jan-
05
Jan-
06
Jan-
07
Jan-
08
Jan-
09
Jan-
10
Jan-
11
Cons. Confidence
-6-4-202468
101214
Jan-
00
Jan-
01
Jan-
02
Jan-
03
Jan-
04
Jan-
05
Jan-
06
Jan-
07
Jan-
08
Jan-
09
Jan-
10
Jan-
11
House price growth
0
50
100
150
200
250
300
350
0
1,000
2,000
3,000
4,000
5,000
6,000
7,000
8,000
Jan-
00
Jan-
01
Jan-
02
Jan-
03
Jan-
04
Jan-
05
Jan-
06
Jan-
07
Jan-
08
Jan-
09
Jan-
10
Jan-
11
Housing permits Housing starts index (RHS)

46
Europe Credit Research12 September 2011
Gareth Davies, CFA(44-20) [email protected]
Flavio Marco Rusconi(44-20) [email protected]
Bank of Montreal
(BBG: BMO)Snapshot
BMO Financial Group is a highly diversified financial services organisation, catering to more than 11 million personal, commercial, corporate and institutional customers in North America and internationally. BMO provides a broad range of retail banking, wealth management and investment banking products and solutions along three business divisions.
Personal & Commercial Banking offers a broad range of retail banking products as well as financial advisory and capital markets services in Canada; in the USA, the bank operates as Harris Bank and M&I Bank, which will become a single brand in 2012.
The Private Client Group, BMO’s group of wealth management businesses, serves a full range of client segments, from mainstream to ultra-high net worth, as well as select institutional markets, with a broad offering of wealth management products and solutions. PCG operates in both Canada and the United States, as well as in China and the United Kingdom.
BMO Capital Markets provides a wide array of products and services to corporate, institutional and government clients: equity and debt underwriting, corporate lending and project financing, mergers and acquisitions advisory services, merchant banking, securitisation, treasury and market risk management, foreign exchange, derivatives, debt and equity research and institutional sales and trading.
Financial performance
We set out below some of the key financial performance metrics:
Table 34: Key profit & loss figures, CADmm
FY 2008 FY 2009 FY 2010
Net interest income 5,072 5,570 6,235Provisions for loan losses 1,330 1,603 1,049NII less provisions 3,742 3,967 5,186
Comm.& fee income 4,375 4,607 4,683Other operating income 447 465 545Non-interest expense 6,902 7,311 7,590Operating profit 1,973 2,150 3,571
PBT 1,981 2,080 3,571Taxes -71 217 687Net profit (loss) 1,978 1,787 2,810
Source: Bloomberg
Table 35: Key balance sheet figures, CADmm
FY 2008 FY 2009 FY 2010Commercial Loans 84,151 68,169 68,338Consumer Loans 95,200 93,922 103,182Loans 177,604 160,189 169,642Total Assets 416,050 388,458 411,640Deposits 257,670 236,156 249,251Short-term borrowings 51,284 58,376 63,548Other short-term borrowings 23,429 23,578 24,415Long-term borrowings 5,715 5,386 4,576Equity 17,904 20,197 21,880
Source: Bloomberg
Table 36: Select financial metrics
FY 2008 FY 2009 FY 2010NIM 1.7 1.8 2.1ROA 0.5 0.4 0.7ROE 12.6 9.9 14.5ROC 2.7 2.3 3.3C:I 66.4 65.0 60.4Core Capital 9.8 12.2 13.5
Source: Bloomberg

47
Europe Credit Research12 September 2011
Gareth Davies, CFA(44-20) [email protected]
Flavio Marco Rusconi(44-20) [email protected]
Cover pool overview
We set out below some of the key cover pool characteristics:
Table 37: Covered bond characteristics
As at July 2011
Ratings S/M/FCovered Bond rating AAA/Aaa/AAAIssuer rating A+/Aa2/AA-
Cover poolCover pool size (CAD) 7,263,524,927Outstanding liabilities (in CAD) 5,065,970,000Asset percentage (in %) 95.0
Number of loans 42,829 Average loan (in CAD) 169,594 WA seasoning (mths) 20 WA LTV (in %) 66.0 Highest regional exposure (in %) Ontario - 40.1 Fixed rate mortgages (in %) 62.2 Owner occupied properties (in %) 85.2
Bureau Score breakdown (in %)<500 or Unavailable 0.5 500-599 1.7 600-699 19.2 700-799 66.1 >=800 12.5
Current LTV breakdown (in %)<=50 17.3 50.01-55 5.5 55.01-60 7.4 60.01-65 8.2 65.01-70 8.5 70.01-75 12.8 75.01-80 31.9 >80 8.5
Source: Investor report

48
Europe Credit Research12 September 2011
Gareth Davies, CFA(44-20) [email protected]
Flavio Marco Rusconi(44-20) [email protected]
Caisse Centrale Desjardins du Quebec
(BBG: CCDJ)Snapshot
Caisse Centrale Desjardins is a cooperative owned by the Fédération des caisses Desjardins du Québec. It offers financing, banking and international services to institutional organisations (governments, municipalities, school districts, etc.), large and medium-sized businesses and various Desjardins Group entities.
Caisse Centrale Desjardins acts as treasurer for the Desjardins Group and as its financial agent on Canadian and international markets.
As treasurer, Caisse Centrale Desjardins develops and implements liquidities and asset liability management strategies for the Group. Caisse Centrale is also responsible for meeting the liquidity needs of the Group, as well as increasing and diversifying its sources of funds on national and international markets.
As the financial agent for Desjardins Group, Caisse Centrale Desjardins represents the caisses within the Canadian Payments Association. On behalf of the Group, Caisse Centrale guarantees and assumes the clearing for banking instruments with the Bank of Canada, and for securities negotiated in Canada with the Canadian Depository for Securities.
Financial performance
We set out below some of the key financial performance metrics:
Table 38: Key profit & loss figures, CADmm
FY 2008 FY 2009 FY 2010
Net interest income 180 245 236Provisions for loan losses 21 13 -33NII less provisions 160 232 269
Comm.& fee income 26 24 27Other operating income 3 6 2Non-interest expense 77 101 88Operating profit -9 200 226
PBT -45 164 187Taxes -8 37 45Net profit (loss) -37 127 142
Source: Bloomberg
Table 39: Key balance sheet figures, CADmm
FY 2008 FY 2009 FY 2010Loans 14,781 13,080 15,946Total Assets 25,335 22,597 26,900Deposits 16,310 14,836 18,754Short-term borrowings 943 1,154 1,565Other short-term borrowings 3,163 2,554 2,930Equity 1,262 1,328 1,647
Source: Bloomberg
Table 40: Select financial metrics
FY 2008 FY 2009 FY 2010
NIM 1.0 1.3 1.1ROA -0.2 0.5 0.6ROE -3.2 9.8 9.6ROC 5.0C:I 29.9 29.2Core Capital 15.4 17.6
Source: Bloomberg

49
Europe Credit Research12 September 2011
Gareth Davies, CFA(44-20) [email protected]
Flavio Marco Rusconi(44-20) [email protected]
Cover pool overview
We set out below some of the key cover pool characteristics:
Table 41: Covered bond characteristics
As at July 2011
Ratings S/M/FCovered Bond rating -/Aaa/AAAIssuer rating AA-/Aa1/AA-
Cover poolCover pool size (CAD) 1,210,672,719Outstanding liabilities (in CAD) 987,200,000Asset percentage (in %) 93.5
Number of loans 7,486Average loan (in CAD) 161,725WA seasoning (mths) 18WA remaining term (mths) 36WA original LTV (in %) 92.1WA current LTV (in %) 88.1Fixed rate mortgages (in %) 59.7
Original LTV breakdown (in %)<20 0.1 20-50 0.3 50-60 0.4 60-65 0.6 65-70 0.6 70-75 1.7 75-80 3.1 80-85 6.0 85-90 12.0 90-95 27.6 95-100 47.6 >100 0.0
Current LTV breakdown (in %)<20 0.1 20-50 0.7 50-60 0.9 60-65 1.0 65-70 1.7 70-75 3.6 75-80 5.7 80-85 11.3 85-90 25.3 90-95 27.2 95-100 22.5 >100 0.0
Source: Investor report
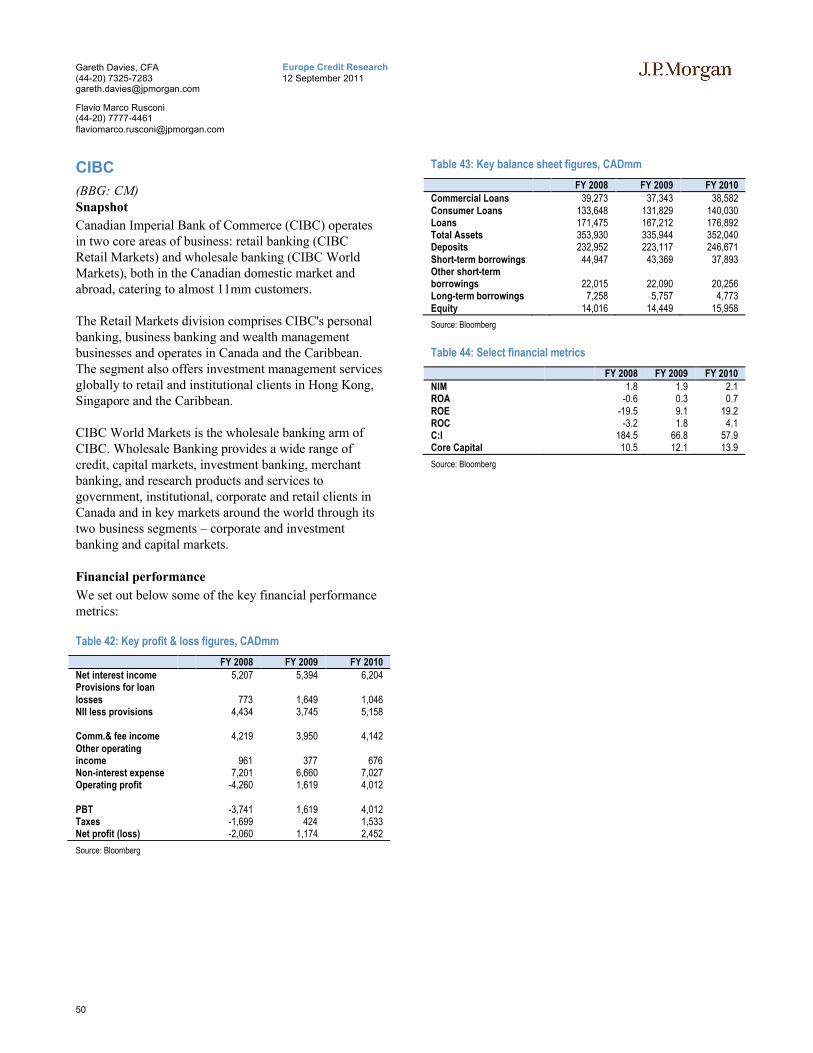
50
Europe Credit Research12 September 2011
Gareth Davies, CFA(44-20) [email protected]
Flavio Marco Rusconi(44-20) [email protected]
CIBC
(BBG: CM)Snapshot
Canadian Imperial Bank of Commerce (CIBC) operates in two core areas of business: retail banking (CIBC Retail Markets) and wholesale banking (CIBC World Markets), both in the Canadian domestic market and abroad, catering to almost 11mm customers.
The Retail Markets division comprises CIBC's personal banking, business banking and wealth management businesses and operates in Canada and the Caribbean. The segment also offers investment management services globally to retail and institutional clients in Hong Kong, Singapore and the Caribbean.
CIBC World Markets is the wholesale banking arm of CIBC. Wholesale Banking provides a wide range of credit, capital markets, investment banking, merchant banking, and research products and services to government, institutional, corporate and retail clients in Canada and in key markets around the world through its two business segments – corporate and investment banking and capital markets.
Financial performance
We set out below some of the key financial performance metrics:
Table 42: Key profit & loss figures, CADmm
FY 2008 FY 2009 FY 2010Net interest income 5,207 5,394 6,204Provisions for loan losses 773 1,649 1,046NII less provisions 4,434 3,745 5,158
Comm.& fee income 4,219 3,950 4,142Other operating income 961 377 676Non-interest expense 7,201 6,660 7,027Operating profit -4,260 1,619 4,012
PBT -3,741 1,619 4,012Taxes -1,699 424 1,533Net profit (loss) -2,060 1,174 2,452
Source: Bloomberg
Table 43: Key balance sheet figures, CADmm
FY 2008 FY 2009 FY 2010Commercial Loans 39,273 37,343 38,582 Consumer Loans 133,648 131,829 140,030 Loans 171,475 167,212 176,892 Total Assets 353,930 335,944 352,040 Deposits 232,952 223,117 246,671 Short-term borrowings 44,947 43,369 37,893 Other short-term borrowings 22,015 22,090 20,256 Long-term borrowings 7,258 5,757 4,773 Equity 14,016 14,449 15,958
Source: Bloomberg
Table 44: Select financial metrics
FY 2008 FY 2009 FY 2010NIM 1.8 1.9 2.1ROA -0.6 0.3 0.7ROE -19.5 9.1 19.2ROC -3.2 1.8 4.1C:I 184.5 66.8 57.9Core Capital 10.5 12.1 13.9
Source: Bloomberg

51
Europe Credit Research12 September 2011
Gareth Davies, CFA(44-20) [email protected]
Flavio Marco Rusconi(44-20) [email protected]
Cover pool overview
We set out below some of the key cover pool characteristics:
Table 45: Covered bond characteristics
As at July 2011
Ratings S/M/FCovered Bond rating AAA/Aaa/AAAIssuer rating A+/Aa2/AA-
Cover poolCover pool size (CAD) 14,041,818,110Outstanding liabilities (in CAD) 9,654,325,000Asset percentage (in %) 92.9
Number of loans 78,579 Average loan (in CAD) 164,413 WA seasoning (mths) 24 WA remaining term (mths) 35 WA current LTV (in %) 59.4 Highest regional exposure (in %) Ontario - 45.7 Fixed rate mortgages (in %) - Owner occupied properties (in %) 92.6
Bureau Score breakdown (in %)Unavailable 4.0 <500 0.0 500-599 0.9 600-699 19.3 700-799 65.3 >=800 10.5
LTV breakdown (in %)<=40 18.7 40.01-45 6.2 45.01-50 6.9 50.01-55 8.3 55.01-60 9.7 60.01-65 9.8 65.01-70 7.4 70.01-75 8.4 75.01-80 9.7 >80 15.0
Source: Investor report

52
Europe Credit Research12 September 2011
Gareth Davies, CFA(44-20) [email protected]
Flavio Marco Rusconi(44-20) [email protected]
National Bank of Canada
(BBG: NACN)Snapshot
National Bank of Canada (NBC) Group is the sixth largest Canadian bank and the leading bank in Quebec. NBC provides financial services to individual customers, SMEs and large corporations in Canada and offers specialised services in a number of international markets. NBC offers products including corporate and investment banking, securities brokerage, insurance and wealth management and mutual funds and retirement plan management.
Half of its revenues (and 45% of its net income) come from the personal and commercial banking division, 31% (42% of net income) from its financial markets segment and the remaining 18% (13% of net income) from its wealth management business.
Financial performance
We set out below some of the key financial performance metrics:
Table 46: Key profit & loss figures, CADmm
FY 2008 FY 2009 FY 2010Net interest income 1,852 1,966 1,912Provisions for loan losses 144 305 144NII less provisions 1,708 1,661 1,768
Comm.& fee income 1,585 1,753 1,817Other operating income 496 387 405Non-interest expense 2,629 2,662 2,794Operating profit 864 1,164 1,340
PBT 798 1,164 1,373Taxes 167 252 271Net profit (loss) 776 854 1,034
Source: Bloomberg
Table 47: Key balance sheet figures, CADmm
FY 2008 FY 2009 FY 2010Commercial Loans 21,149 20,003 21,469Consumer Loans 31,061 33,274 36,355Loans 51,741 52,637 57,188Total Assets 129,332 132,138 145,301Deposits 76,022 75,170 81,785Short-term borrowings 22,980 25,957 30,805Other short-term borrowings 4,274 5,733 5,946Long-term borrowings 2,255 2,017 2,033Equity 7,538 7,674 8,407
Source: Bloomberg
Table 48: Select financial metrics
FY 2008 FY 2009 FY 2010NIM 1.8 1.8 1.6ROA 0.6 0.6 0.7ROE 16.6 15.7 16.9ROC 2.2 2.7 2.9C:I 72.3 64.4 65.3Core Capital 9.4 10.7 14.0
Source: Bloomberg
Cover pool overview
We set out below some of the key cover pool characteristics:
Table 49: Covered bond characteristics
As at July 2011
Ratings S/M/FCovered Bond rating -/Aaa/AAAIssuer rating A/Aa2/A+
Cover poolCover pool size (CAD) 1,559,302,830Outstanding liabilities (in CAD) 994,100,000Asset percentage (in %) 93.5
Number of loans 13,493Average loan (in CAD) 115,564WA remaining term (mths) 34WA current LTV (in %) 74.7 Highest regional exposure (in %) Quebec - 79.1 Fixed rate mortgages (in %) 52.8 Owner occupied properties (in %) 95.5
Bureau Score breakdown (in %)Unavailable 7.1 <500 0.3 500-599 3.9 600-699 21.9 700-799 57.4 >=800 9.4
Current LTV breakdown (in %)<=40 7.1 40.01-45 2.5 45.01-50 3.4 50.01-55 3.9 55.01-60 4.8 60.01-65 5.3 65.01-70 5.2 70.01-75 7.0 75.01-80 9.4 >80 51.6
Source: Investor report

53
Europe Credit Research12 September 2011
Gareth Davies, CFA(44-20) [email protected]
Flavio Marco Rusconi(44-20) [email protected]
Royal Bank of Canada
(BBG: RY)Snapshot
RBC is Canada’s largest bank by both assets and market capitalisation, and is one of North America’s leading financial services companies.
The bank, through its subsidiaries, offers a broad range of financial products and services, including personal and commercial banking, wealth management, insurance, corporate and investment banking and transaction processing services. It operates mostly in Canada and the USA, but is also present in 51 other countries, catering for a total of nearly 18mm customers through its 5 business segments.
Canadian Banking provides personal and business financial services in Canada. International Banking comprises banking businesses in the U.S. and Caribbean, and global custody and investor services. Wealth Management businesses serve affluent and high net worth clients around the world and provide asset management and estate and trust services directly to clients and through internal partners and third-party distributors.
The Capital Markets business provide corporate, government, and institutional advice, capital, and access to the world’s financial markets and innovative products.
Finally, the Insurance segment provides Canadian customers insurance solutions including life, health, travel, home, auto, and creditor insurance.
Financial performance
We set out below some of the key financial performance metrics:
Table 50: Key profit & loss figures, CADmm
FY 2008 FY 2009 FY 2010
Net interest income 9,048 11,541 10,977Provisions for loan losses 1,595 3,413 1,861NII less provisions 7,453 8,128 9,116
Comm.& fee income 8,463 9,307 9,181Other operating income 2,507 891 1,217Non-interest expense 12,351 14,558 14,393Operating profit 6,005 6,526 7,084
PBT 6,005 5,526 6,968Taxes 1,369 1,568 1,646Net profit (loss) 4,555 3,858 5,223
Source: Bloomberg
Table 51: Key balance sheet figures, CADmm
FY 2008 FY 2009 FY 2010Real Estate Loans 122,991 122,130 128,832 Commercial Loans 96,300 78,927 73,375 Consumer Loans 195,455 205,224 221,828 Loans 289,540 280,963 292,206 Total Assets 723,859 654,989 726,206 Deposits 438,575 398,304 433,033 Short-term borrowings 59,560 76,509 88,179 Other short-term borrowings 46,974 40,031 36,719 Long-term borrowings 9,531 7,856 7,408 Equity 33,129 38,977 41,207
Source: Bloomberg
Table 52: Select financial metrics
FY 2008 FY 2009 FY 2010
NIM 1.9 2.3 2.1 ROA 0.7 0.5 0.7 ROE 17.6 12.0 15.0 ROC 4.3 3.5 4.1 C:I 60.7 58.6 60.4 Core Capital 9.0 13.0 13.0
Source: Bloomberg

54
Europe Credit Research12 September 2011
Gareth Davies, CFA(44-20) [email protected]
Flavio Marco Rusconi(44-20) [email protected]
Cover pool overview
We set out below some of the key cover pool characteristics:
Table 53: Covered bond characteristics
As at July 2011
Ratings S/M/FCovered Bond rating AAA/Aaa/AAAIssuer rating AA-/Aa1/AA
Cover poolCover pool size (CAD) 12,824,298,714Outstanding liabilities (in CAD) 7,806,003,000Asset percentage (in %) 91.8
Number of loans 110,377 Average loan (in CAD) 116,186 WA seasoning (mths) 37 WA authorised LTV (in %) 67.6 WA drawn LTV (in %) 60.5 Highest regional exposure (in %) Ontario - 39.7 Fixed rate mortgages (in %) 62.0 Owner occupied properties (in %) 91.4
Bureau Score breakdown (in %)Unavailable 0.9 <500 1.1 500-599 3.0 600-699 14.3 700-799 54.0 >=800 26.8
Authorised LTV breakdown (in %)<=40 6.8 40.01-45 2.4 45.01-50 3.1 50.01-55 4.0 55.01-60 6.4 60.01-65 10.5 65.01-70 9.4 70.01-75 24.1 75.01-80 33.4
Drawn LTV breakdown (in %)<=40 12.8 40.01-45 4.5 45.01-50 5.5 50.01-55 7.0 55.01-60 9.8 60.01-65 13.2 65.01-70 13.3 70.01-75 15.9 75.01-80 18.2
Source: Investor report
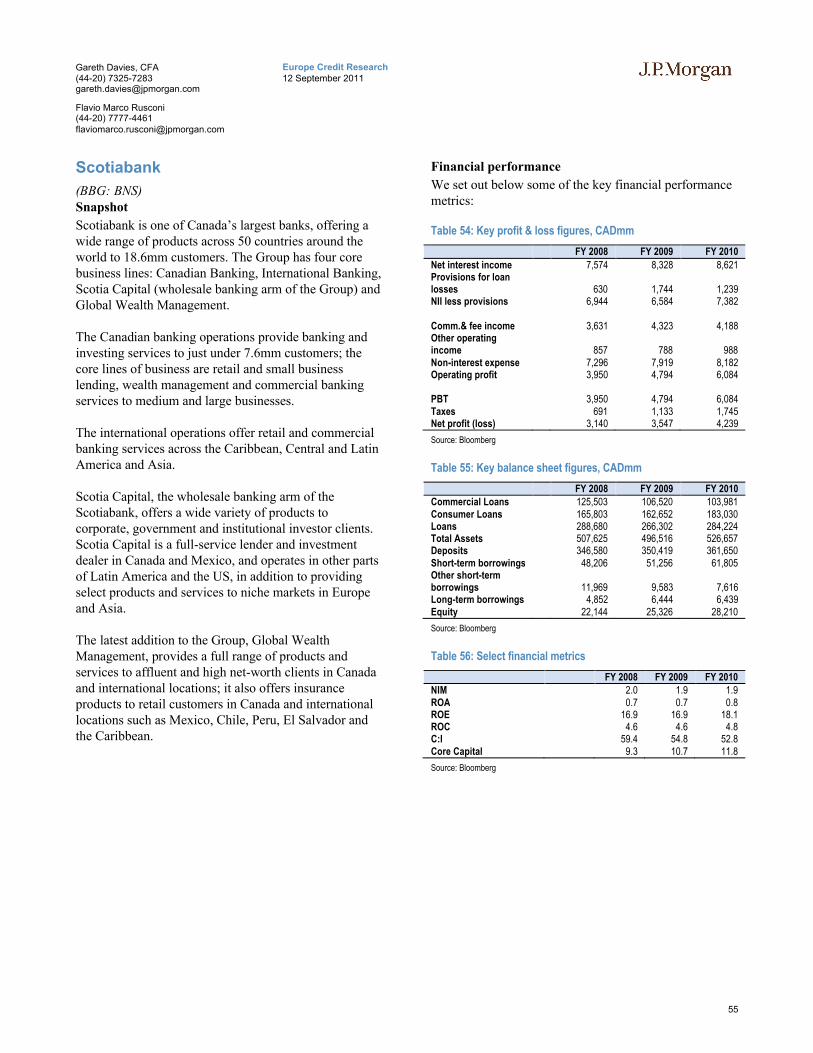
55
Europe Credit Research12 September 2011
Gareth Davies, CFA(44-20) [email protected]
Flavio Marco Rusconi(44-20) [email protected]
Scotiabank
(BBG: BNS)Snapshot
Scotiabank is one of Canada’s largest banks, offering a wide range of products across 50 countries around the world to 18.6mm customers. The Group has four core business lines: Canadian Banking, International Banking, Scotia Capital (wholesale banking arm of the Group) and Global Wealth Management.
The Canadian banking operations provide banking and investing services to just under 7.6mm customers; the core lines of business are retail and small business lending, wealth management and commercial banking services to medium and large businesses.
The international operations offer retail and commercial banking services across the Caribbean, Central and Latin America and Asia.
Scotia Capital, the wholesale banking arm of the Scotiabank, offers a wide variety of products to corporate, government and institutional investor clients. Scotia Capital is a full-service lender and investment dealer in Canada and Mexico, and operates in other parts of Latin America and the US, in addition to providing select products and services to niche markets in Europe and Asia.
The latest addition to the Group, Global Wealth Management, provides a full range of products and services to affluent and high net-worth clients in Canada and international locations; it also offers insurance products to retail customers in Canada and international locations such as Mexico, Chile, Peru, El Salvador and the Caribbean.
Financial performance
We set out below some of the key financial performance metrics:
Table 54: Key profit & loss figures, CADmm
FY 2008 FY 2009 FY 2010
Net interest income 7,574 8,328 8,621Provisions for loan losses 630 1,744 1,239NII less provisions 6,944 6,584 7,382
Comm.& fee income 3,631 4,323 4,188Other operating income 857 788 988Non-interest expense 7,296 7,919 8,182Operating profit 3,950 4,794 6,084
PBT 3,950 4,794 6,084Taxes 691 1,133 1,745Net profit (loss) 3,140 3,547 4,239
Source: Bloomberg
Table 55: Key balance sheet figures, CADmm
FY 2008 FY 2009 FY 2010Commercial Loans 125,503 106,520 103,981Consumer Loans 165,803 162,652 183,030Loans 288,680 266,302 284,224Total Assets 507,625 496,516 526,657Deposits 346,580 350,419 361,650Short-term borrowings 48,206 51,256 61,805Other short-term borrowings 11,969 9,583 7,616Long-term borrowings 4,852 6,444 6,439Equity 22,144 25,326 28,210
Source: Bloomberg
Table 56: Select financial metrics
FY 2008 FY 2009 FY 2010NIM 2.0 1.9 1.9ROA 0.7 0.7 0.8ROE 16.9 16.9 18.1ROC 4.6 4.6 4.8C:I 59.4 54.8 52.8Core Capital 9.3 10.7 11.8
Source: Bloomberg

56
Europe Credit Research12 September 2011
Gareth Davies, CFA(44-20) [email protected]
Flavio Marco Rusconi(44-20) [email protected]
Cover pool overview
We set out below some of the key cover pool characteristics:
Table 57: Covered bond characteristics
As at July 2011
Ratings S/M/FCovered Bond rating -/Aaa/AAAIssuer rating AA-/Aa1/AA-
Cover poolCover pool size (CAD) 8,957,319,054Outstanding liabilities (in CAD) 6,158,000,000Asset percentage (in %) 95.0
Number of loans 57,938Average loan (in CAD) 154,602Seasoning (mths) 28WA remaining term (mths) 31WA current LTV (in %) 81.7 Highest regional exposure (in %) Ontario - 56.5 Fixed rate mortgages (in %) 78.3 Owner occupied properties (in %) 100.0
Bureau Score breakdown (in %)<500 1.8 500-599 4.7 600-699 18.0 700-799 57.1 >=800 18.5
LTV breakdown (in %)<=50 17.6 50.01-55 5.2 55.01-60 5.9 60.01-65 6.9 65.01-70 7.3 70.01-75 7.4 75.01-80 6.1 >80 43.6
Source: Investor report
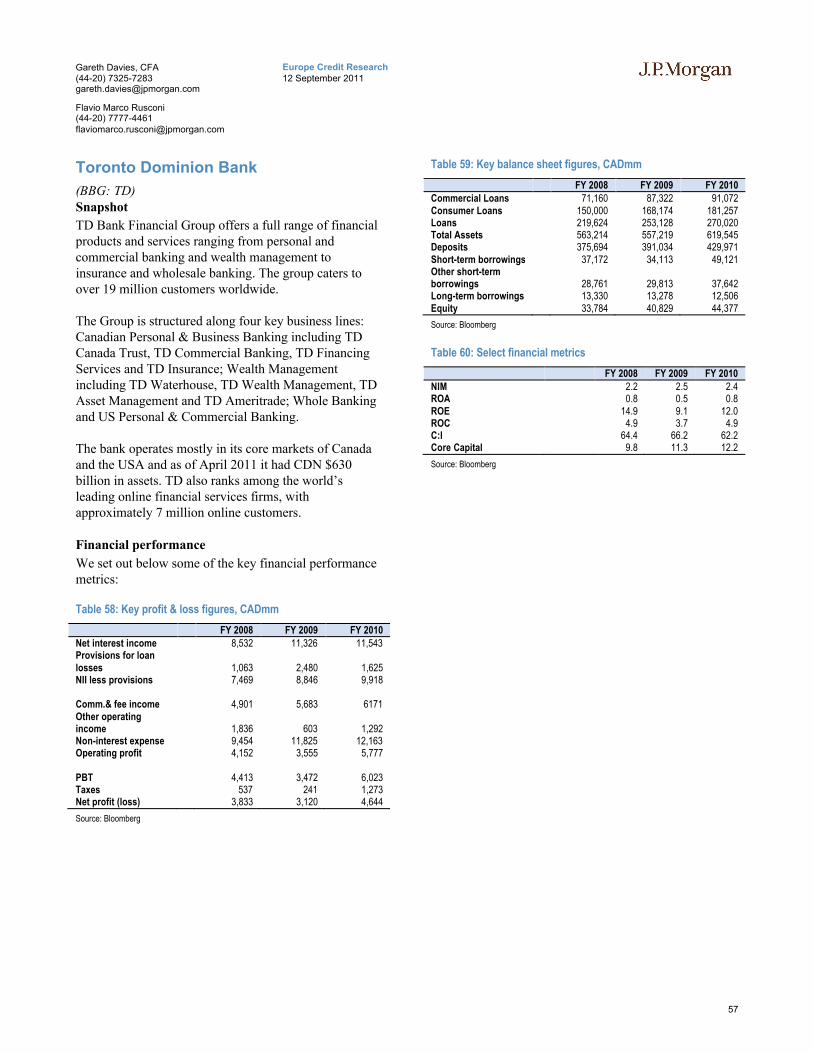
57
Europe Credit Research12 September 2011
Gareth Davies, CFA(44-20) [email protected]
Flavio Marco Rusconi(44-20) [email protected]
Toronto Dominion Bank
(BBG: TD)Snapshot
TD Bank Financial Group offers a full range of financial products and services ranging from personal and commercial banking and wealth management to insurance and wholesale banking. The group caters to over 19 million customers worldwide.
The Group is structured along four key business lines: Canadian Personal & Business Banking including TD Canada Trust, TD Commercial Banking, TD Financing Services and TD Insurance; Wealth Management including TD Waterhouse, TD Wealth Management, TD Asset Management and TD Ameritrade; Whole Banking and US Personal & Commercial Banking.
The bank operates mostly in its core markets of Canada and the USA and as of April 2011 it had CDN $630 billion in assets. TD also ranks among the world’s leading online financial services firms, with approximately 7 million online customers.
Financial performance
We set out below some of the key financial performance metrics:
Table 58: Key profit & loss figures, CADmm
FY 2008 FY 2009 FY 2010Net interest income 8,532 11,326 11,543Provisions for loan losses 1,063 2,480 1,625NII less provisions 7,469 8,846 9,918
Comm.& fee income 4,901 5,683 6171Other operating income 1,836 603 1,292Non-interest expense 9,454 11,825 12,163Operating profit 4,152 3,555 5,777
PBT 4,413 3,472 6,023Taxes 537 241 1,273Net profit (loss) 3,833 3,120 4,644
Source: Bloomberg
Table 59: Key balance sheet figures, CADmm
FY 2008 FY 2009 FY 2010Commercial Loans 71,160 87,322 91,072 Consumer Loans 150,000 168,174 181,257 Loans 219,624 253,128 270,020 Total Assets 563,214 557,219 619,545 Deposits 375,694 391,034 429,971 Short-term borrowings 37,172 34,113 49,121 Other short-term borrowings 28,761 29,813 37,642 Long-term borrowings 13,330 13,278 12,506 Equity 33,784 40,829 44,377
Source: Bloomberg
Table 60: Select financial metrics
FY 2008 FY 2009 FY 2010NIM 2.2 2.5 2.4ROA 0.8 0.5 0.8ROE 14.9 9.1 12.0ROC 4.9 3.7 4.9C:I 64.4 66.2 62.2Core Capital 9.8 11.3 12.2
Source: Bloomberg

58
Europe Credit Research12 September 2011
Gareth Davies, CFA(44-20) [email protected]
Flavio Marco Rusconi(44-20) [email protected]
Cover pool overview
We set out below some of the key cover pool characteristics:
Table 61: Covered bond characteristics
As at July 2011
Ratings S/M/FCovered Bond rating -/Aaa/-Issuer rating -/Aaa/-
Cover poolCover pool size (CAD) 8,242,366,078Outstanding liabilities (in CAD) 2,079,000,000Asset percentage (in %) 95.0
Number of loans 70,755 Average loan (in CAD) 116,492 WA seasoning (mths) 63 WA authorised LTV (in %) 68.0 WA drawn LTV (in %) 54.8 Highest regional exposure (in %) Ontario - 55.1 Fixed rate mortgages (in %) 17.2 Owner occupied properties (in %) 100.0
Bureau Score breakdown (in %)Unavailable 0.2 <500 0.1 500-599 0.9 600-699 11.8 700-799 68.7 >=800 18.4
Authorised LTV breakdown (in %)<=40 6.3 40.01-45 2.3 45.01-50 6.0 50.01-55 2.9 55.01-60 4.6 60.01-65 10.0 65.01-70 6.8 70.01-75 31.3 75.01-80 29.9
Drawn LTV breakdown (in %)<=40 24.5 40.01-45 5.7 45.01-50 6.9 50.01-55 6.7 55.01-60 7.5 60.01-65 9.5 65.01-70 9.2 70.01-75 13.8 75.01-80 12.8 >80 3.4
Source: Investor report

59
Europe Credit Research12 September 2011
Gareth Davies, CFA(44-20) [email protected]
Flavio Marco Rusconi(44-20) [email protected]
Da
nis
h C
ove
red
Bo
nd
s

60
Europe Credit Research12 September 2011
Gareth Davies, CFA(44-20) [email protected]
Flavio Marco Rusconi(44-20) [email protected]
Danish Covered Bonds
Legislative snapshot
We set out in Table 62 a snapshot of key covered bond attributes in the Denmark.
Table 62: Danish Covered Bond legislative overview
Attribute CommentaryFrameworkLegislative Framework Danish Mortgage Credit Loans & Mortgage Credit Bonds etc Act. Executive Order No. 718 of 21 June 2007
on the Issue of Bonds, the Balance Principle and Risk Management; Bill No. 577 of 6 June 2007 amending the Financial Business Act 454 of 10 June 2003
Types of covered bonds Two current types and one legacy type of 'standard' covered bond. Current types are primarily differentiated by the type of issuer, and the type of substitution assets allowed in the cover pool. Specialist mortgage credit institutions are the only type of issuer of SDROs (Saerligt Daekkede RealkreditObligationer or covered mortgage bonds), while licensed credit institutions, specialist mortgage credit institutions and shipping finance institutions (Danmarks Skibskredit) can issue SDOs (Saeligt Deakkede Obligationer or covered bonds). Legacy issues are ROs (RealkreditObligationer), and do not meet the covered bond definitions under the CRD (grandfathered risk-weights for pre-2008 issuance). Furthermore, Danish covered bond issuers can issue 'junior' covered bonds to obtain capital for supplementary security to ensure compliance with LTV limits
Structure of Issuer Direct issuance? YesComments (if any) Both specialised mortgage credit institutions (who have restrictions on the scope of their banking activities)
and also licensed credit institutions (essentially commercial banks). Separate ‘capital centres’ or cover pools maintained for different types of issues or assets
Bankruptcy remoteness Segregated assets in cover register. No automatic acceleration in case of bankruptcy. Derivatives counterparties rank pari passu with bondholders
Dual claim Yes. Furthermore, Mortgage bank (i.e. SDRO) investors also have a preferential claim against the assets of other Capital Centres ahead of other creditors
Bond format Typically, fixed rate and hard bullet, although there are exceptions (for example, Danske has a mix of hard and soft bullet bonds)
Supervision Danish FSACover pool
Eligible assets Mortgage Mortgages assets from EEA and OECD, Switzerland, USA, Canada, Japan, New Zealand and Australia.LTV caps Maximum LTV of 80% for residential (with repayment restrictions, otherwise 75%), 70% for agricultural and
60% for commercial properties and holiday homes (or 70% with additional collateral posted)Public Sector Public sector based in EEA and OECD, Switzerland, USA, Canada, Japan, New Zealand and Australia. For
public sector assets, there is a cap of 20% of the pool for 20% risk-weighted exposuresNon-performing collateral Used to minimise interest rate, currency, credit or other risksSubstitution Assets Substitute collateral can constitute a maximum of 15% of the pool. Derivatives are also allowed into the pool
Hedging Elimination of interest rate and currency risk through hedgingValuation Individual market value, with annual revaluations for commercial premises and every three years for
residential properties. In case of LTV limit breaches through falling property values, an issuer is required to infuse supplementary assts into the cover pool on a loan by loan basis, thus maintaining the required minimum requirement for cover at all times
Other comments (if any)Requirements
ALM matching Asset coverage NPV of cover pool has to be above liabilities’ value at all times; cashflows from pool and derivatives should be enough to cover payments on liabilities. Issuers have to adhere to one of the general and the specific balance principle (imposes limits on interest rate and currency risk, while also imposing matched funding requirements)
Interest coverage See aboveOther (if any) No minimum requirement for over-collateralisation for commercial banks (SDO issuers) but specialist
mortgage banks have to maintain 8% of RWA (SDRO issuers). Danish covered bond issuers can issue 'junior' covered bonds to obtain capital for supplementary security to ensure compliance with LTV limits
Consequence of breach Programme freeze. Potential for removal of the SDO designation. Other regulatory actions by the FSAMonitoring Danish FSAOther
Compliance with EU legislation
UCITS and CRD compliant. ROs are not compliant
Source: National legislation, J.P. Morgan Covered Bond Research

61
Europe Credit Research12 September 2011
Gareth Davies, CFA(44-20) [email protected]
Flavio Marco Rusconi(44-20) [email protected]
Danish covered bond & macro backdrop
Figure 39: CB issuance, €mm
Source: ECBC. Latest data available displayed
Figure 40: CB outstanding, €mm
Source: ECBC. Latest data available displayed
Figure 41: Danish real GDP growth, y-on-y, %
Source: Bloomberg
Figure 42: Danish unemployment level, %
Source: Bloomberg
Figure 43: Danish CPI and base rate, %
Source: Bloomberg
Figure 44: Danish consumer confidence, balance of survey
Source: Bloomberg
Figure 45: Danish house price growth, y-on-y, %
Source: Bloomberg
Figure 46: Danish housing starts, #
Source: Bloomberg
0
20,000
40,000
60,000
80,000
100,000
120,000
140,000
160,000
2003 2004 2005 2006 2007 2008 2009 2010
Mortgage Ships
0
50,000
100,000
150,000
200,000
250,000
300,000
350,000
400,000
2003 2004 2005 2006 2007 2008 2009 2010
Mortgage Ships
-8
-6
-4
-2
0
2
4
6
Mar
-00
Mar
-01
Mar
-02
Mar
-03
Mar
-04
Mar
-05
Mar
-06
Mar
-07
Mar
-08
Mar
-09
Mar
-10
Mar
-11
Real GDP growth
0
1
2
3
4
5
6
7
Mar
-00
Mar
-01
Mar
-02
Mar
-03
Mar
-04
Mar
-05
Mar
-06
Mar
-07
Mar
-08
Mar
-09
Mar
-10
Mar
-11
Unemployment
01122334455
Mar
-00
Mar
-01
Mar
-02
Mar
-03
Mar
-04
Mar
-05
Mar
-06
Mar
-07
Mar
-08
Mar
-09
Mar
-10
Mar
-11
Inflation Base rate
-15
-10
-5
0
5
10
15
Mar
-00
Mar
-01
Mar
-02
Mar
-03
Mar
-04
Mar
-05
Mar
-06
Mar
-07
Mar
-08
Mar
-09
Mar
-10
Mar
-11
Cons. Confidence
-20%-15%-10%-5%0%5%
10%15%20%25%30%
Mar
-01
Mar
-02
Mar
-03
Mar
-04
Mar
-05
Mar
-06
Mar
-07
Mar
-08
Mar
-09
Mar
-10
OECD HP nominal growth
0
5,000
10,000
15,000
20,000
25,000
30,000
35,000
40,000
Jan-
00
Jan-
01
Jan-
02
Jan-
03
Jan-
04
Jan-
05
Jan-
06
Jan-
07
Jan-
08
Jan-
09
Jan-
10
Jan-
11
Housing starts (sum of prev. 12 mths)

62
Europe Credit Research12 September 2011
Gareth Davies, CFA(44-20) [email protected]
Flavio Marco Rusconi(44-20) [email protected]
BRF Kredit AS
(BBG: BRF)Snapshot
BRF Kredit (‘BRF’) is a specialist mortgage lender, accounting for approximately 10% of the Danish mortgage market. BRFKredit offers mortgage loans secured against owner-occupied homes (44%), commercial properties (16%) and for private rental (20%) and cooperative housing (16%). All properties are located in Denmark. BRF Kredit is owned by an independent business foundation, BRFfonden.
The lender finances its lending activity using covered bonds and mortgage bonds, depending on the type of collateral requiring funding. BRF adheres to the general balance principle, with bonds being full recourse obligations on BRF Kredit. Mortgage bonds are supported by a cover pool of assets, either from a specific capital centre or by the remaining assets of BRF Kredit (General Capital Centre).
Financial performance
We set out below some of the key financial performance metrics:
Table 63: Key profit & loss figures, DKKmm
FY 2008 FY 2009 FY 2010Net interest income 1,554 1,747 1,644Provisions for loan losses 647 2,125 471NII less provisions 907 -378 1,173Commissions & fee income 192 266 167Other operating income 34 8 9Non-interest expense 1,063 1,098 857Operating profit (loss) -576 -852 17PBT -575 -858 21Taxes -75 -237 7Net profit (loss) -500 -621 14
Source: Bloomberg
Table 64: Key balance sheet figures, DKKmm
FY 2008 FY 2009 FY 2010Loans 213,909 221,025 212,976Total Assets 233,838 246,829 231,430Deposits 3,286 3,937 5,448Short-term borrowings 28,075 25,075 11,401Long-term borrowings 186,983 202,557 198,383Equity 10,389 9,730 9,742
Source: Bloomberg
Table 65: Select financial metrics
FY 2008 FY 2009 FY 2010NIM 0.71 0.73 0.73ROA -0.22 -0.26 0.01ROE -4.67 -6.17 0.10ROC -0.23 -0.27 n/aC:I 92.91 42.63 n/aCore capital 12.30 13.30 13.70
Source: Bloomberg
Cover pool overview
We set out below some of the key cover pool characteristics:
Table 66: Covered bond characteristics
As at 31 March 2011
S/M/FCovered Bond rating: Capital Centre E (SDO) -/Aa2/-Covered Bond rating: Capital Centre B (RO) -/Aa3/-Covered Bond rating: General Capital Centre (RO) -/Aa3/-Issuer rating -/Baa3/-
Total Cover Pool Balance (DKK bn) 207WA Loan Balance (DKK) 1,610,444No. of Loans: 128,536WA LTV (in %):
ARM (in %): 59Fixed rate mortgages (in %) 22Capped mortgages (in %): 10Private housing (in %): 47Copenhagen concentration (in %): 48
Source: Investor Report
Table 67: Collateral pool LTV breakdown
Current LTV ranges As at 31 March 20110-<=40% 19>40%-<=60% 22>60%-<=80% 29>80%-<=100% 20>100% 10
Source: Investor report. All loans
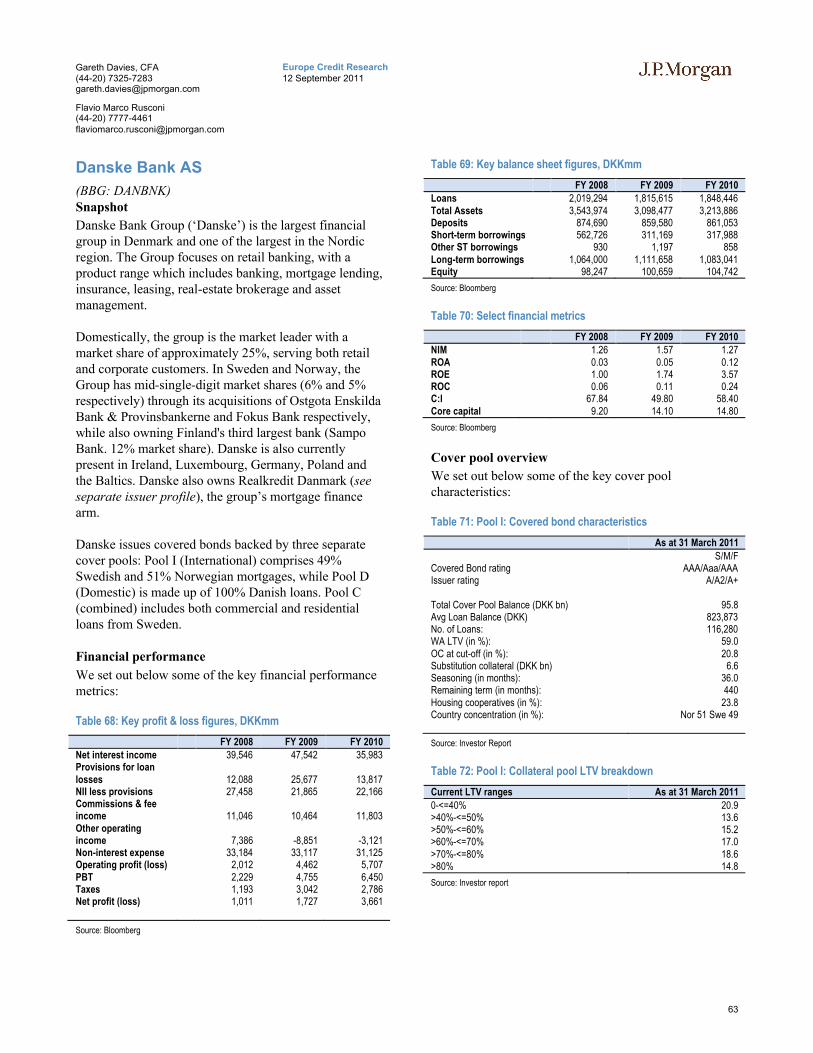
63
Europe Credit Research12 September 2011
Gareth Davies, CFA(44-20) [email protected]
Flavio Marco Rusconi(44-20) [email protected]
Danske Bank AS
(BBG: DANBNK)Snapshot
Danske Bank Group (‘Danske’) is the largest financial group in Denmark and one of the largest in the Nordic region. The Group focuses on retail banking, with a product range which includes banking, mortgage lending, insurance, leasing, real-estate brokerage and asset management.
Domestically, the group is the market leader with a market share of approximately 25%, serving both retail and corporate customers. In Sweden and Norway, the Group has mid-single-digit market shares (6% and 5% respectively) through its acquisitions of Ostgota Enskilda Bank & Provinsbankerne and Fokus Bank respectively, while also owning Finland's third largest bank (Sampo Bank. 12% market share). Danske is also currently present in Ireland, Luxembourg, Germany, Poland and the Baltics. Danske also owns Realkredit Danmark (see separate issuer profile), the group’s mortgage finance arm.
Danske issues covered bonds backed by three separate cover pools: Pool I (International) comprises 49% Swedish and 51% Norwegian mortgages, while Pool D(Domestic) is made up of 100% Danish loans. Pool C (combined) includes both commercial and residential loans from Sweden.
Financial performance
We set out below some of the key financial performance metrics:
Table 68: Key profit & loss figures, DKKmm
FY 2008 FY 2009 FY 2010Net interest income 39,546 47,542 35,983Provisions for loan losses 12,088 25,677 13,817NII less provisions 27,458 21,865 22,166Commissions & fee income 11,046 10,464 11,803Other operating income 7,386 -8,851 -3,121Non-interest expense 33,184 33,117 31,125Operating profit (loss) 2,012 4,462 5,707PBT 2,229 4,755 6,450Taxes 1,193 3,042 2,786Net profit (loss) 1,011 1,727 3,661
Source: Bloomberg
Table 69: Key balance sheet figures, DKKmm
FY 2008 FY 2009 FY 2010Loans 2,019,294 1,815,615 1,848,446Total Assets 3,543,974 3,098,477 3,213,886Deposits 874,690 859,580 861,053Short-term borrowings 562,726 311,169 317,988Other ST borrowings 930 1,197 858Long-term borrowings 1,064,000 1,111,658 1,083,041Equity 98,247 100,659 104,742
Source: Bloomberg
Table 70: Select financial metrics
FY 2008 FY 2009 FY 2010NIM 1.26 1.57 1.27ROA 0.03 0.05 0.12ROE 1.00 1.74 3.57ROC 0.06 0.11 0.24C:I 67.84 49.80 58.40Core capital 9.20 14.10 14.80
Source: Bloomberg
Cover pool overview
We set out below some of the key cover pool characteristics:
Table 71: Pool I: Covered bond characteristics
As at 31 March 2011
S/M/FCovered Bond rating AAA/Aaa/AAAIssuer rating A/A2/A+
Total Cover Pool Balance (DKK bn) 95.8Avg Loan Balance (DKK) 823,873No. of Loans: 116,280WA LTV (in %): 59.0OC at cut-off (in %): 20.8 Substitution collateral (DKK bn) 6.6 Seasoning (in months): 36.0 Remaining term (in months): 440 Housing cooperatives (in %): 23.8 Country concentration (in %): Nor 51 Swe 49
Source: Investor Report
Table 72: Pool I: Collateral pool LTV breakdown
Current LTV ranges As at 31 March 2011
0-<=40% 20.9 >40%-<=50% 13.6 >50%-<=60% 15.2 >60%-<=70% 17.0 >70%-<=80% 18.6 >80% 14.8
Source: Investor report

64
Europe Credit Research12 September 2011
Gareth Davies, CFA(44-20) [email protected]
Flavio Marco Rusconi(44-20) [email protected]
Table 73: Pool D: Covered bond characteristics
As at 31 March 2011S/M/F
Covered Bond rating AAA/Aaa/AAAIssuer rating A/A2/A+
Total Cover Pool Balance (DKK bn) 32.8Avg Loan Balance (DKK) 602,612No. of Loans: 54,492WA LTV (in %): 60.0OC at cut-off (in %): 18.9 Substitution collateral 1.0 Seasoning (in months): 48.0 Remaining term (in months): 309 Copenhagen concentration (in %): 36.3
Source: Investor Report
Table 74: Pool D: Collateral pool LTV breakdown
Current LTV ranges As at 31 March 20110-<=40% 18.6>40%-<=50% 13.8>50%-<=60% 16.5>60%-<=70% 17.6>70%-<=80% 17.9>80% 15.5
Source: Investor report
Table 75: Pool C: Covered bond characteristics
As at 31 March 2011S/M/F
Covered Bond rating AAA/Aaa/AAAIssuer rating A/A2/A+
Total Cover Pool Balance (DKK bn) 10.0Avg Loan Balance (DKK) 2,539,556No. of Loans: 3,924WA LTV (in %): 49.0OC at cut-off (in %): 29.1 Substitution collateral - Seasoning (in months): 46.0 Remaining term (in months): 261 Housing cooperatives (in %): 29.5
Source: Investor Report
Table 76: Pool C: Collateral pool LTV breakdown
Current LTV ranges As at 31 March 2011
0-<=40% 37.8>40%-<=50% 12.6>50%-<=60% 16.8>60%-<=70% 13.6>70%-<=80% 10.5>80% 8.8
Source: Investor report
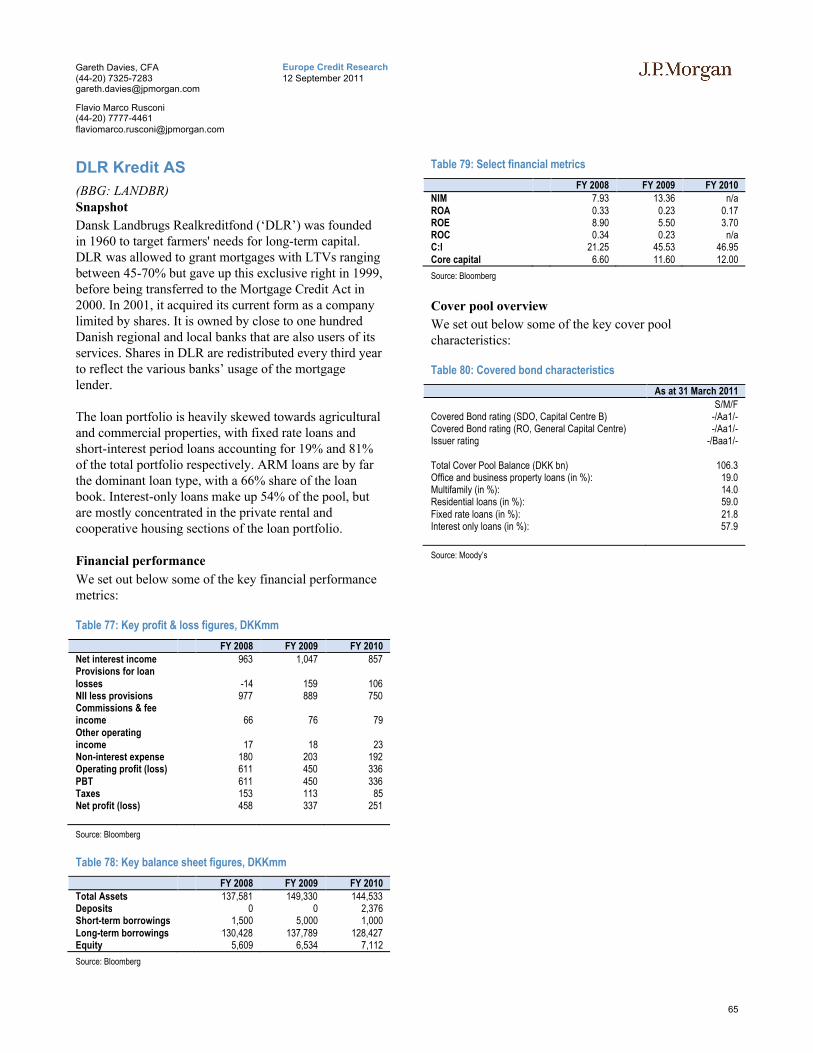
65
Europe Credit Research12 September 2011
Gareth Davies, CFA(44-20) [email protected]
Flavio Marco Rusconi(44-20) [email protected]
DLR Kredit AS
(BBG: LANDBR)Snapshot
Dansk Landbrugs Realkreditfond (‘DLR’) was founded in 1960 to target farmers' needs for long-term capital. DLR was allowed to grant mortgages with LTVs ranging between 45-70% but gave up this exclusive right in 1999, before being transferred to the Mortgage Credit Act in 2000. In 2001, it acquired its current form as a company limited by shares. It is owned by close to one hundred Danish regional and local banks that are also users of its services. Shares in DLR are redistributed every third year to reflect the various banks’ usage of the mortgage lender.
The loan portfolio is heavily skewed towards agricultural and commercial properties, with fixed rate loans and short-interest period loans accounting for 19% and 81% of the total portfolio respectively. ARM loans are by far the dominant loan type, with a 66% share of the loan book. Interest-only loans make up 54% of the pool, but are mostly concentrated in the private rental and cooperative housing sections of the loan portfolio.
Financial performance
We set out below some of the key financial performance metrics:
Table 77: Key profit & loss figures, DKKmm
FY 2008 FY 2009 FY 2010Net interest income 963 1,047 857Provisions for loan losses -14 159 106NII less provisions 977 889 750Commissions & fee income 66 76 79Other operating income 17 18 23Non-interest expense 180 203 192Operating profit (loss) 611 450 336PBT 611 450 336Taxes 153 113 85Net profit (loss) 458 337 251
Source: Bloomberg
Table 78: Key balance sheet figures, DKKmm
FY 2008 FY 2009 FY 2010Total Assets 137,581 149,330 144,533Deposits 0 0 2,376Short-term borrowings 1,500 5,000 1,000Long-term borrowings 130,428 137,789 128,427Equity 5,609 6,534 7,112
Source: Bloomberg
Table 79: Select financial metrics
FY 2008 FY 2009 FY 2010NIM 7.93 13.36 n/aROA 0.33 0.23 0.17ROE 8.90 5.50 3.70ROC 0.34 0.23 n/aC:I 21.25 45.53 46.95Core capital 6.60 11.60 12.00
Source: Bloomberg
Cover pool overview
We set out below some of the key cover pool characteristics:
Table 80: Covered bond characteristics
As at 31 March 2011
S/M/FCovered Bond rating (SDO, Capital Centre B) -/Aa1/-Covered Bond rating (RO, General Capital Centre) -/Aa1/-Issuer rating -/Baa1/-
Total Cover Pool Balance (DKK bn) 106.3Office and business property loans (in %): 19.0 Multifamily (in %): 14.0 Residential loans (in %): 59.0 Fixed rate loans (in %): 21.8 Interest only loans (in %): 57.9
Source: Moody’s

66
Europe Credit Research12 September 2011
Gareth Davies, CFA(44-20) [email protected]
Flavio Marco Rusconi(44-20) [email protected]
Nordea Kredit AS
(BBG: NBHSS)Snapshot
Nordea Kredit (‘Nordea’) grants mortgage lending secured by residential, commercial, agricultural and industrial properties in Denmark. The Nordea Group is a well established financial group catering to the Nordic and Baltic states, where it is consistently one of the largest by market share, with a small but growing presence in new European markets. No geographical market accounts for more than a quarter of income, out of a customer base of around 10mm households and corporates.
Nordea Kredit operates two covered bond Capital Centres: mortgage bonds (ROs) are issued out of Capital Centre I and constitute 31% of the loan pool. Covered bonds (SDROs) compliant with UCITS and CRD requirements are issued out of Capital Centre II and new issues are almost exclusively out of this CC.
Financial performance
We set out below some of the key financial performance metrics:
Table 81: Key profit & loss figures, DKKmm
FY 2008 FY 2009 FY 2010Net interest income 37,973 39,323 38,419Provisions for loan losses 3,474 11,065 6,546NII less provisions 34,499 28,258 31,873Commissions & fee income 18,879 18,377 22,006Other operating income 1,282 782 864Non-interest expense 37,176 39,367 41,815Operating profit (loss) 25,149 22,539 26,608PBT 25,321 22,897 27,100Taxes 5,398 5,637 7,268Net profit (loss) 19,915 17,230 19,787
Source: Bloomberg
Table 82: Key balance sheet figures, DKKmm
FY 2008 FY 2009 FY 2010Loans 1,973,200 2,101,000 2,341,700Total Assets 3,529,000 3,776,300 4,329,300Deposits 1,106,100 1,142,700 1,314,700Short-term borrowings 386,578 388,313 303,628Other ST borrowings 3,409 4,204 3,742Long-term borrowings 872,413 1,024,600 1,187,600Equity 132,524 166,813 182,627
Source: Bloomberg
Table 83: Select financial metrics
FY 2008 FY 2009 FY 2010NIM 1.48 1.42 1.25ROA 0.62 0.47 0.49ROE 15.35 11.55 11.36ROC 1.56 1.16 1.22C:I 53.05 49.99 51.96Core capital 7.40 10.20 9.80
Source: Bloomberg
Cover pool overview
We set out below some of the key cover pool characteristics:
Table 84: Covered bond characteristics
As at 31 March 2011
S/M/FCovered Bond rating AAA/Aaa/-Issuer rating (Nordea Bank Danmark) AA-/Aa3/AA-
Total Cover Pool Balance (DKK bn) 318.6Capital Centre 1 (in %): 31.3 Capital Centre 2 (in %): 68.7 WA LTV (in %): 65.0 Fixed rate mortgages (in %) 40.9 ARM mortgages (in %): 47.7 Interest only mortgages (in %): 56.6
Source: Investor Report

67
Europe Credit Research12 September 2011
Gareth Davies, CFA(44-20) [email protected]
Flavio Marco Rusconi(44-20) [email protected]
Nykredit Realkredit AS (‘Nykredit’)
(BBG: NYKRE)Snapshot
Nykredit is the second largest lender and the largest mortgage provider in Denmark, with a share of 42% of the mortgage lending market and 5% of the commercial banking market. The group also offers insurance, pension and estate agency services and products. Nykredit Realkredit is wholly owned by Nykredit Holding AS (majority owned by the Nykredit Foundation (88.61%)). In 2003 Nykredit acquired Totalkredit, which currently operates as a wholly owned subsidiary. Since 2006 the two have been jointly funded, with Totalkredit covered bonds originally issued out of Capital Centre D. Since 2007, these are issued out of Capital Centre E with the pre-existing series being grandfathered in accordance with the CRD. Nykredit is the largest issuer of Danish mortgage bonds, and one of the largest private bond issuers in Europe.
Financial performance
We set out below some of the key financial performance metrics:
Table 85: Key profit & loss figures, DKKmm
FY 2008 FY 2009 FY 2010Net interest income 7,974 11,294 11,261Provisions for loan losses 1,443 7,919 2,382NII less provisions 6,531 3,375 8,879Commissions & fee income 1,374 2,026 2,149Other operating income 1,634 1,686 209Non-interest expense 7,622 8,977 7,629Operating profit (loss) -1,004 305 3,397PBT -881 179 3,433Taxes -186 50 873Net profit (loss) -695 129 4,071
Source: Bloomberg
Table 86: Key balance sheet figures, DKKmm
FY 2008 FY 2009 FY 2010Loans 994,185 1,055,003 1,103,540Total Assets 1,218,127 1,247,263 1,311,142Deposits 61,177 64,483 55,369Short-term borrowings 162,549 119,313 95,879Other ST borrowings 72 1,008 160Long-term borrowings 865,725 949,524 1,018,506Equity 50,377 51,241 55,420
Source: Bloomberg
Table 87: Select financial metrics
FY 2008 FY 2009 FY 2010NIM 0.72 0.95 0.91ROE -1.33 0.25 7.63C:I 93.54 47.56 51.08Core capital 13.50 n/a 18.50
Source: Bloomberg
Cover pool overview
We set out below some of the key cover pool characteristics:
Table 88: Pool D (RO): Covered bond characteristics
As at 31 March 2011S/M/F
Covered Bond rating AAA/Aaa/-Issuer rating A+/A2/-
Total Cover Pool Balance (DKK bn) 309.3 Avg Loan Balance: 1,381,640 No. of Loans: 223,881 WA LTV (in %): 53.8 Fixed rate loans (in %): 36.1 Interest only (in %): 50.8
Source: Investor Report
Table 89: Pool D (RO): Collateral pool LTV breakdown
Current LTV ranges As at 31 March 2011
0-<=40% 19.0 >40%-<=60% 33.0 >60%-<=70% 18.0 >70%-<=80% 15.0 >80%-<=90% 8.0 >90% 7.0
Source: Investor report
Table 90: Pool E (SDO): Covered bond characteristics
As at 31 March 2011
S/M/FCovered Bond rating AAA/Aaa/-Issuer rating A+/A2/-
Total Cover Pool Balance (DKK bn) 583.2 Avg Loan Balance: 1,443,157 No. of Loans: 404,141 WA LTV (in %): 62.9 Fixed rate loans (in %): 14.3 Interest only (in %): 63.3
Source: Investor Report
Table 91: Pool E (SDO): Collateral pool LTV breakdown
Current LTV ranges As at 31 March 20110-<=40% 10.0 >40%-<=60% 20.0 >60%-<=70% 18.0 >70%-<=80% 34.0 >80%-<=90% 13.0 >90% 5.0
Source: Investor report

68
Europe Credit Research12 September 2011
Gareth Davies, CFA(44-20) [email protected]
Flavio Marco Rusconi(44-20) [email protected]
Realkredit Danmark AS (‘Realkredit’)
(BBG: RDKRE)Snapshot
Realkredit Danmark (‘RD’) specialises in mortgage lending secured by residential, commercial, agricultural and industrial properties. RD dates back to 1851 but it became a wholly owned subsidiary of the Danske Bank Group in 2001.
RD’s main market is Denmark, where it is the secondlargest specialist mortgage lender, but also offers loans secured by properties in the UK, Sweden, Faroe Islands and Greenland.
Financial performance
We set out below some of the key financial performance metrics:
Table 92: Key profit & loss figures, DKKmm
FY 2008 FY 2009 FY 2010Net interest income 4,832 5,732 4,941Provisions for loan losses 417 1,265 n/aNII less provisions 4,415 4,467 4,941Commissions & fee income 454 516 -501Other operating income 11 7 168Non-interest expense 824 1,012 1,873Operating profit (loss) 3,805 3,333 2,289PBT 3,805 3,333 2,294Taxes 952 841 573Net profit (loss) 2,853 2,492 1,721
Source: Bloomberg
Table 93: Key balance sheet figures, DKKmm
FY 2008 FY 2009 FY 2010Loans 670,320 692,040 705,342Total Assets 710,871 746,170 757,621Deposits 0 0 n/aShort-term borrowings 8,111 26,855 27,408Other ST borrowings 0 131 n/aLong-term borrowings 0 2,037 2,061Equity 38,528 41,020 42,883
Source: Bloomberg
Table 94: Select financial metrics
FY 2008 FY 2009 FY 2010NIM 0.72 0.83 0.69ROA 0.40 0.33 0.23ROE 7.60 6.50 4.10ROC 6.05 4.28 2.42C:I 19.50 17.20 45.00Core capital 56.50 44.20 38.80
Source: Bloomberg
Cover pool overview
We set out below some of the key cover pool characteristics:
Table 95: Covered bond characteristics
As at 31 March 2011
S/M/FCovered Bond rating AAA/-/-Issuer rating (Danske Bank) A/A2/A+
Total Cover Pool Balance (DKK bn) 526.0WA LTV (in %): 66Seasoning (mths) 35Remaining term (mths) 311Residential loans (in %): 61Commercial loans (in %): 26Multifamily loans (in %): 13Fixed rate loans (in %): 12.5
Source: Investor Report

69
Europe Credit Research12 September 2011
Gareth Davies, CFA(44-20) [email protected]
Flavio Marco Rusconi(44-20) [email protected]
Du
tch
Co
ve
red
Bo
nd
s
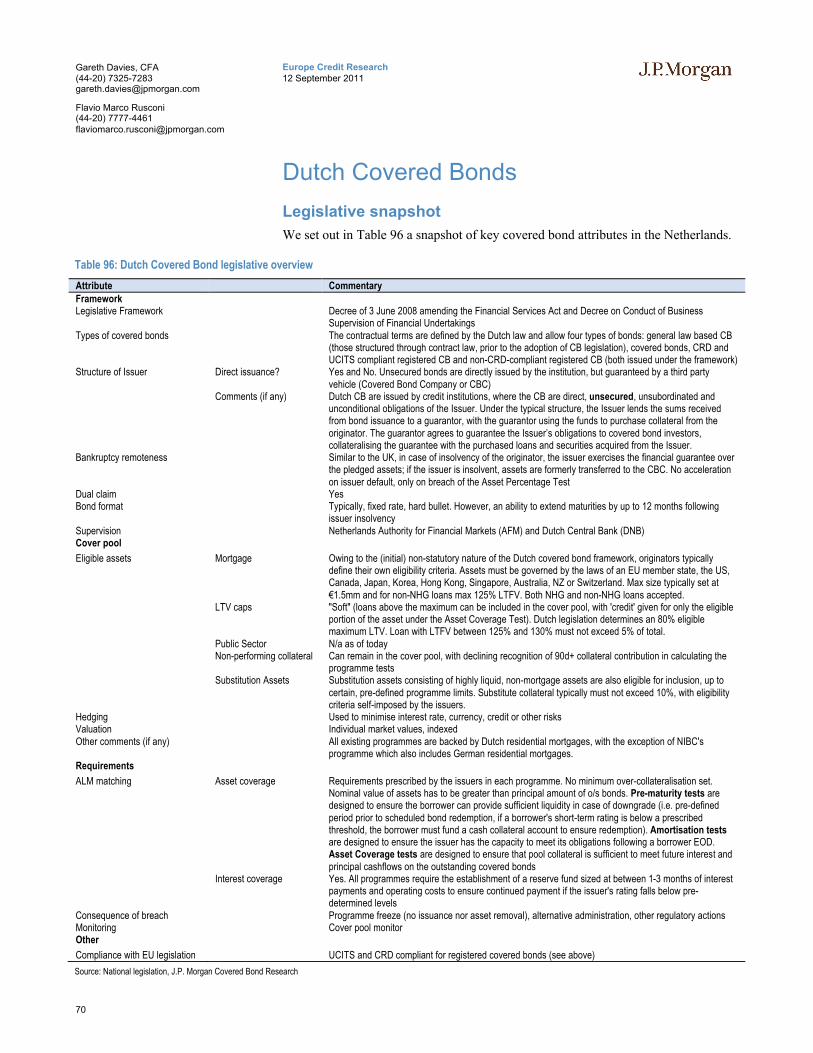
70
Europe Credit Research12 September 2011
Gareth Davies, CFA(44-20) [email protected]
Flavio Marco Rusconi(44-20) [email protected]
Dutch Covered Bonds
Legislative snapshot
We set out in Table 96 a snapshot of key covered bond attributes in the Netherlands.
Table 96: Dutch Covered Bond legislative overview
Attribute CommentaryFrameworkLegislative Framework Decree of 3 June 2008 amending the Financial Services Act and Decree on Conduct of Business
Supervision of Financial UndertakingsTypes of covered bonds The contractual terms are defined by the Dutch law and allow four types of bonds: general law based CB
(those structured through contract law, prior to the adoption of CB legislation), covered bonds, CRD and UCITS compliant registered CB and non-CRD-compliant registered CB (both issued under the framework)
Structure of Issuer Direct issuance? Yes and No. Unsecured bonds are directly issued by the institution, but guaranteed by a third party vehicle (Covered Bond Company or CBC)
Comments (if any) Dutch CB are issued by credit institutions, where the CB are direct, unsecured, unsubordinated andunconditional obligations of the Issuer. Under the typical structure, the Issuer lends the sums received from bond issuance to a guarantor, with the guarantor using the funds to purchase collateral from the originator. The guarantor agrees to guarantee the Issuer’s obligations to covered bond investors, collateralising the guarantee with the purchased loans and securities acquired from the Issuer.
Bankruptcy remoteness Similar to the UK, in case of insolvency of the originator, the issuer exercises the financial guarantee over the pledged assets; if the issuer is insolvent, assets are formerly transferred to the CBC. No acceleration on issuer default, only on breach of the Asset Percentage Test
Dual claim YesBond format Typically, fixed rate, hard bullet. However, an ability to extend maturities by up to 12 months following
issuer insolvencySupervision Netherlands Authority for Financial Markets (AFM) and Dutch Central Bank (DNB)Cover pool
Eligible assets Mortgage Owing to the (initial) non-statutory nature of the Dutch covered bond framework, originators typically define their own eligibility criteria. Assets must be governed by the laws of an EU member state, the US, Canada, Japan, Korea, Hong Kong, Singapore, Australia, NZ or Switzerland. Max size typically set at €1.5mm and for non-NHG loans max 125% LTFV. Both NHG and non-NHG loans accepted.
LTV caps "Soft" (loans above the maximum can be included in the cover pool, with 'credit' given for only the eligible portion of the asset under the Asset Coverage Test). Dutch legislation determines an 80% eligible maximum LTV. Loan with LTFV between 125% and 130% must not exceed 5% of total.
Public Sector N/a as of todayNon-performing collateral Can remain in the cover pool, with declining recognition of 90d+ collateral contribution in calculating the
programme testsSubstitution Assets Substitution assets consisting of highly liquid, non-mortgage assets are also eligible for inclusion, up to
certain, pre-defined programme limits. Substitute collateral typically must not exceed 10%, with eligibility criteria self-imposed by the issuers.
Hedging Used to minimise interest rate, currency, credit or other risksValuation Individual market values, indexedOther comments (if any) All existing programmes are backed by Dutch residential mortgages, with the exception of NIBC's
programme which also includes German residential mortgages. Requirements
ALM matching Asset coverage Requirements prescribed by the issuers in each programme. No minimum over-collateralisation set. Nominal value of assets has to be greater than principal amount of o/s bonds. Pre-maturity tests are designed to ensure the borrower can provide sufficient liquidity in case of downgrade (i.e. pre-defined period prior to scheduled bond redemption, if a borrower's short-term rating is below a prescribed threshold, the borrower must fund a cash collateral account to ensure redemption). Amortisation testsare designed to ensure the issuer has the capacity to meet its obligations following a borrower EOD. Asset Coverage tests are designed to ensure that pool collateral is sufficient to meet future interest and principal cashflows on the outstanding covered bonds
Interest coverage Yes. All programmes require the establishment of a reserve fund sized at between 1-3 months of interest payments and operating costs to ensure continued payment if the issuer's rating falls below pre-determined levels
Consequence of breach Programme freeze (no issuance nor asset removal), alternative administration, other regulatory actions Monitoring Cover pool monitorOther
Compliance with EU legislation UCITS and CRD compliant for registered covered bonds (see above)
Source: National legislation, J.P. Morgan Covered Bond Research

71
Europe Credit Research12 September 2011
Gareth Davies, CFA(44-20) [email protected]
Flavio Marco Rusconi(44-20) [email protected]
Dutch covered bond & macro backdrop
Figure 47: CB issuance, €mm
Source: ECBC. Latest data available displayed
Figure 48: CB outstanding, €mm
Source: ECBC. Latest data available displayed
Figure 49: Dutch real GDP growth, y-on-y, %
Source: Bloomberg
Figure 50: Dutch unemployment level, %
Source: Bloomberg
Figure 51: Dutch CPI and base rate, %
Source: Bloomberg
Figure 52: Dutch consumer confidence, balance of survey
Source: Bloomberg
Figure 53: Dutch house price growth, %
Source: Bloomberg
Figure 54: Dutch outstanding mortgages (€mm) and annual growth of mortgage stock, %
Source: ECB
0
2,000
4,000
6,000
8,000
10,000
12,000
14,000
16,000
2003 2004 2005 2006 2007 2008 2009 2010
Mortgage
0
10,000
20,000
30,000
40,000
50,000
2003 2004 2005 2006 2007 2008 2009 2010
Mortgage
-6
-4
-2
0
2
4
6
Mar
-00
Mar
-01
Mar
-02
Mar
-03
Mar
-04
Mar
-05
Mar
-06
Mar
-07
Mar
-08
Mar
-09
Mar
-10
Mar
-11
Real GDP growth
0
1
2
3
4
5
6
7
8
Jan-
00
Jan-
01
Jan-
02
Jan-
03
Jan-
04
Jan-
05
Jan-
06
Jan-
07
Jan-
08
Jan-
09
Jan-
10
Jan-
11
Unemployment
0.00.51.01.52.02.53.03.54.04.55.0
Mar
-00
Mar
-01
Mar
-02
Mar
-03
Mar
-04
Mar
-05
Mar
-06
Mar
-07
Mar
-08
Mar
-09
Mar
-10
Mar
-11
Inflation Base rate
-50-40-30-20-10
010203040
Mar
-00
Mar
-01
Mar
-02
Mar
-03
Mar
-04
Mar
-05
Mar
-06
Mar
-07
Mar
-08
Mar
-09
Mar
-10
Mar
-11
Cons. Confidence
-10%
-5%
0%
5%
10%
15%
20%
25%
Jan-
00
Jan-
01
Jan-
02
Jan-
03
Jan-
04
Jan-
05
Jan-
06
Jan-
07
Jan-
08
Jan-
09
Jan-
10
Jan-
11
House price growth
0
50,000
100,000
150,000
200,000
250,000
Dec
-00
Dec
-01
Dec
-02
Dec
-03
Dec
-04
Dec
-05
Dec
-06
Dec
-07
Dec
-08
Dec
-09
Dec
-10
Annual owner occ.dwelling transactions

72
Europe Credit Research12 September 2011
Gareth Davies, CFA(44-20) [email protected]
Flavio Marco Rusconi(44-20) [email protected]
ABN Amro Bank NV (‘ABN’)
(BBG: ABNANV)Snapshot
ABN Amro Bank NV (‘ABN’) is a full service financial institution offering retail, private and commercial banking clients a broad range of financial products, from its base in the Netherlands. On 1st July 2010, the legal merger between ABN Amro Bank NV and Fortis Bank (Nederland) NV was completed, creating a combined entity called ABN Amro Bank NV. This institution is wholly owned by the Dutch government, and will eventually be returned to the private sector.
The ABN covered bond programme is backed by Dutch residential mortgages, and is registered with the Dutch central bank.
Financial performance
We set out below some of the key financial performance metrics:
Table 97: Key profit & loss figures, €mm
FY 2008 FY 2009 FY 2010Net interest income 4,512 4,268 4,905Provisions for loan losses 0 0 0NII less provisions 4,512 4,268 4,905
Comm.& fee income 1,383 2,400 2,550Other operating income 273 806 -508Non-interest expense 3,845 6,016 7,013Operating profit (loss) 2,694 1,800 568
PBT 1,918 215 -269Taxes 158 -59 145Net profit (loss) 4,819 272 -417
Source: Annual Report
Table 98: Key balance sheet figures, €mm
FY 2008 FY 2009 FY 2010
Total Assets 183,539 386,524 379,599Short-term borrowings 730 26,951 19,982Other ST borrowings 125,272 254,484 240,170Equity 7,044 8,955 12,112
Source: Annual Report
Cover pool overview
We set out below some of the key cover pool characteristics:
Table 99: Covered bond characteristics
As at 30 June 2011
RatingsCovered bond rating AAA/Aaa/AAAIssuer rating A/Aa3/A+
Cover pool Jun-11Mortgage balance (€bn) 31.0 Bonds outstanding (€bn) 21.8 Asset percentage 80.7 Credit support (%) 104.0
# mortgages 170,161 Avg loan balance 98,151 WA Current LTV (%) 75.0 WA Current LTFV (%) 88.2
WA Indexed LTV (%) 72.2 WA Indexed LTFV (%) 85.0
WA seasoning (mths) 69.4
Top regional concentrationsZuid-Holland 21.9 Noord-Holland 20.3 Noord-Brabant 15.5
Source: Investor Report
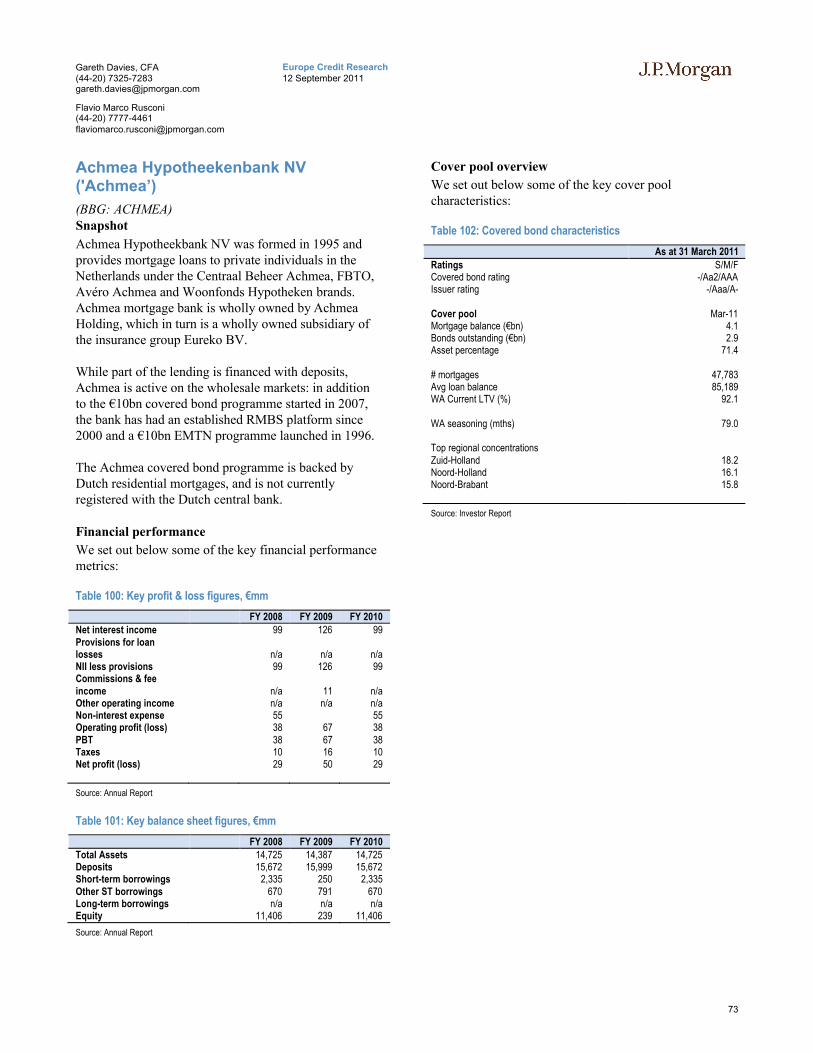
73
Europe Credit Research12 September 2011
Gareth Davies, CFA(44-20) [email protected]
Flavio Marco Rusconi(44-20) [email protected]
Achmea Hypotheekenbank NV ('Achmea’)
(BBG: ACHMEA)Snapshot
Achmea Hypotheekbank NV was formed in 1995 and provides mortgage loans to private individuals in the Netherlands under the Centraal Beheer Achmea, FBTO, Avéro Achmea and Woonfonds Hypotheken brands. Achmea mortgage bank is wholly owned by Achmea Holding, which in turn is a wholly owned subsidiary of the insurance group Eureko BV.
While part of the lending is financed with deposits, Achmea is active on the wholesale markets: in addition to the €10bn covered bond programme started in 2007, the bank has had an established RMBS platform since 2000 and a €10bn EMTN programme launched in 1996.
The Achmea covered bond programme is backed by Dutch residential mortgages, and is not currently registered with the Dutch central bank.
Financial performance
We set out below some of the key financial performance metrics:
Table 100: Key profit & loss figures, €mm
FY 2008 FY 2009 FY 2010Net interest income 99 126 99Provisions for loan losses n/a n/a n/aNII less provisions 99 126 99Commissions & fee income n/a 11 n/aOther operating income n/a n/a n/aNon-interest expense 55 55Operating profit (loss) 38 67 38PBT 38 67 38Taxes 10 16 10Net profit (loss) 29 50 29
Source: Annual Report
Table 101: Key balance sheet figures, €mm
FY 2008 FY 2009 FY 2010Total Assets 14,725 14,387 14,725Deposits 15,672 15,999 15,672Short-term borrowings 2,335 250 2,335Other ST borrowings 670 791 670Long-term borrowings n/a n/a n/aEquity 11,406 239 11,406
Source: Annual Report
Cover pool overview
We set out below some of the key cover pool characteristics:
Table 102: Covered bond characteristics
As at 31 March 2011
Ratings S/M/FCovered bond rating -/Aa2/AAAIssuer rating -/Aaa/A-
Cover pool Mar-11Mortgage balance (€bn) 4.1 Bonds outstanding (€bn) 2.9 Asset percentage 71.4
# mortgages 47,783 Avg loan balance 85,189 WA Current LTV (%) 92.1
WA seasoning (mths) 79.0
Top regional concentrationsZuid-Holland 18.2 Noord-Holland 16.1 Noord-Brabant 15.8
Source: Investor Report

74
Europe Credit Research12 September 2011
Gareth Davies, CFA(44-20) [email protected]
Flavio Marco Rusconi(44-20) [email protected]
ING Bank NV (‘ING’)
(BBG: INTNED)Snapshot
ING Bank NV is the Dutch subsidiary of the ING Group, a global financial institution based in the Netherlands. ING offers a wide range of financial products, including banking, insurance, investments and retirement services.
At the end of 2009, ING announced that it will proceed with a gradual separation of its banking and insurance businesses, to be completed by the end of 2013, in order to provide more efficient and agile operations.
The ING covered bond programme is backed by Dutch residential mortgages, and is registered with the Dutch central bank.
Financial performance
We set out below some of the key financial performance metrics:
Table 103: Key profit & loss figures, €mm
FY 2008 FY 2009 FY 2010Net interest income 8,900 11,020 14,034Provisions for loan losses 1,280 2,973 1,751NII less provisions 7,620 8,047 12,283
3,994 3,553 3,556Comm.& fee income 492 456 346Other operating income 11,309 10,571 11,047Non-interest expense 897 1,384 5,922Operating profit (loss) 533 500 5,523
-170 -43 948PBT 772 684 4,495Taxes 8,900 11,020 14,034Net profit (loss) 1,280 2,973 1,751
Source: Annual Report
Table 104: Key balance sheet figures, €mm
FY 2008 FY 2009 FY 2010
Loans 598,328 551,774 587,448 Total Assets 1,034,689 882,119 933,073 Deposits 537,683 477,602 519,304 Short-term borrowings 205,272 148,909 145,214 Other ST borrowings 183,632 130,264 131,229 Long-term borrowings 66,931 77,350 86,432 Equity 24,121 31,217 35,069
Source: Annual Report
Table 105: Select financial metrics
FY 2008 FY 2009 HY 2010NIM 0.9 1.2 1.6 ROA 0.1 0.1 0.5 ROE 3.2 2.6 13.9 ROC 0.2 0.2 1.7 C:I 82.4 69.0 56.9 Core capital 9.3 10.2 12.3
Source: Bloomberg
Cover pool overview
We set out below some of the key cover pool characteristics:
Table 106: Covered bond characteristics
As at 31 July 2011
S/M/FCovered Bond rating AAA/Aaa/AAAIssuer rating A+/Aa3/A+
Cover pool size (€) 33,827,518,280 Number of loans parts 365,681.0 Avg loan parts (€) 92,506
WA original LTMV (in %) 70.41Remaining tenor (yrs) 22.74WA seasoning (yrs) 6.92
Interest only (in %) 67.17WA avg Debt to Income 4.22WA avg Payment to Income (in %) 20Highest regional concentration (in %) Zuid-Holland 21
Source: Investor Report
Table 107: Collateral pool LTV breakdown
Current LTV ranges As at 31 July 2011
0-<=40% 15.7 >40%-<=50% 8.7 >50%-<=60% 10.7 >60%-<=70% 11.5 >70%-<=80% 11.8 >80%-<=100% 41.6
Source: Investor Report

75
Europe Credit Research12 September 2011
Gareth Davies, CFA(44-20) [email protected]
Flavio Marco Rusconi(44-20) [email protected]
NIBC Bank NV (‘NIBC’)
(BBG: NIBCAP)Snapshot
NIBC offers merchant banking and specialised finance in sectors such as shipping, oil & gas services, infrastructure & renewables and real estate. Merchant Banking provides end-clients with investment banking products in the Benelux and Germany, while Specialised Finance focuses on asset and project financing, along with the Group's retail activities including residential mortgages and retail savings. The bank was founded in 1945, and subsequently two Dutch pension funds, ABP and PGGM, acquired 85% of NIB, creating the NIB Capital brand, while 15% was owned by the Dutch Government. In 2005, a consortium of financial institutions, led by J.C. Flowers & Co. purchased all equity interests in the bank, which changed its name to NIBC. The NIBC covered bond programme is backed by both Dutch and German resi mortgages, and is registered with the Dutch central bank.
Financial performance
We set out below some of the key financial performance metrics:
Table 108: Key profit & loss figures, €mm
FY 2008 FY 2009 FY 2010Net interest income 257 64 132NII less provisions 257 64 132Comm. & fee income 43 32 26Non-interest expense 200 187 221Operating profit (loss) 164 165 163PBT 94 41 88Taxes 1 -2 8Net profit (loss) 92 43 76
Source: Annual Report
Table 109: Key balance sheet figures, €mm
FY 2008 FY 2009 FY 2010Loans 8,807 8,933 7,005 Total Assets 28,937 29,189 28,009 Deposits 2,293 4,332 4,781 Short-term borrowings 5,546 2,601 1,354 Other ST borrowings 3,481 3,213 3,382 Long-term borrowings 15,078 16,605 n/aEquity 1,638 1,696 1,803
Source: Annual Report
Table 110: Select financial metrics
FY 2008 FY 2009 HY 2010NIM 1.3 0.6 n/aROA 0.3 0.2 n/aROE 5.9 2.7 5.0 ROC 0.4 0.2 n/aC:I 54.7 53.9 50.0 Core capital 16.6 n/a 14.5
Source: Bloomberg
Cover pool overview
We set out below some of the key cover pool characteristics:
Table 111: Covered bond characteristics–Dutch assets
As at 30 June 2011
S/M/FCovered Bond rating /A1/AAAIssuer rating BBB/Baa3/BBBCover pool size (€) 935,548,876% of pool 80.5
WA Current LTFV (in %) 90.3WA Indexed LTFV (in %) 79.9Seasoning (mths) 75.6Number of loans 5,206 Avg principal balance (borrower) 176,481 Avg principal balance (loan part) 84,221 Interest only (in %) 63.2Highest regional concentration (in %) Zuid-Holland 21
Original LTFV distribution (in %)<=50% 17.1>50%-<=60% 7.1>60%-<=70% 7.3>70%-<=80% 11.6>80%-<=90% 11.4>90%-<=100% 9.3>100% 36.0
Source: Investor Report

76
Europe Credit Research12 September 2011
Gareth Davies, CFA(44-20) [email protected]
Flavio Marco Rusconi(44-20) [email protected]
Table 112: Covered bond characteristics–German assets
As at 30 June 2011S/M/F
Covered Bond rating /A1/AAAIssuer rating BBB/Baa3/BBB
Cover pool size (€) 226,618,386Share of total pool (in %) 19.5 WA Current LTFV (in %) 63.8 WA Indexed LTFV (in %) 63.8 Seasoning (mths) 103.2 Number of loans 2,232 Avg principal balance (borrower) 101,532 Avg principal balance (loan part) 45,837 Annuity (in %) 93.8 Highest regional concentration (in %) NRW 29.2
Original LTFV distribution (in %)<=50% 18.3 >50%-<=60% 23.0 >60%-<=70% 28.3 >70%-<=60% 19.7 >80%-<=90% 7.1 >90%-<=100% 1.6 >100% 2.0
Source: Investor Report

77
Europe Credit Research12 September 2011
Gareth Davies, CFA(44-20) [email protected]
Flavio Marco Rusconi(44-20) [email protected]
SNS Bank NV (‘SNS’)
(BBG: SNSSNS)Snapshot
SNS Bank NV is the mortgage lender of the SNS Reaal Group, whose product range spans mortgage and property finance, savings and investment products and insurance and pensions. SNS Reaal reached its current form in 1997, after the merger of SNS Groep, whichfocused mainly on retail banking, and Reaal Groep, whose main business line was insurance.
In addition to the covered bond programme, SNS has at its disposal a €25bn MTN platform and is also the originator behind one of the longest standing RMBS platforms in the Dutch market, HERMES.
The SNS covered bond programme is backed by Dutch residential mortgages, and is registered with the Dutch central bank.
Financial performance
We set out below some of the key financial performance metrics:
Table 113: Key profit & loss figures, €mm
FY 2008 FY 2009 FY 2010Net interest income 773 672 918Provisions for loan losses 0NII less provisions 773 672 918Commissions & fee income 152 136 138Other operating income 2 1 4Non-interest expense 773 1,197 622Operating profit (loss) 418PBT 183 -99 -532Taxes 36 -1 -101Net profit (loss) 147 -98 -431
Source: Annual Report
Table 114: Key balance sheet figures, €mm
FY 2008 FY 2009 FY 2010
Loans 68,577 70,194 65,013 Total Assets 76,695 80,289 78,918 Deposits 21,859 24,435 37,880 Short-term borrowings 16,675 16,954 5,118 Other ST borrowings 323 Long-term borrowings 30,282 30,739 29,523 Equity 2,404 2,434 1,836
Source: Annual Report
Table 115: Select financial metrics
FY 2008 FY 2009 HY 2010NIM n/aROA -0.5 ROE 6.7 -4.6 -20.2 ROC -1.1 C:I 62.8 56.6 57.9 Core capital 10.5 10.7 n/a
Source: Bloomberg
Cover pool overview
We set out below some of the key cover pool characteristics:
Table 116: Covered bond characteristics
As at 30 June 2011
S/M/FCovered Bond rating -/Aa1/AAAIssuer rating -/Baa1/BBB+
Cover pool size (€) 6,450,149,852Number of loans 37,625Avg loan (€) 169,855
WA original LTMV (in %) 76.0WA indexed LTMV (in %) 74.0Remaining tenor (yrs) 24.5WA seasoning (mths) 59.6
Interest only (in %) 82.4 Savings mtges (in %) 10.5 National mortgage guarantee (in %) 15.0 Highest regional concentration (in %) Limburg 17.2
Source: Investor Report
Table 117: Collateral pool LTV breakdown
Current LTV ranges As at 30 June 2011
0-<=40% 4.4 >40%-<=50% 4.3 >50%-<=60% 7.4 >60%-<=70% 12.0 >70%-<=80% 18.7 >80%-<=90% 6.6 >90%-<=100% 9.1 >100% 37.6
Source: Investor Report

78
Europe Credit Research12 September 2011
Gareth Davies, CFA(44-20) [email protected]
Flavio Marco Rusconi(44-20) [email protected]

79
Europe Credit Research12 September 2011
Gareth Davies, CFA(44-20) [email protected]
Flavio Marco Rusconi(44-20) [email protected]
Fin
nis
h C
ove
red
Bo
nd
s

80
Europe Credit Research12 September 2011
Gareth Davies, CFA(44-20) [email protected]
Flavio Marco Rusconi(44-20) [email protected]
Finnish Covered Bonds
Legislative snapshot
We set out in Table 62 a snapshot of key covered bond attributes in the Finland.
Table 118: Finnish Covered Bond legislative overview
Attribute CommentaryFrameworkLegislative Framework Act on Mortgage Credit Banks (1240/1999), as subsequently amendedTypes of covered bonds Two. Direct balance sheet issuance from a Deposit Bank or via a specialist banking subsidiary (Mortgage
Credit Bank or MCB)Structure of Issuer Direct issuance? Yes
Comments (if any)Bankruptcy remoteness Segregation of assets in a special cover register, with a preferential claim on registered collateral.
Bankruptcy of the Deposit Bank or MCB does not automatically result in acceleration of the covered bonds (first step is to find a new sponsor for the programme), except where breach of the asset eligibility criteria has occurred. Here, the cover pool can be sold on instruction of the FSA-appointed attorney directing the bankruptcy administrator, with all existing bondholders due and payable (pari passu).
Dual claim YesBond format Typically, fixed rate. Mix of hard and soft bullet bonds. Nordea and Aktia issue hard bullet bonds, while Op
and Sampo have the ability to extend maturities by up to 12 months at the discretion of the issuerSupervision Finnish FSACover pool
Eligible assets Mortgage Residential and commercial mortgages, along with shares in housing companies, with commercial mortgages capped at 10% of the cover pool. Both residential and commercial properties must be situated in Finland or other members of the EEA
LTV caps Up to 70% LTV for residential exposures and 60% LTV for commercial mortgage exposures. CB investors only benefit from the eligible cover pool element of the mortgage (max 70% LTV for residential mortgages, 60% for commercial)
Public Sector Loans to public authorities can also be included in the cover pool at book valueNon-performing collateral NPLs greater than 90d must be removed from the cover pool calculationsSubstitution Assets Substitute assets (limited to a maximum of 20% of the cover pool) can include government or other public
sector exposures, credit institutions and cashHedging Elimination of interest rate and currency risk through hedgingValuation Individual market values for underlying collateralOther comments (if any)Requirements
ALM matching Asset coverage Matching by nominal value, currency and duration (average term to maturity of CB is shorter than average term to maturity of collateral assets). Minimum required over-collateralisation defined as 2% of the Net Present Value by law and issuer/programme specific levels.
Interest coverage Interest received in a given 12 month period must be greater than interest due on the liabilitiesOther (if any)
Consequence of breach Cancelling the license or other regulatory actionMonitoring Monitored on a monthly basis by the FSAOther
Compliance with EU legislation
UCITS and CRD compliant.
Source: National legislation, J.P. Morgan Covered Bond Research

81
Europe Credit Research12 September 2011
Gareth Davies, CFA(44-20) [email protected]
Flavio Marco Rusconi(44-20) [email protected]
Finnish covered bond & macro backdrop
Figure 55: CB issuance, €m
Source: ECBC. Latest data available displayed
Figure 56: CB outstanding, €mm
Source: ECBC. Latest data available displayed
Figure 57: Finnish real GDP growth, y-on-y, %
Source: Bloomberg
Figure 58: Finnish unemployment level, %
Source: Bloomberg
Figure 59: Finnish CPI and base rate, %
Source: Bloomberg
Figure 60: Finnish consumer confidence, balance of survey
Source: Bloomberg
Figure 61: Finnish house price growth, y-on-y, %
Source: Bloomberg
Figure 62: Finnish construction & production index, #
Source: Bloomberg
0
1,000
2,000
3,000
4,000
5,000
6,000
2003 2004 2005 2006 2007 2008 2009 2010
Mortgage
0
2,000
4,000
6,000
8,000
10,000
12,000
2003 2004 2005 2006 2007 2008 2009 2010
Mortgage
-12-10
-8-6-4-202468
Mar
-00
Mar
-01
Mar
-02
Mar
-03
Mar
-04
Mar
-05
Mar
-06
Mar
-07
Mar
-08
Mar
-09
Mar
-10
Mar
-11
Real GDP growth
0
2
4
6
8
10
12
Mar
-00
Mar
-01
Mar
-02
Mar
-03
Mar
-04
Mar
-05
Mar
-06
Mar
-07
Mar
-08
Mar
-09
Mar
-10
Mar
-11
Unemployment
-2
-1
0
1
2
3
4
5
6
Mar
-00
Mar
-01
Mar
-02
Mar
-03
Mar
-04
Mar
-05
Mar
-06
Mar
-07
Mar
-08
Mar
-09
Mar
-10
Mar
-11
Inflation Base rate
-10
-5
0
5
10
15
20
25
Mar
-00
Mar
-01
Mar
-02
Mar
-03
Mar
-04
Mar
-05
Mar
-06
Mar
-07
Mar
-08
Mar
-09
Mar
-10
Mar
-11
Cons. Confidence
-8%-6%-4%-2%0%2%4%6%8%
10%12%14%
Mar
-01
Mar
-02
Mar
-03
Mar
-04
Mar
-05
Mar
-06
Mar
-07
Mar
-08
Mar
-09
Mar
-10
Mar
-11
OECD HP nominal growth
0
20
40
60
80
100
120
140
160
Mar
-00
Mar
-01
Mar
-02
Mar
-03
Mar
-04
Mar
-05
Mar
-06
Mar
-07
Mar
-08
Mar
-09
Mar
-10
Mar
-11
OECD Construction production index
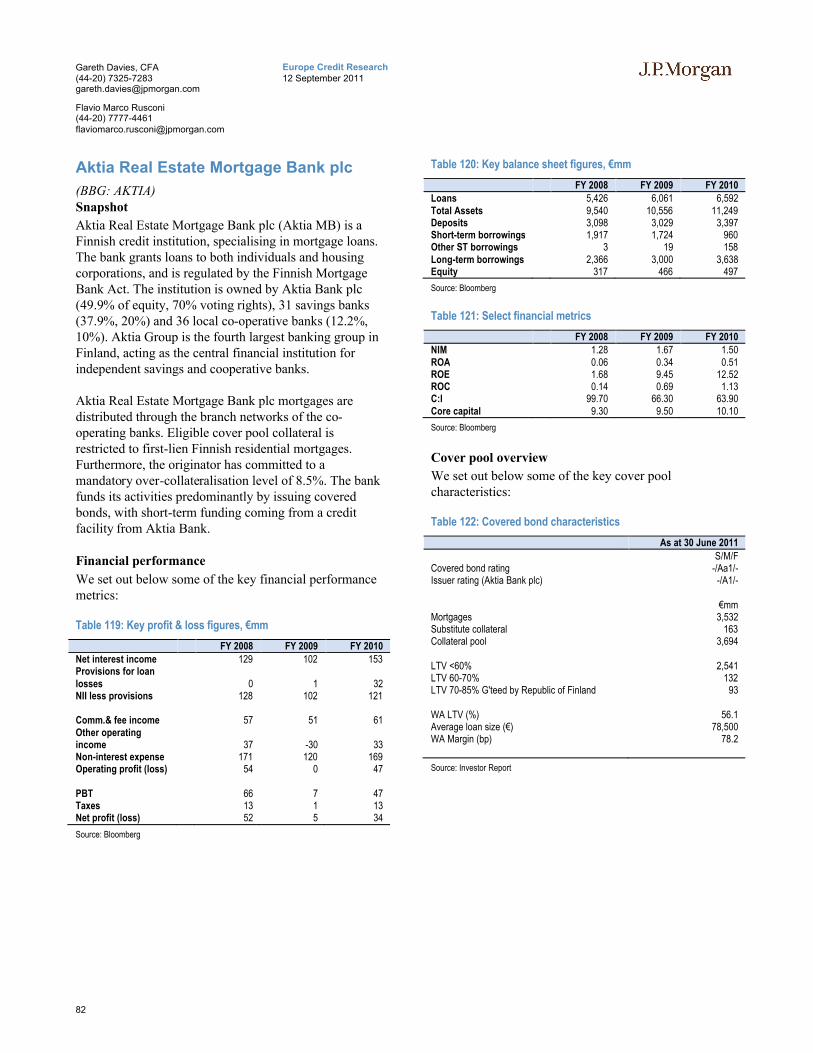
82
Europe Credit Research12 September 2011
Gareth Davies, CFA(44-20) [email protected]
Flavio Marco Rusconi(44-20) [email protected]
Aktia Real Estate Mortgage Bank plc
(BBG: AKTIA)Snapshot
Aktia Real Estate Mortgage Bank plc (Aktia MB) is a Finnish credit institution, specialising in mortgage loans. The bank grants loans to both individuals and housing corporations, and is regulated by the Finnish Mortgage Bank Act. The institution is owned by Aktia Bank plc (49.9% of equity, 70% voting rights), 31 savings banks (37.9%, 20%) and 36 local co-operative banks (12.2%, 10%). Aktia Group is the fourth largest banking group in Finland, acting as the central financial institution for independent savings and cooperative banks.
Aktia Real Estate Mortgage Bank plc mortgages are distributed through the branch networks of the co-operating banks. Eligible cover pool collateral is restricted to first-lien Finnish residential mortgages. Furthermore, the originator has committed to a mandatory over-collateralisation level of 8.5%. The bank funds its activities predominantly by issuing covered bonds, with short-term funding coming from a credit facility from Aktia Bank.
Financial performance
We set out below some of the key financial performance metrics:
Table 119: Key profit & loss figures, €mm
FY 2008 FY 2009 FY 2010Net interest income 129 102 153Provisions for loan losses 0 1 32NII less provisions 128 102 121
Comm.& fee income 57 51 61Other operating income 37 -30 33Non-interest expense 171 120 169Operating profit (loss) 54 0 47
PBT 66 7 47Taxes 13 1 13Net profit (loss) 52 5 34
Source: Bloomberg
Table 120: Key balance sheet figures, €mm
FY 2008 FY 2009 FY 2010Loans 5,426 6,061 6,592Total Assets 9,540 10,556 11,249Deposits 3,098 3,029 3,397Short-term borrowings 1,917 1,724 960Other ST borrowings 3 19 158Long-term borrowings 2,366 3,000 3,638Equity 317 466 497
Source: Bloomberg
Table 121: Select financial metrics
FY 2008 FY 2009 FY 2010NIM 1.28 1.67 1.50ROA 0.06 0.34 0.51ROE 1.68 9.45 12.52ROC 0.14 0.69 1.13C:I 99.70 66.30 63.90Core capital 9.30 9.50 10.10
Source: Bloomberg
Cover pool overview
We set out below some of the key cover pool characteristics:
Table 122: Covered bond characteristics
As at 30 June 2011
S/M/FCovered bond rating -/Aa1/-Issuer rating (Aktia Bank plc) -/A1/-
€mmMortgages 3,532Substitute collateral 163Collateral pool 3,694
LTV <60% 2,541LTV 60-70% 132LTV 70-85% G'teed by Republic of Finland 93
WA LTV (%) 56.1 Average loan size (€) 78,500 WA Margin (bp) 78.2
Source: Investor Report
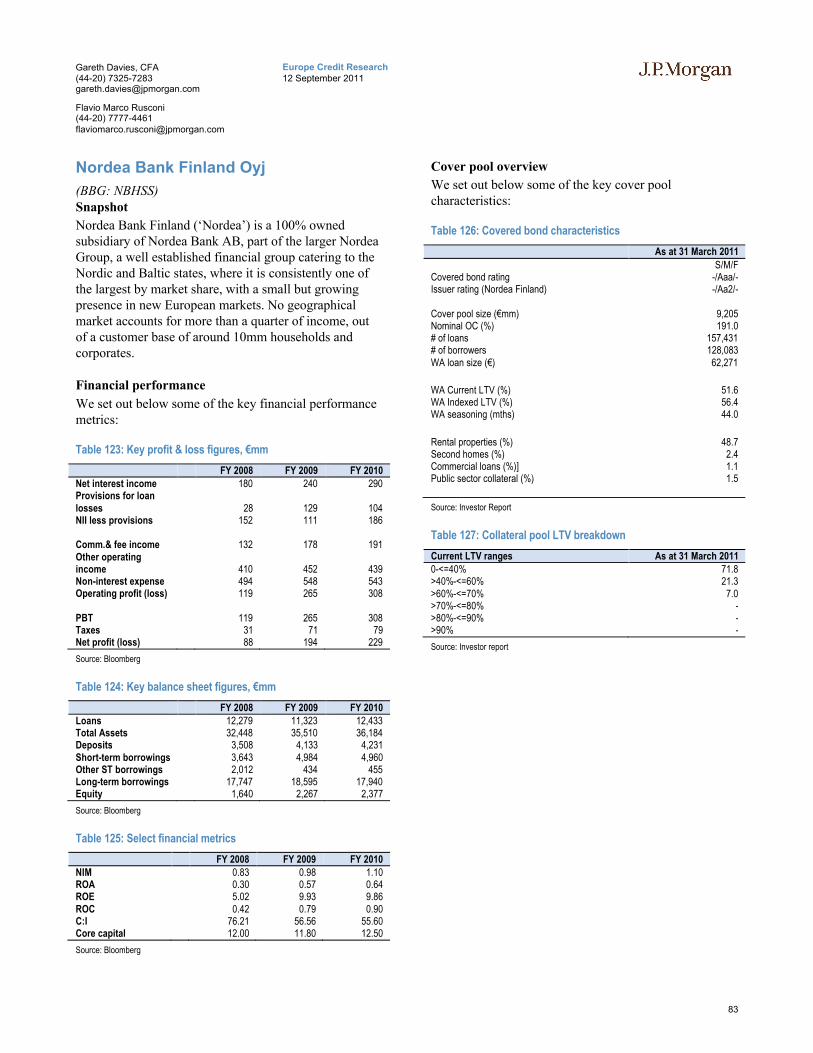
83
Europe Credit Research12 September 2011
Gareth Davies, CFA(44-20) [email protected]
Flavio Marco Rusconi(44-20) [email protected]
Nordea Bank Finland Oyj
(BBG: NBHSS)Snapshot
Nordea Bank Finland (‘Nordea’) is a 100% owned subsidiary of Nordea Bank AB, part of the larger Nordea Group, a well established financial group catering to the Nordic and Baltic states, where it is consistently one of the largest by market share, with a small but growing presence in new European markets. No geographical market accounts for more than a quarter of income, out of a customer base of around 10mm households and corporates.
Financial performance
We set out below some of the key financial performance metrics:
Table 123: Key profit & loss figures, €mm
FY 2008 FY 2009 FY 2010Net interest income 180 240 290Provisions for loan losses 28 129 104NII less provisions 152 111 186
Comm.& fee income 132 178 191Other operating income 410 452 439Non-interest expense 494 548 543Operating profit (loss) 119 265 308
PBT 119 265 308Taxes 31 71 79Net profit (loss) 88 194 229
Source: Bloomberg
Table 124: Key balance sheet figures, €mm
FY 2008 FY 2009 FY 2010Loans 12,279 11,323 12,433Total Assets 32,448 35,510 36,184Deposits 3,508 4,133 4,231Short-term borrowings 3,643 4,984 4,960Other ST borrowings 2,012 434 455Long-term borrowings 17,747 18,595 17,940Equity 1,640 2,267 2,377
Source: Bloomberg
Table 125: Select financial metrics
FY 2008 FY 2009 FY 2010NIM 0.83 0.98 1.10ROA 0.30 0.57 0.64ROE 5.02 9.93 9.86ROC 0.42 0.79 0.90C:I 76.21 56.56 55.60Core capital 12.00 11.80 12.50
Source: Bloomberg
Cover pool overview
We set out below some of the key cover pool characteristics:
Table 126: Covered bond characteristics
As at 31 March 2011
S/M/FCovered bond rating -/Aaa/-Issuer rating (Nordea Finland) -/Aa2/-
Cover pool size (€mm) 9,205 Nominal OC (%) 191.0# of loans 157,431# of borrowers 128,083 WA loan size (€) 62,271
WA Current LTV (%) 51.6 WA Indexed LTV (%) 56.4 WA seasoning (mths) 44.0
Rental properties (%) 48.7 Second homes (%) 2.4 Commercial loans (%)] 1.1 Public sector collateral (%) 1.5
Source: Investor Report
Table 127: Collateral pool LTV breakdown
Current LTV ranges As at 31 March 20110-<=40% 71.8 >40%-<=60% 21.3 >60%-<=70% 7.0 >70%-<=80% - >80%-<=90% - >90% -
Source: Investor report

84
Europe Credit Research12 September 2011
Gareth Davies, CFA(44-20) [email protected]
Flavio Marco Rusconi(44-20) [email protected]
OP Mortgage Bank (‘OP’)
(BBG: POHBK)Snapshot
OP Mortgage Bank plc (‘OP’) is the mortgage bank of the OP-Pohjola Group, the largest financial services group in Finland. The Group includes OP Mortgage Bank, over 200 member co-operative banks, their central co-operative, Pohjola Bank as the central bank of the Group and companies belonging to its member credit institutions. The member co-operative banks are independent, local deposit-taking institutions engaged in retail banking. OP Mortgage Bank is regulated under the Finnish Mortgage Bank Act, and grants secured housing loans.
OP Mortgage Bank’s purpose is to grant mortgage loans through its member co-operative banks. The Bank obtains funding through the issuance of mortgage-backed covered bonds, which are direct, unconditional and unsubordinated obligations of OP Mortgage Bank.
Financial performance
We set out below some of the key financial performance metrics:
Table 128: Key profit & loss figures, €mm
FY 2010Net interest income 961Provisions for loan losses 2NII less provisions 959
Comm.& fee income 606Other operating income 49Non-interest expense 1,010Operating profit (loss) 1,291
PBT 1,066Taxes 268Net profit (loss) 798
Source: Bloomberg
Table 129: Key balance sheet figures, €mm
FY 2010Total Assets 285,409Deposits 55,552Short-term borrowings 60,493Other ST borrowingsLong-term borrowings 21,975Equity 10,858
Source: Bloomberg
Table 130: Select financial metrics
FY 2010NIMROA 0.30ROE 7.70ROCC:I 43.00Core capital 13.60
Source: Bloomberg
Cover pool overview
We set out below some of the key cover pool characteristics:
Table 131: Pool A: Covered bond characteristics
As at 31 March 2011
S/M/FCovered bond rating AAA/Aaa/-Issuer rating (Pohjola Bank plc) AA-/Aa2/AA-
€mm Mortgages n/aSubstitute collateral n/aCollateral pool 4,600Covered bonds in issue 3,250
LTV <60% 4,500LTV >60% (JPM estimate) 100
WA LTV (%) 46.0Average loan size (€) 48,000
Source: Investor Report. J.P. Morgan estimates
Table 132: Pool B: Covered bond characteristics
As at 31 March 2011
S/M/FCovered bond rating AAA/Aaa/-Issuer rating (Pohjola Bank plc) AA-/Aa2/AA-
€mm Mortgages n/aSubstitute collateral n/aCollateral pool 1,800Covered bonds in issue 1,000
LTV <60% 1,760LTV >60% (JPM estimate) 40
WA LTV (%) 56.0 Average loan size (€) 66,000
Source: Investor Report. J.P. Morgan estimates

85
Europe Credit Research12 September 2011
Gareth Davies, CFA(44-20) [email protected]
Flavio Marco Rusconi(44-20) [email protected]
Sampo Housing Loan Bank
(BBG: DANBNK)Snapshot
Sampo Housing Loan Bank plc (SHLB) is a wholly owned subsidiary of Sampo Bank plc and is constituted with the sole purpose of funding mortgages through the issuance of covered bonds. Sampo Bank plc is the third largest bank in Finland and through its Finnish parent, Sampo Group, is in turn a part of the larger Danske Bank Bank, one of the Nordic region’s largest banking groups.
Similar to other covered bond issuers in the country, SHLB is regulated by Finland's Mortgage Bank Act. The bank purchases mortgages from its parent company, and issues covered bonds under a €5bn EMTN programme. All other functions such as mortgage servicing are performed by Sampo Bank plc. To date, Sampo Housing Loan Bank has issued two transactions from its shelf, with €2bn of bonds currently outstanding.
Financial performance
We set out below some of the key financial performance metrics:
Table 133: Sampo Bank plc: Key profit & loss figures, €mm
FY 2008 FY 2009 FY 2010Net interest incomeProvisions for loan lossesNII less provisions
Comm.& fee incomeOther operating income 23 20 26Non-interest expense n/a n/a n/aOperating profit (loss) 934 912 929
PBT 870 825 1,321Taxes 195 184 217Net profit (loss) 675 641 1,104
Source: Bloomberg
Table 134: Sampo Bank plc: Key balance sheet figures, €mm
FY 2008 FY 2009 FY 2010Total Assets 21,205 26,635 29,851Deposits n/a n/a n/aShort-term borrowings 0 0 0Other ST borrowings n/a n/a n/aLong-term borrowings 1,269 2,098 2,187Equity 4,631 7,613 8,886
Source: Bloomberg
Table 135: Sampo Bank plc: Select financial metrics
FY 2008 FY 2009 FY 2010NIM n/a n/a n/aROA 2.90 2.68 3.91ROE 10.92 10.47 13.38ROC 9.44 9.08 11.68C:I n/a n/a n/aCore capital n/a n/a n/a
Source: Bloomberg
Cover pool overview
We set out below some of the key cover pool characteristics:
Table 136: Covered bond characteristics
As at 31 December 2010
S/M/FCovered bond rating -/Aaa/-Issuer rating (Sampo Bank plc) A/A1/-
€mmMortgages 2,068 Substitute collateral 96 Collateral pool 2,164
LTV <60% 2,018LTV > 60% 35
WA LTV (%) 36.2Average loan size (€) 48,000
Source: Investor Report

86
Europe Credit Research12 September 2011
Gareth Davies, CFA(44-20) [email protected]
Flavio Marco Rusconi(44-20) [email protected]

87
Europe Credit Research12 September 2011
Gareth Davies, CFA(44-20) [email protected]
Flavio Marco Rusconi(44-20) [email protected]
Fre
nch
Co
ve
red
Bo
nd
s

88
Europe Credit Research12 September 2011
Gareth Davies, CFA(44-20) [email protected]
Flavio Marco Rusconi(44-20) [email protected]
French Covered Bonds
Legislative snapshot
We set out in Table 137 a snapshot of key covered bond attributes in France.
Table 137: French Covered Bond legislative overview: OF
Attribute CommentaryFrameworkLegislative Framework Art. 515-13 and seq. of the French Monetary and Financial Code; Act. No 99-532 of 25 June 1999; Decree
No 99-655 of 29 July 1999; Decree No 99-710 of 3 Aug 1999; regulation No 99-10 of the banking and finance regulation committee on SCF; Art. 16 of Act No 69-1263 of 31 December 1969
Types of covered bonds One. Structure of Issuer Direct issuance? No. Bonds are issued by a specialised credit institution (Societe de Credit Foncier, SCF) with authorisation
from the Credit Institution and Investment Companies Committee (CECEI). SCF are limited by law in their range of business activities.
Comments (if any)Bankruptcy remoteness Established by law by guaranteeing that the bankruptcy of a company holding shares of the SCF does not
extend to the SCF. Also, upon default, no creditors can be paid until the privileged creditors are repaid in full. There is no acceleration upon judicial liquidation of an SCF.
Dual claim Yes, all assets of the SCF secure the OFs and other privileged creditors and no creditor can be paid until the privileged ones are repaid in full.
Bond format Fixed rate. Hard bullet, but docs generally have flexibility to introduce soft bullets.Supervision French Banking Commission.Cover pool
Eligible assets Mortgage Residential or commercial mortgages, although only marginal exposure to commercial loans in current pools. Assets securing the loans have to be based in the EEA or a State qualifying for Step 1 credit quality assessment by a rating agency recognised by the French banking commission. RMBS bonds rated at least AAA can also be included in the pool, as long as they are at least 90% backed by eligible collateral.
LTV caps Soft LTV limit of 60%, 80% for loans used to finance the purchase or construction of a property and 100% for loans with a personal or FGAS guarantee; guaranteed loans must not exceed 35% of SCF assets.
Public Sector Debt issued or guaranteed by a public entity located in the EEA, Switzerland, Canada, USA, Japan, Australia and New Zealand or any State that qualifies for a Step 1 credit assessment by a rating agency.
Non-performing collateral Loans in arrears by more than 90 days are removed from the pool. Substitution Assets Cash equivalent assets. Issuer or guarantor has to be rated at least AA-. Substitution collateral cannot
exceed 15% of the cover pool. Hedging Derivatives used only used to minimise interest rate, currency or other risks.Valuation Prescribed standards. Commercial properties must be valued each year if value >€450k and loan balance
>€360k or every 3yrs if loan balance <€360k. Other comments (if any)
Requirements
ALM matching Asset coverage Asset cover nominal ratio must be at least 1 at all times and must be published at least twice a year. If rating of the mortgage guarantor or RMBS bond is at least AA-, 100% weight is given to the asset; if rating between A- and A+, 50% weight; below A- 0% weight. Substitute collateral is given 95% weight, repossessed properties 50% weight and other eligible assets 100% weight. Post Group EoD, an Amortisation Test is carried out.
Interest coverage The Pre-maturity Test checks that there is enough liquidity in case of a downgrade; a breach constitutes a Group EoD but not an issuer EoD.
Other (if any) Minimum OC of 2%Consequence of breach A breach of the Asset Cover test is not an issuer EoD but a Group EoD and no more issuance is allowed.
Non-compliance with the Amortisation Test is an EoD.Monitoring A specific controller must be appointed by the SCF with approval of the French Banking Commission. The
controller will check asset and interest coverage, A/L mismatches and the eligibility of the assets. Must file an annual report to the Commission.
Other
Compliance with EU legislation
UCITS- and CRD-compliant
Source: National legislation, J.P. Morgan Covered Bond Research

89
Europe Credit Research12 September 2011
Gareth Davies, CFA(44-20) [email protected]
Flavio Marco Rusconi(44-20) [email protected]
Table 138: French Covered Bond legislative overview: OH
Attribute CommentaryFrameworkLegislative Framework Art 515-34 and seq. of the French Monetary and Financial Code, art 74 of law 2010-1249Types of covered bonds OneStructure of Issuer Direct issuance? No. The bonds are issued out of a specialised credit institution (SFH) with a limited purpose.
Comments (if any) The framework was set up in 2010 to allow law-base covered bonds to become UCIT-compliant through their inclusion in a legal framework. The exclusive legal purpose of the SFH is to grant or finance loans and hold securities under specific conditions set out in the French Monetary and Financial Code.
Bankruptcy remoteness Art. 515-27 of the French Monetary and Financial Code precludes the extension of any safeguard procedure, judicial reorganisation or liquidation of the SFH's parent to the SFH. There is no acceleration of the bonds upon insolvency of the issuer.
Dual claim Yes, but only a residual claim if the cover pool is not enough to redeem the bonds.Bond format Typically fixed rate, soft bullet with generally a 12 mths extension allowed. Supervision Autorite de Controle Prudentiel (ACP), French Banking CommissionCover poolEligible assets Mortgage Residential loans secured on a property located in the EEA or a state rated at least AA-. These can also be
in the form of RMBS as long as at least 90% of the underlying pool satisfies the criteria, the securitisation vehicle is governed by French, EEA, US, Swiss, Canadian, Japanese, Australian or New Zealand law and the bonds are rated AAA. No limitations on guaranteed home loans.
LTV caps Soft limit of 80%, with generally hard limit of 100%.Public Sector n/aNon-performing collateral No loans in arrears can be added to the pool, but no explicit requirement to substitute them after they have
been added to the pool. Loans in arrears by more than 3 months are not given full credit in the calculation of the Asset Coverage Test.
Substitution Assets Up to 15% of collateral. Can consist of debt guaranteed or issued by institutions rated at least AA-; debt due within 100 days or guaranteed by a member of the EEA rated at least A-; debt issued or guaranteed by public sector entities referred to in the French Monetary and Financial Code.
Hedging Only used to minimise interest rate, currency or other risks.Valuation Individual market values. Carried out on an annual basis by the Specific Controller.
Other comments (if any) Requirement to disclose details of the cover pool on a quarterly basis.
Requirements
ALM matching Asset coverage Minimum nominal OC of 2% has to be maintained, although Asset Percentage in prospectus is often above min requirement. If breached, there is no event of default, but the license of the issuer as SCH can be withdrawn. Prior to parent default, an Asset Cover test has to be carried out and assets must be less than liabilities at all times. If less than 1, then no further issuance is allowed and there is a Borrower EoD but not an Issuer EoD. There is also a Pre-maturity Test that checks that the originator can provide enough liquidity in case of a downgrade; a breach constitutes a Borrower EoD. Finally, there is a Liquidity test with a similar purpose, but a breach does not lead to an EoD.
Interest coverage The issuer has to make sure that liquidity needs for the next 180 days are covered with substitute assets, liquidity lines granted by eligible counterparties or central banks.
Other (if any) Post default of the parent, an Amortisation test is carried out; if the Amortisation ratio is less than 1, then an Issuer event of default takes place and the bonds accelerate.
Consequence of breach See above. Monitoring There are an asset monitor and a specific controller that acts as an independent trustee and by law reports to
the ACP.Other
Compliance with EU legislation
UCITS compliant but not CRD compliant
Source: National legislation, J.P. Morgan Covered Bond Research

90
Europe Credit Research12 September 2011
Gareth Davies, CFA(44-20) [email protected]
Flavio Marco Rusconi(44-20) [email protected]
Table 139: French Covered Bond legislative overview: CRH
Attribute CommentaryFrameworkLegislative Framework Art. 13 of Law 85-695; sections 313-42 to 313-49 and sections 313-20 to 313-25 of the French Monetary and
Financial Code; Art. 36 of Law 2006-872.Types of covered bonds One. Structure of Issuer Direct issuance? The bonds are issued by CRH, a specialist financial institution whose only business purpose is to fund
French banks' loans to individuals.Comments (if any) CRH was set up in 1985 as a government-guaranteed central agency; now it is a private company owned by
French banks. Bankruptcy remoteness Achieved by special legal framework superseding general insolvency laws. Dual claim Yes, but residual claim only. At CRH level, if one of the shareholder banks defaults and the loan portfolio
transferred to CRH is insufficient, then CRH becomes an unsecured creditor of the bank.Bond format Fixed rate, bullet. Supervision French Banking AuthorityCover pool
Eligible assets Mortgage Only first ranking or guaranteed French home loans to individuals (in theory loans from other jurisdictions of the EEA are eligible but only French loans are currently in the pool).
LTV caps Max LTV is 60%, 80% for loans used to finance the purchase or construction of a property, 90% if the amount of the loan portfolio is 25% above the outstanding bonds, 100% for loans guaranteed by the FGAS.
Public Sector n/aNon-performing collateral n/aSubstitution Assets No replacement assets are allowed. RMBS and other types of residential assets (such as loan portfolios) are
not permitted. Hedging No derivatives. Exact matching of assets and liabilities by law. Valuation Valued annually using a lending value, which cannot exceed the market value. The valuation has to be
conservative, based on lasting, long-term characteristics of the property and normal market and local conditions.
Other comments (if any)
Requirements
ALM matching Asset coverage Cover pool has to be 125% of liabilities. Interest coverage n/aOther (if any)
Consequence of breachMonitoring The French Banking Authority and an independent monitor who audits the cover pool and checks coverage
tests. Other
Compliance with EU legislation
UCITS- and CRD-compliant
Source: National legislation, J.P. Morgan Covered Bond Research

91
Europe Credit Research12 September 2011
Gareth Davies, CFA(44-20) [email protected]
Flavio Marco Rusconi(44-20) [email protected]
Table 140: French Covered Bond legislative overview: General law based covered bonds
Attribute CommentaryFrameworkLegislative Framework French Monetary and Financial CodeTypes of covered bonds OneStructure of Issuer Direct issuance? No, bonds are issued by a licensed financial institution whose sole purpose is to provide financing to the
parent bank. Comments (if any) Unlike other structured covered bond frameworks in Europe (such as the UK, Dutch or Italian ones), the
covered bonds are issued by the SPV. Bankruptcy remoteness The French Monetary and Financial Code guarantees the bankruptcy remoteness of the Issuer in case of
insolvency of the parent. There is no acceleration upon default of the parent bank. Dual claim In case of default of the parent, covered bonds holders have recourse to the cover pool and a residual claim
against the parent.Bond format Typically fixed rate, soft bullet, Bonds can have an extended maturity date, generally a year after the original
maturity date. Supervision ACP, Autorite de Controle PrudentielCover pool French Banking CommissionEligible assets Mortgage French residential mortgages, no limits on guaranteed loans.
LTV caps Soft limit of 80% LTV for residential mortgages, with hard 100% LTV limit.Public Sector n/aNon-performing collateral No arrears at inclusion, but no specific requirement to substitute non performing loans. These are not
accounted for in the calculation of the Asset Coverage Test.Substitution Assets Short term (<1yr left) debt securities or long term debt securities where the issuer is rated at least AA-;
government and public entities' securities with a remaining maturity of less than 1yr that are rated AAA; Euro or other currency, liquid RMBS with mat.<1yr rated at least AA-.
Hedging Derivatives used to hedge interest rate and currency risk.Valuation Individual market values. If the market value of the property, only 80% of the increase is used for the
indexation; if the value has fallen, the full price change is used to calculate indexed values. Other comments (if any)
Requirements
ALM matching Asset coverage Minimum Asset percentage of 92.5% has to be maintained. Prior to parent default, an Asset Cover test has to be carried out and assets must be less than liabilities at all times. If the ratio is less than 1, then no further issuance is allowed and there is a Borrower EoD but not an Issuer EoD.
Interest coverage There is also a Pre-maturity Test that checks that the originator can provide enough liquidity in case of a downgrade; a breach constitutes a Borrower EoD.
Other (if any) Post Borrower default, an Amortisation test is carried out to ensure that the collateral is enough to pay future liabilities. If the test fails, the representative, at its discretion or mandated by the majority of bondholder, can ask for the acceleration of the bonds.
Consequence of breachMonitoring An independent Asset Monitor is appointed. OtherCompliance with EU legislation
Non UCIT- or CRD-compliant
Source: National legislation, J.P. Morgan Covered Bond Research
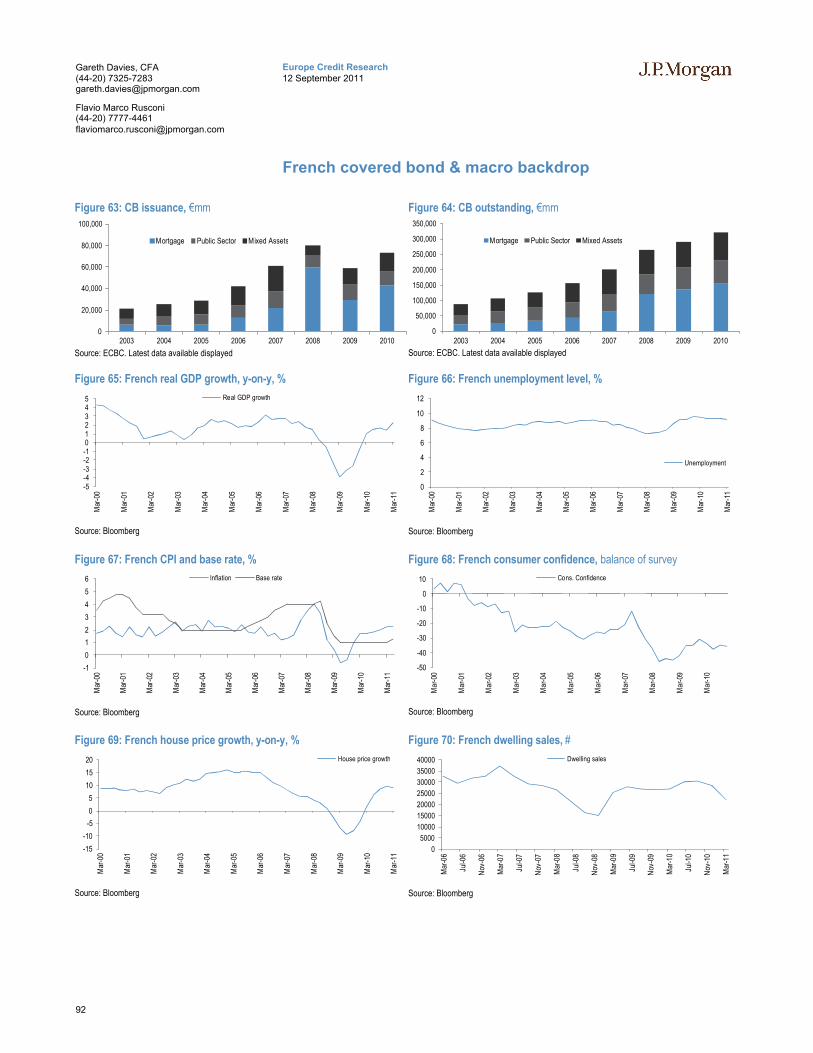
92
Europe Credit Research12 September 2011
Gareth Davies, CFA(44-20) [email protected]
Flavio Marco Rusconi(44-20) [email protected]
French covered bond & macro backdrop
Figure 63: CB issuance, €mm
Source: ECBC. Latest data available displayed
Figure 64: CB outstanding, €mm
Source: ECBC. Latest data available displayed
Figure 65: French real GDP growth, y-on-y, %
Source: Bloomberg
Figure 66: French unemployment level, %
Source: Bloomberg
Figure 67: French CPI and base rate, %
Source: Bloomberg
Figure 68: French consumer confidence, balance of survey
Source: Bloomberg
Figure 69: French house price growth, y-on-y, %
Source: Bloomberg
Figure 70: French dwelling sales, #
Source: Bloomberg
0
20,000
40,000
60,000
80,000
100,000
2003 2004 2005 2006 2007 2008 2009 2010
Mortgage Public Sector Mixed Assets
0
50,000
100,000
150,000
200,000
250,000
300,000
350,000
2003 2004 2005 2006 2007 2008 2009 2010
Mortgage Public Sector Mixed Assets
-5-4-3-2-1012345
Mar
-00
Mar
-01
Mar
-02
Mar
-03
Mar
-04
Mar
-05
Mar
-06
Mar
-07
Mar
-08
Mar
-09
Mar
-10
Mar
-11
Real GDP growth
0
2
4
6
8
10
12
Mar
-00
Mar
-01
Mar
-02
Mar
-03
Mar
-04
Mar
-05
Mar
-06
Mar
-07
Mar
-08
Mar
-09
Mar
-10
Mar
-11
Unemployment
-1
0
1
2
3
4
5
6
Mar
-00
Mar
-01
Mar
-02
Mar
-03
Mar
-04
Mar
-05
Mar
-06
Mar
-07
Mar
-08
Mar
-09
Mar
-10
Mar
-11
Inflation Base rate
-50
-40
-30
-20
-10
0
10
Mar
-00
Mar
-01
Mar
-02
Mar
-03
Mar
-04
Mar
-05
Mar
-06
Mar
-07
Mar
-08
Mar
-09
Mar
-10
Cons. Confidence
-15
-10
-5
0
5
10
15
20
Mar
-00
Mar
-01
Mar
-02
Mar
-03
Mar
-04
Mar
-05
Mar
-06
Mar
-07
Mar
-08
Mar
-09
Mar
-10
Mar
-11
House price growth
0
5000
10000
15000
20000
25000
30000
35000
40000
Mar
-06
Jul-0
6
Nov
-06
Mar
-07
Jul-0
7
Nov
-07
Mar
-08
Jul-0
8
Nov
-08
Mar
-09
Jul-0
9
Nov
-09
Mar
-10
Jul-1
0
Nov
-10
Mar
-11
Dwelling sales

93
Europe Credit Research12 September 2011
Gareth Davies, CFA(44-20) [email protected]
Flavio Marco Rusconi(44-20) [email protected]
AXA Bank Europe SCF
(BBG: AXASA)Snapshot
As part of a diversification strategy that began in 2007 to complement its insurance products, AXA launched AXA Bank in Switzerland in 2009, quickly followed by AXA banks in Belgium, the Czech Republic, France, Germany, Hungary and Slovakia.
All European banking activities are coordinated by AXA Bank Europe, formerly known as AXA Bank Belgium. AXA Bank Europe has a market share of 8% of the Belgian mortgage lending market.
AXA Bank Europe SCF was set up using the OFstructure offered by the French legislative framework. The assets of the SCF are AAA-rated RMBS bonds backed by a portfolio of prime Belgian residential loans originated and serviced by AXA Bank Europe.
Financial performance
We set out below some of the key financial performance metrics:
Table 141: Key profit & loss figures AXA Bank Europe, €mm
FY 2009 FY 2010Net interest income 224 235
8 5Comm.& fee income 216 229Other operating incomeNon-interest expense 36 40Operating profit (loss) 30 40
271 301PBT 8 53TaxesNet profit (loss) -14 -14
Source: Annual report 2010
Table 142: Key balance sheet figures AXA Bank Europe, €mm
FY 2009 FY 2010Loans 20,345 22,355Total Assets 26,296 31,377Deposits 16,865 16,111Short-term borrowings 972 1,830Equity 854 851
Source: Annual report 2010
Cover pool overview
We set out below some of the key cover pool characteristics:
Table 143: Covered bond characteristics
As at June 2011
Ratings S/M/FCovered bond rating AAA/-/AAAIssuer rating A+/-/-
Cover poolCover pool size (€) 1,727,618,673Number of loans 27,733Avg loan (€) 79,931
WA initial LTV (in %) 74.1WA current LTV (in %) 49.2Remaining tenor (mths) 187 WA seasoning (mths) 72 WA DTI (in %) 37.4
Source: Investor Report
Table 144: Collateral pool LTV breakdown
Current LTV ranges As at June 20110-<=40% 37.6 >40%-<=50% 15.2 >50%-<=60% 14.0 >60%-<=70% 12.5 >70%-<=80% 10.5 >80%-<=90% 6.3 >90%-<=100% 3.8
Source: Investor Report

94
Europe Credit Research12 September 2011
Gareth Davies, CFA(44-20) [email protected]
Flavio Marco Rusconi(44-20) [email protected]
Banques Populaires SCF
(BBG: BPCOV)Snapshot
Together with Caisse d'Épargne, Banques Populaires is one of the two brands of the Groupe BPCE. The two cooperative groups merged in July 2009 to create the second largest French banking group, combining two cooperative banking networks consisting of the twenty Banque Populaire banks and seventeen Caisses d'Épargne. Alongside the central BPCE institution, the group also operates a number of subsidiary businesses, including the majority owned Natixis, which focuses on corporate and investment banking activities, as well as Crédit Foncier de France (see separate issuer overview).
The group provides banking, financial and real estate services to all types of customers, with Caisse d’Épargnemore focused on the retail sector, while Banques Populaires specialises in services to SMEs, professionals and high net worth individuals.
Unlike Groupe Caisse d'Épargne, BPCOV utilises obligation foncieres for part of its funding requirements.
Financial performance
We set out below some of the key financial performance metrics:
Table 145: Key profit & loss figures Groupe BPCE, €mm
FY 2009 FY 2010Net interest income 12,752 12,182
Comm.& fee income 8,705 9,052Other operating income 11,804 11,770Non-interest expense 16,359 16,057Operating profit (loss) 723 5,648
PBT -368 5,749Taxes -293 1,716Net profit (loss) -75 4,033
Source: Annual report 2010
Table 146: Key balance sheet figures Groupe BPCE, €mm
FY 2009 FY 2010Loans 309,855 342,994Total Assets 1,028,802 1,048,442Deposits 14,941 12,993Short-term borrowings 77,057 83,944Long-term borrowings 124,755 136,313Equity 47,794 51,365
Source: Annual report 2010
Table 147: Select financial metrics
FY 2009 FY 2010C:I 69 60 Core capital 9.1 10.1
Source: Annual report 2010
Cover pool overview
We set out below some of the key cover pool characteristics:
Table 148: Covered bond characteristics
As at June 2011
Ratings S/M/FCovered bond rating AAA/Aaa/-Issuer rating A+/Aa3/A+
Cover pool June-11Cover pool size (€) 11,939,996,724Number of loans 203,612Avg loan (€) 58,641
WA current LTV (in %) 68.0 WA current indexed LTV (in %) 64.0 Remaining tenor (mths) 172WA seasoning (mths) 43
Owner occupied property (in %) 89.4 Buy-to-let (in %) 8.0 Employed (in %) 54.7 Self employed (in %) 13.2
Source: Investor Report
Table 149: Collateral pool LTV breakdown
Current LTV ranges As at June 20110-<=40% 13.9 >40%-<=50% 9.1 >50%-<=60% 10.9 >60%-<=70% 13.3 >70%-<=80% 16.2 >80%-<=90% 19.2 >90%-<=100% 17.5
Source: Investor Report

95
Europe Credit Research12 September 2011
Gareth Davies, CFA(44-20) [email protected]
Flavio Marco Rusconi(44-20) [email protected]
BNP Paribas Home Loan SFH
(BBG: BNPPCB)Snapshot
The BNP Paribas Group was created ten years ago through the merger of Banque Nationale de Paris and Paribas. Since then it has continued its expansion by acquiring BNL, the sixth largest Italian bank, and 75% of Fortis Bank in Belgium and 66% of BGL in Luxembourg.
The group focuses on retail banking, corporate and investment banking and investment solutions, providing services to 13mm customers in its core markets of Belgium, France, Italy and Luxembourg and a further 5mm in its secondary markets: the Mediterranean basin, Eastern Europe and the USA. Alongside the retail banking operations, the group also provides specialised financial services, including consumer credit and mortgages (BNP Paribas Personal Finance), leasing (BNP Paribas Leasing Solutions) and corporate vehicle management (Arval). Significant business lines also exist in Corporate & Investment Banking (BNP Paribas CIB) and Investment Solutions (Private Banking, Asset Management, Securities Services and Insurance amongst others).
The bank switched from structured covered bonds to OHcovered bonds in 2011 for part of its funding needs.
Financial performance
We set out below some of the key financial performance metrics:
Table 150: Key profit & loss figures, €mm
FY 2008 FY 2009 FY 2010Net interest income 13,498 21,021 24,060Provisions for loan losses 3,783 7,818 4,201NII less provisions 9,715 13,203 19,859
Comm.& fee income 10,713 12,276 13,857Other operating income 4,862 5,182 5,773Non-interest expense 25,223 28,700 32,489Operating profit (loss) 3,705 8,569 12,830
PBT 3,924 9,000 13,020Taxes 472 2,526 3,856Net profit (loss) 3,021 5,832 7,843
Source: Bloomberg
Table 151: Key balance sheet figures, €mm
FY 2008 FY 2009 FY 2010Loans 494,401 678,766 684,686Total Assets 2,075,551 2,057,698 1,998,158Deposits 413,955 604,903 580,913Short-term borrowings 1,286,572 1,021,434 980,082Other ST borrowings 87,405 77,187 68,974Long-term borrowings 131,295 153,347 148,549Equity 58,968 80,344 85,630
Source: Bloomberg
Table 152: Select financial metrics
FY 2008 FY 2009 FY 2010NIM 0.8 1.1 1.3ROA 0.2 0.3 0.4ROE 6.7 10.6 12.2ROC 0.3 0.5 0.7C:I 73.1 59.3 61.4Core capital 7.8 10.1 11.4
Source: Bloomberg
Cover pool overview
We set out below some of the key cover pool characteristics:
Table 153: Covered bond characteristics
As at July 2011
Ratings S/M/FCovered bond rating AAA/Aaa/AAAIssuer rating AA/Aa2/AA-
Cover poolCover pool size (€) 34,200,106,112Number of loans 345,931Avg loan (€) 98,864
WA current LTV (in %) 68.2 WA current indexed LTV (in %) 62.0 Remaining tenor (mths) 186.9 WA seasoning (mths) 48.7
Owner occupied property (in %) 81.7 Buy-to-let (in %) 13.4 Employed borrower (in %) 63.5 Self-employed borrower (in %) 13.9 Unemployed borrower (in %) 5.3
Source: Investor Report
Table 154: Collateral pool LTV breakdown
Current LTV ranges As at July 2011
0-<=40% 14.8 >40%-<=50% 8.2 >50%-<=60% 10.0 >60%-<=70% 11.9 >70%-<=80% 15.5 >80%-<=90% 20.4 >90%-<=100% 19.3
Source: Investor Report

96
Europe Credit Research12 September 2011
Gareth Davies, CFA(44-20) [email protected]
Flavio Marco Rusconi(44-20) [email protected]
BNP Paribas Public Sector SCF
(BBG: BNPSCF)Snapshot
See earlier profile.
Unlike BNP Paribas Home Loans CB, BNP Paribas public sector SCF utilises obligation foncieres for part of its funding requirements.
Financial performance
We set out below some of the key financial performance metrics:
Table 155: Key profit & loss figures, €mm
FY 2008 FY 2009 FY 2010Net interest income 13,498 21,021 24,060Provisions for loan losses 3,783 7,818 4,201NII less provisions 9,715 13,203 19,859
Comm.& fee income 10,713 12,276 13,857Other operating income 4,862 5,182 5,773Non-interest expense 25,223 28,700 32,489Operating profit (loss) 3,705 8,569 12,830
PBT 3,924 9,000 13,020Taxes 472 2,526 3,856Net profit (loss) 3,021 5,832 7,843
Source: Bloomberg
Table 156: Key balance sheet figures, €mm
FY 2008 FY 2009 FY 2010Loans 494,401 678,766 684,686Total Assets 2,075,551 2,057,698 1,998,158Deposits 413,955 604,903 580,913Short-term borrowings 1,286,572 1,021,434 980,082Other ST borrowings 87,405 77,187 68,974Long-term borrowings 131,295 153,347 148,549Equity 58,968 80,344 85,630
Source: Bloomberg
Table 157: Select financial metrics
FY 2008 FY 2009 FY 2010NIM 0.8 1.1 1.3ROA 0.2 0.3 0.4ROE 6.7 10.6 12.2ROC 0.3 0.5 0.7C:I 73.1 59.3 61.4Core capital 7.8 10.1 11.4
Source: Bloomberg
Cover pool overview
We set out below some of the key cover pool characteristics:
Table 158: Covered bond characteristics
As at June 2011
Ratings S/M/FCovered bond rating AAA/Aaa/AAAIssuer rating AA/Aa2/AA-
Cover pool size (€mm) 4,096
Country of guarantor (in %)France 23USA 28Germany 35UK 14
Country of borrowers (in %)Australia 14China 11Chile 11Ireland 11Turkey 9Others 44
Borrowers by sector (in %)Aviation 76Transport 8Energy 14Other 2
Currency split (in %)USD 61EUR 25AUD 14
Asset types (in %)AAA sovereign backed loans 100Other 0
Source: Investor Report

97
Europe Credit Research12 September 2011
Gareth Davies, CFA(44-20) [email protected]
Flavio Marco Rusconi(44-20) [email protected]
BPCE SFH
(BBG: BPCECB)Snapshot
BPCE SFH was created in 2011 in order to allow Groupe BPCE (see separate Banques Populaires overview above) to tap the newly crated OH market.
Financial performance
We set out below some of the key financial performance metrics:
Table 159: Key profit & loss figures Groupe BPCE, €mm
FY 2009 FY 2010Net interest income 12,752 12,182
Comm.& fee income 8,705 9,052Other operating income 11,804 11,770Non-interest expense 16,359 16,057Operating profit (loss) 723 5,648
PBT -368 5,749Taxes -293 1,716Net profit (loss) -75 4,033
Source: Annual report 2010
Table 160: Key balance sheet figures Groupe BPCE, €mm
FY 2009 FY 2010Loans 309,855 342,994Total Assets 1,028,802 1,048,442Deposits 14,941 12,993Short-term borrowings 77,057 83,944Long-term borrowings 124,755 136,313Equity 47,794 51,365
Source: Annual report 2010
Table 161: Select financial metrics
FY 2009 FY 2010C:I 69 60 Core capital 9.1 10.1
Source: Annual report 2010
Cover pool overview
We set out below some of the key cover pool characteristics:
Table 162: Covered bond characteristics
As at June 2011
Ratings S/M/FCovered bond rating AAA/Aaa/-Issuer rating A+/Aa3/A+
Cover poolCover pool size (€) 6,631,472,043Number of loans 120,592Avg loan (€) 54,991
WA current LTV (in %) 69.4WA current LTV (in %) 64.1Remaining tenor (mths) 184 WA seasoning (mths) 53
Fixed rate loans (in %) 90.8 Owner occupied (in %) 88.5 BTL (in %) 9.3 Self-employed (in %) 14.7
Source: Investor Report
Table 163: Collateral pool LTV breakdown
Current LTV ranges As at June 20110-<=40% 12.6 >40%-<=50% 7.9 >50%-<=60% 10.2 >60%-<=70% 12.6 >70%-<=80% 15.9 >80%-<=90% 21.1 >90%-<=100% 19.7
Source: Investor Report

98
Europe Credit Research12 September 2011
Gareth Davies, CFA(44-20) [email protected]
Flavio Marco Rusconi(44-20) [email protected]
Caisse de Refinancement de l’Habitat
(BBG: CRH)Snapshot
Caisse de Refinancement de l'Habitat (CRH) is a credit institution whose ownership is split amongst a number of French banks: Crédit Agricole-Crédit Lyonnaise 40%, Crédit Mutuel CIC 33%, Société Générale 13%, BNP Paribas 9%, and BPCE 5% (percentages also reflective of the breakdown of CRH’s loans).
CRH was created with the sole purpose of funding French mortgages granted by its shareholder credit institutions. It does this by issuing mortgage bonds as per its own special legal framework, regulated by law 85-695 of July 1985. CRH bonds were initially backed by a guarantee from the French government, but this was withdrawn in 1988. From 2006 they have received a capital risk-weighting of 10%.
The underlying mortgage loans remain on the shareholder banks’ balance sheets, with promissory notes issued to CRH. CRH-issued bonds then mimic the same features (rate, maturities etc) of these promissory notes. By law, CRH must have a minimum over-collateralisation rate of 25%. In fact, as of December 2010, CRH mortgage bonds amount to just over €41bn, compared to a cover pool of €60bn, for an over-collateralisation level of 44%. No substitution assets are allowed in the collateral pool, while internal rules stipulate that no holdings of securitised positions are allowed.
Funds are received by CRH from the shareholder banks five business days in advance of payment on its own bonds. If one of the borrowing banks defaults, CRH acquires full ownership of the pledged collateral and is allowed to sell the portfolio and use the proceeds to buy and cancel the corresponding bonds. Furthermore, CRH could ask its other shareholders to provide a back-up line of up to 5% of the outstanding loans.
The bank utilises CRH bonds for its funding needs.
Financial performance
We set out below some of the key financial performance metrics:
Table 164: Key profit & loss figures, €mm
FY 2008 FY 2009 FY 2010
Net interest income 8.0 2.8 2.3
Non-interest expense 1.9 1.8 2.2Operating profit (loss) 9.1 0.9 0.2
PBT 9.1 0.9 0.2Taxes 2.0 0.3 0.1Net profit (loss) 3.8 0.6 0.1
Source: Annual report 2010
Table 165: Key balance sheet figures, €mm
FY 2008 FY 2009 FY 2010Loans 216 145 246Total Assets 38,525 40,626 42,486Other ST borrowings 3,261 6,244 5,091Long-term borrowings 34,279 32,044 36,284Equity 180 208 208
Source: Annual report 2010
Cover pool overview
We set out below some of the key cover pool characteristics:
Table 166: Covered bond characteristics
As at December 2010Ratings S/M/FCovered bond rating -/Aaa/AAAIssuer rating n.a.
Cover PoolCover pool size (€bn) 59.5 Bonds outstanding (€bn) 41.3 OC (%) 44.0 Cover pool size excl. non-compliant loans (€bn) 53.7 OC excl. non-compliant loans (%) 30.0
Source: Investor Report

99
Europe Credit Research12 September 2011
Gareth Davies, CFA(44-20) [email protected]
Flavio Marco Rusconi(44-20) [email protected]
CIF Euromortgage SCF
(BBG: CIFEUR)Snapshot
Crédit Immobilier de France (CIF) is the only independent financial institution in France that is solely dedicated to mortgage lending to individuals. CIF’s 12 subsidiaries serve specific geographic markets through 300 branches and 6,000 independent advisors. The sole shareholders of CIF are the SACICAPs, whose purpose is to provide lending to low income individuals. The SACICAPs undertake a vast programme of building and selling housing to promote home ownership and devote at least one third of their distributable earnings to government-designated social programmes.
CIF Euromortgage is the SCF of the Crédit Immobilier de France (CIF). The funding activity of CIF Euromortgage is organised around CIF's two securitisation vehicles, CIS Assets (created in 2001 as a multi-series FCC or SPV) and BPI Master Mortgage (created in 2003 with the sole purpose of purchasing home loans originated by Banque Patrimoine et Immobilier). CIF Euromortgage’s primary purpose is to purchase all the AAA/Aaa senior notes issued by these two SPVs, and to use them as collateral for its cover pool.
After an initial build-up period, CIF Euromortgage has reached an equilibrium, with annual finding needs of between €3bn and €5bn. CIF Europmortgage plans to launch regular public issues at least twice a year. In 2010 CIF issued €2.8bn of covered bonds through a mix of public and private placements; in 2011 YTD, €2.0bn have been issued so far, all publicly sold. CIF also regularly comes to the market through taps of previous issues and registered covered bonds (German debt securities).
The bank utilises obligation foncieres for part of its funding needs.
Financial performance
We set out below some of the key financial performance metrics:
Table 167: Key profit & loss figures, €mm
FY 2009 FY 2010
Net interest income 10.1 10.4
Operating profit (loss) 4.9
PBT 4.8 8.4Taxes 1.6 2.9Net profit (loss) 3.2 5.5
Source: Annual report 2010
Table 168: Key balance sheet figures, €mm
FY 2009 FY 2010Total Assets 24,617 25,813 Long-term borrowings 330 732 Equity 111 113
Source: Annual report 2010
Cover pool overview
We set out below some of the key cover pool characteristics:
Table 169: Covered bond characteristics
As at June 2011
Ratings S/M/FCovered bond rating -/Aaa/AAAIssuer rating n/a
Cover PoolCover pool size (€) 24,690,000,000
Asset type (in %)CIF Assets 65.8 Replacement portfolio 12.3 CIF Mortgage promissory notes 8.9 BPI Master mortgage 8.1 AAA-rated European RMBS 4.9
Source: Investor Report
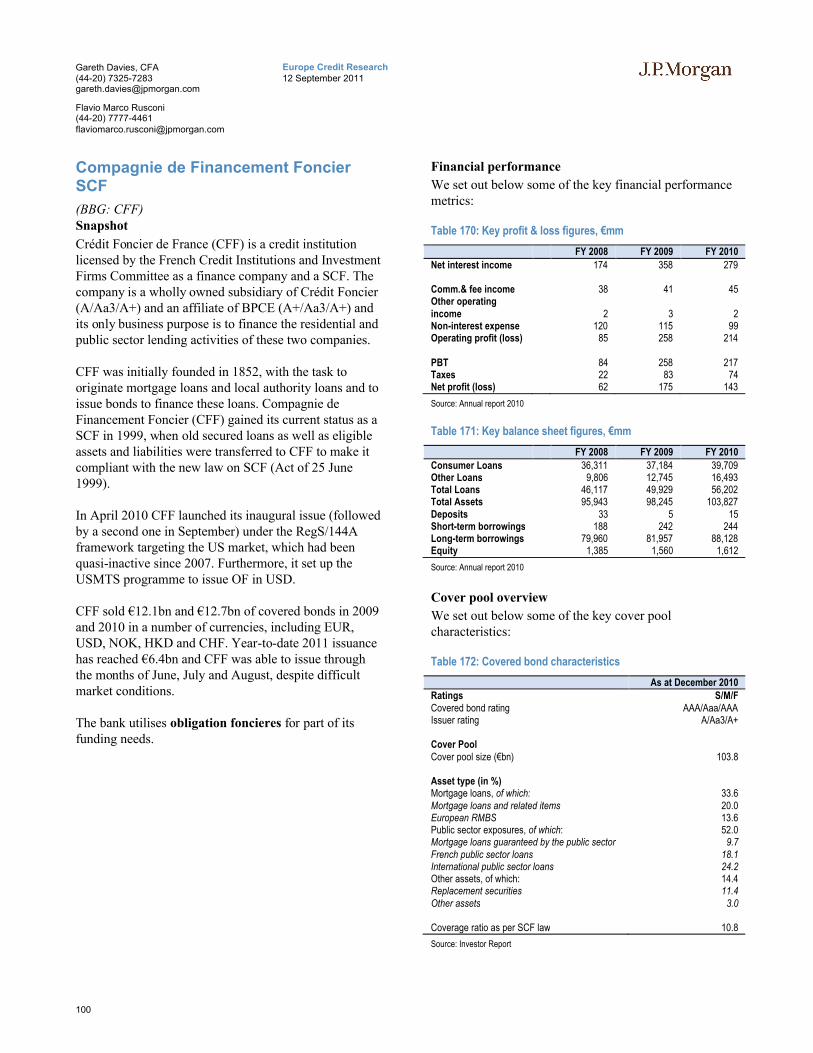
100
Europe Credit Research12 September 2011
Gareth Davies, CFA(44-20) [email protected]
Flavio Marco Rusconi(44-20) [email protected]
Compagnie de Financement Foncier SCF
(BBG: CFF)Snapshot
Crédit Foncier de France (CFF) is a credit institution licensed by the French Credit Institutions and Investment Firms Committee as a finance company and a SCF. The company is a wholly owned subsidiary of Crédit Foncier (A/Aa3/A+) and an affiliate of BPCE (A+/Aa3/A+) and its only business purpose is to finance the residential and public sector lending activities of these two companies.
CFF was initially founded in 1852, with the task to originate mortgage loans and local authority loans and to issue bonds to finance these loans. Compagnie de Financement Foncier (CFF) gained its current status as a SCF in 1999, when old secured loans as well as eligible assets and liabilities were transferred to CFF to make it compliant with the new law on SCF (Act of 25 June 1999).
In April 2010 CFF launched its inaugural issue (followed by a second one in September) under the RegS/144A framework targeting the US market, which had been quasi-inactive since 2007. Furthermore, it set up the USMTS programme to issue OF in USD.
CFF sold €12.1bn and €12.7bn of covered bonds in 2009 and 2010 in a number of currencies, including EUR, USD, NOK, HKD and CHF. Year-to-date 2011 issuance has reached €6.4bn and CFF was able to issue through the months of June, July and August, despite difficult market conditions.
The bank utilises obligation foncieres for part of its funding needs.
Financial performance
We set out below some of the key financial performance metrics:
Table 170: Key profit & loss figures, €mm
FY 2008 FY 2009 FY 2010
Net interest income 174 358 279
Comm.& fee income 38 41 45Other operating income 2 3 2Non-interest expense 120 115 99Operating profit (loss) 85 258 214
PBT 84 258 217Taxes 22 83 74Net profit (loss) 62 175 143
Source: Annual report 2010
Table 171: Key balance sheet figures, €mm
FY 2008 FY 2009 FY 2010
Consumer Loans 36,311 37,184 39,709Other Loans 9,806 12,745 16,493Total Loans 46,117 49,929 56,202Total Assets 95,943 98,245 103,827Deposits 33 5 15Short-term borrowings 188 242 244Long-term borrowings 79,960 81,957 88,128Equity 1,385 1,560 1,612
Source: Annual report 2010
Cover pool overview
We set out below some of the key cover pool characteristics:
Table 172: Covered bond characteristics
As at December 2010Ratings S/M/FCovered bond rating AAA/Aaa/AAAIssuer rating A/Aa3/A+
Cover PoolCover pool size (€bn) 103.8
Asset type (in %)Mortgage loans, of which: 33.6 Mortgage loans and related items 20.0 European RMBS 13.6 Public sector exposures, of which: 52.0 Mortgage loans guaranteed by the public sector 9.7 French public sector loans 18.1 International public sector loans 24.2 Other assets, of which: 14.4 Replacement securities 11.4 Other assets 3.0
Coverage ratio as per SCF law 10.8
Source: Investor Report

101
Europe Credit Research12 September 2011
Gareth Davies, CFA(44-20) [email protected]
Flavio Marco Rusconi(44-20) [email protected]
Crédit Agricole Home Loans SFH
(BBG: ACACB)Snapshot
The Credit Agricole Group offers retail banking and corporate and investment baking products and specialised financial services. The group operates globally through 70 countries and catering to 54mm customers worldwide, although its core markets are France, Italy and Greece.
Within the group, Credit Agricole S.A. ensures the cohesion and smooth running of the network and acts as a representative for the Group in dealing with the banking authorities. It also acts as a central bank, ensuring financial unity. Its activities are organised into three, broad business lines. Retail banking in France and abroad; Specialised Business lines including asset management, insurance, private banking and consumer finance, leasing and factoring; and Corporate and Investment banking.
The second pillar of the Group is its 39 regional banks, in which CA S.A. owns a 25% stake. These offer a broad range of financial products to individuals, SMEs, farmers and local authorities. Finally, the third arm of the Group is the Fédération Nationale du Crédit Agricole, the body through which the regional banks discuss policies and represent themselves.
The bank switched from structured CB to OH for part of its funding needs.
Financial performance
We set out below some of the key financial performance metrics:
Table 173: Key profit & loss figures CA S.A., €mm
FY 2008 FY 2009 FY 2010Net interest income 12,113 14,290 14,894Provisions for loan losses 2,806 4,526 3,205NII less provisions 9,307 9,764 11,689
Comm.& fee income 9,309 9,798 10,775Other operating income 8,075 -6,179 -5,108Non-interest expense 17,905 17,367 19,638Operating profit (loss) 184 1,093 2,980
PBT 1,200 1,657 2,629Taxes -66 211 877Net profit (loss) 1,024 1,125 1,263
Source: Bloomberg
Table 174: Key balance sheet figures CA S.A., €mm
FY 2008 FY 2009 FY 2010Consumer Loans 349,037 344,515 364,725Loans 349,037 362,348 383,246Total Assets 1,653,220 1,557,342 1,593,529Deposits 421,411 464,080 501,360Short-term borrowings 171,749 341,064 353,872Other ST borrowings 588,921 99,631 67,971Long-term borrowings 222,083 378,779 353,875Equity 47,336 51,964 52,149
Source: Bloomberg
Table 175: Select financial metrics
FY 2008 FY 2009 FY 2010
NIM 0.9 1.0 1.1ROA 0.1 0.1 0.1ROE 2.7 2.8 3.0ROC 0.3 0.2 0.2C:I 81.3 68.7 69.0Core capital 8.6 9.5 10.6
Source: Bloomberg
Cover pool overview
We set out below some of the key cover pool characteristics:
Table 176: Covered bond characteristics
As at June 2011
Ratings S/M/FCovered bond rating AAA/Aaa/AAAIssuer rating A+/Aa1/AA-
Cover PoolCover pool size (€) 29,728,482,533Number of loans 855,908Avg loan (€) 34,733
WA current LTV (in %) 61.4WA current indexed LTV (in %) 54.5Remaining tenor (mths) 155WA seasoning (mths) 80
Owner occupied property (in %) 83.0 Buy-to-let (in %) 13.9 Employed borrower (in %) 66.3 Self-employed borrower (in %) 18.3
Source: Investor Report
Table 177: Collateral pool LTV breakdown
Current LTV ranges As at June 2011
0-<=40% 18.1 >40%-<=50% 11.4 >50%-<=60% 14.7 >60%-<=70% 17.3 >70%-<=80% 16.7 >80%-<=90% 12.4 >90%-<=100% 9.4
Source: Investor Report

102
Europe Credit Research12 September 2011
Gareth Davies, CFA(44-20) [email protected]
Flavio Marco Rusconi(44-20) [email protected]
Crédit Mutuel Arkéa Home Loans SFH
(BBG: CMACB)Snapshot
Crédit Mutuel Arkéa is a cooperative credit union formed by the federations of Crédit Mutuel du Bretagne, Crédit Mutuel du Sud-Ouest, Crédit Mutuel du Massif Central and around 20 other specialised lenders, for a total of around 600 local saving banks and branches, serving 3.1mm customers, mostly in the Brittany (24% market share of deposit-taking and 27% market share in retail loans), South West (7% market share for both deposits and retail loans) and Massive Central (2% market share for both deposits and retail lending) regions.
CM Arkea’s loan book is 54% residential loans, 11% consumer loans and 20% SME/corporate loans. In order to expand and further diversify its activities and geographical exposure, CM Arkea has set up subsidiaries and developed partnerships with a national reach and offering internet deposit-taking services, consumer lending outside of the core regions and insurance and asset management services.
The bank has recently moved from structured covered bonds to an SFH programme with a maximum size of €10bn for part of its funding needs. This reduced refinancing risk for the issuer and increased credit quality for investors.
Financial performance
We set out below some of the key financial performance metrics:
Table 178: Key profit & loss figures, €mm
FY 2008 FY 2009 FY 2010Net interest income 473 610 660
Comm.& fee income 474 429 466Other operating income 3,588 5,350 4,438Non-interest expense 4,307 971 1,089Operating profit (loss) 44 200 347
PBT 78 208 341Taxes 27 46 48Net profit (loss) 31 161 293
Source: Annual report 2010
Table 179: Key balance sheet figures, €mm
FY 2008 FY 2009 FY 2010Loans 29,356 30,863 35,902Total Assets 69,059 72,362 78,747Deposits 20,131 21,168 23,657Short-term borrowings 4,080 5,700 5,556Other ST borrowings 1,287 1,493 1,536Equity 2,818 3,507 3,777
Source: Annual report 2010
Table 180: Select financial metrics
FY 2008 FY 2009 FY 2010ROE 1.1 5.9 8.4Core capital 12.5 11.3
Source: Annual report 2010
Cover pool overview
We set out below some of the key cover pool characteristics:
Table 181: Covered bond characteristics
As at June 2011Ratings S/M/FCovered bond rating AAA/-/-Issuer rating A+/-/-
Cover poolCover pool size (€) 4,686,365,979Number of loans 92,815Avg loan (€) 68,117
WA current LTV (in %) 69.0WA current indexed LTV (in %) 65.0Remaining tenor (mths) 166WA seasoning (mths) 46
Owner occupied property (in %) 85.0 Buy-to-let (in %) 11.7 Employed borrower (in %) 67.2 Self-employed borrower (in %) 14.1 Unemployed borrower (in %) 1.5
Source: Investor Report
Table 182: Collateral pool LTV breakdown
Current LTV ranges As at June 20110-<=40% 18.7 >40%-<=50% 9.0 >50%-<=60% 10.8 >60%-<=70% 12.3 >70%-<=80% 14.4 >80%-<=90% 17.8 >90%-<=100% 16.9
Source: Investor Report

103
Europe Credit Research12 September 2011
Gareth Davies, CFA(44-20) [email protected]
Flavio Marco Rusconi(44-20) [email protected]
Crédit Mutuel-CIC Home Loans SFH
(BBG: CMCICB)Snapshot
CM10-CIC is a group of 10 regional Crédit Mutuel (CM) regional banks. It is the 5th largest bank by equity and the 3rd largest retail banking franchise in France. At the end of 2009, it had market share of 12% and 17% for deposits and loans respectively, according to Fitch Ratings. CM10-CIC is part of the wider network of 18 CM regional banks, accounting for around 80% of CM’s assets.
Banque Fédérative du Crédit Mutuel (BFCM) manages the general interest of the specialised branches of the group, is involved in the financing of large-scale projects and is active in the financial markets.
CMCIC Home Loans SFH is registered as a limited liability company and is licensed to act as a credit institution with limited purpose. Its sole activity is to finance residential mortgages for CMCEE-CIC group.
The bank utilises an SFH structure issuing OH for part of its funding needs.
Financial performance
We set out below some of the key financial performance metrics:
Table 183: Key profit & loss figures, €mm
FY 2008 FY 2009 FY 2010Net interest income 3,970 7,392 8,183Provisions for loan losses 1,459 2,089 991NII less provisions 2,511 5,303 7,192
Comm.& fee income 3,734 4,411 4,683Other operating income 1,966 2,253 2,711Non-interest expense 7,742 9,718 10,635Operating profit (loss) 362 2,835 4,187
PBT 409 2,742 4,171Taxes -33 860 1,145Net profit (loss) 440 1,831 2,916
Source: Bloomberg
Table 184: Key balance sheet figures, €mm
FY 2008 FY 2009 FY 2010Real Estate Loans 155,205 159,402 171,483 Loans 295,837 304,511 323,065 Total Assets 581,709 579,038 591,309 Deposits 196,507 218,431 237,402 Short-term borrowings 56,349 40,065 28,509 Other ST borrowings 27,354 16,738 16,619 Long-term borrowings 191,258 173,301 168,805 Equity 25,036 30,619 33,388
Source: Bloomberg
Table 185: Select financial metrics
FY 2008 FY 2009 FY 2010
NIM 0.8 1.4 1.5ROA 0.1 0.3 0.5ROE 1.7 6.7 9.4ROC 0.2 0.7 1.3C:I 78.4 63.7 64.8Core capital 9.8 11.8
Source: Bloomberg
Cover pool overview
We set out below some of the key cover pool characteristics:
Table 186: Covered bond characteristics
As at July 2011
Ratings S/M/FCovered bond rating AAA/Aaa/AAAIssuer rating A+/Aa3/AA-
Cover poolCover pool size (€) 28,636,976,000Number of loans 337,825Avg loan (€) 84,769
WA current LTV (in %) 70.0WA current indexed LTV (in %) 63.0Remaining tenor (mths) 192WA seasoning (mths) 53
Fixed rate (in %) 98.3 Owner occupied property (in %) 80.1 Buy-to-let (in %) 16.4 Loans with guarantor (in %) 35.4 First liens (in %) 64.6
Source: Investor Report
Table 187: Collateral pool LTV breakdown
Current LTV ranges As at July 2011
0-<=40% 16.9 >40%-<=50% 10.3 >50%-<=60% 13.0 >60%-<=70% 15.5 >70%-<=80% 17.8 >80%-<=90% 18.9 >90%-<=100% 0.1
Source: Investor Report

104
Europe Credit Research12 September 2011
Gareth Davies, CFA(44-20) [email protected]
Flavio Marco Rusconi(44-20) [email protected]
Dexia Municipal Agency SCF
(BBG: DEXMA)Snapshot
Dexia Municipal Agency (DexMA) is the SCF of the Dexia Group, whose sole activity is to finance local governments in the EEA area, the USA, Canada and Japan (although France remains its main market) and issue covered bonds. It is a wholly owned subsidiary of Dexia Crédit Local, the French public finance arm of the Dexia group.
The Dexia group is active in public and project finance, personal finance, investment management, insurance and treasury and financial market.
In the public sector financing market, the group is a leader in Europe and its main markets are Belgium (market share of 80%), France (market share of 42%) and Italy (market share of 20%). Dexia also offers a full range of retail services to customers in Belgium, Luxembourg and Turkey, where it is amongst the top 6 privately owned banks.
Dexia Group is also amongst the largest in Europe in the field of asset management, with €86.4bn of assets under management as at December 2010. Dexia also manages further funds through its joint-venture with Royal Bank of Canada.
The bank utilises obligation foncieres for part of its funding needs. Through this platform it issued €5.7bn in 2009, €9.0bn in 2010 and €5.6bn in 2011 YTD. Bonds are denominated in EUR, CHF, NOK and USD.
Financial performance
We set out below some of the key financial performance metrics:
Table 188: Key profit & loss figures, €mm
FY 2009 FY 2010
Net interest income 282 256
Non-interest expense 92 96Operating profit (loss) 207 163
PBT 207 163Taxes 73 54Net profit (loss) 134 109
Source: Bloomberg
Table 189: Key balance sheet figures, €mm
FY 2009 FY 2010Loans 78,870 85,196 Total Assets 85,830 94,230 Long-term borrowings 65,933 66,819 Equity 990 1,069
Source: Bloomberg
Cover pool overview
We set out below some of the key cover pool characteristics:
Table 190: Covered bond characteristics
As at March 2011
Ratings S/M/FCovered bond rating AAA/Aaa/AAAIssuer rating A/A3/A+
Cover poolCover pool size (€) 78,106,500,000
Country split (in %)France 64.9 Belgium 9.7 Italy 9.7 Switzerland 5.2 Spain 4.1 Luxembourg 2.4 Other 4.0
Collateral type (in %)Loans to local governments 70.4 Bonds 29.6
Source: Investor Report

105
Europe Credit Research12 September 2011
Gareth Davies, CFA(44-20) [email protected]
Flavio Marco Rusconi(44-20) [email protected]
General Electric SCF
(BBG: GESCF)Snapshot
GE Money Bank France is part of GE Capital, in turn part of the General Electric Group. GE Capital provides a wide range of products - from consumer lending to financial products for businesses throughout the world.
GE Capital entered the French market through its acquisition of Crédit de l'Est and Banque Sovac in 1995. GE Money Bank, formerly known with the name GE Capital Bank, offers a wide range of consumer lending products, such as personal loans, credit cards, car loans and mortgage facilities. The company also provides leasing and real estate financing.
The bank utilises obligation foncieres for part of its funding needs.
Cover pool overview
We set out below some of the key cover pool characteristics:
Table 191: Covered bond characteristics
As at June 2011Ratings S/M/FCovered bond rating AAA/Aaa/-
Cover poolCover pool size (€) 2,610,402,732Number of loans 31,054Avg loan (€) 84,060
WA current LTV (in %) 67.9 WA current indexed LTV (in %) 58.9 Remaining tenor (mths) 179 WA seasoning (mths) 63
Owner occupied property (in %) 48.0 Buy-to-let (in %) 20.1 Employed (in %) 82.3 Self employed (in %) 13.5
Source: Investor Report
Table 192: Collateral pool LTV breakdown
Current LTV ranges As at June 2011
0-<=40% 14.5 >40%-<=50% 9.2 >50%-<=60% 10.9 >60%-<=70% 12.8 >70%-<=80% 17.8 >80%-<=90% 14.2 >90%-<=100% 17.6
Source: Investor Report

106
Europe Credit Research12 September 2011
Gareth Davies, CFA(44-20) [email protected]
Flavio Marco Rusconi(44-20) [email protected]
Groupe Caisse d’Épargne Covered Bonds
(BBG: CDEE)Snapshot
Together with Caisse d'Épargne, Banques Populaires is one of the two brands of the Groupe BPCE (see separate Banques Populaires overview above). Unlike BPCE SFH and Banques Populaires SCF, Groupe Caisse d’Épargne still uses structured covered bonds.
Financial performance
We set out below some of the key financial performance metrics:
Table 193: Key profit & loss figures Groupe BPCE, €mm
FY 2009 FY 2010Net interest income 12,752 12,182
Comm.& fee income 8,705 9,052Other operating income 11,804 11,770Non-interest expense 16,359 16,057Operating profit (loss) 723 5,648
PBT -368 5,749Taxes -293 1,716Net profit (loss) -75 4,033
Source: Annual report 2010
Table 194: Key balance sheet figures Groupe BPCE, €mm
FY 2009 FY 2010
Loans 309,855 342,994Total Assets 1,028,802 1,048,442Deposits 14,941 12,993Short-term borrowings 77,057 83,944Long-term borrowings 124,755 136,313Equity 47,794 51,365
Source: Annual report 2010
Table 195: Select financial metrics
FY 2009 FY 2010C:I 69 60 Core capital 9.1 10.1
Source: Annual report 2010
Cover pool overview
We set out below some of the key cover pool characteristics:
Table 196: Covered bond characteristics
As at July 2011
Ratings S/M/FCovered bond rating AAA/Aaa/-Issuer rating A+/Aa3/A+
Cover poolCover pool size (€) 15,919,449,032Number of loans 272,115Avg loan (€) 58,503
WA current LTV (in %) 68.7WA current indexed LTV (in %) 67.5Remaining tenor (mths) 191WA seasoning (mths) 46
Fixed rate (in %) 96.5 Owner occupied property (in %) 90.4 Buy-to-let (in %) 7.2 Employed (in %) 81.7 Self employed (in %) 0.2
Source: Investor Report
Table 197: Collateral pool LTV breakdown
Current LTV ranges As at July 2011
0-<=40% 13.4 >40%-<=50% 8.5 >50%-<=60% 10.4 >60%-<=70% 12.6 >70%-<=80% 15.9 >80%-<=90% 19.8 >90%-<=100% 19.5
Source: Investor Report
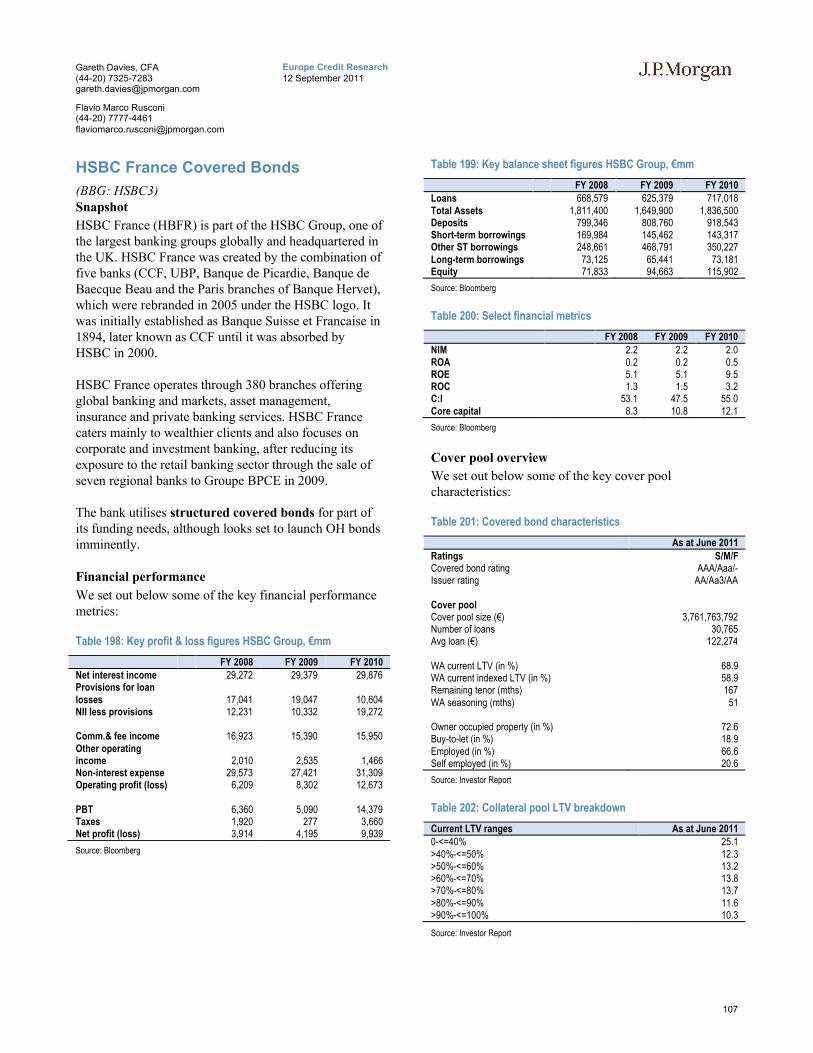
107
Europe Credit Research12 September 2011
Gareth Davies, CFA(44-20) [email protected]
Flavio Marco Rusconi(44-20) [email protected]
HSBC France Covered Bonds
(BBG: HSBC3)Snapshot
HSBC France (HBFR) is part of the HSBC Group, one of the largest banking groups globally and headquartered in the UK. HSBC France was created by the combination of five banks (CCF, UBP, Banque de Picardie, Banque de Baecque Beau and the Paris branches of Banque Hervet), which were rebranded in 2005 under the HSBC logo. It was initially established as Banque Suisse et Francaise in 1894, later known as CCF until it was absorbed by HSBC in 2000.
HSBC France operates through 380 branches offering global banking and markets, asset management, insurance and private banking services. HSBC France caters mainly to wealthier clients and also focuses on corporate and investment banking, after reducing its exposure to the retail banking sector through the sale of seven regional banks to Groupe BPCE in 2009.
The bank utilises structured covered bonds for part of its funding needs, although looks set to launch OH bonds imminently.
Financial performance
We set out below some of the key financial performance metrics:
Table 198: Key profit & loss figures HSBC Group, €mm
FY 2008 FY 2009 FY 2010Net interest income 29,272 29,379 29,876Provisions for loan losses 17,041 19,047 10,604NII less provisions 12,231 10,332 19,272
Comm.& fee income 16,923 15,390 15,950Other operating income 2,010 2,535 1,466Non-interest expense 29,573 27,421 31,309Operating profit (loss) 6,209 8,302 12,673
PBT 6,360 5,090 14,379Taxes 1,920 277 3,660Net profit (loss) 3,914 4,195 9,939
Source: Bloomberg
Table 199: Key balance sheet figures HSBC Group, €mm
FY 2008 FY 2009 FY 2010Loans 668,579 625,379 717,018 Total Assets 1,811,400 1,649,900 1,836,500 Deposits 799,346 808,760 918,543 Short-term borrowings 169,984 145,462 143,317 Other ST borrowings 248,661 468,791 350,227 Long-term borrowings 73,125 65,441 73,181 Equity 71,833 94,663 115,902
Source: Bloomberg
Table 200: Select financial metrics
FY 2008 FY 2009 FY 2010NIM 2.2 2.2 2.0ROA 0.2 0.2 0.5ROE 5.1 5.1 9.5ROC 1.3 1.5 3.2C:I 53.1 47.5 55.0Core capital 8.3 10.8 12.1
Source: Bloomberg
Cover pool overview
We set out below some of the key cover pool characteristics:
Table 201: Covered bond characteristics
As at June 2011
Ratings S/M/FCovered bond rating AAA/Aaa/-Issuer rating AA/Aa3/AA
Cover poolCover pool size (€) 3,761,763,792Number of loans 30,765Avg loan (€) 122,274
WA current LTV (in %) 68.9 WA current indexed LTV (in %) 58.9 Remaining tenor (mths) 167WA seasoning (mths) 51
Owner occupied property (in %) 72.6 Buy-to-let (in %) 18.9 Employed (in %) 66.6 Self employed (in %) 20.6
Source: Investor Report
Table 202: Collateral pool LTV breakdown
Current LTV ranges As at June 20110-<=40% 25.1 >40%-<=50% 12.3 >50%-<=60% 13.2 >60%-<=70% 13.8 >70%-<=80% 13.7 >80%-<=90% 11.6 >90%-<=100% 10.3
Source: Investor Report

108
Europe Credit Research12 September 2011
Gareth Davies, CFA(44-20) [email protected]
Flavio Marco Rusconi(44-20) [email protected]
Société Générale SCF
(BBG: SOCSCF)Snapshot
Société Générale SCF is the SCF set up by Société Générale, one of the largest French financial institutions. The objective of SG SCF is to provide funding for SG’s public-sector loan book. The cover pool consists entirely of loans to French public entities and the bonds issued are in OF form.
SG’s product offer ranges from corporate and investment banking to retail banking, insurance, private finance and investment management services.
On the French retail banking market the bank operates through three distribution networks: Société Générale, Crédit du Nord and Boursorama Banque, an online bank. Through these networks, the bank offers services to almost 11mm customers. SocGen also offers international retail banking services in 37 countries, serving another 12mm customers.
Société Générale is also actively present in the private baking sector, with €84.1bn of assets under management across 19 countries as at the end of June 2011. Furthermore, the group has 25% stake in the asset manager Amundi.
Corporate and Investment Banking is the third pillar of the group, with offices in 33 countries.
Financial performance
We set out below some of the key financial performance metrics:
Table 203: Key profit & loss figures Societe Generale, €mm
FY 2008 FY 2009 FY 2010Net interest income 8,414 11,964 12,288Provisions for loan losses 4,903 10,860 3,604NII less provisions 3,511 1,104 8,684
Comm.& fee income 10,505 10,445 10,038Other operating income 1,267 1,007 1,271Non-interest expense 16,370 13,387 19,654Operating profit (loss) 4,316 827 5,724
PBT 4,008 800 5,844Taxes 1,235 -308 1,542Net profit (loss) 2,010 678 3,917
Source: Bloomberg
Table 204: Key balance sheet figures Societe Generale, €mm
FY 2008 FY 2009 FY 2010Loans 383,125 373,399 401,013Total Assets 1,130,003 1,023,701 1,132,072Deposits 282,514 300,054 337,447Short-term borrowings 582,835 454,701 499,547Other ST borrowings 57,817 48,800 55,003Long-term borrowings 85,663 86,740 92,913Equity 40,887 46,838 50,975
Source: Bloomberg
Table 205: Select financial metrics
FY 2008 FY 2009 FY 2010NIM 0.8 1.2 1.2ROA 0.2 0.1 0.4ROE 7.0 2.1 10.4ROC 0.4 0.2 0.7C:I 59.0 47.9 64.7Core capital 8.8 10.7 10.6
Source: Bloomberg
Cover pool overview
We set out below some of the key cover pool characteristics:
Table 206: Covered bond characteristics
As at March 2011
Ratings S/M/FCovered bond rating AAA/Aaa/AAAIssuer rating A+/Aa2/A+
Cover poolCover pool size (€) 10,751,812,383Number of loans 1,314 France (in %) 94.8
Borrower type within France (in %)Regions 12.0 Departments 30.4 Districts 13.8 Districts groups 12.2 Public health complex 18.0 Syndicates 7.8 Other 5.9 Fixed rate loans (in %) 61.2
Source: Investor Report
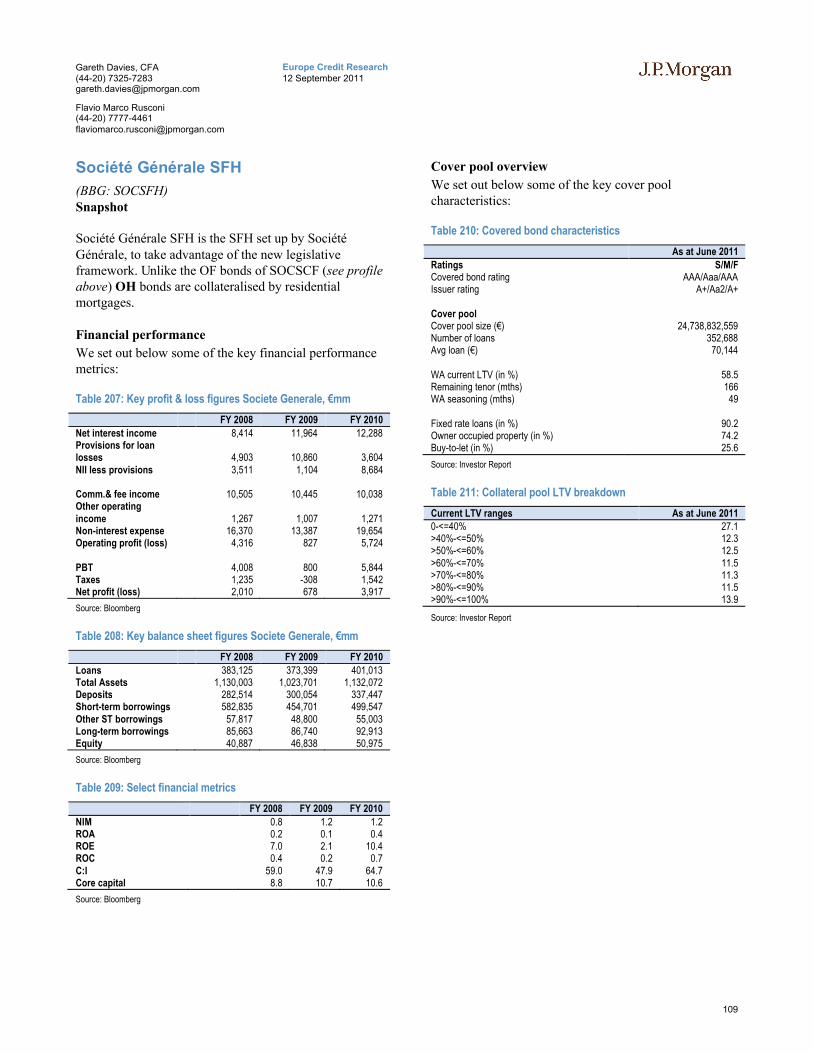
109
Europe Credit Research12 September 2011
Gareth Davies, CFA(44-20) [email protected]
Flavio Marco Rusconi(44-20) [email protected]
Société Générale SFH
(BBG: SOCSFH)Snapshot
Société Générale SFH is the SFH set up by Société Générale, to take advantage of the new legislative framework. Unlike the OF bonds of SOCSCF (see profile above) OH bonds are collateralised by residential mortgages.
Financial performance
We set out below some of the key financial performance metrics:
Table 207: Key profit & loss figures Societe Generale, €mm
FY 2008 FY 2009 FY 2010
Net interest income 8,414 11,964 12,288Provisions for loan losses 4,903 10,860 3,604NII less provisions 3,511 1,104 8,684
Comm.& fee income 10,505 10,445 10,038Other operating income 1,267 1,007 1,271Non-interest expense 16,370 13,387 19,654Operating profit (loss) 4,316 827 5,724
PBT 4,008 800 5,844Taxes 1,235 -308 1,542Net profit (loss) 2,010 678 3,917
Source: Bloomberg
Table 208: Key balance sheet figures Societe Generale, €mm
FY 2008 FY 2009 FY 2010
Loans 383,125 373,399 401,013Total Assets 1,130,003 1,023,701 1,132,072Deposits 282,514 300,054 337,447Short-term borrowings 582,835 454,701 499,547Other ST borrowings 57,817 48,800 55,003Long-term borrowings 85,663 86,740 92,913Equity 40,887 46,838 50,975
Source: Bloomberg
Table 209: Select financial metrics
FY 2008 FY 2009 FY 2010
NIM 0.8 1.2 1.2ROA 0.2 0.1 0.4ROE 7.0 2.1 10.4ROC 0.4 0.2 0.7C:I 59.0 47.9 64.7Core capital 8.8 10.7 10.6
Source: Bloomberg
Cover pool overview
We set out below some of the key cover pool characteristics:
Table 210: Covered bond characteristics
As at June 2011
Ratings S/M/FCovered bond rating AAA/Aaa/AAAIssuer rating A+/Aa2/A+
Cover poolCover pool size (€) 24,738,832,559Number of loans 352,688Avg loan (€) 70,144
WA current LTV (in %) 58.5 Remaining tenor (mths) 166 WA seasoning (mths) 49
Fixed rate loans (in %) 90.2Owner occupied property (in %) 74.2 Buy-to-let (in %) 25.6
Source: Investor Report
Table 211: Collateral pool LTV breakdown
Current LTV ranges As at June 20110-<=40% 27.1 >40%-<=50% 12.3 >50%-<=60% 12.5 >60%-<=70% 11.5 >70%-<=80% 11.3 >80%-<=90% 11.5 >90%-<=100% 13.9
Source: Investor Report

110
Europe Credit Research12 September 2011
Gareth Davies, CFA(44-20) [email protected]
Flavio Marco Rusconi(44-20) [email protected]

111
Europe Credit Research12 September 2011
Gareth Davies, CFA(44-20) [email protected]
Flavio Marco Rusconi(44-20) [email protected]
Ge
rma
n C
ove
red
Bo
nd
s

112
Europe Credit Research12 September 2011
Gareth Davies, CFA(44-20) [email protected]
Flavio Marco Rusconi(44-20) [email protected]
German Covered Bonds
Legislative snapshot
We set out in Table 212 a snapshot of key covered bond attributes in Germany.
Table 212: German Covered Bond legislative overview
Attribute CommentaryFrameworkLegislative Framework German Pfandbrief Act (Pfandbriefgesetz of 2005) and Regulations to the Pfandbrief Act (amended in 2009
and 2010); Net Present Value Regulation (Barwertverordnung); Regulation on the Determination of the Mortgage Lending Value (Beleihungswertermittlungsverordnung); Cover Register Statutory Order (Deckungsregisterverordnung); Funding Register Statutory Order (Refinanzierungsregisterverordnung); §§ 22a – German Banking Act (Kreditwesengesetz).
Types of covered bonds Four. Mortgage, Public sector, Ship and Aircraft covered bonds.Structure of Issuer Direct issuance? Yes.
Comments (if any) Since 2005, pfandbrief issuers no longer need to be specialised banks. Bonds are therefore issued directly off the balance sheet of the lender, although a special pfandbrief licence is required.
Bankruptcy remoteness Issuers are required to have a register to record the cover assets. Insolvency of the originating institution does not accelerate payments under the covered bonds. On insolvency, a special cover pool administrator (Sachwalter) carries out the administration of the cover assets.
Dual claim Yes, pari passu with unsecured creditors. Bond format Fixed rate, hard bullets.Supervision Federal Financial Supervisory Authority; German Banking Supervisory Authority (BaFin). A cover pool
monitor also supervises the cover pool.Cover pool
Eligible assets Mortgage Residential or commercial. Land or mortgages on properties under construction are limited at 10% of collateral value and the asset can only be located in EEA, Switzerland, USA, Canada and Japan. The total volume of the loans in states for which the preferential right of the Pfandbrief on the cover assets is not ensured may not exceed 10%.
LTV caps 60% LTV for residential, commercial and agricultural loans. The LTV of the loans can be higher, but only the first 60% is considered.
Public Sector Loans granted to or guaranteed by public authorities with a RSA risk weight less than 20% and from EU, EEA, Japan, Canada, USA, Switzerland and other European OECD members. The total volume of the loans in states for which the preferential right of the Pfandbrief on the cover assets is not ensured may not exceed 10%.
Ship/Aircraft 60% LTV limit for both. The total volume of the loans in states for which the preferential right of the Pfandbrief on the cover assets is not ensured may not exceed 20%.
Substitution Assets Up to 10% of the cover pool can be made up of money claims against the ECB, EU central banks or other suitable institutions. For mortgage covered bonds, another 10% can be made up of assets eligible for public sector Pfandbriefe.
Hedging Derivatives are allowed for mitigation of market risk. Valuation Individual market values, with monitoring requirements for commercial property exposures each year, and
every three years for residential properties.Other comments (if any) Derivatives are also eligible cover assets, up to a maximum of 12% of the pool on an NPV basis.Requirements
ALM matching Asset coverage Eligible assets must be 102% of liabilities at all times on an NPV basis. Derivatives can be used to help meet cashflow requirements.
Interest coverage The Pfandbrief issuer is obliged to cover the maximum liquidity gap within the next 180 days.Other (if any)
Consequence of breach Regulatory or rule-based actionsMonitoring In addition to the regulators, an independent pool monitor performs regular audits, reports to the supervision
authorities, veifies coverage ratios and checks that assets are recorded correctly in the cover register. Other
Compliance with EU legislation
Both UCITS and CRD compliant.
Source: National legislation, J.P. Morgan Covered Bond Research

113
Europe Credit Research12 September 2011
Gareth Davies, CFA(44-20) [email protected]
Flavio Marco Rusconi(44-20) [email protected]
German covered bond & macro backdrop
Figure 71: CB issuance, €mm
Source: ECBC. Latest data available displayed
Figure 72: CB outstanding, €mm
Source: ECBC. Latest data available displayed
Figure 73: German real GDP growth, y-on-y, %
Source: Bloomberg
Figure 74: German unemployment level, %
Source: Bloomberg
Figure 75: German CPI and base rate, %
Source: Bloomberg
Figure 76: German consumer confidence, balance of survey
Source: Bloomberg
Figure 77: German nominal house price growth, %
Source: OECD
Figure 78: German residential construction orders index, #
Source: Bloomberg
0
50,000
100,000
150,000
200,000
250,000
2003 2004 2005 2006 2007 2008 2009 2010
Mortgage Public Sector Ships
0
200,000
400,000
600,000
800,000
1,000,000
1,200,000
2003 2004 2005 2006 2007 2008 2009 2010
Mortgage Public Sector Ships
-8
-6
-4
-2
0
2
4
6
Mar
-00
Mar
-01
Mar
-02
Mar
-03
Mar
-04
Mar
-05
Mar
-06
Mar
-07
Mar
-08
Mar
-09
Mar
-10
Mar
-11
Real GDP growth
0
2
4
6
8
10
12
14
Mar
-00
Mar
-01
Mar
-02
Mar
-03
Mar
-04
Mar
-05
Mar
-06
Mar
-07
Mar
-08
Mar
-09
Mar
-10
Mar
-11
Unemployment
-1
0
1
2
3
4
5
6
Mar
-00
Mar
-01
Mar
-02
Mar
-03
Mar
-04
Mar
-05
Mar
-06
Mar
-07
Mar
-08
Mar
-09
Mar
-10
Mar
-11
Inflation Base rate
0
20
40
60
80
100
120
Mar
-00
Mar
-01
Mar
-02
Mar
-03
Mar
-04
Mar
-05
Mar
-06
Mar
-07
Mar
-08
Mar
-09
Mar
-10
Mar
-11
Cons. Confidence
-2.0%-1.5%-1.0%-0.5%0.0%0.5%1.0%1.5%2.0%2.5%3.0%3.5%
Mar
-01
Mar
-02
Mar
-03
Mar
-04
Mar
-05
Mar
-06
Mar
-07
Mar
-08
Mar
-09
Mar
-10
Mar
-11
Nominal house price growth
020406080
100120140
160180
Jan-
00
Jan-
01
Jan-
02
Jan-
03
Jan-
04
Jan-
05
Jan-
06
Jan-
07
Jan-
08
Jan-
09
Jan-
10
Jan-
11
Residential construction orders index

114
Europe Credit Research12 September 2011
Gareth Davies, CFA(44-20) [email protected]
Flavio Marco Rusconi(44-20) [email protected]
Aareal Bank AG
(BBG: AARB)Snapshot
The Aareal Bank Group is a specialist in property finance and related services. It provides financing, advisory and other services to real estate clients and also offers public sector finance to both domestic and international clients.
The business model is made up of two segments:Structured property financing includes the institution’s property financing activities as well as advisory and consulting services to clients in realising real estate projects. The Consulting/services unit of the group provides a range of services to clients in the institutional housing industry in Germany, including IT systems, payment transactions systems and real estate portfolio management.
Aareal Bank operates in 25 countries in Europe, North America and Asia, although its core market remains Germany, in particular in the public sector financing business: exposures to German public entities account for almost three quarters of its public sector cover pool and for 17% of its mortgage cover pool.
Aareal Bank is an established issuer of both public sector and mortgage Pfandbriefe, which account for the majority of its long-term funding
Financial performance
We set out below some of the key financial performance metrics:
Table 213: Key profit & loss figures, €mm
FY 2008 FY 2009 FY 2010Net interest income 500 460 509Prov. for loan losses 80 150 105NII less provisions 420 310 404
Commission & fee inc. 211 188 187Other operating inc. 74 30 38Non-interest expense 471 460 477Operating profit 103 88 129
PBT 110 87 134Taxes 45 20 40Net profit (loss) 47 49 76
Source: Bloomberg
Table 214: Key balance sheet figures, €mm
FY 2008 FY 2009 FY 2010Loans 24,530 23,176 24,329 Total Assets 41,023 39,569 41,217 Deposits 20,665 21,361 22,846 Short-term borrowings 8,934 5,083 5,168 Long-term borrowings 7,681 9,131 8,887 Equity 1,452 2,077 1,985
Source: Bloomberg
Table 215: Select financial metrics
FY 2008 FY 2009 FY 2010NIM 1.3 1.2 1.3ROA 0.1 0.1 0.2ROE 3.6 3.9 5.7ROC 0.4 0.4 0.6C:I 69.1 63.0 63.8Core capital 8.0 11.0 10.5
Source: Bloomberg
Cover pool overview
We set out below some of the key cover pool characteristics:
Table 216: Public-sector covered bond characteristics
As at June 2011
Ratings S/M/FCovered Bond rating -/-/AAAIssuer rating -/-/A-
Cover poolCover pool size (€) 3,359,100,000Overcollateralisation (€) 330,700,000
Borrower type (in %)German Federal States 59.0EU countries 24.0German Landesbanken 8.0German Federal Government 6.0Other 3.0
Risk weighting split (in %)Solvency 0 95.0Solvency 20 5.0
Source: Investor report

115
Europe Credit Research12 September 2011
Gareth Davies, CFA(44-20) [email protected]
Flavio Marco Rusconi(44-20) [email protected]
Table 217: Mortgage covered bond characteristics
As at June 2011
Ratings S/M/FCovered Bond rating -/-/AAAIssuer rating -/-/A-
Cover poolCover pool size (€) 10,501,900,000Over-collateralisation (€) 1,805,200,000
Geographical split (in %)Western Europe ex. Germany 30.0Southern Europe 19.0Germany 17.0Northern Europe 14.0North America 11.0Eastern Europe 8.0Asia 1.0
Property type (in %)Office 37.0Retail 24.0Hotel 13.0Logistic 12.0Residential 12.0Other 2.0
Source: Investor report

116
Europe Credit Research12 September 2011
Gareth Davies, CFA(44-20) [email protected]
Flavio Marco Rusconi(44-20) [email protected]
Bayerische Landesbank (BayernLB)
(BBG: BYLAN)Snapshot
BayernLB is a leading commercial bank for large and middle-market corporate customers in Germany and Europe whilst also catering for retail customers. It works closely with the Sparkassen-Finanzgruppe in Bavaria, other Bavarian savings banks and the Bavarian State. In particular, BayernLB's products are sold via other saving banks, which act as customers, owners and sales partners. The bank aims at increasing its partnership with the savings banks in the future in order to target the Mittelstand sector.
Long-term commercial financing to residential property developers and construction companies both on the domestic and international markets are its core activities. The bank also offers real estate investment and M&A advisory.
The other area of focus for the bank is the Mittelstand sector. The bank offers banking and advisory services and financing solutions to middle-market companies looking to export their products abroad and is a leader in the subsidised credit business - particularly in the areas of sustainable energy production and energy efficiency, sustainable mobility and water management.
Finally, BayernLB also offers retail banking services through its Deutsche Kreditbank (DKB) subsidiary. In addition to internet banking, DKB focuses also on growing markets such as environmental technology, healthcare and education & research.
Financial performance
We set out below some of the key financial performance metrics:
Table 218: Key profit & loss figures, €mm
FY 2008 FY 2009 FY 2010Net interest income 2,670 2,562 1,942Prov. for loan losses 1,656 3,277 696NII less provisions 1,014 -715 1,246
Commission & fee inc. 1,114 1,040 811Other operating inc. 141 461 1Non-interest expense 3,151 2,731 2,062Operating profit -5,089 -2,395 798
PBT -5,167 -2,765 884Taxes 191 328 294Net profit (loss) -5,084 -2,619 590
Source: Bloomberg
Table 219: Key balance sheet figures, €mm
FY 2008 FY 2009 FY 2010Loans 199,128 156,142 152,435 Total Assets 421,666 338,818 316,354 Deposits 91,307 92,197 91,734 Short-term borrowings 142,480 91,484 87,195 Long-term borrowings 129,300 101,685 83,171 Equity 11,265 14,061 13,911
Source: Bloomberg
Table 220: Select financial metrics
FY 2008 FY 2009 FY 2010NIM 0.7 0.7 0.6ROA -1.2 -0.7 0.2ROE -52.1 -23.4 4.3ROC -2.0 -1.3 0.3C:I -322.3 70.7 50.4Core capital 8.0 12.5 11.0
Source: Bloomberg
Cover pool overview
We set out below some of the key cover pool characteristics:
Table 221: Public-sector covered bond characteristics
As at June 2011
Ratings S/M/FCovered Bond rating -/Aaa/AAAIssuer rating -/A1/A+
Cover poolCover pool size (€) 46,105,000,000Overcollateralisation (in %) 45.5
Geographical split (in %)Germany 90.5 Switzerland 4.3 Other 5.2
Borrowers type (in %)Other public assets 40.0 States 32.0 Municipalities 20.0 Sovereign 3.0 Additional cover 5.0
Source: Investor report
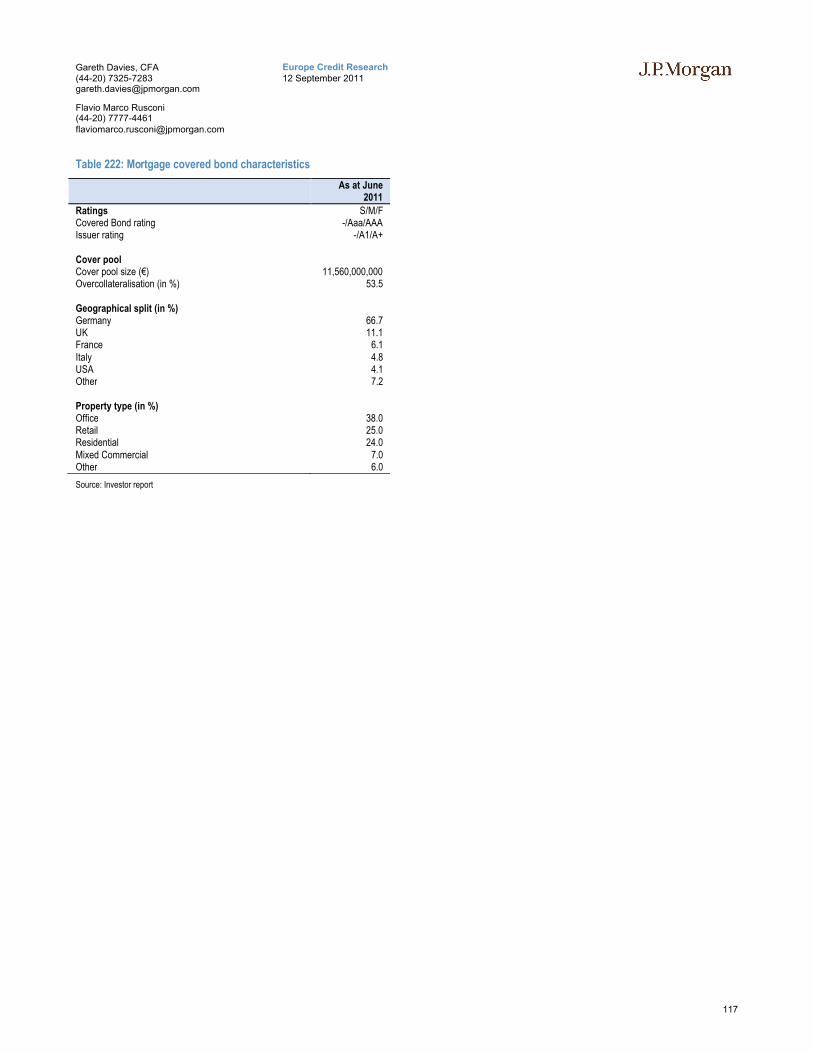
117
Europe Credit Research12 September 2011
Gareth Davies, CFA(44-20) [email protected]
Flavio Marco Rusconi(44-20) [email protected]
Table 222: Mortgage covered bond characteristics
As at June 2011
Ratings S/M/FCovered Bond rating -/Aaa/AAAIssuer rating -/A1/A+
Cover poolCover pool size (€) 11,560,000,000Overcollateralisation (in %) 53.5
Geographical split (in %)Germany 66.7 UK 11.1 France 6.1 Italy 4.8 USA 4.1 Other 7.2
Property type (in %)Office 38.0 Retail 25.0 Residential 24.0 Mixed Commercial 7.0 Other 6.0
Source: Investor report

118
Europe Credit Research12 September 2011
Gareth Davies, CFA(44-20) [email protected]
Flavio Marco Rusconi(44-20) [email protected]
Berlin-Hannoversche Hypothekenbank
(BBG: BHH)Snapshot
Berlin Hyp is a real estate financing bank and one of the leading mortgage-lending institutions in Germany. In conjunction with its parent company, the Landesbank Berlin, it offers a wide range of financial services and products. These span from the financing of large projectsand portfolios to individual residential, commercial and mixed use projects.
The bank was founded in 1868 and assumed several forms and names before eventually becoming Berlin Hyp in 1993, fully owned by the State of Berling; it subsequently merged with Braunschweig-Hannoversche Hypothekenbank in 1996.
Financial performance
We set out below some of the key financial performance metrics:
Table 223: Key profit & loss figures, €mm
FY 2008 FY 2009 FY 2010Net interest income 214 214 215Prov. for loan losses 93 0 0NII less provisions 121 214 215
Commission & fee inc. 17 14 24Other operating inc. 5 7 21Non-interest expense 85 156 168Operating profit 57 78 92
PBT 57 78 5Taxes 13 19 1Net profit (loss) 45 59 2
Source: Bloomberg
Table 224: Key balance sheet figures, €mm
FY 2008 FY 2009 FY 2010Total Assets 41,487 41,291 40,738 Short-term borrowings 9,230 11,191 12,805 Long-term borrowings 27,770 21,090 18,420 Equity 720 789 831
Source: Bloomberg
Table 225: Select financial metrics
FY 2008 FY 2009 FY 2010
ROA 0.1 0.1 0.0ROE 6.1 7.8 0.2ROC 0.1 0.2 0.0C:I 35.1 66.6 64.7
Source: Bloomberg
Cover pool overview
We set out below some of the key cover pool characteristics:
Table 226: Public-sector covered bond characteristics
As at June 2011
Ratings S/M/FCovered Bond rating -/Aaa/AAAIssuer rating -/-/AA-
Cover poolCover pool size (€) 8,249,000,000Overcollateralisation (€) 1,046,000,000
Geographical split (in %)Germany 90.3 Austria 3.7 Other 6.0
Borrowers type (in %)Federal States 62.0 Public law banks & enterprises 19.0 Foreign debtors 10.0 Central Government 1.0 Other 8.0
Source: Investor report
Table 227: Mortgage covered bond characteristics
As at June 2011
Ratings S/M/FCovered Bond rating -/Aa1/AA+Issuer rating -/-/AA-
Cover poolCover pool size (€) 13,253,700,000Overcollateralisation (€) 1,573,600,000
Geographical split (in %)Germany 81.0 France 5.9 UK 4.4 Other 8.7
Property type (in %)Office 28.9 Residential 23.3 Retail 14.3 Mixed Commercial 29.5 Other 3.9
Source: Investor report

119
Europe Credit Research12 September 2011
Gareth Davies, CFA(44-20) [email protected]
Flavio Marco Rusconi(44-20) [email protected]
Bremer Landesbank
(BBG: BREMLB)Snapshot
Bremer Landesbank is the leading regional and commercial bank in the North West of Germany and also assumes the role of Landesbank, a central bank for the savings banks. Its two shareholders are the Norddeutsche Landesbank with a 92.5% stake, while the State of Bremen owns the remaining 7.5%.
The north western region of Germany is the recognised business area of the bank. The bank provides financial solutions and products to its regional and national customers along four different business lines: Corporate customers, Private customers, Financial markets and Special finance. In addition to these business segments, the bank fulfills its role as Landesbank by supporting the empowerment of the regional economic area.
The bank has three types of pfandbrief in circulation, with public-sector, mortgage and shipping bonds available.
Financial performance
We set out below some of the key financial performance metrics:
Table 228: Key profit & loss figures, €mm
FY 2008 FY 2009 FY 2010Net interest income 254 312 341Prov. for loan losses 22 0 0NII less provisions 232 312 341
Commission & fee inc. 74 53 55Other operating inc. 9 51 44Non-interest expense 160 292 211Operating profit 28 123 229
PBT 35 86 92Taxes 5 38 40Net profit (loss) 29 48 48
Source: Bloomberg
Table 229: Key balance sheet figures, €mm
FY 2008 FY 2009 FY 2010Loans 20,106 20,743 21,812 Total Assets 34,308 33,569 34,228 Deposits 9,949 10,202 10,096 Short-term borrowings 7,377 10,489 11,574 Other ST borrowings 362 608 1,035 Long-term borrowings 15,683 9,322 8,985 Equity 936 1,277 1,299
Source: Bloomberg
Table 230: Select financial metrics
FY 2008 FY 2009 FY 2010ROA 0.1 0.1 0.1ROE 2.7 4.3 3.7ROC 0.1 0.2 0.2C:I 73.1 69.8 46.9
Source: Bloomberg
Cover pool overview
We set out below some of the key cover pool characteristics:
Table 231: Public-sector covered bond characteristics
As at June 2011
Ratings S/M/FCovered Bond rating -/Aaa/AAAIssuer rating -/Aa2/A
Cover poolCover pool size (€) 4,023,600,000Over-collateralisation (€) 586,000,000Over-collateralisation (in %) 17
Borrowers type (in %)Local Authorities 43.9 Regional Authorities 13.6 State - Other 42.6
Source: Investor report
Table 232: Mortgage covered bond characteristics
As at June 2011
Ratings S/M/FCovered Bond rating -/Aaa/AAAIssuer rating -/Aa2/A
Cover poolCover pool size (€) 1,035,800,000Over-collateralisation (€) 258,400,000Over-collateralisation (in %) 33.2
Property type (in %)Office 4.5Residential 54.0Retail 2.4Mixed Commercial 29.3Extra collateral 9.8
Source: Investor report
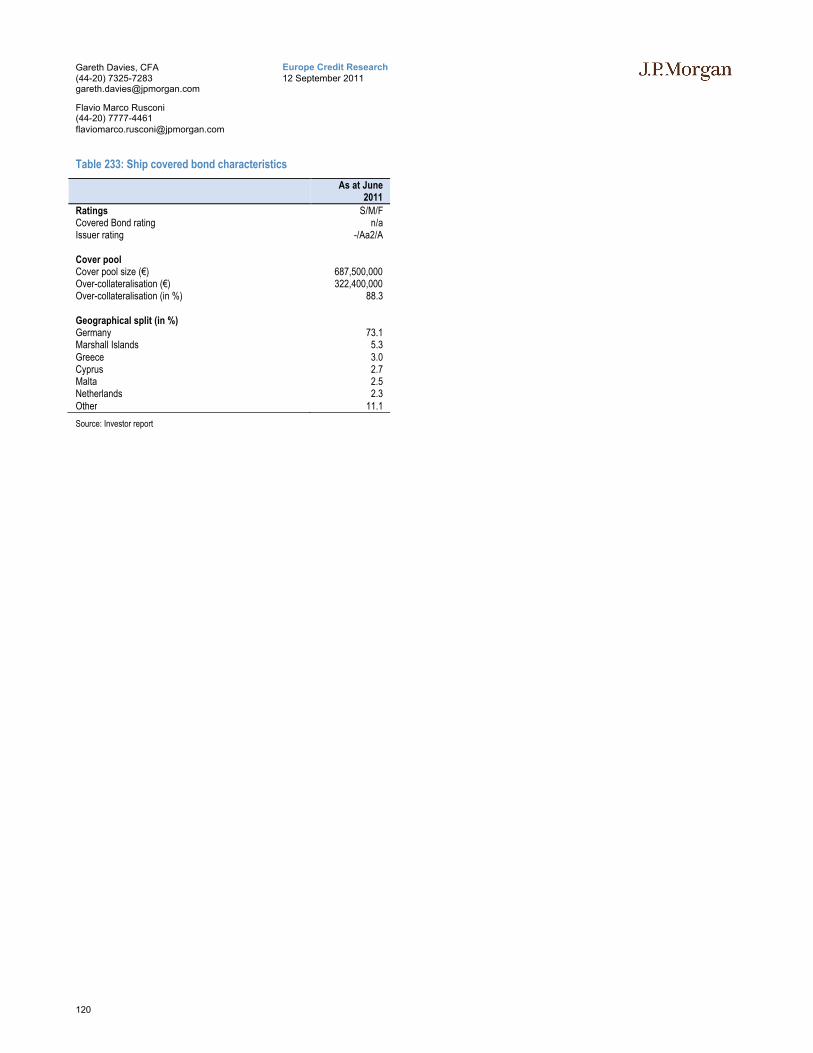
120
Europe Credit Research12 September 2011
Gareth Davies, CFA(44-20) [email protected]
Flavio Marco Rusconi(44-20) [email protected]
Table 233: Ship covered bond characteristics
As at June 2011
Ratings S/M/FCovered Bond rating n/aIssuer rating -/Aa2/A
Cover poolCover pool size (€) 687,500,000Over-collateralisation (€) 322,400,000Over-collateralisation (in %) 88.3
Geographical split (in %)Germany 73.1 Marshall Islands 5.3 Greece 3.0 Cyprus 2.7 Malta 2.5 Netherlands 2.3 Other 11.1
Source: Investor report

121
Europe Credit Research12 September 2011
Gareth Davies, CFA(44-20) [email protected]
Flavio Marco Rusconi(44-20) [email protected]
Corealcredit Bank AG
(BBG: COREAL)Snapshot
Coreralcredit is a specialist bank for commercial property finance and commercial lending, as well as related advisory services. The bank offers real estate solutions for both German and international clients, although its main market remains the domestic one, as evidenced by the 60% exposure to Germany in its public sector cover pool.
As well as the tried and tested method of refinancing via Mortgage Pfandbriefe, Corealcredit also makes use of securitisation and syndication. Business with the public sector has been discontinued and as such the cover pool will be run off according to the maturity of the bonds.
Financial performance
We set out below some of the key financial performance metrics:
Table 234: Key profit & loss figures, €mm
FY 2008 FY 2009 FY 2010Net interest income 37 72 66Prov. for loan losses 15 24 14NII less provisions 22 48 52
Commission & fee inc. 12 7 8Other operating inc. 22 11 7Non-interest expense 69 64 61Operating profit -16 -3 6
PBT -12 -2 9Taxes -25 -5 -2Net profit (loss) 13 3 3
Source: Bloomberg
Table 235: Key balance sheet figures, €mm
FY 2008 FY 2009 FY 2010Loans 6,901 5,632 4,968 Total Assets 15,767 11,375 9,834 Deposits 3,559 2,773 2,689 Short-term borrowings 2,732 2,094 2,070 Long-term borrowings 7,548 5,604 4,168 Equity 696 696 694
Source: Bloomberg
Table 236: Select financial metrics
FY 2008 FY 2009 FY 2010NIM 0.2 0.6 0.6ROA 0.1 0.0 0.0ROE 1.8 0.4 0.4ROC 0.1 0.0 0.0C:I 100.8 74.3 73.9Core capital 12.1 13.5 15.3
Source: Bloomberg
Cover pool overview
We set out below some of the key cover pool characteristics:
Table 237: Public-sector covered bond characteristics
As at June 2011
Ratings S/M/FCovered Bond rating -/-/AAAIssuer rating -/-/BBB-
Cover poolCover pool size (€) 1,552,600,000Overcollateralisation (€) 101,300,000
Geographical split (in %)Germany 60.0 Austria 17.1 Hungary 5.2 Spain 4.5 Italy 3.9 Greece 3.2 Other 6.2
Source: Investor report
Table 238: Mortgage covered bond characteristics
As at June 2011
Ratings S/M/FCovered Bond rating -/-/AA-Issuer rating -/-/BBB-
Cover poolCover pool size (€) 3,309,100,000Overcollateralisation (€) 590,400,000
Property type (in %)Residential 39.0 Office 26.3 Mixed Commercial 18.7 Retail 15.3 Industrial 0.7
Source: Investor report

122
Europe Credit Research12 September 2011
Gareth Davies, CFA(44-20) [email protected]
Flavio Marco Rusconi(44-20) [email protected]
DekaBank Deutsche Girozentrale
(BBG: DEKA)Snapshot
DekaBank is the German Savings Bank Finance Group's (Sparkassen Finanzgruppe) central asset manager. The German Savings Banks and Giro Association and a group of savings banks each own 50% of DekaBank.
With managed fund assets of about € 180 billion, morethan five million customer deposits and group locations in Luxembourg and Switzerland, the DekaBank Group is one of the largest asset managers in Germany, with the savings banks and Landesbanken as exclusive sales partners for its products.
The three main lines of business are: Asset management – this offers products based on property investments and property finance for private and institutional investors and is the largest provider of open-ended property funds in Germany; Property finance - this division provides tailored financial solutions for professional property investors worldwide; the Corporate& Markets business acts as a partner to institutional investors through lending and trading and sales.
Financial performance
We set out below some of the key financial performance metrics:
Table 239: Key profit & loss figures, €mm
FY 2008 FY 2009 FY 2010Net interest income 390 453 347Prov. for loan losses 292 352 -52NII less provisions 98 100 399
Commission & fee inc. 2,706 2,280 2,443Non-interest expense 2,559 2,135 2,245Operating profit -49 520 877
PBT -65 498 849Taxes 51 150 202Net profit (loss) -81 386 648
Source: Bloomberg
Table 240: Key balance sheet figures, €mm
FY 2008 FY 2009 FY 2010Loans 29,575 23,489 26,943 Total Assets 138,609 133,283 130,222 Deposits 33,745 23,773 21,370 Short-term borrowings 21,787 14,906 18,435 Other ST borrowings 42,224 55,704 49,607 Long-term borrowings 37,614 35,400 36,702 Equity 3,240 3,500 4,108
Source: Bloomberg
Table 241: Select financial metrics
FY 2008 FY 2009 FY 2010NIM 0.3 0.3 0.3ROA -0.1 0.3 0.5ROE -2.5 11.6 17.0ROC -0.2 0.6 1.1C:I 77.0 48.9 51.1Core capital 10.5 12.7 12.9
Source: Bloomberg
Cover pool overview
We set out below some of the key cover pool characteristics:
Table 242: Public-sector covered bond characteristics
As at June 2011
Ratings S/M/FCovered Bond rating AAA/Aaa/-Issuer rating A/Aa2/-
Cover poolCover pool size (€) 19,619,551,433Over-collateralisation (€) 2,045,626,170
Geographical split (in %)Germany 90.7 Mixed America 3.2 Great Britain 2.3 Other 3.8
Borrower type (in %)Regional authorities 12.1 Local authorities 3.4 State 2.5 Other 82.0
Source: Investor report
Table 243: Mortgage covered bond characteristics
As at June 2011
Ratings S/M/FCovered Bond rating AAA/Aaa/-Issuer rating A/Aa2/-
Cover poolCover pool size (€) 177,856,258Over-collateralisation (€) 132,856,258
Geographical split (in %)Germany 75.7 France 24.3
Property type (in %)Office 43.7 Retail 20.6 Mixed commercial 8.3 Other collateral 27.4
Source: Investor report
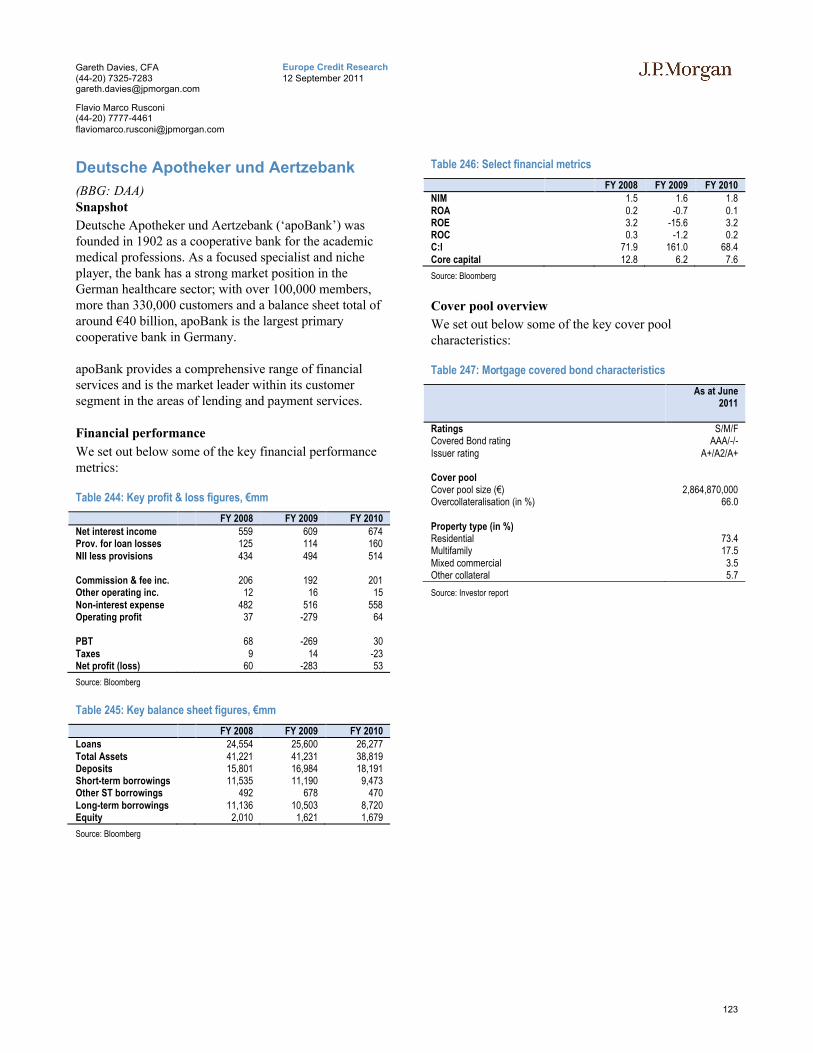
123
Europe Credit Research12 September 2011
Gareth Davies, CFA(44-20) [email protected]
Flavio Marco Rusconi(44-20) [email protected]
Deutsche Apotheker und Aertzebank
(BBG: DAA)Snapshot
Deutsche Apotheker und Aertzebank (‘apoBank’) was founded in 1902 as a cooperative bank for the academic medical professions. As a focused specialist and niche player, the bank has a strong market position in the German healthcare sector; with over 100,000 members, more than 330,000 customers and a balance sheet total of around €40 billion, apoBank is the largest primary cooperative bank in Germany.
apoBank provides a comprehensive range of financial services and is the market leader within its customer segment in the areas of lending and payment services.
Financial performance
We set out below some of the key financial performance metrics:
Table 244: Key profit & loss figures, €mm
FY 2008 FY 2009 FY 2010Net interest income 559 609 674Prov. for loan losses 125 114 160NII less provisions 434 494 514
Commission & fee inc. 206 192 201Other operating inc. 12 16 15Non-interest expense 482 516 558Operating profit 37 -279 64
PBT 68 -269 30Taxes 9 14 -23Net profit (loss) 60 -283 53
Source: Bloomberg
Table 245: Key balance sheet figures, €mm
FY 2008 FY 2009 FY 2010Loans 24,554 25,600 26,277 Total Assets 41,221 41,231 38,819 Deposits 15,801 16,984 18,191 Short-term borrowings 11,535 11,190 9,473 Other ST borrowings 492 678 470 Long-term borrowings 11,136 10,503 8,720 Equity 2,010 1,621 1,679
Source: Bloomberg
Table 246: Select financial metrics
FY 2008 FY 2009 FY 2010NIM 1.5 1.6 1.8ROA 0.2 -0.7 0.1ROE 3.2 -15.6 3.2ROC 0.3 -1.2 0.2C:I 71.9 161.0 68.4Core capital 12.8 6.2 7.6
Source: Bloomberg
Cover pool overview
We set out below some of the key cover pool characteristics:
Table 247: Mortgage covered bond characteristics
As at June 2011
Ratings S/M/FCovered Bond rating AAA/-/-Issuer rating A+/A2/A+
Cover poolCover pool size (€) 2,864,870,000Overcollateralisation (in %) 66.0
Property type (in %)Residential 73.4 Multifamily 17.5 Mixed commercial 3.5 Other collateral 5.7
Source: Investor report

124
Europe Credit Research12 September 2011
Gareth Davies, CFA(44-20) [email protected]
Flavio Marco Rusconi(44-20) [email protected]
Deutsche Bank
(BBG: DB)Snapshot
Deutsche Bank is a global investment bank operating in 72 countries along two main business lines: Corporate & Investment Banking (CIB) and Private Clients & Asset Management (PCAM).
The CIB segment focuses on the origination, sales and trading of capital markets products including debt, equity, and other securities, together with corporate advisory, corporate lending and transaction banking. The bank has significantly strengthened its investment banking franchise in 2009 and 2010, after having weathered the financial crisis of 2008 relatively better than some of its competitors.
The PCAM division offers investment management solutions to both private and institutional clients, together with traditional banking activities for private individuals and small and medium-sized businesses. Deutsche Bank has a strong retail base in Europe, with Germany as its core market, where it holds a market-leading position. The bank has further reinforced its domestic market position with the acquisition of a stake in Postbank (52% as at March 2010, with the potential of increasing it to near full ownership by 2012). The bank also operates close to 2,900 retail branches across Italy, Spain, Belgium, Portugal, Poland, India and China, of which 1,100 are Postbank branches.
Financial performance
We set out below some of the key financial performance metrics:
Table 248: Key profit & loss figures, €mm
FY 2008 FY 2009 FY 2010Net interest income 12,453 12,459 15,583Prov. for loan losses 1,076 2,630 1,274NII less provisions 11,377 9,829 14,309
Commission & fee inc. 12,449 11,377 13,652Other operating inc. 820 131 165Non-interest expense 20,522 23,095 25,691Operating profit -5,202 4,948 5,990
PBT -5,741 5,202 3,975Taxes -1,845 244 1,645Net profit (loss) -3,835 4,973 2,310
Source: Bloomberg
Table 249: Key balance sheet figures, €mm
FY 2008 FY 2009 FY 2010Real estate loans 52,453 58,673 132,235 Commercial loans 94,857 88,785 141,416 Consumer loans 83,376 85,675 167,350 Other loans 92,986 86,988 102,259 Total Assets 2,202,423 1,500,664 1,905,630Deposits 395,553 344,220 533,984 Other ST borrowings 39,115 42,897 64,990 Short-term borrowings 1,337,537 725,722 859,022 Long-term borrowings 143,585 142,359 181,910 Equity 31,914 37,969 50,392
Source: Bloomberg
Table 250: Select financial metrics
FY 2008 FY 2009 FY 2010NIM 0.6 0.7 1.0ROA -0.2 0.3 0.1ROE -11.3 14.8 5.4ROC -1.1 1.7 0.8C:I 130.1 73.1 75.8Core capital 10.1 12.6 12.3
Source: Bloomberg
Cover pool overview
We set out below some of the key cover pool characteristics:
Table 251: Mortgage covered bond characteristics
As at June 2011
Ratings S/M/FCovered Bond rating AAA/Aaa/AAAIssuer rating A+/Aa3/AA-
Cover poolCover pool size (€) 2,838,500,000Overcollateralisation (in %) 41.9
Fixed rate loans (in %) 88.7 €-denominated loans (in %) 91.3
Property type (in %)Residential 5.4 Multifamily 28.9 Office 28.7 Retail 17.7 Industrial 4.8 Other 14.6
Geographical split (in %)Germany 89.4 UK 7.8 France 1.3 Switzerland 1.2 Other 0.4
Source: Investor report

125
Europe Credit Research12 September 2011
Gareth Davies, CFA(44-20) [email protected]
Flavio Marco Rusconi(44-20) [email protected]
Deutsche Genossenshafts-Hypothekenbank (DG Hyp)
(BBG: DGHYP)Snapshot
DG Hyp was founded in 1921 and is the largest mortgage bank in the cooperative financial system. Its expertise lies in commercial real estate finance, with business originated via three channels: cooperative banking via 1,100 partner banks, directly with domestic investors and developers and through participation in syndicates on international markets.
The bank is affiliated to DZ Bank Group and, outside its German core market, it is represented in the USA, the UK, France and Poland.
Pfandbriefe constitute the main funding channel for the lending operations of DG Hyp, which issues both public sector and mortgage Pfandbriefe.
Financial performance
We set out below some of the key financial performance metrics:
Table 252: Key profit & loss figures, €mm
FY 2008 FY 2009 FY 2010Net interest income 163 164 203Prov. for loan losses 62 125 75NII less provisions 102 39 128
Commission & fee inc. 28 30 36Other operating inc. 9 14 15Non-interest expense 157 142 109Operating profit -129 -261 -92
PBT 0 -127 23Taxes 0 -2 0Net profit (loss) 0 0 0
Source: Bloomberg, Annual report 2010
Table 253: Key balance sheet figures, €mm
FY 2008 FY 2009 FY 2010
Loans 39,090 37,043 35,807Total Assets 76,016 68,075 64,443Deposits 17,000 16,016 15,324Equity 1,847 1,653 1,407
Source: Bloomberg, Annual report 2010
Table 254: Select financial metrics
FY 2008 FY 2009 FY 2010Core capital 7.3 6.9 7.6
Source: Bloomberg, Annual report 2010
Cover pool overview
We set out below some of the key cover pool characteristics:
Table 255: Public-sector covered bond characteristics
As at June 2011
Ratings S/M/FCovered Bond rating AAA/-/-Issuer rating A/-/A+
Cover poolCover pool size (€) 26,717,380,000Over-collateralisation (in %) 11.4
Geographical split (in %)Germany 63.4Spain 14.6Italy 6.2Austria 3.7Portugal 2.4Other 9.7
Borrower type (in %)Central Government 8.8Regional authorities 33.4Local authorities 33.2Other 24.6
Source: Investor report
Table 256: Mortgage covered bond characteristics
As at June 2011
Ratings S/M/FCovered Bond rating AAA/-/-Issuer rating A/-/A+
Cover poolCover pool size (€) 15,721,510,000Over-collateralisation (in %) 14.3
Property type (in %)Residential 50.4 Office 24.3 Retail 12.5 Industrial 0.7 Other 12.1
Geographical split (in %)Germany 83.2 UK 4.6 France 4.3 USA 3.1 Other 4.9
Source: Investor report

126
Europe Credit Research12 September 2011
Gareth Davies, CFA(44-20) [email protected]
Flavio Marco Rusconi(44-20) [email protected]
Deutsche Hypo Hannover (Deutsche Hypothekenbank)
(BBG: DHY)Snapshot
Deutsche Hypo Hannover is a mortgage bank and as such it focuses on all aspects of financing and consultancy associated with real estate. In particular, the bank specialises in large-scale commercial financing with professional real estate customers and the construction of residential buildings for investment purposes in Germany, Europe and the USA.
The bank also offers public-sector lending and capital market transactions with German and foreign clients in western Europe, Japan, Canada and the USA. It has beenpart of Nord/LB since 2008, allowing it to achieve an even stronger position in the field of commercial real estate financing.
Financial performance
We set out below some of the key financial performance metrics:
Table 257: Key profit & loss figures, €mm
FY 2008 FY 2009 FY 2010Net interest income 105 118 173Prov. for loan losses 31 70 79NII less provisions 74 48 94
Commission & fee inc. 6 17 16Other operating inc. 19 3 2Non-interest expense 48 67 82Operating profit -156 -34 37
PBT -156 -34 36Taxes -59 -1 5Net profit (loss) -97 -32 31
Source: Bloomberg
Table 258: Key balance sheet figures, €mm
FY 2008 FY 2009 FY 2010
Loans 16,049 16,621 18,409 Total Assets 37,116 34,050 35,998 Deposits 10,307 10,121 10,041 Short-term borrowings 6,278 5,683 8,296 Long-term borrowings 18,844 17,354 16,397 Equity 373 655 931
Source: Bloomberg
Table 259: Select financial metrics
FY 2008 FY 2009 FY 2010NIM 0.3 0.3 0.5ROA -0.3 -0.1 0.1ROE -22.8 -6.3 3.9ROC -0.4 -0.1 0.1C:I -56.1 64.8 40.8Core capital 7.9 6.8 7.7
Source: Bloomberg
Cover pool overview
We set out below the key cover pool characteristics:
Table 260: Public-sector covered bond characteristics
As at June 2011
Ratings S/M/FCovered Bond rating -/Aaa/-Issuer rating -/A1/-
Cover poolCover pool size (€) 15,545,500,000Overcollateralisation (€) 689,100,000
Borrower type (in %)German Central Government 1.2 German Federal States 28.3 Municipalities, non-profit organizations 6.5 Foreign loans 45.7 Public sector banks 12.9 Public sector companies 2.4 Substitute collateral 2.9
Ratings split (in %)AAA 27.1 AA 58.2 A 14.0 BBB 0.8
Source: Investor report
Table 261: Mortgage covered bond characteristics
As at June 2011
Ratings S/M/FCovered Bond rating -/Aaa/-
Cover poolCover pool size (€) 8,236,900,000Over-collateralisation (€) 961,800,000
Geographical split (in %)Germany 61.7 USA 11.0 Great Britain 9.8 Netherlands 9.7 Other Europe 7.8
Property type (in %)Residential 23.5 Office 30.8 Retail 30.5 Other 15.2
Source: Investor report
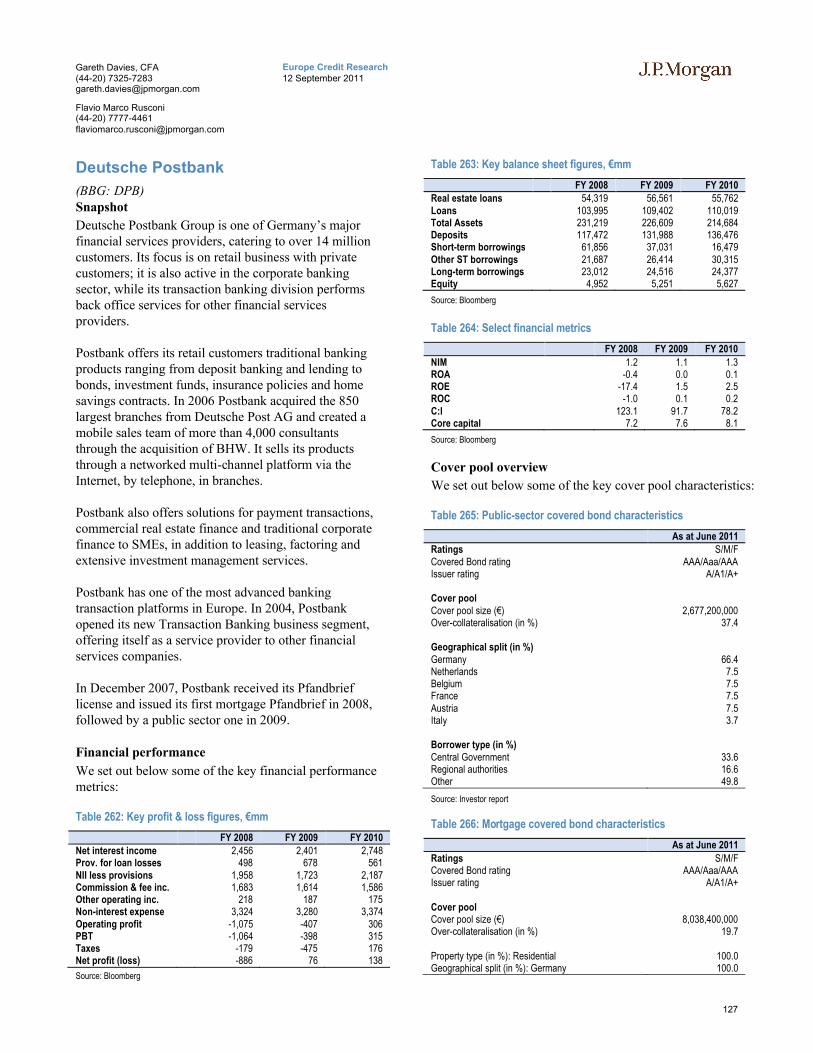
127
Europe Credit Research12 September 2011
Gareth Davies, CFA(44-20) [email protected]
Flavio Marco Rusconi(44-20) [email protected]
Deutsche Postbank
(BBG: DPB)Snapshot
Deutsche Postbank Group is one of Germany’s major financial services providers, catering to over 14 million customers. Its focus is on retail business with private customers; it is also active in the corporate banking sector, while its transaction banking division performs back office services for other financial services providers.
Postbank offers its retail customers traditional banking products ranging from deposit banking and lending to bonds, investment funds, insurance policies and home savings contracts. In 2006 Postbank acquired the 850 largest branches from Deutsche Post AG and created a mobile sales team of more than 4,000 consultants through the acquisition of BHW. It sells its products through a networked multi-channel platform via the Internet, by telephone, in branches.
Postbank also offers solutions for payment transactions, commercial real estate finance and traditional corporate finance to SMEs, in addition to leasing, factoring and extensive investment management services.
Postbank has one of the most advanced banking transaction platforms in Europe. In 2004, Postbank opened its new Transaction Banking business segment, offering itself as a service provider to other financial services companies.
In December 2007, Postbank received its Pfandbrief license and issued its first mortgage Pfandbrief in 2008, followed by a public sector one in 2009.
Financial performance
We set out below some of the key financial performance metrics:
Table 262: Key profit & loss figures, €mm
FY 2008 FY 2009 FY 2010Net interest income 2,456 2,401 2,748Prov. for loan losses 498 678 561NII less provisions 1,958 1,723 2,187Commission & fee inc. 1,683 1,614 1,586Other operating inc. 218 187 175Non-interest expense 3,324 3,280 3,374Operating profit -1,075 -407 306PBT -1,064 -398 315Taxes -179 -475 176Net profit (loss) -886 76 138
Source: Bloomberg
Table 263: Key balance sheet figures, €mm
FY 2008 FY 2009 FY 2010Real estate loans 54,319 56,561 55,762 Loans 103,995 109,402 110,019 Total Assets 231,219 226,609 214,684 Deposits 117,472 131,988 136,476 Short-term borrowings 61,856 37,031 16,479 Other ST borrowings 21,687 26,414 30,315 Long-term borrowings 23,012 24,516 24,377 Equity 4,952 5,251 5,627
Source: Bloomberg
Table 264: Select financial metrics
FY 2008 FY 2009 FY 2010
NIM 1.2 1.1 1.3ROA -0.4 0.0 0.1ROE -17.4 1.5 2.5ROC -1.0 0.1 0.2C:I 123.1 91.7 78.2Core capital 7.2 7.6 8.1
Source: Bloomberg
Cover pool overview
We set out below some of the key cover pool characteristics:
Table 265: Public-sector covered bond characteristics
As at June 2011Ratings S/M/FCovered Bond rating AAA/Aaa/AAAIssuer rating A/A1/A+
Cover poolCover pool size (€) 2,677,200,000Over-collateralisation (in %) 37.4
Geographical split (in %)Germany 66.4 Netherlands 7.5 Belgium 7.5 France 7.5 Austria 7.5 Italy 3.7
Borrower type (in %)Central Government 33.6 Regional authorities 16.6 Other 49.8
Source: Investor report
Table 266: Mortgage covered bond characteristics
As at June 2011
Ratings S/M/FCovered Bond rating AAA/Aaa/AAAIssuer rating A/A1/A+
Cover poolCover pool size (€) 8,038,400,000Over-collateralisation (in %) 19.7
Property type (in %): Residential 100.0Geographical split (in %): Germany 100.0

128
Europe Credit Research12 September 2011
Gareth Davies, CFA(44-20) [email protected]
Flavio Marco Rusconi(44-20) [email protected]
Source: Investor report
Deutsche Schiffsbank
(BBG: DSB)Snapshot
Deutsche Schiffsbank is one of the leading ship finance banks in the world, with joint headquarters in Bremen and Hamburg. Through its long history - the bank was founded in 1918 - it has acquired significant expertise in the sector and currently has an extensive global client base. The shareholders are Commerzbank and Bayerische Hypo- und Vereinsbank, which indirectly hold 92% and 8% respectively.
The bank offers maritime and public finance services in all the main currencies for both new builds and second-hand tonnage. Deutsche Schiffsbank also offers related services, such as construction finance and preliminary equity finance.
Most of the lending takes the form of long-term ship mortgage loans and Pfandbriefe are used to fund these activities. The ship loans are mostly granted in US dollars.
Financial performance
We set out below some of the key financial performance metrics:
Table 267: Key profit & loss figures, €mm
FY 2008 FY 2009 FY 2010
Net interest income 150 175
Commission & fee inc. 11 16Other operating inc. 5 12Non-interest expense 31 29Operating profit 23 6
PBT 22 6Taxes 22 0Net profit (loss) 0.3 0
Source: Annual report 2010
Table 268: Key balance sheet figures, €mm
FY 2008 FY 2009 FY 2010Loans 12,467 12,113 Total Assets 16,311 15,742 Short-term borrowings 3,927 3,123 Equity 7,445 8,040
Source: Annual report 2010
Table 269: Select financial metrics
FY 2008 FY 2009 FY 2010ROE 4.1 0.6C:I 19.4 16.1Core capital 9.2 9.5
Source: Annual report 2010
Cover pool overview
We set out below some of the key cover pool characteristics:
Table 270: Public-sector covered bond characteristics
As at June 2011
Ratings S/M/FCovered Bond rating n/aIssuer rating -/A3/-
Cover poolCover pool size (€) 1,558,500,000Overcollateralisation (€) 127,600,000
Geographical split (in %)Germany 80.4 Italy 5.5 Austria 5.5 Poland 2.6 Other 6.1
Borrower type (in %)Central Government 11.6 Regional authorities 46.0 Other 42.4
Source: Investor report
Table 271: Ship covered bond characteristics
As at June 2011
Ratings S/M/FCovered Bond rating n/aIssuer rating -/A3/-
Cover poolCover pool size (€) 5,392,700,000Overcollateralisation (€) 1,447,100,000
Geographical split (in %)Germany 41.3 Greece 9.1 Marshall Islands 9.0 Malta 6.5 Cyprus 5.4 Liberia 5.3 Hong Kong 4.5 Bahamas 4.2 Other 14.8
Source: Investor report

129
Europe Credit Research12 September 2011
Gareth Davies, CFA(44-20) [email protected]
Flavio Marco Rusconi(44-20) [email protected]
Dexia Kommunalbank Deutschland
(BBG: DEXGRP)Snapshot
Dexia Kommunalbank Deutschland, a 100% subsidiary of the Dexia Group, focuses predominantly on the public finance line of business, both in Germany and abroad. It provides a wide range of products and services in the management of PPP/PFI and project finance as well as export finance, particularly to the infrastructure/transportation, energy and telecommunications sectors.
The German operations form part of Dexia Credit Local and Dexia Kommunalbank’s special role within the Dexia Group is the funding of the group's public finance activities. Eligible assets are generally transferred from the various entities within the Dexia Group into Dexia Kommunalbank and funded via the issuance of AAA-rated Pfandbriefe (S&P).
While maintaining predominantly German assets in its cover pool (currently 66.6%), the bank's objective is to increase its international base of cover assets.
Financial performance
We set out below some of the key financial performance metrics:
Table 272: Key profit & loss figures, €mm
FY 2008 FY 2009 FY 2010Net interest income 45 42NII less provisions 45 42
Commission & fee inc. 2 2Other operating inc. 0 2Non-interest expense 22 19
PBT 1 1Taxes 0 0Net profit (loss) 1 1
Source: Annual report 2010
Table 273: Key balance sheet figures, €mm
FY 2008 FY 2009 FY 2010Loans 20,855 20,893 Total Assets 47,291 48,695 Deposits 7,828 7,289 Short-term borrowings 309 2,686 Long-term borrowings 19,895 19,673 Equity 344 532
Source: Annual report 2010
Table 274: Select financial metrics
FY 2008 FY 2009 FY 2010C:I 43.4 46.4Core capital 12.3 22.8
Source: Annual report 2010
Cover pool overview
We set out below some of the key cover pool characteristics:
Table 275: Public-sector covered bond characteristics
As at June 2011
Ratings S/M/FCovered Bond rating AAA/-/-Issuer rating (Dexia KB) A/A3/A+
Cover poolCover pool size (€) 37,601,740,000Over-collateralisation (€) 3,474,110,000
Geographical split (in %)Germany 66.6 Italy 8.9 Austria 5.4 Spain 4.5 Belgium 5.2 Other 9.4
Borrowers type (in %)Regional Authorities 47.6 Local Authorities 22.9 Central Government 8.4 Other 21.1
Source: Investor report
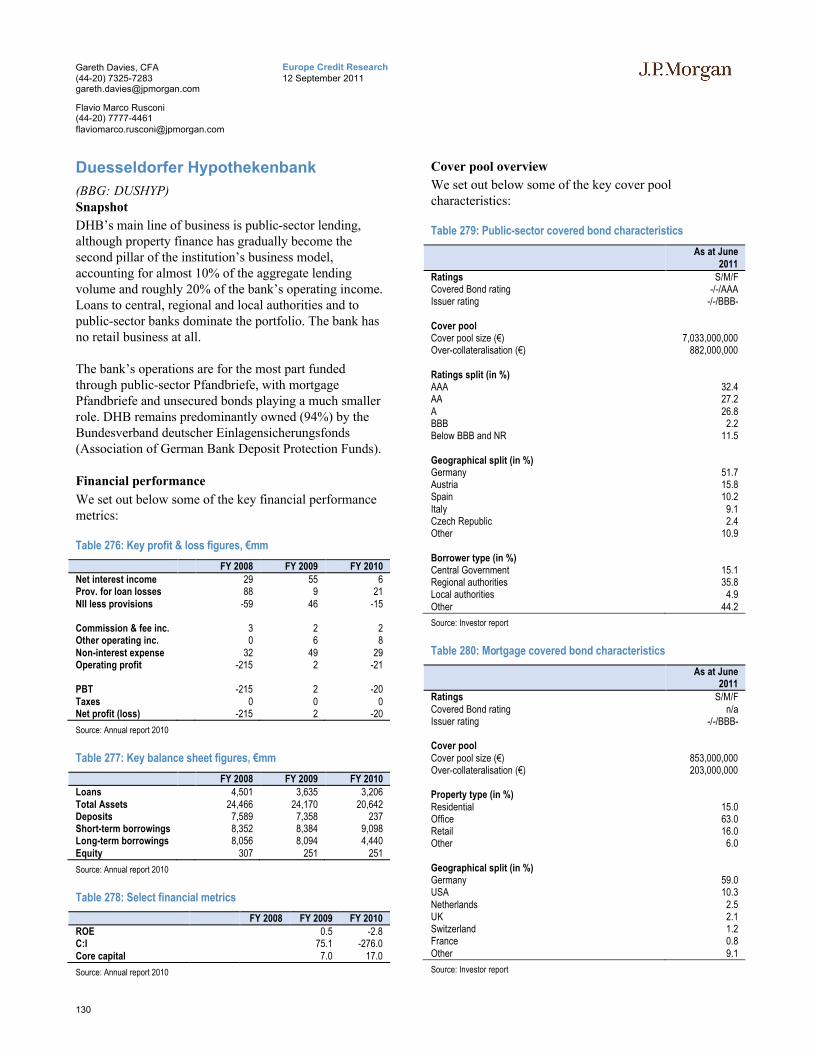
130
Europe Credit Research12 September 2011
Gareth Davies, CFA(44-20) [email protected]
Flavio Marco Rusconi(44-20) [email protected]
Duesseldorfer Hypothekenbank
(BBG: DUSHYP)Snapshot
DHB’s main line of business is public-sector lending, although property finance has gradually become the second pillar of the institution’s business model, accounting for almost 10% of the aggregate lending volume and roughly 20% of the bank’s operating income. Loans to central, regional and local authorities and to public-sector banks dominate the portfolio. The bank has no retail business at all.
The bank’s operations are for the most part funded through public-sector Pfandbriefe, with mortgage Pfandbriefe and unsecured bonds playing a much smaller role. DHB remains predominantly owned (94%) by the Bundesverband deutscher Einlagensicherungsfonds (Association of German Bank Deposit Protection Funds).
Financial performance
We set out below some of the key financial performance metrics:
Table 276: Key profit & loss figures, €mm
FY 2008 FY 2009 FY 2010Net interest income 29 55 6Prov. for loan losses 88 9 21NII less provisions -59 46 -15
Commission & fee inc. 3 2 2Other operating inc. 0 6 8Non-interest expense 32 49 29Operating profit -215 2 -21
PBT -215 2 -20Taxes 0 0 0Net profit (loss) -215 2 -20
Source: Annual report 2010
Table 277: Key balance sheet figures, €mm
FY 2008 FY 2009 FY 2010Loans 4,501 3,635 3,206 Total Assets 24,466 24,170 20,642 Deposits 7,589 7,358 237 Short-term borrowings 8,352 8,384 9,098 Long-term borrowings 8,056 8,094 4,440 Equity 307 251 251
Source: Annual report 2010
Table 278: Select financial metrics
FY 2008 FY 2009 FY 2010ROE 0.5 -2.8C:I 75.1 -276.0Core capital 7.0 17.0
Source: Annual report 2010
Cover pool overview
We set out below some of the key cover pool characteristics:
Table 279: Public-sector covered bond characteristics
As at June 2011
Ratings S/M/FCovered Bond rating -/-/AAAIssuer rating -/-/BBB-
Cover poolCover pool size (€) 7,033,000,000Over-collateralisation (€) 882,000,000
Ratings split (in %)AAA 32.4 AA 27.2 A 26.8 BBB 2.2 Below BBB and NR 11.5
Geographical split (in %)Germany 51.7 Austria 15.8 Spain 10.2 Italy 9.1 Czech Republic 2.4 Other 10.9
Borrower type (in %)Central Government 15.1 Regional authorities 35.8 Local authorities 4.9 Other 44.2
Source: Investor report
Table 280: Mortgage covered bond characteristics
As at June 2011
Ratings S/M/FCovered Bond rating n/aIssuer rating -/-/BBB-
Cover poolCover pool size (€) 853,000,000Over-collateralisation (€) 203,000,000
Property type (in %)Residential 15.0 Office 63.0 Retail 16.0 Other 6.0
Geographical split (in %)Germany 59.0 USA 10.3 Netherlands 2.5 UK 2.1 Switzerland 1.2 France 0.8 Other 9.1
Source: Investor report
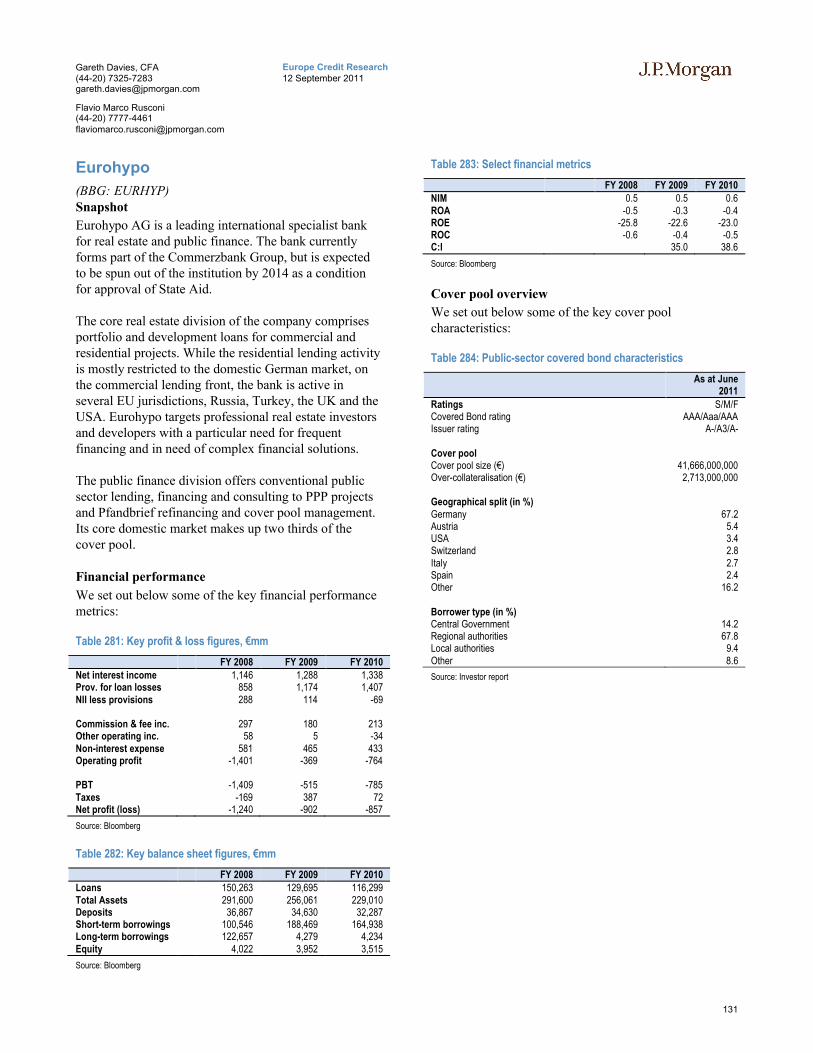
131
Europe Credit Research12 September 2011
Gareth Davies, CFA(44-20) [email protected]
Flavio Marco Rusconi(44-20) [email protected]
Eurohypo
(BBG: EURHYP)Snapshot
Eurohypo AG is a leading international specialist bank for real estate and public finance. The bank currently forms part of the Commerzbank Group, but is expected to be spun out of the institution by 2014 as a condition for approval of State Aid.
The core real estate division of the company comprises portfolio and development loans for commercial and residential projects. While the residential lending activity is mostly restricted to the domestic German market, on the commercial lending front, the bank is active in several EU jurisdictions, Russia, Turkey, the UK and the USA. Eurohypo targets professional real estate investors and developers with a particular need for frequent financing and in need of complex financial solutions.
The public finance division offers conventional public sector lending, financing and consulting to PPP projects and Pfandbrief refinancing and cover pool management. Its core domestic market makes up two thirds of the cover pool.
Financial performance
We set out below some of the key financial performance metrics:
Table 281: Key profit & loss figures, €mm
FY 2008 FY 2009 FY 2010Net interest income 1,146 1,288 1,338Prov. for loan losses 858 1,174 1,407NII less provisions 288 114 -69
Commission & fee inc. 297 180 213Other operating inc. 58 5 -34Non-interest expense 581 465 433Operating profit -1,401 -369 -764
PBT -1,409 -515 -785Taxes -169 387 72Net profit (loss) -1,240 -902 -857
Source: Bloomberg
Table 282: Key balance sheet figures, €mm
FY 2008 FY 2009 FY 2010Loans 150,263 129,695 116,299 Total Assets 291,600 256,061 229,010 Deposits 36,867 34,630 32,287 Short-term borrowings 100,546 188,469 164,938 Long-term borrowings 122,657 4,279 4,234 Equity 4,022 3,952 3,515
Source: Bloomberg
Table 283: Select financial metrics
FY 2008 FY 2009 FY 2010NIM 0.5 0.5 0.6ROA -0.5 -0.3 -0.4ROE -25.8 -22.6 -23.0ROC -0.6 -0.4 -0.5C:I 35.0 38.6
Source: Bloomberg
Cover pool overview
We set out below some of the key cover pool characteristics:
Table 284: Public-sector covered bond characteristics
As at June 2011
Ratings S/M/FCovered Bond rating AAA/Aaa/AAAIssuer rating A-/A3/A-
Cover poolCover pool size (€) 41,666,000,000Over-collateralisation (€) 2,713,000,000
Geographical split (in %)Germany 67.2 Austria 5.4 USA 3.4 Switzerland 2.8 Italy 2.7 Spain 2.4 Other 16.2
Borrower type (in %)Central Government 14.2 Regional authorities 67.8 Local authorities 9.4 Other 8.6
Source: Investor report

132
Europe Credit Research12 September 2011
Gareth Davies, CFA(44-20) [email protected]
Flavio Marco Rusconi(44-20) [email protected]
Table 285: Mortgage covered bond characteristics
As at June 2011
Ratings S/M/FCovered Bond rating AAA/Aaa/AAAIssuer rating A-/A3/A-
Cover poolCover pool size (€) 51,332,000,000Over-collateralisation (€) 9,664,000,000
Property type (in %)Residential 39.1 Office 25.6 Retail 22.3 Industrial 5.2 Other 7.9
Geographical split (in %)Germany 68.1 UK 7.5 Spain 5.5 France 4.1 Portugal 3.4 Italy 2.4 Other 9.1
Source: Investor report

133
Europe Credit Research12 September 2011
Gareth Davies, CFA(44-20) [email protected]
Flavio Marco Rusconi(44-20) [email protected]
HSH Nordbank
(BBG: HSHN)Snapshot
HSH Nordbank is one of the major providers of real estate finance in Germany, but also offers private banking services to high net-worth clients and financing to the regionally dominant industries of shipping, transportation and energy. The institution is the result of the 2003 merger between Hamburgische Landesbank and Landesbank Schleswig-Holstein (LB Kiel). Ownership is currently (at least until 2013) centred around the City State of Hamburg and the State of Schleswig-Holstein, which own a combined 85.5% of the institution.
Internationally, its focus is on transportation and real estate finance and it is a major player in the sectors of infrastructure, aviation, renewable energy and shipping, where it is the largest lender in the world.
In private banking, the bank focuses on wealthy private clients and foundations. The savings banks division offers integrated solutions for business conducted by savings banks as well as debt and liquidity management for public-sector clients.
Financial performance
We set out below some of the key financial performance metrics:
Table 286: Key profit & loss figures, €mm
FY 2008 FY 2009 FY 2010Net interest income 2,051 2,121 1,502Prov. for loan losses 1,888 2,794 129NII less provisions 163 -673 1,373
Commission & fee inc. 398 303 302Other operating inc. -44 -22 -139Non-interest expense 1,149 870 874Operating profit -2,796 -548 311
PBT -2,617 -1,325 17Taxes 227 -423 -31Net profit (loss) -2,809 -734 -3
Source: Bloomberg
Table 287: Key balance sheet figures, €mm
FY 2008 FY 2009 FY 2010Loans 115,269 105,839 98,235 Total Assets 208,370 174,484 150,930 Deposits 52,469 49,803 50,446 Short-term borrowings 61,498 100,596 79,645 Other ST borrowings 24,440 22,533 16,464 Equity 2,005 4,442 5,094
Source: Bloomberg
Table 288: Select financial metrics
FY 2008 FY 2009 FY 2010NIM 1.0 1.1 0.9ROA -1.4 -0.4 -0.0ROE -90.0 -23.0 -0.1ROC -2.1 -0.6 0.1C:I 903.5 25.7 64.2Core capital 5.1 9.5 15.4
Source: Bloomberg
Cover pool overview
We set out below some of the key cover pool characteristics:
Table 289: Public-sector covered bond characteristics
As at June 2011
Ratings S/M/FCovered Bond rating -/Aaa/-Issuer rating -/A3/A-
Cover poolCover pool size (€) 7,374,500,000Over-collateralisation (in %) 21.1
Geographical split (in %)Germany 76.6 Austria 8.3 Other 15.1
Borrower type (in %)Central Government 17.2 Regional authorities 62.6 Local authorities 8.4 Other 11.8
Source: Investor report
Table 290: Ship covered bond characteristics
As at June 2011
Ratings S/M/FCovered Bond rating -/A2/-Issuer rating -/A3/A-
Cover poolCover pool size (€) 3,432,700,000Over-collateralisation (in %) 38.7
Geographical split (in %)Germany 72.2 Liberia 6.6 Marshall Islands 5.9 Other 15.3
Source: Investor report
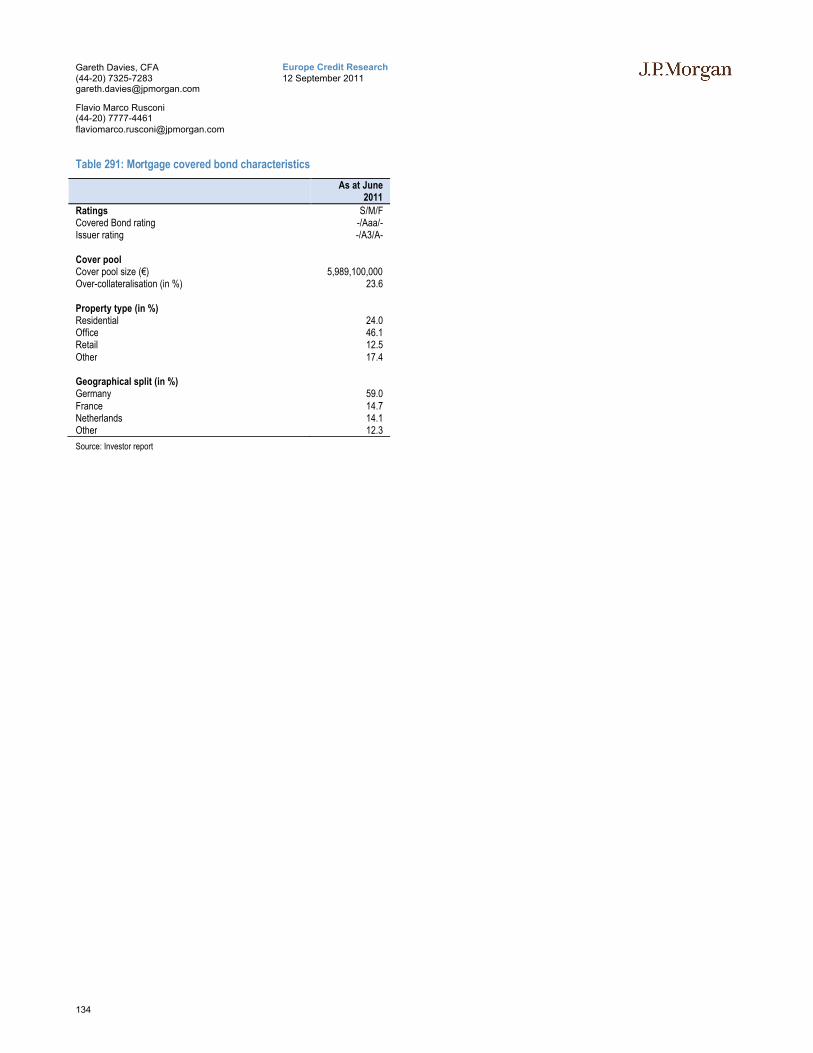
134
Europe Credit Research12 September 2011
Gareth Davies, CFA(44-20) [email protected]
Flavio Marco Rusconi(44-20) [email protected]
Table 291: Mortgage covered bond characteristics
As at June 2011
Ratings S/M/FCovered Bond rating -/Aaa/-Issuer rating -/A3/A-
Cover poolCover pool size (€) 5,989,100,000Over-collateralisation (in %) 23.6
Property type (in %)Residential 24.0 Office 46.1 Retail 12.5 Other 17.4
Geographical split (in %)Germany 59.0 France 14.7 Netherlands 14.1 Other 12.3
Source: Investor report

135
Europe Credit Research12 September 2011
Gareth Davies, CFA(44-20) [email protected]
Flavio Marco Rusconi(44-20) [email protected]
ING DiBa
(BBG: INGDIB)Snapshot
ING DiBa, fully owned by the Dutch ING Groep, is the biggest direct bank in Germany, with over 7mm customers. The core businesses are savings accounts, mortgages, securities, consumer loans and current accounts for private clients.
The bank issued its first mortgage Pfandbrief in June 2011.
Financial performance
We set out below some of the key financial performance metrics:
Table 292: Key profit & loss figures, €mm
FY 2008 FY 2009 FY 2010
Operating profit -657 -566
PBT 280 494Taxes 78 149Net profit (loss) 202 345
Source: Bloomberg
Table 293: Key balance sheet figures, €mm
FY 2008 FY 2009 FY 2010Total Assets 87,753 96,333Short-term borrowings 4,459 5,670Equity 4,499 4,831
Source: Bloomberg
Table 294: Select financial metrics
FY 2008 FY 2009 FY 2010ROE 7.4ROC 15.0
Source: Bloomberg
Cover pool overview
We set out below some of the key cover pool characteristics:
Table 295: Mortgage covered bond characteristics
As at June 2011
Ratings S/M/FCovered Bond rating -/Aaa/-Issuer rating -/Aa3/-
Cover poolCover pool size (€) 837,440,000Over-collateralisation (€) 337,440,000
Property type (in %)Single family 70.5Multifamily 5.6Flats 23.9
Source: Investor report

136
Europe Credit Research12 September 2011
Gareth Davies, CFA(44-20) [email protected]
Flavio Marco Rusconi(44-20) [email protected]
Landesbank Baden Württemberg (LBBW)
(BBG: LBBW)Snapshot
LBBW is a regionally-linked universal bank and together with its regional retail banks (Baden-Württembergische Bank, Rheinland-Pfalz Bank, and Sachsen Bank), it offers a wide spectrum of financial products throughout Germany. BW-Bank acts as a savings bank for LBBW in the area of Stuttgart, the state capital of Baden-Württemberg.
The bank was formed in 1999 after the merger of the three regional banks and is now one of Germany’s largest banks: LBBW is the largest bank in the southwest of Germany, ranking among the five largest German banks and among the 50 largest credit institutions worldwide. The largest three shareholders remain the local savings banks (40.5%) along with the State of Baden-Württemberg (19.6%) and the City of Stuttgart (18.9%).
Through its international network, LBBW is able to offer banking services to local corporate clients willing to access the global markets.
Financial performance
We set out below some of the key financial performance metrics:
Table 296: Key profit & loss figures, €mm
FY 2008 FY 2009 FY 2010Net interest income 2,294 2,778 2,163Prov. for loan losses 883 1,527 471NII less provisions 1,411 1,251 1,692
Commission & fee inc. 730 964 828Other operating inc. 717 386 127Non-interest expense 2,576 2,900 1,963Operating profit -2,566 -203 113
PBT -2,662 -1,214 -318Taxes -550 268 30Net profit (loss) -2,088 -1,483 -348
Source: Bloomberg
Table 297: Key balance sheet figures, €mm
FY 2008 FY 2009 FY 2010Loans 147,329 145,729 128,592 Total Assets 447,738 411,694 374,413 Deposits 103,232 105,212 87,931 Short-term borrowings 130,215 109,352 79,328 Long-term borrowings 159,598 141,280 102,637 Equity 6,060 10,506 9,960
Source: Bloomberg
Table 298: Select financial metrics
FY 2008 FY 2009 FY 2010NIM 0.5 0.7 0.6ROA -0.5 -0.3 -0.1ROE -25.5 -17.9 -3.4ROC -0.7 -0.5 -0.2C:I 336.4 66.2 75.1Core capital 6.9 9.8 11.4
Source: Bloomberg
Cover pool overview
We set out below some of the key cover pool characteristics:
Table 299: Public-sector covered bond characteristics
As at June 2011
Ratings S/M/FCovered Bond rating -/Aaa/AAAIssuer rating -/Aa2/A+
Cover poolCover pool size (€) 58,811,000,000Over-collateralisation (€) 13,166,000,000
Geographical split (in %)Germany 96.0 Other 4.0
Borrower type (in %)Central Government 4.6 Regional authorities 18.0 Local authorities 10.8 Other 66.6
Source: Investor report
Table 300: Mortgage covered bond characteristics
As at June 2011
Ratings S/M/FCovered Bond rating -/Aaa/-Issuer rating -/Aa2/A+
Cover poolCover pool size (€) 10,004,000,000Over-collateralisation (€) 5,320,000,000
Property type (in %)Residential 53.4 Office 12.8 Retail 8.6 Industrial 0.9 Other Commercial 24.4
Geographical split (in %)Germany 96.7 USA 1.6 Other 1.7
Source: Investor report

137
Europe Credit Research12 September 2011
Gareth Davies, CFA(44-20) [email protected]
Flavio Marco Rusconi(44-20) [email protected]
Landesbank Berlin
(BBG: LBBER)Snapshot
Landesbank Berlin Girozentrale was founded as a bank subject to public law on 1 October 1990. At the same time, the city's savings banks that had been separated into east and west were transferred to Landesbank Berlin and since then have formed the joint Berliner Sparkasse. As at 1 January 2006, Landesbank was transformed into a stock corporation in accordance with the Berlin Savings Bank Act of summer 2005. At the same time, the State of Berlin made Landesbank Berlin AG the parent company of the public-law Berliner Sparkasse. Berliner Sparkasse is now operated as a branch of Landesbank Berlin AG.
LBBER operates along four business segments. Retail banking leverages off the extensive sales network of Berliner Sparkasse to offer traditional banking products, investment and pension products and more complex asset management services. In Regional Corporate banking LBBER has a leading position as a partner to SMEs and corporates in its regional catchment area. The Real Estate Financing division caters mainly to institutional and professional real estate investors in Germany and selected European jurisdictions. Finally, the Capital Markets business provides market access to institutional and private investors.
Financial performance
We set out below some of the key financial performance metrics:
Table 301: Key profit & loss figures, €mm
FY 2008 FY 2009 FY 2010Net interest income 1,248 861 714Prov. for loan losses 63 185 105NII less provisions 1,185 676 609
Commission & fee inc. 439 395 421Other operating inc. 222 91 160Non-interest expense 1,077 1,118 1,150Operating profit 99 410 374
PBT 9 339 317Taxes -35 67 52Net profit (loss) 32 257 267
Source: Bloomberg
Table 302: Key balance sheet figures, €mm
FY 2008 FY 2009 FY 2010Real estate loans 16,908 17,629 18,486 Loans 46,217 47,476 45,410 Total Assets 145,388 143,835 131,477 Deposits 32,720 35,129 36,092 Short-term borrowings 52,381 49,873 39,014 Other ST borrowings 31,760 33,408 32,865 Long-term borrowings 26,532 22,698 20,769 Equity 1,962 2,712 2,722
Source: Bloomberg
Table 303: Select financial metrics
FY 2008 FY 2009 FY 2010
NIM 0.9 0.6 0.5ROA 0.0 0.2 0.2ROE 1.5 11.5 10.1ROC 0.1 0.3 0.4C:I 85.3 62.3 67.7Core capital 11.0 8.5 15.2
Source: Bloomberg
Cover pool overview
We set out below some of the key cover pool characteristics:
Table 304: Public-sector covered bond characteristics
As at June 2011
Ratings S/M/FCovered Bond rating -/Aaa/AAAIssuer rating -/A1/AA-
Cover poolCover pool size (€) 4,368,621,227Over-collateralisation (€) 2,667,172,709
Geographical split (in %)Germany 98.2
Borrower type (in %)Central Government 7.4 Regional authorities 51.9 Local authorities 2.5 Other 38.2
Source: Investor report

138
Europe Credit Research12 September 2011
Gareth Davies, CFA(44-20) [email protected]
Flavio Marco Rusconi(44-20) [email protected]
Table 305: Mortgage covered bond characteristics
As at June 2011
Ratings S/M/FCovered Bond rating -/Aaa/-Issuer rating S/M/F -/A1/AA-
Cover poolCover pool size (€) 3,269,554,082Over-collateralisation (€) 495,002,358
Geographical split (in %)Germany 89.8 France 9.8 Poland 0.4
Property type (in %)Residential 39.4 Office 32.5 Retail 12.4 Industrial 7.3 Other 8.4
Source: Investor report

139
Europe Credit Research12 September 2011
Gareth Davies, CFA(44-20) [email protected]
Flavio Marco Rusconi(44-20) [email protected]
Landesbank Hessen-Thueringen
(BBG: HESLAN)Snapshot
The Helaba Group is one of Germany’s leading Landesbanken, with a strong domestic and international foothold. The bank is owned by the savings banks (85%) and the states of Hesse (10%) and Thuringia (5%).
The bank is focused on three areas: the Multinational Corporate Business division offers financial services to corporations, banks and institutional investors. The Private Customers & SME Business unit provides the Sparkassen in Hesse and Thueringen with financial products and services; through the Frankfurter Sparkasse, Helaba is region’s market leader in retail banking. Finally, its Public Development & Infrastructure business finances development programmes in the states of Hesse and Thueringen.
Pfandbriefe play an important funding role for both the retail and public sector lending business.
Financial performance
We set out below some of the key financial performance metrics:
Table 306: Key profit & loss figures, €mm
FY 2008 FY 2009 FY 2010Net interest income 1,047 1,029 1,017Prov. for loan losses 66 487 285NII less provisions 981 542 732
Commission & fee inc. 339 349 404Other operating inc. 373 234 357Non-interest expense 1,197 1,171 1,223Operating profit -72 323 388
PBT -54 343 398Taxes -11 80 100Net profit (loss) -45 324 299
Source: Bloomberg
Table 307: Key balance sheet figures, €mm
FY 2008 FY 2009 FY 2010Loans 89,917 86,280 86,445 Total Assets 184,572 169,901 166,244 Deposits 41,884 41,891 40,896 Short-term borrowings 33,965 33,214 Long-term borrowings 45,130 43,030 76,556 Equity 4,675 4,898 5,203
Source: Bloomberg
Table 308: Select financial metrics
FY 2008 FY 2009 FY 2010NIM 0.6 0.6 0.6ROA -0.0 0.2 0.2ROE -0.9 6.8 5.9ROC -0.1 0.4 0.4C:I 100.6 56.4 61.3Core capital 8.3 8.8 9.6
Source: Bloomberg
Cover pool overview
We set out below some of the key cover pool characteristics:
Table 309: Public-sector covered bond characteristics
As at June 2011
Ratings S/M/FCovered Bond rating AAA/Aaa/AAAIssuer rating A/Aa2/A+
Cover poolCover pool size (€) 20,911,500,000Over-collateralisation (€) 6,040,900,000
Borrower type (in %)Central Government 3.6 Regional authorities 18.0 Local authorities 39.1 Other 39.2
Geographical split (in %)Germany 92.6 Spain 6.6 Other 0.8
Source: Investor report
Table 310: Mortgage covered bond characteristics
As at June 2011
Ratings S/M/FCovered Bond rating -/-/AAAIssuer rating A/Aa2/A+
Cover poolCover pool size (€) 8,823,600,000Over-collateralisation (€) 2,806,500,000
Geographical split (in %)Germany 95.2 Netherlands 1.7 Other 3.1
Property type (in %)Residential 20.7 Office 47.6 Retail 25.3 Industrial 2.1 Other 4.3
Source: Investor report

140
Europe Credit Research12 September 2011
Gareth Davies, CFA(44-20) [email protected]
Flavio Marco Rusconi(44-20) [email protected]
Landesbank Saar
(BBG: SAARLB)Snapshot
Landesbank Saar (SaarLB) is the largest financial institution in the Saarland region and has positioned itself as the leading Franco-German SME bank. The Bank’s core markets are the German state of Saarland and the neighbouring regions of France, particularly the country’s northeast.
SaarLB’s activities are geared toward small and medium-sized enterprises, high net worth individuals and customers seeking commercial real estate financing. SaarLB also provides financing for mainly regional public-sector budgets and for renewable energy projects.As the central bank to the Saarland savings banks, SaarLB conducts syndicate business with the regional savings banks. It is also a regional centre of competence in corporate finance, securities transactions and international commercial business.
Owners include BayernLB (49.9%), Saarland (35.2%) and the Sparkassenverband Saar (14.9%).
Financial performance
We set out below some of the key financial performance metrics:
Table 311: Key profit & loss figures, €mm
FY 2008 FY 2009 FY 2010Net interest income 116 121 109Prov. for loan losses 47 73 22NII less provisions 70 49 87
Commission & fee inc. 43 25 29Non-interest expense 104 88 91Operating profit -71 17 29
PBT -89 14 31Taxes -9 4 10Net profit (loss) -80 10 22
Source: Bloomberg
Table 312: Key balance sheet figures, €mm
FY 2008 FY 2009 FY 2010Real estate loans 2,787 2,934 2,986 Loans 7,360 6,995 7,392 Total Assets 20,608 18,668 19,049 Deposits 4,684 4,806 5,136 Short-term borrowings 6,787 4,989 5,276 Other ST borrowings 475 522 468 Long-term borrowings 8,290 7,874 7,579 Equity 290 371 449
Source: Bloomberg
Table 313: Select financial metrics
FY 2008 FY 2009 FY 2010NIM 0.6 0.6 0.6ROA -0.4 0.0 0.1ROE -23.1 3.0 5.3ROC -0.5 0.1 0.2C:I 149.4 43.4 58.2Core capital 8.4 11.7 10.0
Source: Bloomberg
Cover pool overview
We set out below some of the key cover pool characteristics:
Table 314: Public-sector covered bond characteristics
As at June 2011
Ratings S/M/FCovered Bond rating n/aIssuer rating -/A1/A
Cover poolCover pool size (€) 2,479,000,000Over-collateralisation (in %) 66.5
Borrower type (in %)Regional authorities 15.7 Local authorities 16.4 Other 67.8
Source: Investor report
Table 315: Mortgage covered bond characteristics
As at June 2011
Ratings S/M/FCovered Bond rating n/aIssuer rating -/A1/A
Cover poolCover pool size (€) 360,000,000Over-collateralisation (in %) 59.3
Geographical split (in %)Germany 46.9 France 53.1
Property type (in %)Residential 9.7 Office 38.6 Retail 26.4 Industrial 0.8 Other 24.4
Source: Investor report

141
Europe Credit Research12 September 2011
Gareth Davies, CFA(44-20) [email protected]
Flavio Marco Rusconi(44-20) [email protected]
Muenchener Hypothekenbank
(BBG: MUNHYP)Snapshot
Münchener Hypothekenbank is active in the public sector lending business as well as in mortgage lending. As an independent mortgage bank – no other large bank holds a majority share in MünchenerHyp – the bank’s owners primarily consist of cooperative banks, cooperative central banks and individual members/shareholders, often customers of the bank itself.The bank operates along two main business lines: the Private customer unit conducts its business through the Volksbanken, the Raiffeisenbanken and the regional offices of the bank.
The Commercial lending division is centrally managed from the Munich office and has offices in other main German cities; internationally, it operates through a network of partners based in London, Madrid, New York, Paris and Vienna.
Financial performance
We set out below some of the key financial performance metrics:
Table 316: Key profit & loss figures, €mm
FY 2008 FY 2009 FY 2010Net interest income 117 124Prov. for loan losses 24 18NII less provisions 92 107
Commission & fee inc. 9 10Other operating inc. 3 2Non-interest expense 100 100Operating profit 13 17
PBT 13 17Taxes 2 5Net profit (loss) 11 11
Source: Bloomberg
Table 317: Key balance sheet figures, €mm
FY 2008 FY 2009 FY 2010Loans 22,678 24,493Total Assets 35,733 35,196Deposits 9,282 9,341Short-term borrowings 25,377 24,753Other ST borrowings 99 99Long-term borrowings 178 187Equity 772 789
Source: Bloomberg
Table 318: Select financial metrics
FY 2008 FY 2009 FY 2010C:I 62.5 64Core capital 6.5 6.4
Source: Bloomberg
Cover pool overview
We set out below some of the key cover pool characteristics:
Table 319: Public-sector covered bond characteristics
As at June 2011
Ratings S/M/FCovered Bond rating -/Aaa/-Issuer rating -/A1/-
Cover poolCover pool size (€) 10,149,365,000Overcollateralisation (€) 1,349,287,000
Geographical split (in %)Germany 80.5Austria 4.5Belgium 2.3Switzerland 2.1Other 10.6
Borrower type (in %)Central Government 10.4Regional authorities 51.8Local authorities 13.2Other 24.6
Source: Investor report
Table 320: Mortgage covered bond characteristics
As at June 2011
Ratings S/M/FCovered Bond rating -/Aaa/-Issuer rating -/A1/-
Cover poolCover pool size (€) 17,440,875,000Overcollateralisation (€) 1,927,940,000
Geographical split (in %)Germany 72.8 Switzerland 13.8 USA 9.4 Other 4.0
Property type (in %)Residential 76.2 Office 14.8 Retail 4.7 Industrial 0.4 Other 3.9
Source: Investor report

142
Europe Credit Research12 September 2011
Gareth Davies, CFA(44-20) [email protected]
Flavio Marco Rusconi(44-20) [email protected]
Norddeutsche Landesbank
(BBG: NDB)Snapshot
NORD/LB is the leading universal bank in North Germany, where it is the Landesbank for the federal states Lower Saxony and Saxony Anhalt. It also acts as the central bank for 62 savings banks in Lower Saxony, Saxony-Anhalt and Mecklenburg-Western Pomerania.
As a commercial bank, NordLB offers financial services to private, corporate and institutional clients. The bank is also involved in ship and aircraft financing and in international infrastructure, energy and real estate projects.
As a central bank for the local savings bank, NordLB provides a variety of services to the local savings banks but also to individual ones beyond the three home states.
As part of its development business, the bank also offers consulting services to individual state governments.
Financial performance
We set out below some of the key financial performance metrics:
Table 321: Key profit & loss figures, €mm
FY 2008 FY 2009 FY 2010Net interest income 1,500 1,366 1,650Prov. for loan losses 266 1,042 657NII less provisions 1,234 324 993
Commission & fee inc. 284 277 351Other operating inc. 909 936 883Non-interest expense 1,815 1,878 2,046Operating profit 16 108 364
PBT 22 -92 236Taxes -129 49 0Net profit (loss) 150 -152 218
Source: Bloomberg
Table 322: Key balance sheet figures, €mm
FY 2008 FY 2009 FY 2010Loans 110,968 110,294 111,587 Total Assets 244,265 238,688 228,586 Deposits 61,998 61,306 60,742 Short-term borrowings 69,862 62,152 60,962 Long-term borrowings 99,664 101,257 94,221 Equity 5,631 5,842 5,890
Source: Bloomberg
Table 323: Select financial metrics
FY 2008 FY 2009 FY 2010NIM 0.7 0.6 0.7ROA 0.1 -0.1 0.1ROE 2.6 -2.7 3.8ROC 0.1 -0.1 0.1C:I 85.9 60.7 65.1Core capital 8.1 8.7 9.2
Source: Bloomberg
Cover pool overview
We set out below some of the key cover pool characteristics:
Table 324: Public-sector covered bond characteristics
As at June 2011
Ratings S/M/FCovered Bond rating -/Aaa/AAAIssuer rating -/Aa2/A
Cover poolCover pool size (€) 25,745,000,000Overcollateralisation (in %) 22.6
Geographical split (in %)Germany 96.3 Italy 1.2 Other 2.5
Borrower type (in %)Central Government 4.0 Regional authorities 24.0 Local authorities 18.7 Other 53.3
Source: Investor report
Table 325: Mortgage covered bond characteristics
As at June 2011
Ratings S/M/FCovered Bond rating -/Aaa/-Issuer rating -/Aa2/A
Cover poolCover pool size (€) 2,269,000,000Overcollateralisation (in %) 189.0
Geographical split (in %)Germany 87.0 Luxembourg 5.3 Netherlands 1.8 Other 5.9
Property type (in %)Residential 46.3 Office 26.2 Other 27.5
Source: Investor report

143
Europe Credit Research12 September 2011
Gareth Davies, CFA(44-20) [email protected]
Flavio Marco Rusconi(44-20) [email protected]
Table 326: Ship covered bond characteristics
As at June 2011
Ratings S/M/FCovered Bond rating n/aIssuer rating A-/Aa2/A
Cover poolCover pool size (€) 601,000,000Over-collateralisation (in %) 446.4
Geographical split (in %)Germany 77.4 Cyprus 22.6
Source: Investor report
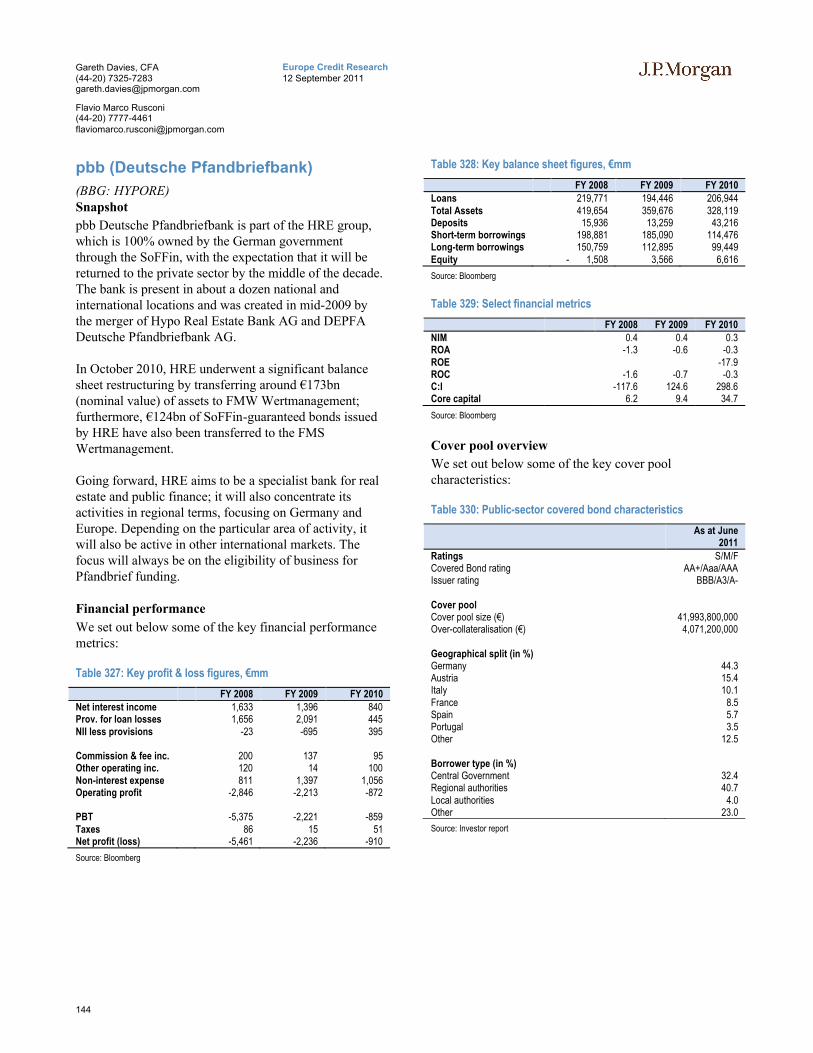
144
Europe Credit Research12 September 2011
Gareth Davies, CFA(44-20) [email protected]
Flavio Marco Rusconi(44-20) [email protected]
pbb (Deutsche Pfandbriefbank)
(BBG: HYPORE)Snapshot
pbb Deutsche Pfandbriefbank is part of the HRE group, which is 100% owned by the German government through the SoFFin, with the expectation that it will be returned to the private sector by the middle of the decade. The bank is present in about a dozen national and international locations and was created in mid-2009 by the merger of Hypo Real Estate Bank AG and DEPFA Deutsche Pfandbriefbank AG.
In October 2010, HRE underwent a significant balance sheet restructuring by transferring around €173bn (nominal value) of assets to FMW Wertmanagement; furthermore, €124bn of SoFFin-guaranteed bonds issued by HRE have also been transferred to the FMS Wertmanagement.
Going forward, HRE aims to be a specialist bank for real estate and public finance; it will also concentrate its activities in regional terms, focusing on Germany and Europe. Depending on the particular area of activity, it will also be active in other international markets. The focus will always be on the eligibility of business for Pfandbrief funding.
Financial performance
We set out below some of the key financial performance metrics:
Table 327: Key profit & loss figures, €mm
FY 2008 FY 2009 FY 2010Net interest income 1,633 1,396 840Prov. for loan losses 1,656 2,091 445NII less provisions -23 -695 395
Commission & fee inc. 200 137 95Other operating inc. 120 14 100Non-interest expense 811 1,397 1,056Operating profit -2,846 -2,213 -872
PBT -5,375 -2,221 -859Taxes 86 15 51Net profit (loss) -5,461 -2,236 -910
Source: Bloomberg
Table 328: Key balance sheet figures, €mm
FY 2008 FY 2009 FY 2010Loans 219,771 194,446 206,944 Total Assets 419,654 359,676 328,119 Deposits 15,936 13,259 43,216 Short-term borrowings 198,881 185,090 114,476 Long-term borrowings 150,759 112,895 99,449 Equity - 1,508 3,566 6,616
Source: Bloomberg
Table 329: Select financial metrics
FY 2008 FY 2009 FY 2010NIM 0.4 0.4 0.3ROA -1.3 -0.6 -0.3ROE -17.9ROC -1.6 -0.7 -0.3C:I -117.6 124.6 298.6Core capital 6.2 9.4 34.7
Source: Bloomberg
Cover pool overview
We set out below some of the key cover pool characteristics:
Table 330: Public-sector covered bond characteristics
As at June 2011
Ratings S/M/FCovered Bond rating AA+/Aaa/AAAIssuer rating BBB/A3/A-
Cover poolCover pool size (€) 41,993,800,000Over-collateralisation (€) 4,071,200,000
Geographical split (in %)Germany 44.3 Austria 15.4 Italy 10.1 France 8.5 Spain 5.7 Portugal 3.5 Other 12.5
Borrower type (in %)Central Government 32.4 Regional authorities 40.7 Local authorities 4.0 Other 23.0
Source: Investor report
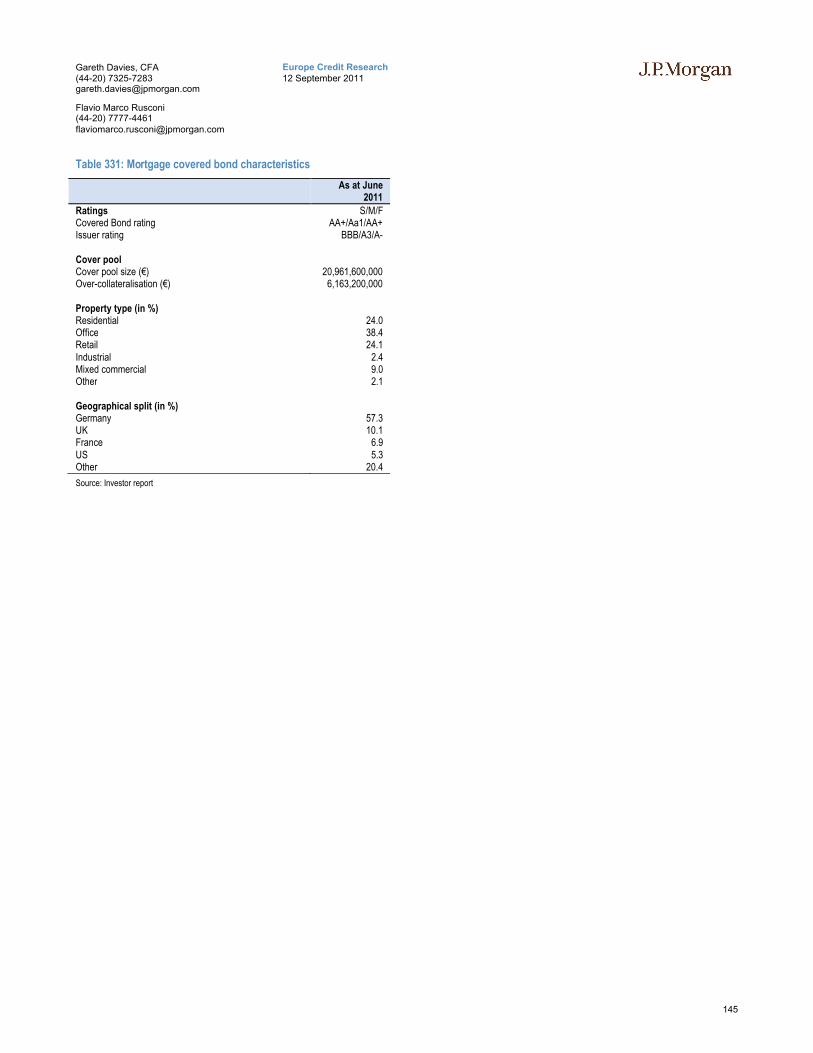
145
Europe Credit Research12 September 2011
Gareth Davies, CFA(44-20) [email protected]
Flavio Marco Rusconi(44-20) [email protected]
Table 331: Mortgage covered bond characteristics
As at June 2011
Ratings S/M/FCovered Bond rating AA+/Aa1/AA+Issuer rating BBB/A3/A-
Cover poolCover pool size (€) 20,961,600,000Over-collateralisation (€) 6,163,200,000
Property type (in %)Residential 24.0 Office 38.4 Retail 24.1 Industrial 2.4 Mixed commercial 9.0 Other 2.1
Geographical split (in %)Germany 57.3 UK 10.1 France 6.9 US 5.3 Other 20.4
Source: Investor report

146
Europe Credit Research12 September 2011
Gareth Davies, CFA(44-20) [email protected]
Flavio Marco Rusconi(44-20) [email protected]
SEB AG
(BBG: SEBAG)Snapshot
SEB AG became the German subsidiary of the Swedish bank SEB in 2000. The core businesses are banking and financial and insurance services for companies, institutions and real estate clients, as well as for retail customers.
In 2005 it was the first German commercial bank to be granted license to issue Pfandbriefe by BaFin. In 2010 Santander, the Spanish banking group, acquired the retail network from SEB, which counted 174 branches and catered to around 1mm customers. The existing covered bonds however remained an obligation of SEB AG, which will retain its merchant banking and wealth management operations.
Financial performance
We set out below some of the key financial performance metrics:
Table 332: Key profit & loss figures, €mm
FY 2008 FY 2009 FY 2010Net interest income 388 360 252NII less provisions 388 360 237
Commission & fee inc. 311 257 133Other operating inc. 26 9 8Non-interest expense 502 504 252Operating profit 211 89 71
PBT 171 -16 62Taxes 64 -1 23Net profit (loss) 108 -89 -80
Source: Annual report 2010
Table 333: Key balance sheet figures, €mm
FY 2008 FY 2009 FY 2010Consumer loans 29,306 26,393 17,514 Loans 29,306 26,393 17,514 Total Assets 60,137 52,743 49,090 Deposits 26,236 22,057 16,707 Short-term borrowings 16,153 16,837 16,396 Other ST borrowings 682 929 617 Long-term borrowings 14,623 10,536 7,281 Equity 2,444 2,385 2,199
Source: Annual report 2010
Table 334: Select financial metrics
FY 2008 FY 2009 FY 2010C:I 66.0 82.6 107.0Core capital 8.6
Source: Annual report 2010
Cover pool overview
We set out below some of the key cover pool characteristics:
Table 335: Public-sector covered bond characteristics
As at June 2011
Ratings S/M/FCovered Bond rating -/Aa1/-Issuer rating A-/Baa1/-
Cover poolCover pool size (€) 5,903,200,000Over-collateralisation (€) 640,500,000
Geographical split (in %)Germany 91.4 Austria 4.4 Other 4.2
Borrower type (in %)Central Government 0.7 Regional authorities 40.7 Local authorities 1.7 Other 57.0
Source: Investor report
Table 336: Mortgage covered bond characteristics
As at June 2011
Ratings S/M/FCovered Bond rating -/Aa1/-Issuer rating A-/Baa1/-
Cover poolCover pool size (€) 4,550,000,000Over-collateralisation (€) 1,039,900,000
Geographical split (in %)Germany 85.9 Sweden 6.2 Other 7.9
Property type (in %)Residential 43.8 Office 25.7 Retail 25.7 Other 4.8
Source: Investor report

147
Europe Credit Research12 September 2011
Gareth Davies, CFA(44-20) [email protected]
Flavio Marco Rusconi(44-20) [email protected]
Unicredit Bank AG (HypoVereinsbank)
(BBG: HVB)Snapshot
HypoVereinsbank (HVB) is a member of UniCredit Group, which occupies the leading position in the economic area comprising Italy, Germany, Austria, and central and eastern Europe, with over 10,000 branches in 22 countries.
HVB operates predominantly in Germany, where it offers retail and corporate banking services, as well as real estate financing, private banking and corporate and investment banking services.
Financial performance
We set out below some of the key financial performance metrics:
Table 337: Key profit & loss figures, €mm
FY 2008 FY 2009 FY 2010
Net interest income 4,261 4,521 4,248Prov. for loan losses 760 1,601 632NII less provisions 3,501 2,920 3,616
Commission & fee inc. 2,535 2,160 1,312Other operating inc. 147 399 239Non-interest expense 4,577 4,693 3,433Operating profit -561 1,580 2,361
PBT -595 1,266 1,882Taxes 54 382 154Net profit (loss) -671 819 1,703
Source: Bloomberg
Table 338: Key balance sheet figures, €mm
FY 2008 FY 2009 FY 2010
Real estate loans 62,723 56,012 50,062 Loans 175,518 145,919 139,351 Total Assets 458,602 363,420 371,909 Deposits 114,962 96,490 108,494 Short-term borrowings 83,867 50,704 51,887 Other ST borrowings 171,716 130,127 136,683 Long-term borrowings 63,639 61,286 100,563 Equity 23,024 23,638 23,670
Source: Bloomberg
Table 339: Select financial metrics
FY 2008 FY 2009 FY 2010ROA -0.2 0.2 0.5ROE -3.0 3.6 7.4ROC -0.4 0.6 1.3C:I 94.6 53.9 53.4Core capital 13.2 17.8 16.6
Source: Bloomberg
Cover pool overview
We set out below some of the key cover pool characteristics:
Table 340: Public-sector covered bond characteristics
As at June 2011
Ratings S/M/FCovered Bond rating AAA/Aaa/AAAIssuer rating A/A1/A+
Cover poolCover pool size (€) 9,197,000,000 Over-collateralisation (€) 1,673,600,000
Geographical split (in %)Germany 97.5 Austria 2.2 Other 0.4
Borrower type (in %)Central Government 2.4 Regional authorities 31.3 Local authorities 48.0 Other 18.3
Source: Investor report
Table 341: Mortgage covered bond characteristics
As at June 2011
Ratings S/M/FCovered Bond rating -/Aa1/AAAIssuer rating A/A1/A+
Cover poolCover pool size (€) 31,489,700,000 Over-collateralisation (€) 5,519,000,000
Property type (in %)Residential 71.0 Office 12.6 Retail 10.1 Industrial 1.9 Other 4.4
Geographical split (in %)Germany 100.0
Source: Investor report

148
Europe Credit Research12 September 2011
Gareth Davies, CFA(44-20) [email protected]
Flavio Marco Rusconi(44-20) [email protected]
Westdeutsche Immobilienbank
(BBG: WESTIB)Snapshot
Westdeutsche Immobilien Bank AG (‘WestImmo’) is a 100% subsidiary of WestLB AG and the centre of competence for all domestic, foreign real estate property financings and activities for the group. It is a domestic leader in real estate financing and also maintains a strong presence in other European markets as well as in North America and in Asia.
Customers include institutional investors, global developers, property companies, real estate corporates and medium-sized enterprises. The bank finances a wide range of properties, including office, commercial and residential properties, shopping centres, hotels and industrial or public buildings.
In addition to financing property, at both individual project or at a portfolio level, the bank also offers customers a range of additional products such as real estate joint ventures, syndications and interest and exchange derivatives.
Financial performance
We set out below some of the key financial performance metrics:
Table 342: Key profit & loss figures, €mm
FY 2008 FY 2009 FY 2010Net interest income 179 218 239Prov. for loan losses 27 66 68NII less provisions 152 132 171
Commission & fee inc. 31 40 33Other operating inc. 2 4 8Non-interest expense 86 95 90Operating profit 122 77 99
PBT 121 85 99Taxes 13 3 4Net profit (loss) 97 83 95
Source: Annual report 2010
Table 343: Key balance sheet figures, €mm
FY 2008 FY 2009 FY 2010Loans 14,716 16,732 20,080 Total Assets 26,171 26,889 25,888 Deposits 5,756 6,864 6,954 Short-term borrowings 6,826 6,360 5,320 Long-term borrowings 8,870 8,190 8,196 Equity 861 906 855
Source: Annual report 2010
Table 344: Select financial metrics
FY 2008 FY 2009 FY 2010ROE 10.9 9.0 10.2C:I 35.1 37.7 34.7Core capital 8.4 8.2 8.0
Source: Annual report 2010
Cover pool overview
We set out below some of the key cover pool characteristics:
Table 345: Public-sector covered bond characteristics
As at June 2011
Ratings S/M/FCovered Bond rating AAA/- /-Issuer rating BBB+/-/-
Cover poolCover pool size (€) 1,899,600,000Over-collateralisation (€) 564,000,000
Geographical split (in %)Germany 97.4
Borrower type (in %)Central Government 2.6 Regional authorities 19.7 Local authorities 53.3 Other 24.3
Source: Investor report
Table 346: Mortgage covered bond characteristics
As at June 2011
Ratings S/M/FCovered Bond rating AAA/- /-Issuer rating BBB+/-/-
Cover poolCover pool size (€) 10,365,900,000Over-collateralisation (€) 1,744,600,000
Geographical split (in %)Germany 53.0 USA 10.8 UK 10.6 Other 25.6
Property type (in %)Residential 32.3 Office 37.3 Retail 15.2 Other 15.2
Source: Investor report

149
Europe Credit Research12 September 2011
Gareth Davies, CFA(44-20) [email protected]
Flavio Marco Rusconi(44-20) [email protected]
WestLB
(BBG: WESTLB)Snapshot
WestLB AG is a commercial bank with roots in North Rhine-Westphalia, Germany´s largest federal state. It is one of Germany´s leading financial services providers and the central institution for the savings banks in North Rhine-Westphalia and Brandenburg.
WestLB works in close partnership with the savings banks, offering a wide range of products and services but focusing on lending, structured finance, capital market, asset management, transaction services and real estate finance.
WestLB is owned by the two savings banks associations of North Rhine-Westphalia (over 25% stake each), the State of North Rhine-Westphalia (18%) andNRW.BANK (31%), which in turn is owned by the State of NRW (99%) and two regional associations. In 2008, WestLB’s owners (NRW Bank, local savings bank association and the States) approved a risk shield for the Bank. The European authorities have approved this state aid, on condition that the institution must reduce its balance sheet and its RWA by 50% respectively.
Financial performance
We set out below some of the key financial performance metrics:
Table 347: Key profit & loss figures, €mm
FY 2008 FY 2009 FY 2010Net interest income 1,260 1,919 1,464Prov. for loan losses 479 796 242NII less provisions 781 1,123 1,222
Commission & fee inc. 530 512 514Other operating inc. 402 184 775Non-interest expense 1,530 1,663 1,833Operating profit 167 24 105
PBT 26 -503 -133Taxes 8 28 107Net profit (loss) 18 -531 -240
Source: Bloomberg
Table 348: Key balance sheet figures, €mm
FY 2008 FY 2009 FY 2010Real estate loans 7,433 10,808 Commercial loans 108,691 93,078 75,713 Consumer loans 3,542 3,819 6,433 Total Assets 288,122 242,311 191,523 Deposits 29,722 27,643 23,756 Short-term borrowings 35,619 36,213 17,873 Other ST borrowings 73,604 53,697 51,331 Long-term borrowings 103,898 84,644 64,673 Equity 3,821 3,733 4,107
Source: Bloomberg
Table 349: Select financial metrics
FY 2008 FY 2009 FY 2010NIM 0.5 0.9 0.8ROA 0.0 -0.2 -0.1ROE 0.4 -14.1 -6.1ROC 0.0 -0.4 -0.2C:I 67.5 63.3 82.9Core capital 6.4 8.2 11.4
Source: Bloomberg
Cover pool overview
We set out below some of the key cover pool characteristics:
Table 350: Public-sector covered bond characteristics
As at June 2011
Ratings S/M/FCovered Bond rating -/Aaa/-Issuer rating -/A3/A-
Cover poolCover pool size (€) 10,078,789,000Over-collateralisation (€) 856,775,000
Geographical split (in %)Germany 80.3 Switzerland 5.4 Austria 3.9 Spain 3.6 Other 6.8
Borrower type (in %)Central Government 4.4 Regional authorities 44.1 Local authorities 39.6 Other 11.8
Ratings split (in %)AAA 39.8 AA 55.5 A 4.3 Below BBB and NR 0.4
Source: Investor report
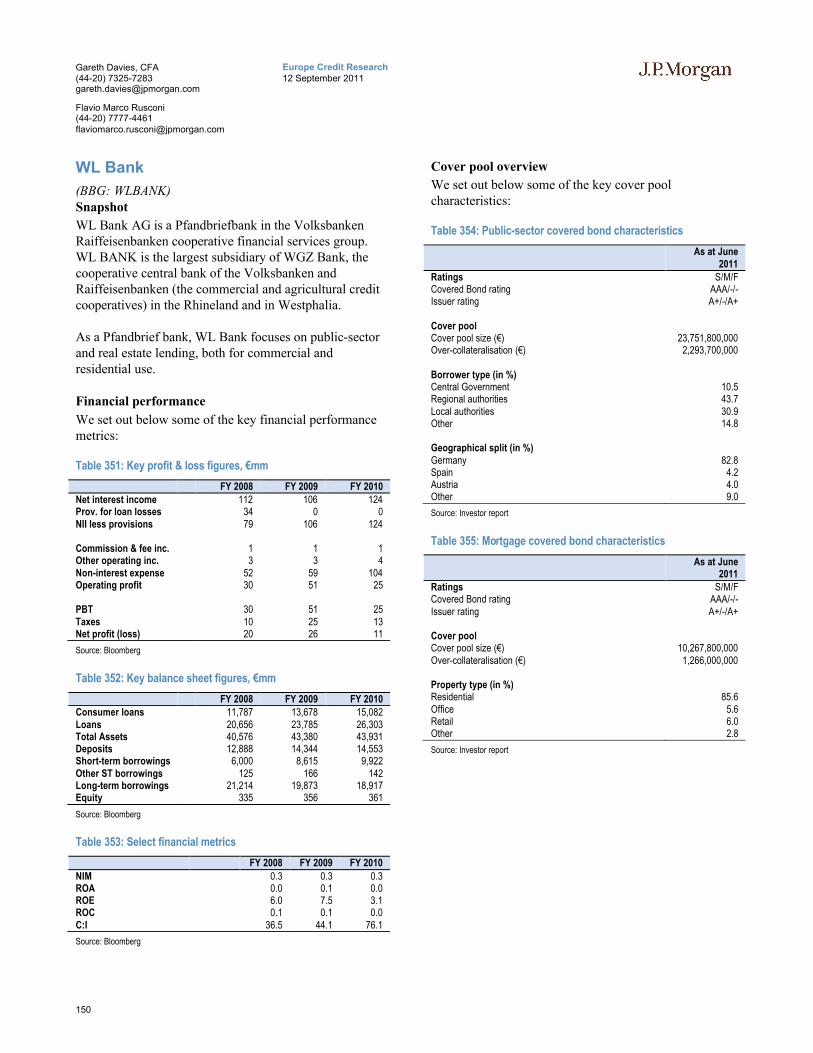
150
Europe Credit Research12 September 2011
Gareth Davies, CFA(44-20) [email protected]
Flavio Marco Rusconi(44-20) [email protected]
WL Bank
(BBG: WLBANK)Snapshot
WL Bank AG is a Pfandbriefbank in the Volksbanken Raiffeisenbanken cooperative financial services group. WL BANK is the largest subsidiary of WGZ Bank, the cooperative central bank of the Volksbanken and Raiffeisenbanken (the commercial and agricultural credit cooperatives) in the Rhineland and in Westphalia.
As a Pfandbrief bank, WL Bank focuses on public-sector and real estate lending, both for commercial and residential use.
Financial performance
We set out below some of the key financial performance metrics:
Table 351: Key profit & loss figures, €mm
FY 2008 FY 2009 FY 2010Net interest income 112 106 124Prov. for loan losses 34 0 0NII less provisions 79 106 124
Commission & fee inc. 1 1 1Other operating inc. 3 3 4Non-interest expense 52 59 104Operating profit 30 51 25
PBT 30 51 25Taxes 10 25 13Net profit (loss) 20 26 11
Source: Bloomberg
Table 352: Key balance sheet figures, €mm
FY 2008 FY 2009 FY 2010Consumer loans 11,787 13,678 15,082 Loans 20,656 23,785 26,303 Total Assets 40,576 43,380 43,931 Deposits 12,888 14,344 14,553 Short-term borrowings 6,000 8,615 9,922 Other ST borrowings 125 166 142 Long-term borrowings 21,214 19,873 18,917 Equity 335 356 361
Source: Bloomberg
Table 353: Select financial metrics
FY 2008 FY 2009 FY 2010
NIM 0.3 0.3 0.3ROA 0.0 0.1 0.0ROE 6.0 7.5 3.1ROC 0.1 0.1 0.0C:I 36.5 44.1 76.1
Source: Bloomberg
Cover pool overview
We set out below some of the key cover pool characteristics:
Table 354: Public-sector covered bond characteristics
As at June 2011
Ratings S/M/FCovered Bond rating AAA/-/-Issuer rating A+/-/A+
Cover poolCover pool size (€) 23,751,800,000Over-collateralisation (€) 2,293,700,000
Borrower type (in %)Central Government 10.5 Regional authorities 43.7 Local authorities 30.9 Other 14.8
Geographical split (in %)Germany 82.8 Spain 4.2 Austria 4.0 Other 9.0
Source: Investor report
Table 355: Mortgage covered bond characteristics
As at June 2011
Ratings S/M/FCovered Bond rating AAA/-/-Issuer rating A+/-/A+
Cover poolCover pool size (€) 10,267,800,000Over-collateralisation (€) 1,266,000,000
Property type (in %)Residential 85.6 Office 5.6 Retail 6.0 Other 2.8
Source: Investor report

151
Europe Credit Research12 September 2011
Gareth Davies, CFA(44-20) [email protected]
Flavio Marco Rusconi(44-20) [email protected]
Gre
ek C
ove
red
Bo
nd
s

152
Europe Credit Research12 September 2011
Gareth Davies, CFA(44-20) [email protected]
Flavio Marco Rusconi(44-20) [email protected]
Greek Covered Bonds
Legislative snapshot
We set out in Table 356 a snapshot of key covered bond attributes in Greece.
Table 356: Greek Covered Bond legislative overview
Attribute CommentaryFrameworkLegislative Framework Article 91 Law 3601/2007 and Act 2598/2.11.2007 of the Bank of GreeceTypes of covered bonds Only one benchmark distributed bond (ETEGA 3.875 Jul 2016)Structure of Issuer Direct issuance? Bonds can be issued either directly off the balance sheet of the lender (‘direct
issuance’) or via an SPE (‘indirect issuance’ can be undertaken in two forms, with either the credit institution guaranteeing bonds issued by the SPE, or vice versa)
Comments (if any) ETEGA bonds are issued directly from NBG's balance sheetBankruptcy remoteness Covered bond holders protected by preferential claim by law, with no
automatic acceleration on issuer insolvency. Post issuer insolvency, breach of the Asset Percentage test (liabilities < 95% assets) results in acceleration of the programme
Dual claim Yes. Should the cover pool be insufficient to satisfy CB bondholders, a claim pari passu to other unsecured bondholders within the insolvency estate exists.
Bond format Fixed rate, soft bullet, with the ability to extend the maturity by up to 12 months at the discretion of the issuer
Supervision Bank of GreeceCover poolEligible assets Mortgage Eligible mortgage collateral includes domestic residential mortgages,
domestic commercial mortgages and ship loansLTV caps A combination of "Soft" and "Hard". Maximum LTVs for domestic residential
mortgages are 80%, for domestic commercial mortgages of 60%; and ship loans of 60% LTV. Whereas residential and commercial loans can be included in the cover pool above the LTV thresholds (with subsequent scaling), ship loans can only be included if they are under the LTV threshold.
Public Sector Pools can also include exposures to public sector entities or credit institutions from the EEA, CH, US, Canada, Australia, New Zealand, OECD as well as multi-national development banks
Non-performing collateral NPLs greater than 90d must be removed from the cover poolSubstitution Assets Substitute collateral can also be included in the pool to meet over-
collateralisation requirementsHedging Natural matching preferred but derivatives allowed to hedge risk Valuation Individual market values. The value of mortgaged property must also be
checked by an independent valuer on a periodic basis (3 years for residential, annually for commercial)
Other comments (if any)RequirementsALM matching Asset coverage Prior to insolvency, the issuer must comply with the nominal value test which
is set at Assets > 95% of Liabilities, or an asset percentage determined by the rating agencies
Interest coverage Yes. Interest income must exceed interest expense over a 12 month periodOther (if any) NPV test including a parallel 200bp yield curve shift.
Consequence of breach Programme freeze (no issuance nor asset removal). Other regulatory actions by the CBI
Monitoring An independent Cover Pool Monitor supervises compliance with the legislative and regulatory provisions
OtherCompliance with EU legislation UCITS and CRD compliant
Source: National legislation, J.P. Morgan Covered Bond Research
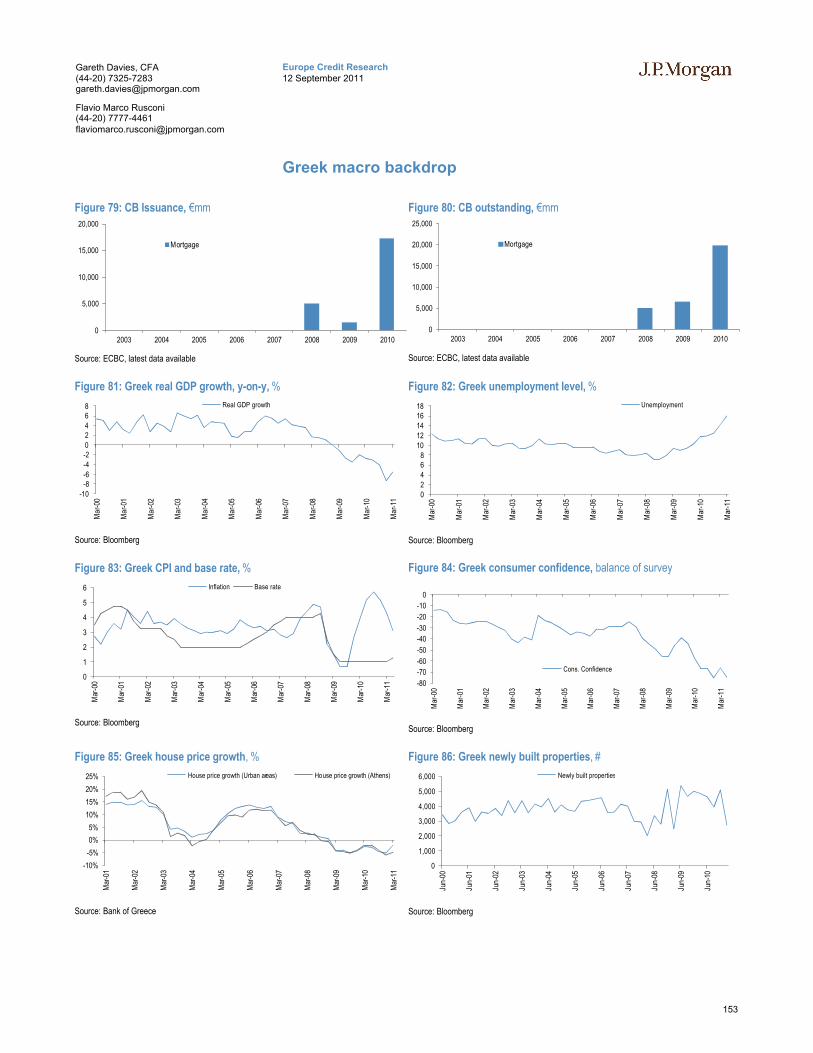
153
Europe Credit Research12 September 2011
Gareth Davies, CFA(44-20) [email protected]
Flavio Marco Rusconi(44-20) [email protected]
Greek macro backdrop
Figure 79: CB Issuance, €mm
Source: ECBC, latest data available
Figure 80: CB outstanding, €mm
Source: ECBC, latest data available
Figure 81: Greek real GDP growth, y-on-y, %
Source: Bloomberg
Figure 82: Greek unemployment level, %
Source: Bloomberg
Figure 83: Greek CPI and base rate, %
Source: Bloomberg
Figure 84: Greek consumer confidence, balance of survey
Source: Bloomberg
Figure 85: Greek house price growth, %
Source: Bank of Greece
Figure 86: Greek newly built properties, #
Source: Bloomberg
0
5,000
10,000
15,000
20,000
2003 2004 2005 2006 2007 2008 2009 2010
Mortgage
0
5,000
10,000
15,000
20,000
25,000
2003 2004 2005 2006 2007 2008 2009 2010
Mortgage
-10-8-6-4-202468
Mar
-00
Mar
-01
Mar
-02
Mar
-03
Mar
-04
Mar
-05
Mar
-06
Mar
-07
Mar
-08
Mar
-09
Mar
-10
Mar
-11
Real GDP growth
02468
1012141618
Mar
-00
Mar
-01
Mar
-02
Mar
-03
Mar
-04
Mar
-05
Mar
-06
Mar
-07
Mar
-08
Mar
-09
Mar
-10
Mar
-11
Unemployment
0
1
2
3
4
5
6
Mar
-00
Mar
-01
Mar
-02
Mar
-03
Mar
-04
Mar
-05
Mar
-06
Mar
-07
Mar
-08
Mar
-09
Mar
-10
Mar
-11
Inflation Base rate
-80
-70
-60
-50
-40
-30
-20
-10
0
Mar
-00
Mar
-01
Mar
-02
Mar
-03
Mar
-04
Mar
-05
Mar
-06
Mar
-07
Mar
-08
Mar
-09
Mar
-10
Mar
-11
Cons. Confidence
-10%
-5%
0%
5%
10%
15%
20%
25%
Mar
-01
Mar
-02
Mar
-03
Mar
-04
Mar
-05
Mar
-06
Mar
-07
Mar
-08
Mar
-09
Mar
-10
Mar
-11
House price growth (Urban areas) House price growth (Athens)
0
1,000
2,000
3,000
4,000
5,000
6,000
Jun-
00
Jun-
01
Jun-
02
Jun-
03
Jun-
04
Jun-
05
Jun-
06
Jun-
07
Jun-
08
Jun-
09
Jun-
10
Newly built properties
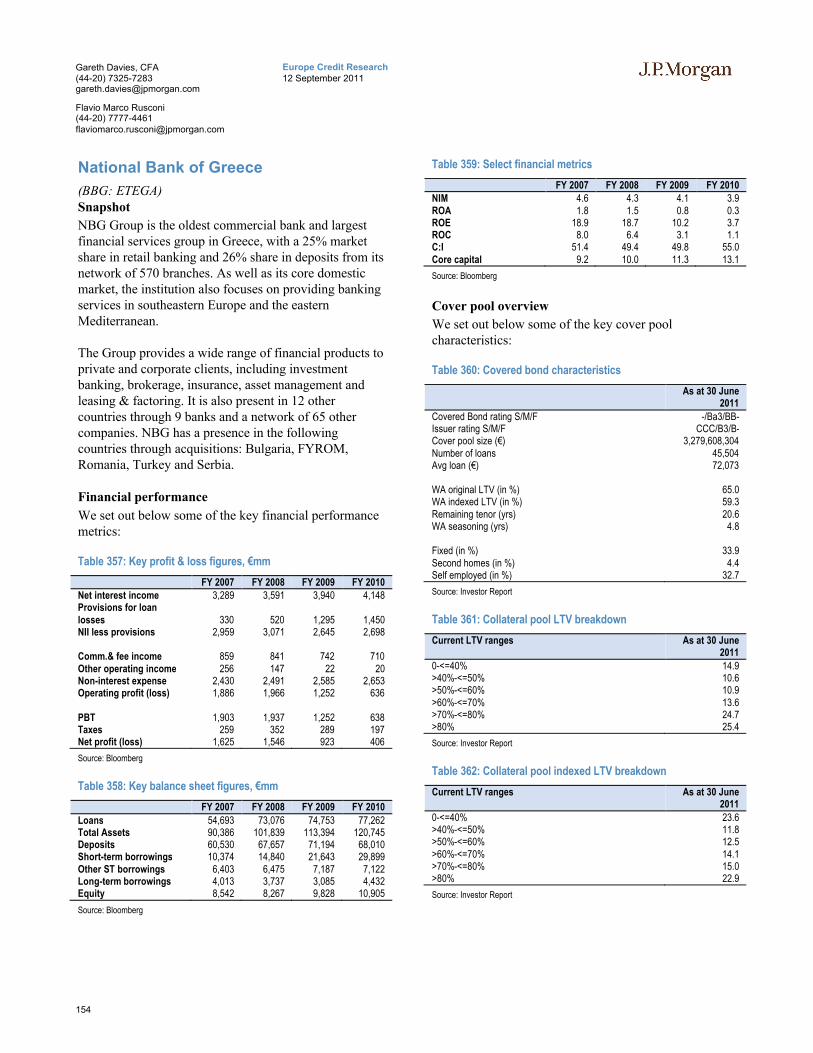
154
Europe Credit Research12 September 2011
Gareth Davies, CFA(44-20) [email protected]
Flavio Marco Rusconi(44-20) [email protected]
National Bank of Greece
(BBG: ETEGA)Snapshot
NBG Group is the oldest commercial bank and largest financial services group in Greece, with a 25% market share in retail banking and 26% share in deposits from its network of 570 branches. As well as its core domestic market, the institution also focuses on providing banking services in southeastern Europe and the eastern Mediterranean.
The Group provides a wide range of financial products to private and corporate clients, including investment banking, brokerage, insurance, asset management and leasing & factoring. It is also present in 12 other countries through 9 banks and a network of 65 other companies. NBG has a presence in the following countries through acquisitions: Bulgaria, FYROM, Romania, Turkey and Serbia.
Financial performance
We set out below some of the key financial performance metrics:
Table 357: Key profit & loss figures, €mm
FY 2007 FY 2008 FY 2009 FY 2010Net interest income 3,289 3,591 3,940 4,148Provisions for loan losses 330 520 1,295 1,450NII less provisions 2,959 3,071 2,645 2,698
Comm.& fee income 859 841 742 710Other operating income 256 147 22 20Non-interest expense 2,430 2,491 2,585 2,653Operating profit (loss) 1,886 1,966 1,252 636
PBT 1,903 1,937 1,252 638Taxes 259 352 289 197Net profit (loss) 1,625 1,546 923 406
Source: Bloomberg
Table 358: Key balance sheet figures, €mm
FY 2007 FY 2008 FY 2009 FY 2010
Loans 54,693 73,076 74,753 77,262 Total Assets 90,386 101,839 113,394 120,745 Deposits 60,530 67,657 71,194 68,010 Short-term borrowings 10,374 14,840 21,643 29,899 Other ST borrowings 6,403 6,475 7,187 7,122 Long-term borrowings 4,013 3,737 3,085 4,432 Equity 8,542 8,267 9,828 10,905
Source: Bloomberg
Table 359: Select financial metrics
FY 2007 FY 2008 FY 2009 FY 2010NIM 4.6 4.3 4.1 3.9 ROA 1.8 1.5 0.8 0.3 ROE 18.9 18.7 10.2 3.7 ROC 8.0 6.4 3.1 1.1 C:I 51.4 49.4 49.8 55.0 Core capital 9.2 10.0 11.3 13.1
Source: Bloomberg
Cover pool overview
We set out below some of the key cover pool characteristics:
Table 360: Covered bond characteristics
As at 30 June 2011
Covered Bond rating S/M/F -/Ba3/BB-Issuer rating S/M/F CCC/B3/B-Cover pool size (€) 3,279,608,304Number of loans 45,504Avg loan (€) 72,073
WA original LTV (in %) 65.0WA indexed LTV (in %) 59.3Remaining tenor (yrs) 20.6WA seasoning (yrs) 4.8
Fixed (in %) 33.9Second homes (in %) 4.4Self employed (in %) 32.7
Source: Investor Report
Table 361: Collateral pool LTV breakdown
Current LTV ranges As at 30 June 2011
0-<=40% 14.9 >40%-<=50% 10.6 >50%-<=60% 10.9 >60%-<=70% 13.6 >70%-<=80% 24.7 >80% 25.4
Source: Investor Report
Table 362: Collateral pool indexed LTV breakdown
Current LTV ranges As at 30 June 2011
0-<=40% 23.6 >40%-<=50% 11.8 >50%-<=60% 12.5 >60%-<=70% 14.1 >70%-<=80% 15.0 >80% 22.9
Source: Investor Report

155
Europe Credit Research12 September 2011
Gareth Davies, CFA(44-20) [email protected]
Flavio Marco Rusconi(44-20) [email protected]
Hu
ng
ari
an
Co
ve
red
Bo
nd
s

156
Europe Credit Research12 September 2011
Gareth Davies, CFA(44-20) [email protected]
Flavio Marco Rusconi(44-20) [email protected]
Hungarian Covered Bonds
Legislative snapshot
We set out in Table 363 a snapshot of key covered bond attributes in Hungary.
Table 363: Hungarian Covered Bond legislative overview
Attribute CommentaryFrameworkLegislative Framework Act XXX 1997 on mortgage banks and mortgage bonds (Mortgage Bank Act) outlines the special framework
applicable to covered bonds issuers. Act CXII 1996 also contains rules on the establishment, operation, supervision and liquidation of mortgage banks. Decree 40/2005 contains rules regarding the calculation of the value of the cover assets and the methodology for stress tests to be applied.
Types of covered bonds Only one, mortgage covered bonds.Structure of Issuer Direct issuance? Yes.
Comments (if any) Only mortgage banks are allowed to issue covered bonds, with the collateral being kept on their balance sheet.
Bankruptcy remoteness Assets backing the bonds are recorded on a register. Dual claim YesBond format Fixed rate, bullet.Supervision Hungarian Financial Supervisory Authority.Cover poolEligible assets Mortgage Mortgages secured by properties located in the EEA.
LTV caps Max LTV for residential/commercial/agricultural mortgages max is 70/60/60% respectively. Currently pools only contain residential mortgages.
Public Sector n/aNon-performing collateral Issuer has to repurchase loans in arrears by more than 90 days. Substitution Assets Substitute collateral must not exceed 20% of the cover assets and must consist of liquid assets as specified
in the Mortgage Bank Act.Hedging Derivatives are allowed to hedge interest and exchange rate risk. Valuation Individual market values. Decree 25/1997 and Decree 54/1997 request the application of the principle of
carefulness in valuing the property.Other comments (if any)
Requirements
ALM matching Asset coverage Assets must be greater than liabilities at all times.Interest coverage Interest received must exceed that due on the bonds at any time. Other (if any)
Consequence of breach Alternative administration. Monitoring Trustee/cover pool monitor.OtherCompliance with EU legislation UCITS and CRD compliant.
Source: National legislation, J.P. Morgan Covered Bond Research

157
Europe Credit Research12 September 2011
Gareth Davies, CFA(44-20) [email protected]
Flavio Marco Rusconi(44-20) [email protected]
Hungarian covered bond & macro backdrop
Figure 87: Mortgage CB Issuance, €mm
Source: ECBC. Latest data available displayed
Figure 88: Mortgage CB outstanding, €mm
Source: ECBC. Latest data available displayed
Figure 89: Hungary real GDP growth, y-on-y, %
Source: Bloomberg
Figure 90: Hungary unemployment level, %
Source: Bloomberg
Figure 91: Hungary CPI and base rate, %
Source: Bloomberg
Figure 92: Hungary consumer confidence index, #
Source: Bloomberg
Figure 93: Hungary house price growth, %
Source: FHB Bank
Figure 94: Hungary building permits, sum of previous 12mths, #
Source: Hungarian Central Statistical Office
0
500
1,000
1,500
2,000
2,500
3,000
3,500
2003 2004 2005 2006 2007 2008 2009 2010
Mortgage
0
1,000
2,000
3,000
4,000
5,000
6,000
7,000
8,000
2003 2004 2005 2006 2007 2008 2009 2010
Mortgage
-10-8-6-4-202468
Mar
-00
Mar
-01
Mar
-02
Mar
-03
Mar
-04
Mar
-05
Mar
-06
Mar
-07
Mar
-08
Mar
-09
Mar
-10
Mar
-11
Real GDP growth
0
2
4
6
8
10
12
14
Mar
-00
Mar
-01
Mar
-02
Mar
-03
Mar
-04
Mar
-05
Mar
-06
Mar
-07
Mar
-08
Mar
-09
Mar
-10
Mar
-11
Unemployment
0
2
4
6
8
10
12
14
Mar
-00
Mar
-01
Mar
-02
Mar
-03
Mar
-04
Mar
-05
Mar
-06
Mar
-07
Mar
-08
Mar
-09
Mar
-10
Mar
-11
Inflation Base rate
-80
-70
-60
-50
-40
-30
-20
-10
0
Mar
-00
Mar
-01
Mar
-02
Mar
-03
Mar
-04
Mar
-05
Mar
-06
Mar
-07
Mar
-08
Mar
-09
Mar
-10
Mar
-11
Cons. Confidence
-15%-10%
-5%0%5%
10%15%20%25%30%
Mar
-01
Mar
-02
Mar
-03
Mar
-04
Mar
-05
Mar
-06
Mar
-07
Mar
-08
Mar
-09
Mar
-10
Mar
-11
House price growth
0
5,000
10,000
15,000
20,000
25,000
30,000
Mar
-00
Mar
-01
Mar
-02
Mar
-03
Mar
-04
Mar
-05
Mar
-06
Mar
-07
Mar
-08
Mar
-09
Mar
-10
Mar
-11
Building permits (of previous 12mths)
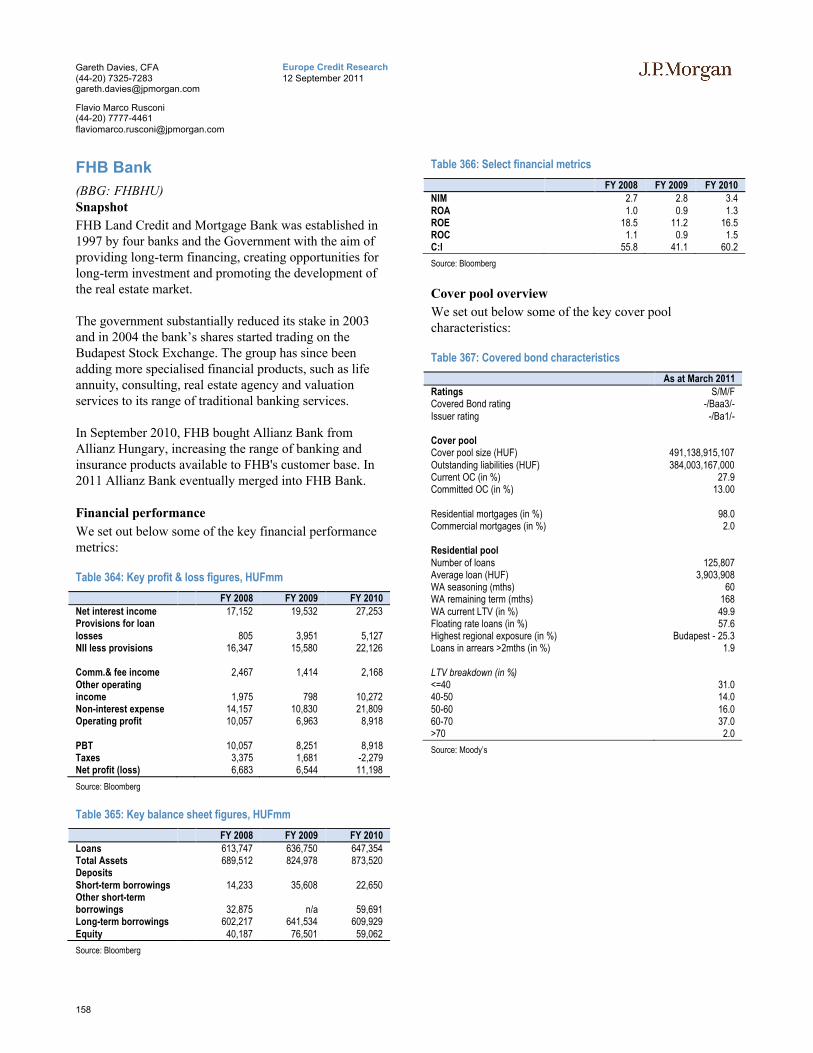
158
Europe Credit Research12 September 2011
Gareth Davies, CFA(44-20) [email protected]
Flavio Marco Rusconi(44-20) [email protected]
FHB Bank
(BBG: FHBHU)Snapshot
FHB Land Credit and Mortgage Bank was established in 1997 by four banks and the Government with the aim of providing long-term financing, creating opportunities for long-term investment and promoting the development of the real estate market.
The government substantially reduced its stake in 2003 and in 2004 the bank’s shares started trading on the Budapest Stock Exchange. The group has since been adding more specialised financial products, such as life annuity, consulting, real estate agency and valuationservices to its range of traditional banking services.
In September 2010, FHB bought Allianz Bank from Allianz Hungary, increasing the range of banking and insurance products available to FHB's customer base. In 2011 Allianz Bank eventually merged into FHB Bank.
Financial performance
We set out below some of the key financial performance metrics:
Table 364: Key profit & loss figures, HUFmm
FY 2008 FY 2009 FY 2010Net interest income 17,152 19,532 27,253Provisions for loan losses 805 3,951 5,127NII less provisions 16,347 15,580 22,126
Comm.& fee income 2,467 1,414 2,168Other operating income 1,975 798 10,272Non-interest expense 14,157 10,830 21,809Operating profit 10,057 6,963 8,918
PBT 10,057 8,251 8,918Taxes 3,375 1,681 -2,279Net profit (loss) 6,683 6,544 11,198
Source: Bloomberg
Table 365: Key balance sheet figures, HUFmm
FY 2008 FY 2009 FY 2010Loans 613,747 636,750 647,354Total Assets 689,512 824,978 873,520DepositsShort-term borrowings 14,233 35,608 22,650Other short-term borrowings 32,875 n/a 59,691Long-term borrowings 602,217 641,534 609,929Equity 40,187 76,501 59,062
Source: Bloomberg
Table 366: Select financial metrics
FY 2008 FY 2009 FY 2010NIM 2.7 2.8 3.4ROA 1.0 0.9 1.3ROE 18.5 11.2 16.5ROC 1.1 0.9 1.5C:I 55.8 41.1 60.2
Source: Bloomberg
Cover pool overview
We set out below some of the key cover pool characteristics:
Table 367: Covered bond characteristics
As at March 2011Ratings S/M/FCovered Bond rating -/Baa3/-Issuer rating -/Ba1/-
Cover poolCover pool size (HUF) 491,138,915,107Outstanding liabilities (HUF) 384,003,167,000Current OC (in %) 27.9Committed OC (in %) 13.00
Residential mortgages (in %) 98.0 Commercial mortgages (in %) 2.0
Residential poolNumber of loans 125,807 Average loan (HUF) 3,903,908 WA seasoning (mths) 60 WA remaining term (mths) 168 WA current LTV (in %) 49.9 Floating rate loans (in %) 57.6 Highest regional exposure (in %) Budapest - 25.3 Loans in arrears >2mths (in %) 1.9
LTV breakdown (in %)<=40 31.0 40-50 14.0 50-60 16.0 60-70 37.0 >70 2.0
Source: Moody’s

159
Europe Credit Research12 September 2011
Gareth Davies, CFA(44-20) [email protected]
Flavio Marco Rusconi(44-20) [email protected]
OTP Bank
(BBG: OTPHB)Snapshot
The OTP Group comprises several subsidiaries offering a wide range of financial products. OTP Bank offers more traditional banking services, while specialised services such as car leasing, investment funds and insurance (using strategic collaboration with French insurance company, Groupama, which owns an 8% stake in the group) are offered by other group's subsidiaries.
OTPBank was established in 1949 as a state-owned institution. It first became a public company in 1990 but remained government-owned until 1995, when its privatisation began.
After becoming private, OTP started expanding its operations by entering neighbouring markets in the Central and Eastern Europe region through a number of acquisitions and has become a key player in the region. Outside of its domestic market, it has operations in Bulgaria, Croatia, Romania, Serbia, Slovakia, Ukraine, Montenegro and Russia.
Financial performance
We set out below some of the key financial performance metrics:
Table 368: Key profit & loss figures, HUFmm
FY 2008 FY 2009 FY 2010Net interest income 439,743 590,674 617,376Provisions for loan losses 111,449 249,278 273,024NII less provisions 328,294 341,396 344,352
Comm.& fee income 181,765 170,335 177,252Non-interest expense 346,196 238,080 279,105Operating profit 429,541 273,732 280,600
PBT 274,367 170,482 140,183Taxes 33,299 20,276 22,057Net profit (loss) 240,472 151,045 117,930
Source: Bloomberg
Table 369: Key balance sheet figures, HUFmm
FY 2008 FY 2009 FY 2010Commercial Loans 2,535,027 2,466,413 2,598,277Consumer Loans 4,256,443 4,152,251 4,486,875Other Loans 257,911 288,430 417,179Loans 6,778,701 6,412,716 6,741,059Total Assets 9,367,724 9,755,132 9,780,946Deposits 5,258,167 5,688,887 5,821,489Short-term borrowings 1,048,526 1,199,725 1,098,507Other short-term borrowings 187,532 260,011 385,744Long-term borrowings 1,811,688 1,412,674 1,166,277Equity 1,048,971 1,191,606 1,308,929
Source: Bloomberg
Table 370: Select financial metrics
FY 2008 FY 2009 FY 2010NIM 5.5 6.7 6.6ROA 2.7 1.6 1.2ROE 24.9 13.6 9.5ROC 6.9 3.9 3.2C:I 35.6 27.7 30.5Core Capital 11.3 13.8 14.0
Source: Bloomberg
Cover pool overview
We set out below some of the key cover pool characteristics:
Table 371: Covered bond characteristics
As at March 2011
Ratings S/M/FCovered Bond rating BBB-/Baa3/-Issuer rating -/Baa1/-
Cover poolCover pool size (HUF) 1,426,375,124,748Outstanding liabilities (HUF) 1,246,124,684,536Current OC (in %) 14.5
Number of loans 302,079Average loan (HUF) 4,716,002WA seasoning (mths) 55WA remaining term (mths) 183WA current LTV (in %) 62.7Floating rate loans (in %) 67.0 Highest regional exposure (in %) Budapest - 24.8 Loans in arrears >2mths (in %) 3.6
LTV breakdown (in %)<=40 22.1 40-50 15.1 50-60 13.8 60-70 12.2 70-80 11.0 >80 25.8
Source: Moody’s

160
Europe Credit Research12 September 2011
Gareth Davies, CFA(44-20) [email protected]
Flavio Marco Rusconi(44-20) [email protected]

161
Europe Credit Research12 September 2011
Gareth Davies, CFA(44-20) [email protected]
Flavio Marco Rusconi(44-20) [email protected]
Iris
h C
ove
red
Bo
nd
s

162
Europe Credit Research12 September 2011
Gareth Davies, CFA(44-20) [email protected]
Flavio Marco Rusconi(44-20) [email protected]
Irish Covered Bonds
Legislative snapshot
We set out in Table 372 a snapshot of key covered bond attributes in Ireland.
Table 372: Irish Covered Bond legislative overview
Attribute CommentaryFrameworkLegislative Framework Asset Covered Securities (ACS) Act 2001 (as amended), along with regulations from the Central Bank of
IrelandTypes of covered bonds Three. Mortgage ACS; Commercial Mortgage ACS and Public Sector ACSStructure of Issuer Direct issuance? No
Comments (if any) ACS are issued by Designated Credit Institutions (DCIs), special purpose subsidiaries with restricted business activities of the main Irish lenders. They are authorised by the Central Bank of Ireland. Typically called a Mortgage or ACS Bank
Bankruptcy remoteness The claim and cashflows of an ACS are unaffected by the actual or potential insolvency of the DCI or its parent. In either case, the securities and hedges continue, and do not accelerate. First defense is for the NTMA to find a new sponsor following issuer insolvency
Dual claim Yes. Should the cover pool be insufficient to satisfy ACS bondholders, a claim pari passu to other unsecured bondholders within the ACS Bank exists. Should the resources of the ACS Bank be insufficient, we believe the unlimited liability legal status of the ACS subsidiary will allow the upstreaming of claims to the ultimate parent bank
Bond format Typically, fixed rate, soft bullet, with the ability to extend maturities by up to 12 months at the discretion of the issuer
Supervision IFSRA, and CBICover poolEligible assets Mortgage Mortgage assets are restricted to EEA jurisdictions, plus Australia, New Zealand, Switzerland, Canada,
Japan and the US. Securitised mortgage assets are also eligible for inclusion if rated at least AA-, and constitute a maximum of 20% of the pool. Commercial mortgages can constitute a maximum of 10% of the pool
LTV caps "Soft" (loans above the maximum can be included in the cover pool, with 'credit' given for only the eligible portion of the asset). The maximum LTV for residential mortgages is 75%, and for commercial mortgages 60%. The cover pool also benefits from the portion of the loan which is above the maximum threshold (i.e. loans do not need to be removed if they breach the maximum threshold)
Public Sector Public sector assets are limited to the same jurisdictions as for mortgage assets above, along with debt from highly-rated multilateral development banks and international organisations
Non-performing collateral NPLs greater than 90d must be removed from the cover poolSubstitution Assets Substitution assets can also be kept in the cover pool (capped at 15%). Substitution assets include
deposits with eligible financial institutions and tier 1 assets (as defined by the ECB for repo purposes)Hedging Used to minimise interest rate, currency, credit or other risks. Entered on the asset register and rank pari
passu with ACS holders. Do not accelerate on issuer insolvencyValuation Prudent market valuation taken on entry into the cover pool for residential assets, and then annually
thereafter. Where house prices are declining according to the Permanent/TSB index, the indexed valuation should be used. If prices increase, 85% of the upward revision should be used. For commercial exposures, the latest market value should be reviewed by an independent valuer, with mandatory reviews for large (>7%) declines in approved indices
Other comments (if any) DCIs can also keep assets on their balance sheets which are not registered in the cover pool. DCIs can issue more than one type of ACS (mortgage-backed, public sector backed etc). Within the DCI, segregation of assets is based on pool-type and must be recorded in separate registers.
RequirementsALM matching Asset coverage Mandatory 103% over-collateralisation for residential and public sector mortgage assets. For commercial
assets, minimum over-collateralisation of 10% is required. Public commitment by both major institutions to maintain at 105% for mortgage assets now binding
Interest coverage Yes. Interest income must exceed interest expense over a 12 month period. NPV of changes on the balance sheet of an ACS issuer from a 100bp shift/twist in the yield curve must not exceed 10% of the Issuer's own funds
Other (if any) Duration of the cover assets must not be less than that of issued securities. For public-sector backed bonds, the duration of the assets can be no greater than 3 years longer than the outstanding bonds
Consequence of breach Programme freeze (no issuance nor asset removal). Other regulatory actions by the CBIMonitoring An independent Cover Asset Monitor supervises compliance with the ACS Act’s provisionsOtherCompliance with EU legislation UCITS and CRD compliant
Source: National legislation, J.P. Morgan Covered Bond Research

163
Europe Credit Research12 September 2011
Gareth Davies, CFA(44-20) [email protected]
Flavio Marco Rusconi(44-20) [email protected]
Irish covered bond & macro backdrop
Figure 95: Irish CB issuance, €mm
Source: ECBC. Latest data available displayed
Figure 96: Irish CB outstanding, €mm
Source: ECBC. Latest data available displayed
Figure 97: Irish real GDP growth, y-on-y, %
Source: Source: Bloomberg
Figure 98: Irish unemployment level, %
Source: Bloomberg
Figure 99: Irish CPI and base rate, %
Source: Bloomberg
Figure 100: Irish consumer confidence, balance of survey
Source: Bloomberg
Figure 101: Irish house price growth, %
Source: CSO
Figure 102: Irish residential planning permissions, #
Source: CSO
0
5,000
10,000
15,000
20,000
25,000
2003 2004 2005 2006 2007 2008 2009 2010
Mortgage Public Sector
0
20,000
40,000
60,000
80,000
100,000
2003 2004 2005 2006 2007 2008 2009 2010
Mortgage Public Sector
-10
-5
0
5
10
15
Mar
-00
Mar
-01
Mar
-02
Mar
-03
Mar
-04
Mar
-05
Mar
-06
Mar
-07
Mar
-08
Mar
-09
Mar
-10
Mar
-11
Real GDP growth
0
2
4
6
8
10
12
14
16
Mar
-00
Mar
-01
Mar
-02
Mar
-03
Mar
-04
Mar
-05
Mar
-06
Mar
-07
Mar
-08
Mar
-09
Mar
-10
Mar
-11
Unemployment
-8
-6
-4
-2
0
2
4
6
8
Mar
-00
Mar
-01
Mar
-02
Mar
-03
Mar
-04
Mar
-05
Mar
-06
Mar
-07
Mar
-08
Mar
-09
Mar
-10
Mar
-11
Inflation Base rate
0
20
40
60
80
100
120
140
Mar
-00
Mar
-01
Mar
-02
Mar
-03
Mar
-04
Mar
-05
Mar
-06
Mar
-07
Mar
-08
Mar
-09
Mar
-10
Mar
-11
Cons. Confidence
-25-20-15-10
-505
10152025
Mar
-00
Mar
-01
Mar
-02
Mar
-03
Mar
-04
Mar
-05
Mar
-06
Mar
-07
Mar
-08
Mar
-09
Mar
-10
Mar
-11
House price growth
0
1,000
2,000
3,000
4,000
5,000
6,000
7,000
8,000
Mar
-00
Mar
-01
Mar
-02
Mar
-03
Mar
-04
Mar
-05
Mar
-06
Mar
-07
Mar
-08
Mar
-09
Mar
-10
Mar
-11
Planning permissions

164
Europe Credit Research12 September 2011
Gareth Davies, CFA(44-20) [email protected]
Flavio Marco Rusconi(44-20) [email protected]
AIB Mortgage Bank (‘AIBMB’)
(BBG: AIB)Snapshot
AIB Mortgage Bank (‘AIBMB’) is a DCI under the Irish ACS legislation, and a wholly owned subsidiary of Allied Irish Banks Plc (‘AIB'). AIBMB’s principal purpose is to issue ACS backed by mortgage loans on residential property. These loans may be made directly by the bank itself (AIB transferred its Irish branch-originated residential mortgage business to AIBMB in 2006), sourced from other subsidiaries of AIB Group or third parties.
Most of the bank’s activities are outsourced to AIB under an outsourcing and agency agreement, with AIB originating residential mortgage loans through its branch network, servicing the mortgage loans, providing treasury services and a range of other support services. The bank's activities are financed through the issuance of MCS, a mortgage-backed promissory note facility with the central bank and Irish FSA, and the balance by AIB plc.
AIB acquired EBS Building Society (now called EBS Limited) in July 2011, and remains majority owned by the Irish government.
Financial performance
We set out below some of the key financial performance metrics:
Table 373: Key profit & loss figures, €mm
FY 2010Net interest income 215Provisions for loan losses 344NII less provisions -129
Comm.& fee incomeOther operating income 0Non-interest expense 144Operating profit (loss) 72
PBT -316Taxes -37Net profit (loss) 277
Source: Annual Report
Table 374: Key balance sheet figures, €mm
FY 2010Total Assets 36,983Deposits 27,333Short-term borrowingsOther ST borrowingsLong-term borrowingsEquity 423
Source: Annual Report
Cover pool overview
We set out below some of the key cover pool characteristics:
Table 375: Covered bond characteristics
As at 30 June 2011
RatingsCovered bond rating A/Baa3/AParent rating BB/Ba2/BBBFitch D:factor 70.0%Moody's TPI Very Improbable
Cover poolMortgage balance (€bn) 20.5 Bonds outstanding (€bn) 13.3 OC ACS (%) 26.3 OC nominal (%) 54.9
# mortgages 132,052 Avg loan balance 155,411 WA Unindexed LTV (%) 67.9 WA Indexed LTV (%) 91.8 Indexed LTV>80% 58.0 Indexed LTV>90% 49.0 Indexed LTV>100% 38.0
Asset seasoning 54.3
Owner occupied 74.0 Second homes 1.0 BTL 25.0 Dublin 36.0 Other 64.0
Source: Investor Report

165
Europe Credit Research12 September 2011
Gareth Davies, CFA(44-20) [email protected]
Flavio Marco Rusconi(44-20) [email protected]
Bank of Ireland Mortgage Bank (‘BoIMB’)
(BBG: BKIR)Snapshot
Bank of Ireland Mortgage Bank (‘BoIMB’) was established in 2004 as a DCI under the Irish ACS legislation, and is a wholly-owned subsidiary of the Governor & Company of the Bank of Ireland (‘BoI’). In June 2004, BoI transferred its Irish residential mortgage business and substantially all of its Irish residential mortgage loans to BoIMB, whose main activities are the issuance of residential MCS. Portfolios of mortgages can be directly originated, acquired from other parts of the BoI group or third parties.
As for AIB, most of the bank’s activities are outsourced to BoI under an outsourcing and agency agreement, with BoI originating residential mortgage loans through its branch network, servicing the mortgage loans, providing treasury services and a range of other support services. The bank's activities are financed through the issuance of MCS, a mortgage-backed promissory note facility with the central bank and Irish FSA, and the balance by BoI plc.
Bank of Ireland remains in the private sector.
Financial performance
We set out below some of the key financial performance metrics:
Table 376: Key profit & loss figures, €mm
FY 2008 FY 2009 FY 2010Net interest income 188 195 199Provisions for loan losses 0 0 153NII less provisions 188 195 46
Comm.& fee income 0 0 0Other operating income 0 0 20Non-interest expense 104 114 14Operating profit (loss) 84 81 63
PBT 87 35 -63Taxes 11 4 -8Net profit (loss) 76 31 -55
Source: Annual Report
Table 377: Key balance sheet figures, €mm
FY 2008 FY 2009 FY 2010Loans 19,346 20,505 20,830 Total Assets 27,475 36,161 36,276 Deposits 0 0 Short-term borrowings 19,383 21,663 22,704 Other ST borrowings 26 19 118 Long-term borrowings 7,224 13,683 12,725 Equity 763 794 718
Source: Annual Report
Table 378: Select financial metrics
FY 2009 FY 2010NIM 1.7 0.6 ROA 0.1 - 0.0 ROE 4.0 - 7.6 ROC 0.1 C:I 13.8 13.3 Core capital
Source: Annual Report
Cover pool overview
We set out below some of the key cover pool characteristics:
Table 379: Covered bond characteristics
As at 30 June 2011
RatingsCovered bond rating -/Baa3/-Parent rating BB+/Ba2/BBBFitch D:factor n/aMoody's TPI Very Improbable
Cover poolMortgage balance (€bn) 15,751,754,017
# mortgages 110,976Avg loan balance 141,938WA Current LTV 64.5WA Indexed LTV 88.9 Indexed LTV>80% 61.7 Indexed LTV>90% 52.0 Indexed LTV>100% 40.0
Asset seasoning 61.5
Fixed rate loans (%) 19.8Interest only loans (%) 16.0Investment properties (%) 22.8
Dublin 31.6 Other 68.4
Source: Investor Report

166
Europe Credit Research12 September 2011
Gareth Davies, CFA(44-20) [email protected]
Flavio Marco Rusconi(44-20) [email protected]
Depfa ACS Bank (‘DACS’)
(BBG: DEPFA)Snapshot
Depfa ACS Bank (‘DACS’) is a subsidiary of Depfa Bank plc, which in turn is a subsidiary of Deutsche Pfandbriefbank AG (formed by the merger of Hypo Real Estate Bank AG and Depfa Deutsche Pfandbriefbank AG). DACS’ current business model focuses on the financing of public sector assets with ACS. It is the largest ACS issuer, with close to €30bn of bonds outstanding currently (as at June 2011). The cover pool backing the remaining bonds was significantly restructured in October 2010, as part of the broader HRE transfer of assets to FMS-Wertmanagement (FMS-WM).
Post the merger, the combined Deutsche Pfandbriefbank is repositioning itself to be a bank specialising in European real estate and public sector finance, funded predominantly by the issuance of pfandbrief. Based on this, we expect DACS to continue in its solvent run-off for a number of years.
Financial performance
We set out below some of the key financial performance metrics:
Table 380: Key profit & loss figures, €mm
FY 2010Net interest income 252Provisions for loan losses 2NII less provisions 250
Comm.& fee income -310Other operating income -422Non-interest expense 198Operating profit (loss) -680
PBT -680TaxesNet profit (loss)
Source: Annual Report
Table 381: Key balance sheet figures, €mm
FY 2010
Loans 99,000Total Assets 144,000DepositsShort-term borrowings 66,000Other ST borrowingsLong-term borrowingsEquity 4,000
Source: Annual Report
Cover pool overview
We set out below some of the key cover pool characteristics:
Table 382: Covered bond characteristics
As at 30 June 2011
RatingsCovered bond rating AA/Aa3/AAAIssuer rating BBB/Baa3/BBB+Fitch D:factor 9.5%Moody's TPI Probable-High
Collateral poolPool (€bn) 32.4Bonds (€bn) 29.6
Borrower classificationPSE 67.5 Local Govt 16.8 Sovereign 11.8 Other 3.9
RatingsAAA 40.1 AA 37.5 A 21.9 BBB 0.5
Largest jurisdictionsGermany 28.4 USA 18.0 Spain 11.6 Italy 6.1 France 5.6
Non-EEA 22.9
Source: Investor Report

167
Europe Credit Research12 September 2011
Gareth Davies, CFA(44-20) [email protected]
Flavio Marco Rusconi(44-20) [email protected]
EBS Mortgage Finance (‘EBS’)
(BBG: EBSBLD)Snapshot
EBS Mortgage Finance (‘EBS MF’) was established in November 2008 as a DCI under the Irish ACS legislation, and a wholly owned subsidiary of the EBS Building Society. EBS MF’s main purpose is to issue MCS backed by mortgage loans on residential property under a €6bn ACS programme.
EBS was one of Ireland’s two building societies (the 6th largest credit institution in Ireland), with close to one hundred outlets across the Irish Republic. EBS traditionally focused its lending business on public sector workers in Ireland. It accounts for approximately 8% of the retail savings market.
AIB acquired EBS Building Society (now called EBS Limited) in July 2011. The newly combined entity remains majority owned by the Irish government.
Financial performance
We set out below some of the key financial performance metrics for EBS:
Table 383: Covered bond characteristics
As at 30 June 2011RatingsCovered bond rating -/Baa3/A-Issuer rating n/aFitch D:factor 70.0%Moody's TPI Improbable
Cover poolMortgage balance 3,943,112,141 Bonds outstanding 2,350,000,000 OC ACS (%) 43.3 OC nominal (%) 70.2
# mortgages 41,846Avg loan balance 94,229WA Original LTV 67.6WA Indexed LTV 81.0 Indexed LTV>80% 54.2 Indexed LTV>90% 45.2 Indexed LTV>100% 36.3
Asset seasoning 70.0Fixed rate 17.0
Dublin 39.0Other 61.0
Source: Investor Report

168
Europe Credit Research12 September 2011
Gareth Davies, CFA(44-20) [email protected]
Flavio Marco Rusconi(44-20) [email protected]

169
Europe Credit Research12 September 2011
Gareth Davies, CFA(44-20) [email protected]
Flavio Marco Rusconi(44-20) [email protected]
Ita
lia
n C
ove
red
Bo
nd
s
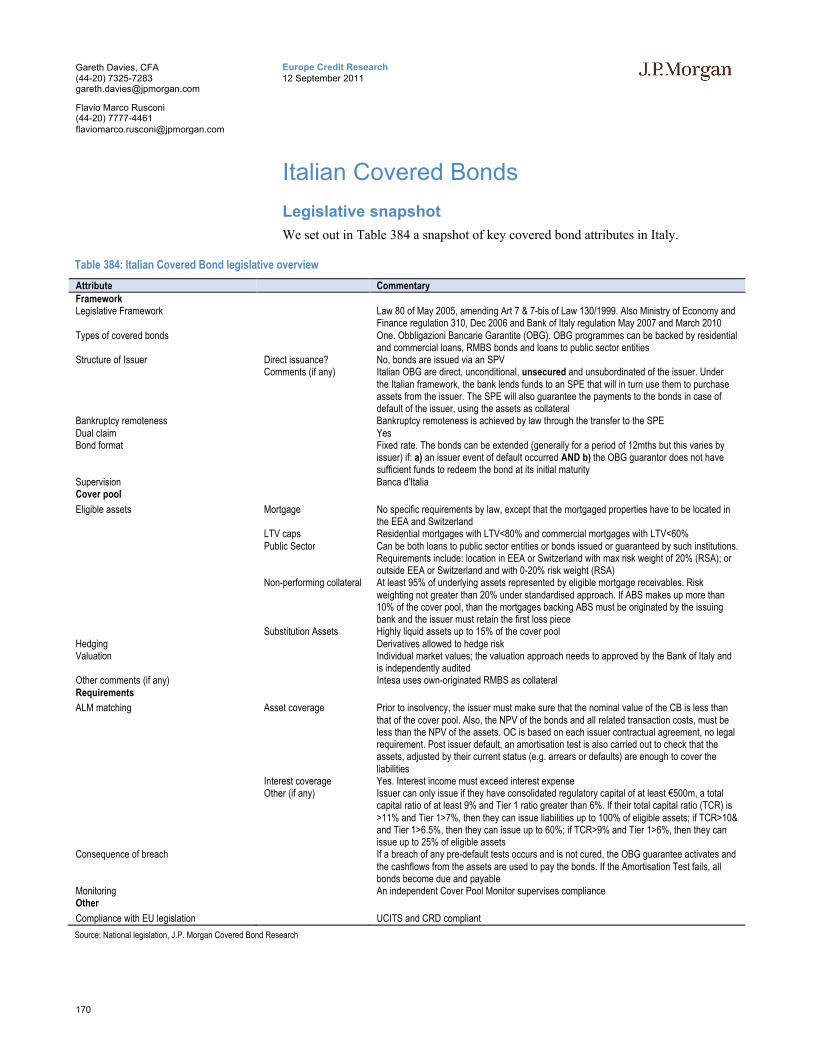
170
Europe Credit Research12 September 2011
Gareth Davies, CFA(44-20) [email protected]
Flavio Marco Rusconi(44-20) [email protected]
Italian Covered Bonds
Legislative snapshot
We set out in Table 384 a snapshot of key covered bond attributes in Italy.
Table 384: Italian Covered Bond legislative overview
Attribute CommentaryFrameworkLegislative Framework Law 80 of May 2005, amending Art 7 & 7-bis of Law 130/1999. Also Ministry of Economy and
Finance regulation 310, Dec 2006 and Bank of Italy regulation May 2007 and March 2010 Types of covered bonds One. Obbligazioni Bancarie Garantite (OBG). OBG programmes can be backed by residential
and commercial loans, RMBS bonds and loans to public sector entitiesStructure of Issuer Direct issuance? No, bonds are issued via an SPV
Comments (if any) Italian OBG are direct, unconditional, unsecured and unsubordinated of the issuer. Under the Italian framework, the bank lends funds to an SPE that will in turn use them to purchase assets from the issuer. The SPE will also guarantee the payments to the bonds in case of default of the issuer, using the assets as collateral
Bankruptcy remoteness Bankruptcy remoteness is achieved by law through the transfer to the SPEDual claim YesBond format Fixed rate. The bonds can be extended (generally for a period of 12mths but this varies by
issuer) if: a) an issuer event of default occurred AND b) the OBG guarantor does not have sufficient funds to redeem the bond at its initial maturity
Supervision Banca d'ItaliaCover pool
Eligible assets Mortgage No specific requirements by law, except that the mortgaged properties have to be located in the EEA and Switzerland
LTV caps Residential mortgages with LTV<80% and commercial mortgages with LTV<60%Public Sector Can be both loans to public sector entities or bonds issued or guaranteed by such institutions.
Requirements include: location in EEA or Switzerland with max risk weight of 20% (RSA); or outside EEA or Switzerland and with 0-20% risk weight (RSA)
Non-performing collateral At least 95% of underlying assets represented by eligible mortgage receivables. Risk weighting not greater than 20% under standardised approach. If ABS makes up more than 10% of the cover pool, than the mortgages backing ABS must be originated by the issuing bank and the issuer must retain the first loss piece
Substitution Assets Highly liquid assets up to 15% of the cover poolHedging Derivatives allowed to hedge risk Valuation Individual market values; the valuation approach needs to approved by the Bank of Italy and
is independently auditedOther comments (if any) Intesa uses own-originated RMBS as collateralRequirements
ALM matching Asset coverage Prior to insolvency, the issuer must make sure that the nominal value of the CB is less than that of the cover pool. Also, the NPV of the bonds and all related transaction costs, must be less than the NPV of the assets. OC is based on each issuer contractual agreement, no legal requirement. Post issuer default, an amortisation test is also carried out to check that the assets, adjusted by their current status (e.g. arrears or defaults) are enough to cover the liabilities
Interest coverage Yes. Interest income must exceed interest expenseOther (if any) Issuer can only issue if they have consolidated regulatory capital of at least €500m, a total
capital ratio of at least 9% and Tier 1 ratio greater than 6%. If their total capital ratio (TCR) is >11% and Tier 1>7%, then they can issue liabilities up to 100% of eligible assets; if TCR>10& and Tier 1>6.5%, then they can issue up to 60%; if TCR>9% and Tier 1>6%, then they can issue up to 25% of eligible assets
Consequence of breach If a breach of any pre-default tests occurs and is not cured, the OBG guarantee activates and the cashflows from the assets are used to pay the bonds. If the Amortisation Test fails, all bonds become due and payable
Monitoring An independent Cover Pool Monitor supervises complianceOther
Compliance with EU legislation UCITS and CRD compliant
Source: National legislation, J.P. Morgan Covered Bond Research

171
Europe Credit Research12 September 2011
Gareth Davies, CFA(44-20) [email protected]
Flavio Marco Rusconi(44-20) [email protected]
Italian covered bond & macro backdrop
Figure 103: CB issuance, €mm
Source: ECBC. Latest data available displayed
Figure 104: CB outstanding, €mm
Source: ECBC. Latest data available displayed
Figure 105: Italian real GDP growth, y-on-y, %
Source: Bloomberg
Figure 106: Italian unemployment level, %
Source: Bloomberg
Figure 107: Italian CPI and base rate, %
Source: Bloomberg
Figure 108: Italian consumer confidence, balance of survey
Source: Bloomberg
Figure 109: Italian house price growth, %
Source: Bloomberg
Figure 110: Italian outstanding mortgages (€mm) and annual growth of mortgage stock, %
Source: ECB
0
2,000
4,000
6,000
8,000
10,000
12,000
14,000
16,000
2003 2004 2005 2006 2007 2008 2009 2010
Mortgage Public Sector
0
5,000
10,000
15,000
20,000
25,000
30,000
35,000
40,000
2003 2004 2005 2006 2007 2008 2009 2010
Mortgage Public Sector
-8
-6
-4
-2
0
2
4
6
Mar
-00
Mar
-01
Mar
-02
Mar
-03
Mar
-04
Mar
-05
Mar
-06
Mar
-07
Mar
-08
Mar
-09
Mar
-10
Mar
-11
Real GDP growth
0
2
4
6
8
10
12
Mar
-00
Mar
-01
Mar
-02
Mar
-03
Mar
-04
Mar
-05
Mar
-06
Mar
-07
Mar
-08
Mar
-09
Mar
-10
Mar
-11
Unemployment
01122334455
Mar
-00
Mar
-01
Mar
-02
Mar
-03
Mar
-04
Mar
-05
Mar
-06
Mar
-07
Mar
-08
Mar
-09
Mar
-10
Mar
-11
Inflation Base rate
-35
-30
-25
-20
-15
-10
-5
0
5
Mar
-00
Mar
-01
Mar
-02
Mar
-03
Mar
-04
Mar
-05
Mar
-06
Mar
-07
Mar
-08
Mar
-09
Mar
-10
Mar
-11
Cons. Confidence
-10%
-5%
0%
5%
10%
15%
20%
25%
Mar
-01
Mar
-02
Mar
-03
Mar
-04
Mar
-05
Mar
-06
Mar
-07
Mar
-08
Mar
-09
Mar
-10
Mar
-11
House price growth
-5%
0%
5%
10%
15%
20%
25%
0
50,000
100,000
150,000
200,000
250,000
300,000
350,000
400,000
Dec
-02
Jun-
03
Dec
-03
Jun-
04
Dec
-04
Jun-
05
Dec
-05
Jun-
06
Dec
-06
Jun-
07
Dec
-07
Jun-
08
Dec
-08
Jun-
09
Dec
-09
Jun-
10
Dec
-10
Jun-
11
Outstanding mortgages Growth in o/s mortgages

172
Europe Credit Research12 September 2011
Gareth Davies, CFA(44-20) [email protected]
Flavio Marco Rusconi(44-20) [email protected]
Banca Carige (‘Carige’)
(BBG: BANCAR)Snapshot
The Banca Carige Group is one of the six largest financial services groups in Italy, with over 1,000 branches and agencies throughout the country. The group includes the parent, Banca Carige, four other banks (Cassa di Risparmio di Savona, Cassa di Risparmio di Carrara, Banca del Monte di Lucca, and Banca Cesare Ponti), an asset management company (Carige Asset Management Sgr) and two insurance companies (Carige Assicurazioni and Carige Vita Nuova which specialise in non-life and life insurance respectively). The group is also the majority shareholder of Creditis Servizi Finanziari SpA, a company specialised in consumer credit.
Ownership is split between a foundation (43%), France’s Groupe BPCE (15%), Generali (1.5%) and a free float of 40%.
Carige’s covered bonds are backed by Italian mortgages.
Financial performance
We set out below some of the key financial performance metrics:
Table 385: Key profit & loss figures, €mm
FY 2007 FY 2008 FY 2009 FY 2010Net interest income 683 826 740 714Provisions for loan losses 75 77 100 114NII less provisions 608 749 641 600
Comm.& fee income 289 292 315 16Other operating income 773 39 23 16Non-interest expense 1,337 703 742 746Operating profit (loss) 368 329 337 256
PBT 370 309 313 262Taxes 157 96 104 98Net profit (loss) 205 206 205 177
Source: Bloomberg
Table 386: Key balance sheet figures, €mm
FY 2007 FY 2008 FY 2009 FY 2010
Loans 17,017 20,916 22,786 21,854 Total Assets 27,464 31,986 36,299 40,010 Deposits 11,031 11,713 14,954 14,357 Short-term borrowings 1,780 2,107 1,963 4,961 Other ST borrowings 1,415 1,728 1,528 1,540 Long-term borrowings 7,281 9,579 10,020 9,660 Equity 2,862 3,576 3,853 3,737
Source: Bloomberg
Table 387: Select financial metrics
FY 2007 FY 2008 FY 2009 FY 2010NIM 2.9 3.2 n/a n/aROA 0.8 0.7 0.6 0.5 ROE 7.4 6.5 5.6 4.7 ROC 1.7 1.5 1.3 1.0 C:I 74.6 62.1 61.8 65.8 Core capital 7.8 7.9 7.9 6.7
Source: Bloomberg
Cover pool overview
We set out below some of the key cover pool characteristics:
Table 388: Covered bond characteristics
As at 30 April 2011
S/M/FCovered Bond rating AAA/Aaa/AAAIssuer rating A-/A2/A-
Cover pool size (€) 3,292,403,155Number of loans 35,780Avg loan (€) 92,018
WA LTV (in %) 50.1 Remaining tenor (mths) 213.6 WA seasoning (mths) 42.7
Residential properties (in %) 96.1 Commercial properties (in %) 3.9
Source: Investor Report
Table 389: Collateral pool LTV breakdown
Current LTV ranges As at 30 April 2011
0-<=40% 32.0 >40%-<=50% 15.0 >50%-<=60% 16.0 >60%-<=70% 16.8 >70%-<=80% 19.4 >80% 0.8
Source: Investor Report

173
Europe Credit Research12 September 2011
Gareth Davies, CFA(44-20) [email protected]
Flavio Marco Rusconi(44-20) [email protected]
Banca Monte dei Paschi di Siena (‘BMPS’)
(BBG: MONTE)Snapshot
Banca Monte dei Paschi di Siena, founded in 1472, is considered to be the oldest bank in the world. Through a number of acquisitions, the MPS Group is now the third largest financial services group in Italy. The group offers a wide range of products, including retail banking and financial advisory, corporate and investment banking (with a particular focus on SMEs), wealth management, pension fund and life insurance services.
Through a national network of over 3,000 branches, the group caters to the needs of over 6 million customers; outside of the domestic market, the Group has branches in the main international financial centres and aims at expanding its presence in emerging markets, in particular in the Mediterranean basin, in central and eastern Europe and in Asia.
BMPS’ covered bonds are backed by Italian mortgages.
Financial performance
We set out below some of the key financial performance metrics:
Table 390: Key profit & loss figures, €mm
FY 2007 FY 2008 FY 2009 FY 2010Net interest income 3,485 4,371 3,997 3,819Provisions for loan losses 614 1,002 1,453 1,126NII less provisions 2,871 3,369 2,544 2,693
Comm.& fee income 1,711 1,664 1,935 2,170Other operating income 175 334 212 203Non-interest expense 3,426 4,445 4,462 4,186Operating profit (loss) 1,161 243 -95 509
PBT 1,270 -92 43 1,327Taxes 552 -930 31 342Net profit (loss) 1,438 923 220 985
Source: Bloomberg
Table 391: Key balance sheet figures, €mm
FY 2007 FY 2008 FY 2009 FY 2010Loans 104,913 145,085 146,976 154,450Total Assets 162,076 213,796 224,815 244,279Deposits 56,963 75,935 77,240 79,028Short-term borrowings 26,837 40,921 44,457 53,804Other ST borrowings 24,480 26,965 27,425 38,108Long-term borrowings 39,809 47,158 42,559 35,247Equity 8,939 15,103 17,456 17,426
Source: Bloomberg
Table 392: Select financial metrics
FY 2007 FY 2008 FY 2009 FY 2010NIM 2.4 2.5 2.0 1.7ROA 0.9 0.5 0.1 0.4ROE 17.5 7.9 1.4 5.7ROC 2.0 1.0 0.2 0.8C:I 64.5 77.3 75.7 70.7Core capital 8.9 9.3 7.5 13.0
Source: Bloomberg
Cover pool overview
We set out below some of the key cover pool characteristics:
Table 393: Covered bond characteristics
As at 31 May 2011
S/M/FCovered Bond rating /Aaa/AAAIssuer rating A-/A2/A-
Cover pool size (€) 12,594,657,406Number of loans 121,620Avg loan (€) 103,557
WA Current LTV (in %) 61.1 Remaining tenor (mths) 243.5 WA seasoning (mths) 27.4
Top three regions (%)Veneto 16.4 Toscana 14.8 Lazio 14.3
Floating rate (in %) 89.2 Fixed rate (in %) 10.8
Source: Investor Report
Table 394: Collateral pool LTV breakdown
Current LTV ranges As at 31 May 2011
0-<=40% 22.1>40%-<=50% 12.3>50%-<=60% 14.1>60%-<=70% 17.0>70%-<=80% 40.3
Source: Investor Report

174
Europe Credit Research12 September 2011
Gareth Davies, CFA(44-20) [email protected]
Flavio Marco Rusconi(44-20) [email protected]
Banca Popolare di Milano (‘BPM’)
(BBG: PMIIM)Snapshot
BPM was founded as a cooperative bank in Milan. The group now offers a range of financial products across Italy. It is the eighth largest banking group and the fourth largest Popolare bank, with a leading position in the north of the country. It operates close to 800 branches across Lombardy, Piedmont, Apulia and Latium.
BPM’ covered bonds are backed by Italian mortgages.
Financial performance
We set out below some of the key financial performance metrics:
Table 395: Key profit & loss figures, €mm
FY 2007 FY 2008 FY 2009 FY 2010Net interest income 1,216 1,246 1,052 872Provisions for loan losses 127 205 337 238NII less provisions 1,089 1,041 715 633
Comm.& fee income 658 591 767 685Other operating income 116 111 89 -128Non-interest expense 1,237 1,243 1,452 1,328Operating profit (loss) 555 256 218 -114
PBT 546 213 217 -31Taxes 220 130 114 78Net profit (loss) 315 75 104 106
Source: Bloomberg
Table 396: Key balance sheet figures, €mm
FY 2007 FY 2008 FY 2009 FY 2010
Loans 28,665 32,899 32,629 35,385 Total Assets 43,627 45,039 44,281 54,053 Deposits 21,414 20,218 21,804 23,173 Short-term borrowings 7,137 6,010 3,384 7,824 Other ST borrowings 2,707 2,623 2,160 2,448 Long-term borrowings 8,065 12,009 12,012 12,070 Equity 3,598 3,389 4,022 3,984
Source: Bloomberg
Table 397: Select financial metrics
FY 2007 FY 2008 FY 2009 FY 2010
NIM 3.1 3.0 2.5 1.9 ROA 0.8 0.2 0.2 0.2 ROE 9.2 2.2 2.9 2.7 ROC 1.8 0.4 0.5 0.5 C:I 63.0 71.7 70.6 90.9 Core capital 7.2 7.7 8.6 7.8
Source: Bloomberg
Cover pool overview
We set out below some of the key cover pool characteristics:
Table 398: Covered bond characteristics
As at 30 June 2011
S/M/FCovered Bond rating AAA/Aaa/AAAIssuer rating A-/A1/A-
Cover pool size (€) 3,951,326,775Number of loans 39,557Avg loan (€) 99,889
WA LTV (in %) 52.15Remaining tenor (mths) 226.9WA seasoning (mths) 36.16
Top three regions (%) Lombardia 73.5Lazio 12.5
Emilia Romagna 4.3
Source: Investor Report
Table 399: Collateral pool LTV breakdown
Current LTV ranges As at 30 June 2011
0-<=40% 27.8 >40%-<=50% 15.1 >50%-<=60% 16.1 >60%-<=70% 18.4 >70%-<=80% 22.2 >80%-<=100% 0.4
Source: Investor Report
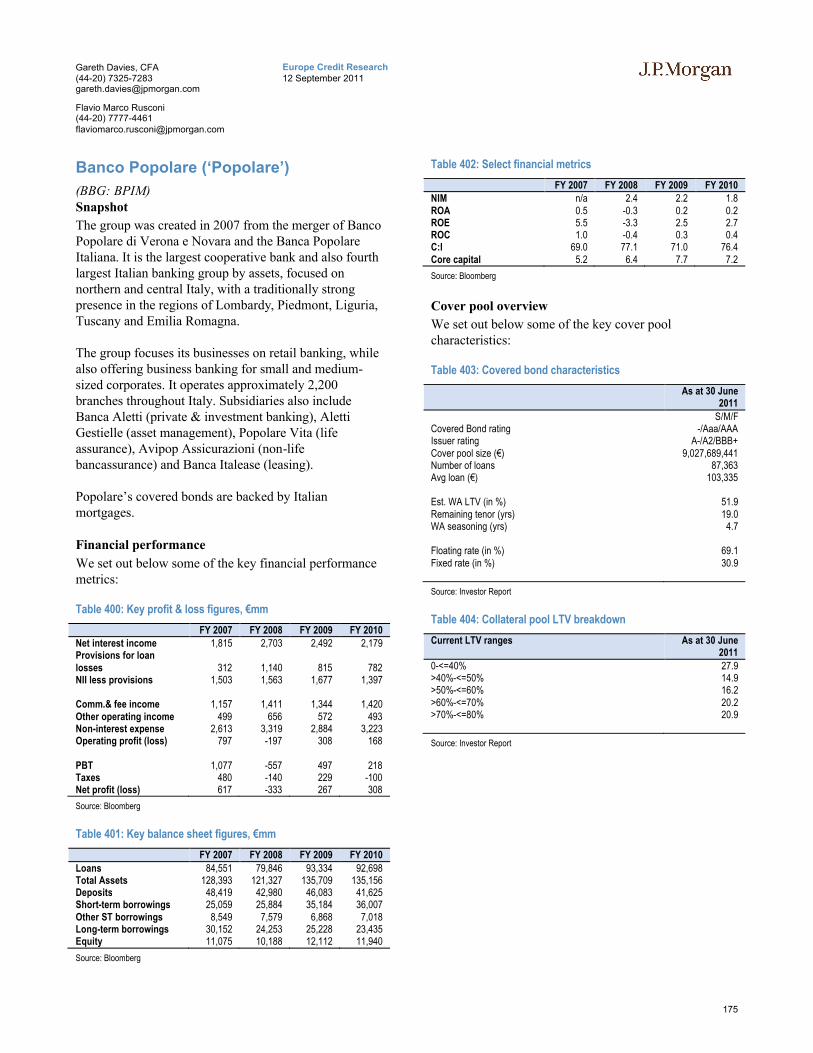
175
Europe Credit Research12 September 2011
Gareth Davies, CFA(44-20) [email protected]
Flavio Marco Rusconi(44-20) [email protected]
Banco Popolare (‘Popolare’)
(BBG: BPIM)Snapshot
The group was created in 2007 from the merger of Banco Popolare di Verona e Novara and the Banca Popolare Italiana. It is the largest cooperative bank and also fourth largest Italian banking group by assets, focused on northern and central Italy, with a traditionally strong presence in the regions of Lombardy, Piedmont, Liguria, Tuscany and Emilia Romagna.
The group focuses its businesses on retail banking, while also offering business banking for small and medium-sized corporates. It operates approximately 2,200 branches throughout Italy. Subsidiaries also include Banca Aletti (private & investment banking), Aletti Gestielle (asset management), Popolare Vita (life assurance), Avipop Assicurazioni (non-life bancassurance) and Banca Italease (leasing).
Popolare’s covered bonds are backed by Italian mortgages.
Financial performance
We set out below some of the key financial performance metrics:
Table 400: Key profit & loss figures, €mm
FY 2007 FY 2008 FY 2009 FY 2010Net interest income 1,815 2,703 2,492 2,179Provisions for loan losses 312 1,140 815 782NII less provisions 1,503 1,563 1,677 1,397
Comm.& fee income 1,157 1,411 1,344 1,420Other operating income 499 656 572 493Non-interest expense 2,613 3,319 2,884 3,223Operating profit (loss) 797 -197 308 168
PBT 1,077 -557 497 218Taxes 480 -140 229 -100Net profit (loss) 617 -333 267 308
Source: Bloomberg
Table 401: Key balance sheet figures, €mm
FY 2007 FY 2008 FY 2009 FY 2010
Loans 84,551 79,846 93,334 92,698 Total Assets 128,393 121,327 135,709 135,156 Deposits 48,419 42,980 46,083 41,625 Short-term borrowings 25,059 25,884 35,184 36,007 Other ST borrowings 8,549 7,579 6,868 7,018 Long-term borrowings 30,152 24,253 25,228 23,435 Equity 11,075 10,188 12,112 11,940
Source: Bloomberg
Table 402: Select financial metrics
FY 2007 FY 2008 FY 2009 FY 2010NIM n/a 2.4 2.2 1.8 ROA 0.5 -0.3 0.2 0.2 ROE 5.5 -3.3 2.5 2.7 ROC 1.0 -0.4 0.3 0.4 C:I 69.0 77.1 71.0 76.4 Core capital 5.2 6.4 7.7 7.2
Source: Bloomberg
Cover pool overview
We set out below some of the key cover pool characteristics:
Table 403: Covered bond characteristics
As at 30 June 2011
S/M/FCovered Bond rating -/Aaa/AAAIssuer rating A-/A2/BBB+Cover pool size (€) 9,027,689,441Number of loans 87,363Avg loan (€) 103,335
Est. WA LTV (in %) 51.9 Remaining tenor (yrs) 19.0 WA seasoning (yrs) 4.7
Floating rate (in %) 69.1Fixed rate (in %) 30.9
Source: Investor Report
Table 404: Collateral pool LTV breakdown
Current LTV ranges As at 30 June 2011
0-<=40% 27.9>40%-<=50% 14.9>50%-<=60% 16.2>60%-<=70% 20.2>70%-<=80% 20.9
Source: Investor Report

176
Europe Credit Research12 September 2011
Gareth Davies, CFA(44-20) [email protected]
Flavio Marco Rusconi(44-20) [email protected]
Credito Emiliano (‘Credem’)
(BBG: CRDEM)Snapshot
Credito Emiliano was founded in 1910 and has strong ties to the Emilia Romagna region. Through acquisitions in both the banking and broader financial services sectors, the CREDEM group now counts over 600 banking and financial advisor branches in 16 Italian regions.
The Group offers banking services to individuals and SMEs, financial advisory and private banking services. The bank has two subsidiaries in Switzerland (Banca Euromobiliare SA) and in Luxembourg (Credem International SA). Over three quarters of the Group’s shares are in the hands of CREDEM Holding, whose main shareholders include the Max Mara fashion group (14%) and Pictet (5%).
Credem’s covered bonds are backed by Italian mortgages.
Financial performance
We set out below some of the key financial performance metrics:
Table 405: Key profit & loss figures, €mm
FY 2007 FY 2008 FY 2009 FY 2010Net interest income 798 1,057 632 505Provisions for loan losses 53 59 108 62NII less provisions 745 998 524 443
Comm.& fee income 470 379 426 476Other operating income 57 36 45 16Non-interest expense 775 760 779 823Operating profit (loss) 327 179 165 166
PBT 327 181 163 168Taxes 78 25 74 90Net profit (loss) 249 156 89 78
Source: Bloomberg
Table 406: Key balance sheet figures, €mm
FY 2007 FY 2008 FY 2009 FY 2010
Loans 13,414 17,618 17,536 18,884Total Assets 26,233 30,136 26,439 29,998Deposits 10,505 11,452 12,534 11,821Short-term borrowings 5,580 4,202 3,883 9,157Other ST borrowings 2,386 2,709 1,562 1,518Long-term borrowings 5,181 6,808 5,000 3,995Equity 1,543 1,753 1,850 1,804
Source: Bloomberg
Table 407: Select financial metrics
FY 2007 FY 2008 FY 2009 FY 2010NIM 3.3 4.0 2.4 1.9ROA 1.0 0.6 0.3 0.3ROE 17.1 9.5 4.9 4.3ROC 2.0 1.1 0.7 0.6C:I 64.3 74.0 71.7 76.1Core capital 8.1 9.6 11.1 11.3
Source: Bloomberg
Cover pool overview
We set out below some of the key cover pool characteristics:
Table 408: Covered bond characteristics
As at 30 June 2011
S/M/FCovered Bond rating /Aaa/AAAIssuer rating A/-A2/A
Cover pool size (€) 2,055,351,786Number of loans 25,449Avg loan (€) 80,764
WA Current LTV (in %) 43.8 Remaining tenor (mths) 170.0 WA seasoning (mths) 52.0
Top three regions (%)Emilia Romagna 26.8 Lombardia 15.6 Sicilia 11.1
Floating rate (in %) 78.5 Fixed rate (in %) 21.5
Source: Investor Report
Table 409: Collateral pool LTV breakdown
Current LTV ranges As at 30 June 2011
0-<=40% 43.4>40%-<=50% 19.6>50%-<=60% 15.3>60%-<=70% 12.7>70%-<=80% 9.1
Source: Investor Report

177
Europe Credit Research12 September 2011
Gareth Davies, CFA(44-20) [email protected]
Flavio Marco Rusconi(44-20) [email protected]
Intesa Sanpaolo (‘Intesa’)
(BBG: ISPIM)Snapshot
Intesa Sanpaolo is a banking group resulting from the merger between Banca Intesa and Sanpaolo IMI. It is one of the leaders in the Italian market as well as having a strong international presence focused on Central-Eastern Europe and the Mediterranean basin.
The Group brings together two major Italian banks and is a leader in its domestic market across all business areas in which it operates (retail, corporate and wealth management). Outside of Italy, it operates over 1,800 branches providing retail and commercial banking services across thirteen countries. Corporate clients are further supported across thirty-one countries, including the US, Russia, China and India.
Intesa Sanpaolo issues both a public-sector backed OBG, and a mortgage-backed OBG (using RMBS to transfer mortgage risk between group entities).
Financial performance
We set out below some of the key financial performance metrics:
Table 410: Key profit & loss figures, €mm
FY 2007 FY 2008 FY 2009 FY 2010Net interest income 10,947 13,053 11,716 11,111Provisions for loan losses 1,043 2,433 3,448 2,818NII less provisions 9,904 10,620 8,268 8,293
Comm.& fee income 7,304 6,543 6,141 6494Other operating income -254 843 -153 -39Non-interest expense 12,627 14,224 12,315 12,203Operating profit (loss) 4,677 1,525 2,889 2,936
PBT 4,860 839 3,455 3,237Taxes 1,539 -656 686 1,155Net profit (loss) 7,250 2,553 2,805 2,705
Source: Bloomberg
Table 411: Key balance sheet figures, €mm
FY 2007 FY 2008 FY 2009 FY 2010
Loans 335,273 387,012 363,447 360,693 Total Assets 572,959 636,133 624,844 658,757 Deposits 178,758 202,558 197,632 198,359 Short-term borrowings 94,958 76,864 69,256 79,004 Other ST borrowings 65,286 80,257 71,297 76,254 Long-term borrowings 139,891 188,280 185,243 179,983 Equity 52,349 50,054 53,771 54,600
Source: Bloomberg
Table 412: Select financial metrics
FY 2007 FY 2008 FY 2009 FY 2010NIM 2.1 2.4 2.0 1.9 ROA 1.3 0.4 0.4 0.4 ROE 13.5 5.1 5.5 5.1 ROC 2.5 0.9 0.9 0.9 C:I 66.3 76.7 63.7 65.4 Core capital 6.5 7.1 8.4 9.4
Source: Bloomberg
Cover pool overview
We set out below some of the key cover pool characteristics:
Table 413: Mortgage (RMBS) covered bond characteristics
As at 31 July 2011
S/M/FCovered Bond rating -/Aaa/-Issuer rating A+/Aa3/AA-
Cover pool size (€) 5,175,360,562Number of loans 70,745Avg loan (€) 73,155
WA Current LTV (in %) 43.7 Remaining tenor (mths) 194.5 WA seasoning (mths) 73.5
Floating rate (in %) 50.6Fixed rate (in %) 49.4
Top three regions (%)Lombardia 45.1 Lazio 11.1 Puglia 7.4
LTV Breakdown0-<=40% 39.9>40%-<=50% 21.0>50%-<=60% 20.8>60%-<=70% 14.1>70%-<=80% 4.2
Source: Investor Report

178
Europe Credit Research12 September 2011
Gareth Davies, CFA(44-20) [email protected]
Flavio Marco Rusconi(44-20) [email protected]
Table 414: Public Sector covered bond characteristics
As at 31 July 2011
S/M/FCovered Bond rating -/Aaa/-Issuer rating A+/Aa3/AA-
Cover pool size (€) 9,811,680,791 Number of loans 1,140 Avg loan (€) 8,606,738
Remaining tenor (mths) 182WA seasoning (mths) 70
Fixed rate (%) 64.4Floating rate (%) 35.6
AAA to AA- (%) 46.8A+ to A- (%) 20.2BBB+ to BBB- (%) 0.0Not Rated (%) 33.0
Sovereign (%) 21Municipality (%) 47Region (%) 27Other (%) 5
Sovereign %)North (%) 42.6Central (%) 16.2South (%) 16.4Spain (%) 2.2France (%) 2.0Germany (%) 0.5Belgium (%) 0.3
Source: Investor Report

179
Europe Credit Research12 September 2011
Gareth Davies, CFA(44-20) [email protected]
Flavio Marco Rusconi(44-20) [email protected]
UBI Banca (‘UBI’)
(BBG: UBIIM)Snapshot
UBI Banca is a cooperative group that was created in 2007 from the merger of Banche Popolari Unite and Banca Lombarda e Piemontese. While the core markets are the northern regions of Lombardy and Piedmont, the group also has a significant presence in central and southern Italy.
The bank focuses mostly on retail banking, which accounts for 97% of its customer base and 69% of its revenues, although it also has a strong presence in the SME market (24% of its revenues). UBI Banca is the parent company of the group, and performs centralised functions, while supporting the nine network banks along with a wide range of product companies which specialise in corporate banking, consumer credit, asset management, factoring & leasing and life & non-life bancassurance.
UBI Banca’s covered bonds are backed by Italian mortgages.
Financial performance
We set out below some of the key financial performance metrics:
Table 415: Key profit & loss figures, €mm
FY 2007 FY 2008 FY 2009 FY 2010Net interest income 2,655 3,068 2,506 2,171Provisions for loan losses 328 559 865 707NII less provisions 2,327 2,508 1,641 1,464
Comm.& fee income 1,423 1,388 1,329 1,378Other operating income 250 224 255 239Non-interest expense 2,958 3,090 2,920 2,840Operating profit (loss) 1,153 271 383 226
PBT 1,191 356 519 334Taxes 461 193 237 232Net profit (loss) 938 69 270 172
Source: Bloomberg
Table 416: Key balance sheet figures, €mm
FY 2007 FY 2008 FY 2009 FY 2010
Loans 91,814 96,365 97,715 101,491 Total Assets 121,492 121,956 122,313 130,559 Deposits 47,807 54,151 47,722 47,654 Short-term borrowings 8,205 3,981 5,324 5,384 Other ST borrowings 5,406 6,209 5,427 5,224 Long-term borrowings 40,818 43,441 44,349 48,094 Equity 12,898 12,264 12,350 11,942
Source: Bloomberg
Table 417: Select financial metrics
FY 2007 FY 2008 FY 2009 FY 2010NIM n/a 2.8 2.3 1.9 ROA 0.8 0.1 0.2 0.1 ROE 8.2 0.6 2.4 1.5 ROC 1.7 0.2 0.5 0.3 C:I 65.0 77.7 68.5 73.9 Core capital 6.9 7.7 8.0 7.5
Source: Bloomberg
Cover pool overview
We set out below some of the key cover pool characteristics:
Table 418: Covered bond characteristics
As at 30 June 2011
S/M/FCovered Bond rating -/Aaa/AAAIssuer rating A/A1/A
Cover pool size (€) 8,590,439,273Number of loans 122,098Avg loan (€) 70,357
WA Current LTV (in %) 45.3 Remaining tenor (mths) 191.8 WA seasoning (mths) 59.8
Top three regions (%)Lombardia 60.3 Lazio 8.4 Piemonte 6.6
Floating rate (in %) 76.9 Fixed rate (in %) 23.1
Source: Investor Report
Table 419: Collateral pool LTV breakdown
Current LTV ranges As at 30 June 2011
0-<=40% 41.8 >40%-<=50% 15.8 >50%-<=60% 14.6 >60%-<=70% 13.7 >70%-<=80% 14.1
Source: Investor Report

180
Europe Credit Research12 September 2011
Gareth Davies, CFA(44-20) [email protected]
Flavio Marco Rusconi(44-20) [email protected]
Unicredit Group (‘Unicredit’)
(BBG: UCGIM)Snapshot
The UniCredit Group has its origins in Italy, which, together with Austria and Germany (through the acquisition of HvB), remains one of its key markets. Over the years the group has grown into one of the main European financial services groups, with a strong presence in Central and Eastern Europe. The group has a presence in 22 countries, with over 9,000 branches worldwide.
The Group offers a wide variety of financial products, ranging from retail to corporate and investment banking, organised along a number of divisions: Families & SME (F&SME), Private Banking (PB); Central & Eastern Europe (CEE), and Corporate & Investment Banking. (CIB).
Unicredit’s covered bonds are backed by Italian mortgages.
Financial performance
We set out below some of the key financial performance metrics:
Table 420: Key profit & loss figures, €mm
FY 2007 FY 2008 FY 2009 FY 2010Net interest income 13,114 19,710 17,732 16,475Provisions for loan losses 2,141 3,582 8,152 6,708NII less provisions 10,973 16,128 9,580 9,766
Comm.& fee income 11,354 11,125 9,424 10,210Other operating income 916 1,021 848 975Non-interest expense 18,208 19,904 18,654 19,524Operating profit (loss) 6,879 5,712 2,885 2,106
PBT 7,300 4,995 2,923 2,175Taxes 2,589 465 888 530Net profit (loss) 5,901 4,012 1,702 1,323
Source: Bloomberg
Table 421: Key balance sheet figures, €mm
FY 2007 FY 2008 FY 2009 FY 2010
Loans 552,933 598,923 549,037 546,089 Total Assets 1,021,835 1,045,612 928,760 929,488 Deposits 421,133 424,489 424,811 373,960 Short-term borrowings 162,568 179,336 108,413 113,003 Other ST borrowings 145,795 201,187 146,822 150,268 Long-term borrowings 206,816 164,032 151,114 168,792 Equity 62,434 58,240 62,892 67,703
Source: Bloomberg
Table 422: Select financial metrics
FY 2007 FY 2008 FY 2009 FY 2010NIM 1.5 2.0 1.9 1.9 ROA 0.6 0.4 0.2 0.1 ROE 12.3 7.1 3.0 2.1 ROC 1.6 1.1 0.5 0.4 C:I 64.4 65.8 60.5 66.8 Core capital 6.6 6.7 8.6 9.5
Source: Bloomberg
Cover pool overview
We set out below some of the key cover pool characteristics:
Table 423: Covered bond characteristics
As at 30 April 2011
S/M/FCovered Bond rating AAA/Aaa/AAAIssuer rating A/Aa3/A
Cover pool size (€) 13,171,755,547Number of loans 123,034Avg loan (€) 107,058
WA Current LTV (in %) 61.2 Remaining tenor (mths) 258.7 WA seasoning (mths) 36.5
Top three regions (%)Lombardia 22.0 Lazio 15.0 Piemonte 11.6
Floating rate (in %) 47.7Fixed rate (in %) 38.0 Other (in %) 14.3
Source: Investor Report
Table 424: Collateral pool LTV breakdown
Current LTV ranges As at 30 April 2011
0-<=40% 14.2>40%-<=50% 8.9>50%-<=60% 11.1>60%-<=70% 21.4>70%-<=80% 44.3
Source: Investor Report

181
Europe Credit Research12 September 2011
Gareth Davies, CFA(44-20) [email protected]
Flavio Marco Rusconi(44-20) [email protected]
Ko
rea
n C
ove
red
Bo
nd
s

182
Europe Credit Research12 September 2011
Gareth Davies, CFA(44-20) [email protected]
Flavio Marco Rusconi(44-20) [email protected]
Korean Covered Bonds
Legislative snapshot
A brief description of the two covered bond structures so far has been included in the respective issuer’s profile page.
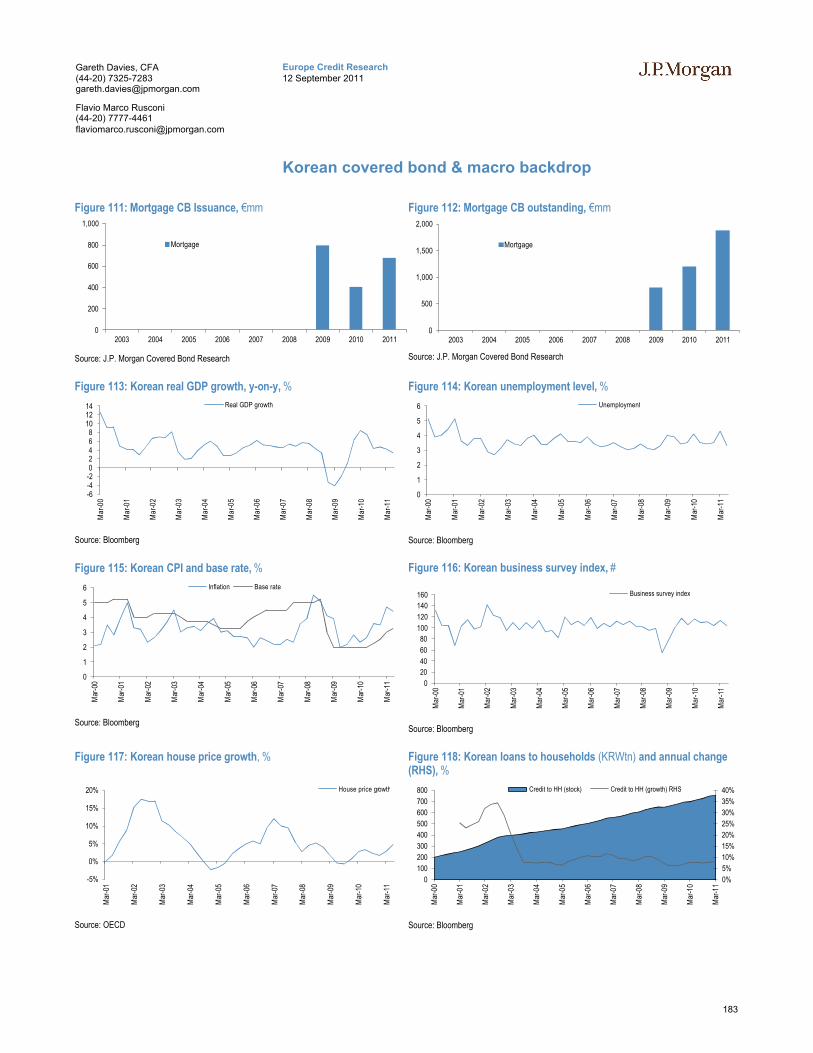
183
Europe Credit Research12 September 2011
Gareth Davies, CFA(44-20) [email protected]
Flavio Marco Rusconi(44-20) [email protected]
Korean covered bond & macro backdrop
Figure 111: Mortgage CB Issuance, €mm
Source: J.P. Morgan Covered Bond Research
Figure 112: Mortgage CB outstanding, €mm
Source: J.P. Morgan Covered Bond Research
Figure 113: Korean real GDP growth, y-on-y, %
Source: Bloomberg
Figure 114: Korean unemployment level, %
Source: Bloomberg
Figure 115: Korean CPI and base rate, %
Source: Bloomberg
Figure 116: Korean business survey index, #
Source: Bloomberg
Figure 117: Korean house price growth, %
Source: OECD
Figure 118: Korean loans to households (KRWtn) and annual change (RHS), %
Source: Bloomberg
0
200
400
600
800
1,000
2003 2004 2005 2006 2007 2008 2009 2010 2011
Mortgage
0
500
1,000
1,500
2,000
2003 2004 2005 2006 2007 2008 2009 2010 2011
Mortgage
-6-4-202468
101214
Mar
-00
Mar
-01
Mar
-02
Mar
-03
Mar
-04
Mar
-05
Mar
-06
Mar
-07
Mar
-08
Mar
-09
Mar
-10
Mar
-11
Real GDP growth
0
1
2
3
4
5
6
Mar
-00
Mar
-01
Mar
-02
Mar
-03
Mar
-04
Mar
-05
Mar
-06
Mar
-07
Mar
-08
Mar
-09
Mar
-10
Mar
-11
Unemployment
0
1
2
3
4
5
6
Mar
-00
Mar
-01
Mar
-02
Mar
-03
Mar
-04
Mar
-05
Mar
-06
Mar
-07
Mar
-08
Mar
-09
Mar
-10
Mar
-11
Inflation Base rate
0
20
40
60
80
100
120
140
160
Mar
-00
Mar
-01
Mar
-02
Mar
-03
Mar
-04
Mar
-05
Mar
-06
Mar
-07
Mar
-08
Mar
-09
Mar
-10
Mar
-11
Business survey index
-5%
0%
5%
10%
15%
20%
Mar
-01
Mar
-02
Mar
-03
Mar
-04
Mar
-05
Mar
-06
Mar
-07
Mar
-08
Mar
-09
Mar
-10
Mar
-11
House price growth
0%
5%
10%
15%
20%
25%
30%
35%
40%
0
100
200
300
400
500
600
700
800
Mar
-00
Mar
-01
Mar
-02
Mar
-03
Mar
-04
Mar
-05
Mar
-06
Mar
-07
Mar
-08
Mar
-09
Mar
-10
Mar
-11
Credit to HH (stock) Credit to HH (growth) RHS

184
Europe Credit Research12 September 2011
Gareth Davies, CFA(44-20) [email protected]
Flavio Marco Rusconi(44-20) [email protected]
Kookmin Bank
(BBG: CITNAT)Snapshot
Kookmin Bank is the largest bank in South Korea by assets and market capitalisation. It has a strong domestic presence (18.5% share of the deposits markets) and also a small, but growing international presence in Asia. The core business remains lending to individuals and SMEs: these constitute 57% and 36% of its domestic currency loan book while residential mortgages account for 44% of the lending to households.
As there is no specific covered bond legislation in Korea, the issuer adopted a securitisation-like structure, whereby the issuer will make a loan to a guarantor, which will in turn purchase the assets from the issuer via a trust and guarantee the bonds in case of default. The bonds are direct, unconditional, senior obligations of Kookmin and the bondholders have full dual recourse to the pool and the bank. The bonds are hard bullets, with no extension allowed in the prospectus. The asset percentage (AP) is set at 85% for mortgages; an amortisation test will be also carried out if there is a non-cured breach of the ACT.
The collateral pool initially included mortgages and credit card receivables. In December 2010, however, Kookmin decided to spin-off its credit card business into a new subsidiary of the group. With the consent of the noteholders, Kookmin repurchased the credit card receivables from the pool; the bonds are therefore currently backed by the mortgage assets and cash.
Financial performance
We set out below some of the key financial performance metrics:
Table 425: Key profit & loss figures, KRWmm
FY 2008 FY 2009 FY 2010Net interest income 7,298,904 6,288,439 5,241,222Provisions for loan losses 1,776,830 2,207,853 2,567,473NII less provisions 5,522,074 4,080,586 2,673,749
Comm.& fee income 1,412,415 1,324,506 1,046,735Other operating income 138,701 115,527 154,419Non-interest expense 5,259,183 5,088,616 4,870,546Operating profit 1,811,443 703,027 -787,931
PBT 2,158,289 660,471 -975,830Taxes 647,505 24,668 -311,148Net profit (loss) 1,510,784 635,803 11,200
Source: Bloomberg
Table 426: Key balance sheet figures, KRWmm
FY 2008 FY 2009 FY 2010
Loans 198,205,056 194,154,608 194,797,999Total Assets 262,093,168 256,519,760 254,861,755Deposits 158,867,920 170,385,872 182,518,858Short-term borrowings 19,095,720 13,843,061 11,408,783Other short-term borrowings 21,152,812 13,134,672 10,694,467Long-term borrowings 42,610,592 37,985,060 28,751,037Equity 17,314,094 19,342,558 19,360,739
Source: Bloomberg
Table 427: Select financial metrics
FY 2008 FY 2009 FY 2010
NIM 3.3 2.7 2.2ROA 0.6 0.2 0.0ROE 9.1 3.5 0.1ROC 2.1 0.8 0.0C:I 56.2 60.1 72.5Core Capital 10.9
Source: Bloomberg
Cover pool overview
We set out below some of the key cover pool characteristics:
Table 428: Covered bond characteristics
Ratings S/M/FCovered Bond rating AA/Aa1/-Issuer rating A/A1/-
Cover poolCover pool size (KRW) 1,413,314,337,848Outstanding liabilities (in KRW equivalent) 1,248,500,000,000
Number of loans 15,348Average loan balance (in KRW) 92,084,593WA seasoning (mths) 51 WA remaining term (mths) 275 WA LTV (in %) 45.2 >90days arrears (in %) 0.2
Source: Investor report
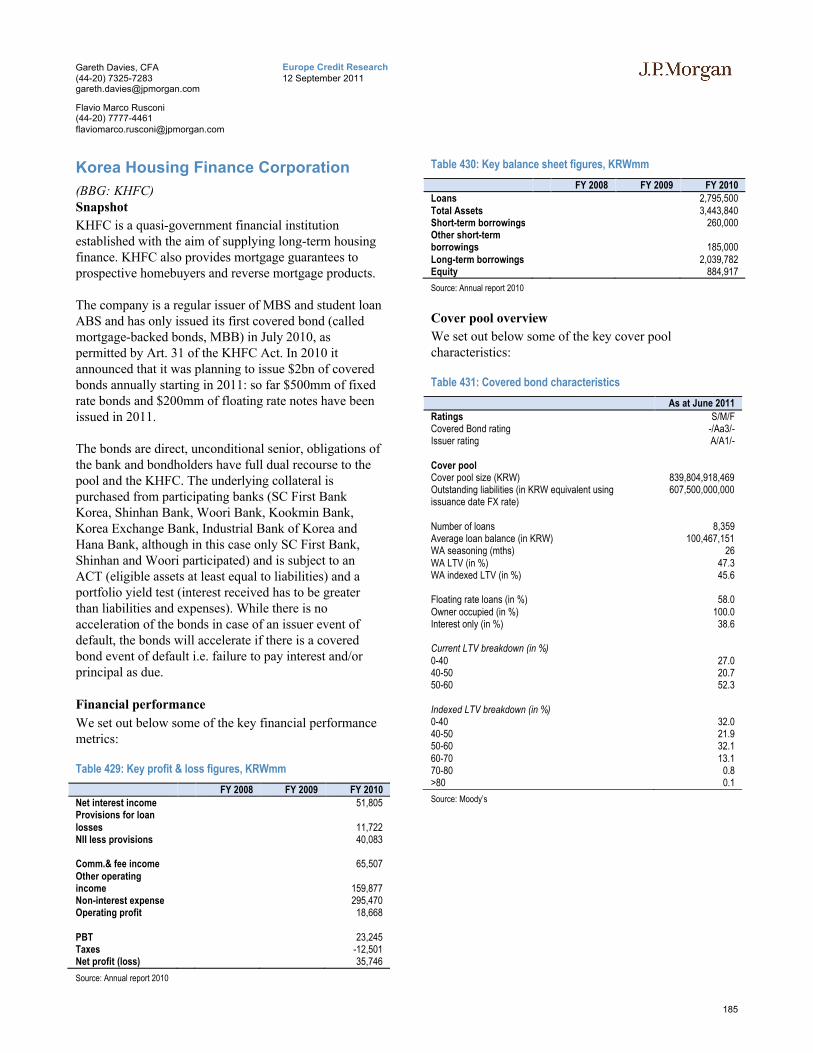
185
Europe Credit Research12 September 2011
Gareth Davies, CFA(44-20) [email protected]
Flavio Marco Rusconi(44-20) [email protected]
Korea Housing Finance Corporation
(BBG: KHFC)Snapshot
KHFC is a quasi-government financial institution established with the aim of supplying long-term housing finance. KHFC also provides mortgage guarantees to prospective homebuyers and reverse mortgage products.
The company is a regular issuer of MBS and student loan ABS and has only issued its first covered bond (called mortgage-backed bonds, MBB) in July 2010, as permitted by Art. 31 of the KHFC Act. In 2010 it announced that it was planning to issue $2bn of covered bonds annually starting in 2011: so far $500mm of fixed rate bonds and $200mm of floating rate notes have been issued in 2011.
The bonds are direct, unconditional senior, obligations of the bank and bondholders have full dual recourse to the pool and the KHFC. The underlying collateral is purchased from participating banks (SC First Bank Korea, Shinhan Bank, Woori Bank, Kookmin Bank, Korea Exchange Bank, Industrial Bank of Korea and Hana Bank, although in this case only SC First Bank, Shinhan and Woori participated) and is subject to an ACT (eligible assets at least equal to liabilities) and a portfolio yield test (interest received has to be greater than liabilities and expenses). While there is no acceleration of the bonds in case of an issuer event of default, the bonds will accelerate if there is a covered bond event of default i.e. failure to pay interest and/or principal as due.
Financial performance
We set out below some of the key financial performance metrics:
Table 429: Key profit & loss figures, KRWmm
FY 2008 FY 2009 FY 2010Net interest income 51,805Provisions for loan losses 11,722NII less provisions 40,083
Comm.& fee income 65,507Other operating income 159,877Non-interest expense 295,470Operating profit 18,668
PBT 23,245Taxes -12,501Net profit (loss) 35,746
Source: Annual report 2010
Table 430: Key balance sheet figures, KRWmm
FY 2008 FY 2009 FY 2010Loans 2,795,500 Total Assets 3,443,840 Short-term borrowings 260,000 Other short-term borrowings 185,000 Long-term borrowings 2,039,782 Equity 884,917
Source: Annual report 2010
Cover pool overview
We set out below some of the key cover pool characteristics:
Table 431: Covered bond characteristics
As at June 2011
Ratings S/M/FCovered Bond rating -/Aa3/-Issuer rating A/A1/-
Cover poolCover pool size (KRW) 839,804,918,469Outstanding liabilities (in KRW equivalent using issuance date FX rate)
607,500,000,000
Number of loans 8,359Average loan balance (in KRW) 100,467,151WA seasoning (mths) 26WA LTV (in %) 47.3 WA indexed LTV (in %) 45.6
Floating rate loans (in %) 58.0 Owner occupied (in %) 100.0 Interest only (in %) 38.6
Current LTV breakdown (in %)0-40 27.0 40-50 20.7 50-60 52.3
Indexed LTV breakdown (in %)0-40 32.0 40-50 21.9 50-60 32.1 60-70 13.1 70-80 0.8 >80 0.1
Source: Moody’s

186
Europe Credit Research12 September 2011
Gareth Davies, CFA(44-20) [email protected]
Flavio Marco Rusconi(44-20) [email protected]

187
Europe Credit Research12 September 2011
Gareth Davies, CFA(44-20) [email protected]
Flavio Marco Rusconi(44-20) [email protected]
Lu
xe
mb
ou
rgis
h C
ove
red
Bo
nd
s

188
Europe Credit Research12 September 2011
Gareth Davies, CFA(44-20) [email protected]
Flavio Marco Rusconi(44-20) [email protected]
Luxembourgish Covered Bonds
Legislative snapshot
We set out in Table 432a snapshot of key covered bond attributes in Luxembourg.
Table 432: Luxembourgish Covered Bond legislative overview
Attribute CommentaryFrameworkLegislative Framework Article 12-1 to 12-9 of the Law of April 5, 1993 on the Financial Sector and June 22, 2000 amendment to Law
of November 21, 1997 on banks issuing mortgage bonds. The Luxembourg Supervisory Authority (Commission de Surveillance du Secteur Financier, or CSSF) also released circular 01/42 on the rule for the appraisal of real estate and circular 03/95 on the maintenance of the cover register. Further amended in 2008.
Types of covered bonds Three types of collateral: public sector, mortgage and movable assets (ships, aircraft, railway).Structure of Issuer Direct issuance? Bonds are issued by a specialised credit institution.
Comments (if any) Covered bonds are issued by a specialised credit institution with a license from the financial services regulator.
Bankruptcy remoteness The issuer is required to keep a register of the cover pool, with one section for each type of collateral (and one section each for the three types of movable assets). If the issuer is declared bankrupt the assets in the cover pool are separated from other assets and do not become part of the estate.
Dual claim Yes. If the assets in the cover pool are not enough to repay the bonds when due, any outstanding claim ranks pari passu with the senior unsecured creditors of the issuer.
Bond format Fixed or floating rate, hard bullets.Supervision CSSF (Luxembourgish FSA).Cover pool
Eligible assets Mortgage Domestic, other EEA, other OECD residential and commercial loans. Senior MBS is also permitted as long as at least 90% the underlying collateral satisfies the cover pool criteria.
LTV caps 80% for residential loans and 60% for commercial loans. Both are hard caps.Public Sector Exposures to public sector entities in OECD jurisdictions or to multilateral development banks. Movable assets Ship loans, aircraft loans, other movable asset loans. Assets have to be registered in an OECD country. LTV
limit is 60% for all types of assets.Substitution Assets Substitution assets can make up to 20% of the pool and can be cash, loans, or bonds satisfying the
conditions.Hedging Derivatives can be used to reduce interest rate, currency and other market risks.Valuation Individual market values.Other comments (if any)
Requirements
ALM matching Asset coverage 2% OC has to be maintained at all times on a nominal and NPV basis. Interest coverage Natural matching and stress testing are used. Other (if any)
Consequence of breach Regulatory or rule-based actionsMonitoring Supervisory Authority, rating agencies and the appointed trustee/cover pool monitor.Other
Compliance with EU legislation
UCITS but not CRD compliant. Issuers can make their LdG CRD compliant by limiting their cover pool exposures to within the CRD limits.
Source: National legislation, J.P. Morgan Covered Bond Research

189
Europe Credit Research12 September 2011
Gareth Davies, CFA(44-20) [email protected]
Flavio Marco Rusconi(44-20) [email protected]
Luxembourgish covered bond backdrop
Figure 119: CB Issuance, €mm
Source: ECBC, latest data available
Figure 120: CB outstanding, €mm
Source: ECBC, latest data available
0
2,000
4,000
6,000
8,000
10,000
12,000
2003 2004 2005 2006 2007 2008 2009 2010
Mortgage Public Sector
0
5,000
10,000
15,000
20,000
25,000
30,000
35,000
40,000
2003 2004 2005 2006 2007 2008 2009 2010
Mortgage Public Sector
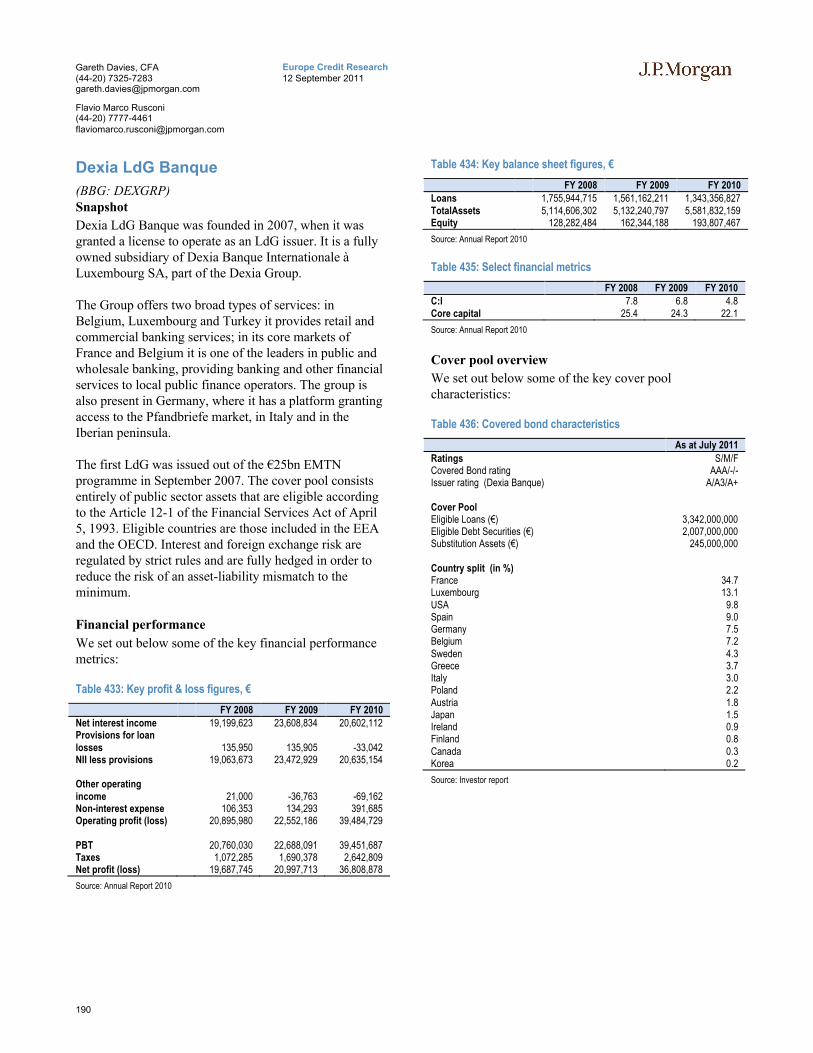
190
Europe Credit Research12 September 2011
Gareth Davies, CFA(44-20) [email protected]
Flavio Marco Rusconi(44-20) [email protected]
Dexia LdG Banque
(BBG: DEXGRP)Snapshot
Dexia LdG Banque was founded in 2007, when it was granted a license to operate as an LdG issuer. It is a fully owned subsidiary of Dexia Banque Internationale àLuxembourg SA, part of the Dexia Group.
The Group offers two broad types of services: in Belgium, Luxembourg and Turkey it provides retail and commercial banking services; in its core markets of France and Belgium it is one of the leaders in public and wholesale banking, providing banking and other financial services to local public finance operators. The group is also present in Germany, where it has a platform granting access to the Pfandbriefe market, in Italy and in the Iberian peninsula.
The first LdG was issued out of the €25bn EMTN programme in September 2007. The cover pool consists entirely of public sector assets that are eligible according to the Article 12-1 of the Financial Services Act of April 5, 1993. Eligible countries are those included in the EEA and the OECD. Interest and foreign exchange risk are regulated by strict rules and are fully hedged in order to reduce the risk of an asset-liability mismatch to the minimum.
Financial performance
We set out below some of the key financial performance metrics:
Table 433: Key profit & loss figures, €
FY 2008 FY 2009 FY 2010Net interest income 19,199,623 23,608,834 20,602,112Provisions for loan losses 135,950 135,905 -33,042NII less provisions 19,063,673 23,472,929 20,635,154
Other operating income 21,000 -36,763 -69,162Non-interest expense 106,353 134,293 391,685Operating profit (loss) 20,895,980 22,552,186 39,484,729
PBT 20,760,030 22,688,091 39,451,687Taxes 1,072,285 1,690,378 2,642,809Net profit (loss) 19,687,745 20,997,713 36,808,878
Source: Annual Report 2010
Table 434: Key balance sheet figures, €
FY 2008 FY 2009 FY 2010Loans 1,755,944,715 1,561,162,211 1,343,356,827TotalAssets 5,114,606,302 5,132,240,797 5,581,832,159Equity 128,282,484 162,344,188 193,807,467
Source: Annual Report 2010
Table 435: Select financial metrics
FY 2008 FY 2009 FY 2010C:I 7.8 6.8 4.8Core capital 25.4 24.3 22.1
Source: Annual Report 2010
Cover pool overview
We set out below some of the key cover pool characteristics:
Table 436: Covered bond characteristics
As at July 2011
Ratings S/M/FCovered Bond rating AAA/-/-Issuer rating (Dexia Banque) A/A3/A+
Cover PoolEligible Loans (€) 3,342,000,000Eligible Debt Securities (€) 2,007,000,000Substitution Assets (€) 245,000,000
Country split (in %)France 34.7Luxembourg 13.1USA 9.8Spain 9.0Germany 7.5Belgium 7.2Sweden 4.3Greece 3.7Italy 3.0Poland 2.2Austria 1.8Japan 1.5Ireland 0.9Finland 0.8Canada 0.3Korea 0.2
Source: Investor report
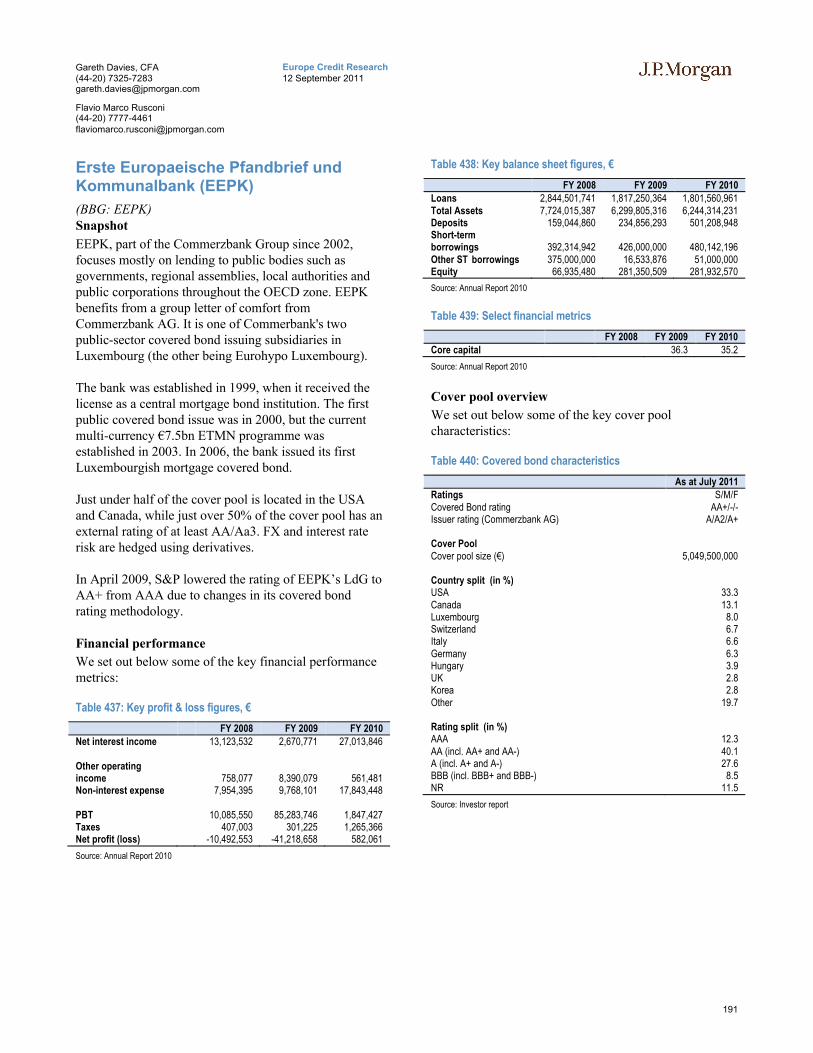
191
Europe Credit Research12 September 2011
Gareth Davies, CFA(44-20) [email protected]
Flavio Marco Rusconi(44-20) [email protected]
Erste Europaeische Pfandbrief und Kommunalbank (EEPK)
(BBG: EEPK)Snapshot
EEPK, part of the Commerzbank Group since 2002, focuses mostly on lending to public bodies such as governments, regional assemblies, local authorities and public corporations throughout the OECD zone. EEPK benefits from a group letter of comfort from Commerzbank AG. It is one of Commerbank's two public-sector covered bond issuing subsidiaries in Luxembourg (the other being Eurohypo Luxembourg).
The bank was established in 1999, when it received the license as a central mortgage bond institution. The first public covered bond issue was in 2000, but the current multi-currency €7.5bn ETMN programme was established in 2003. In 2006, the bank issued its first Luxembourgish mortgage covered bond.
Just under half of the cover pool is located in the USA and Canada, while just over 50% of the cover pool has an external rating of at least AA/Aa3. FX and interest rate risk are hedged using derivatives.
In April 2009, S&P lowered the rating of EEPK’s LdG to AA+ from AAA due to changes in its covered bond rating methodology.
Financial performance
We set out below some of the key financial performance metrics:
Table 437: Key profit & loss figures, €
FY 2008 FY 2009 FY 2010Net interest income 13,123,532 2,670,771 27,013,846
Other operating income 758,077 8,390,079 561,481Non-interest expense 7,954,395 9,768,101 17,843,448
PBT 10,085,550 85,283,746 1,847,427Taxes 407,003 301,225 1,265,366Net profit (loss) -10,492,553 -41,218,658 582,061
Source: Annual Report 2010
Table 438: Key balance sheet figures, €
FY 2008 FY 2009 FY 2010Loans 2,844,501,741 1,817,250,364 1,801,560,961Total Assets 7,724,015,387 6,299,805,316 6,244,314,231Deposits 159,044,860 234,856,293 501,208,948Short-term borrowings 392,314,942 426,000,000 480,142,196Other ST borrowings 375,000,000 16,533,876 51,000,000Equity 66,935,480 281,350,509 281,932,570
Source: Annual Report 2010
Table 439: Select financial metrics
FY 2008 FY 2009 FY 2010Core capital 36.3 35.2
Source: Annual Report 2010
Cover pool overview
We set out below some of the key cover pool characteristics:
Table 440: Covered bond characteristics
As at July 2011Ratings S/M/FCovered Bond rating AA+/-/-Issuer rating (Commerzbank AG) A/A2/A+
Cover PoolCover pool size (€) 5,049,500,000
Country split (in %)USA 33.3 Canada 13.1 Luxembourg 8.0 Switzerland 6.7 Italy 6.6 Germany 6.3 Hungary 3.9 UK 2.8 Korea 2.8 Other 19.7
Rating split (in %)AAA 12.3 AA (incl. AA+ and AA-) 40.1 A (incl. A+ and A-) 27.6 BBB (incl. BBB+ and BBB-) 8.5 NR 11.5
Source: Investor report

192
Europe Credit Research12 September 2011
Gareth Davies, CFA(44-20) [email protected]
Flavio Marco Rusconi(44-20) [email protected]
Eurohypo Luxembourg SA
(BBG: EURHYP)Snapshot
Eurohypo Europaische Hypothekenbank (Eurohypo Luxembourg SA) focuses on public lending to EU, EEA and OECD countries and is Luxembourg’s largest mortgage bank. Unlike its parent, which operates mainly with sovereigns and sub-sovereigns in the EEA, Switzerland, Canada and Japan, Eurohypo Luxembourg is active on a more international scale, offering public sector finance to sovereigns and sub-sovereigns in a wider range of OECD countries.
Eurohypo Luxembourg was founded in 1989 and initially conducted general banking until it received its special purpose banking license in 1999. It has a market share of more than 50% in terms of volume of LdG in circulation. The assets in the cover pool are largely investment grade and mostly independent from any monoline rating. Eurohypo Luxembourg and its parent are today part of the Commerzbank Group, and are timetabled to be divested by 2014 as part of the EU conditions for approval of state aid from the German taxpayer.
Financial performance
We set out below some of the key financial performance metrics:
Table 441: Key profit & loss figures, €
FY 2008 FY 2009 FY 2010Net interest income 70,028,000 39,721,000Provisions for loan losses 2,495,000 -1,613,000NII less provisions 67,533,000 41,334,000
Other operating income -877,000 -1,566,000Non-interest expense 7,203,000 7,083,000Operating profit (loss) 72,996,000 26,178,000
PBT 60,184,000 -37,753,000Taxes -14,493,000 14,959,000Net profit (loss) 45,691,000 -22,794,000
Source: Annual Report 2010
Table 442: Key balance sheet figures, €
FY 2008 FY 2009 FY 2010
Commercial Loans 2,329,648,000 3,420,363,000Consumer Loans 4,216,946,000 4,373,569,000Loans 6,546,594,000 7,793,932,000Total Assets 24,902,863,000 25,798,686,000Deposits 490,517,000 476,699,000LT borrowings 7,504,934,000 9,450,687,000Equity 159,393,000 92,955,000
Source: Annual Report 2010
Cover pool overview
We set out below some of the key cover pool characteristics:
Table 443: Covered bond characteristics
As at June 2011
Ratings S/M/FCovered Bond rating AAA/-/AAAIssuer rating A-/-/A-
Cover PoolCover pool size (€) 13,154,000,000Public debtor debt (in %) 51.0 LdG debt (in %) 43.3 Over-collateralisation (in %) 5.8
Country split (in %)USA 18.0 GBR 15.7 Germany 16.6 Canada 11.7 Switzerland 10.4 Spain 6.3 Italy 5.4 Other 15.8
Europe 64.4 North America 29.7 Asia 2.4 Supra 3.5
Split by guarantee (in %)Not wrapped 90.1 MBIA 3.6 XL 0.3 AMBAC 0.5 FGIC 2.7 FSA 2.8
S&P Rating split (in %)AAA 24.9 AA (incl. AA+ and AA-) 15.6 A (incl. A+ and A-) 18.2 BBB (incl. BBB+ and BBB-) 1.0 Below BBB or NR/Internal rating only 40.3
Fitch Rating split (in %)AAA 18.5 AA (incl. AA+ and AA-) 17.3 A (incl. A+ and A-) 8.0 BBB (incl. BBB+ and BBB-) 0.8 Below BBB or NR/Internal rating only 55.4
Source: Investor report
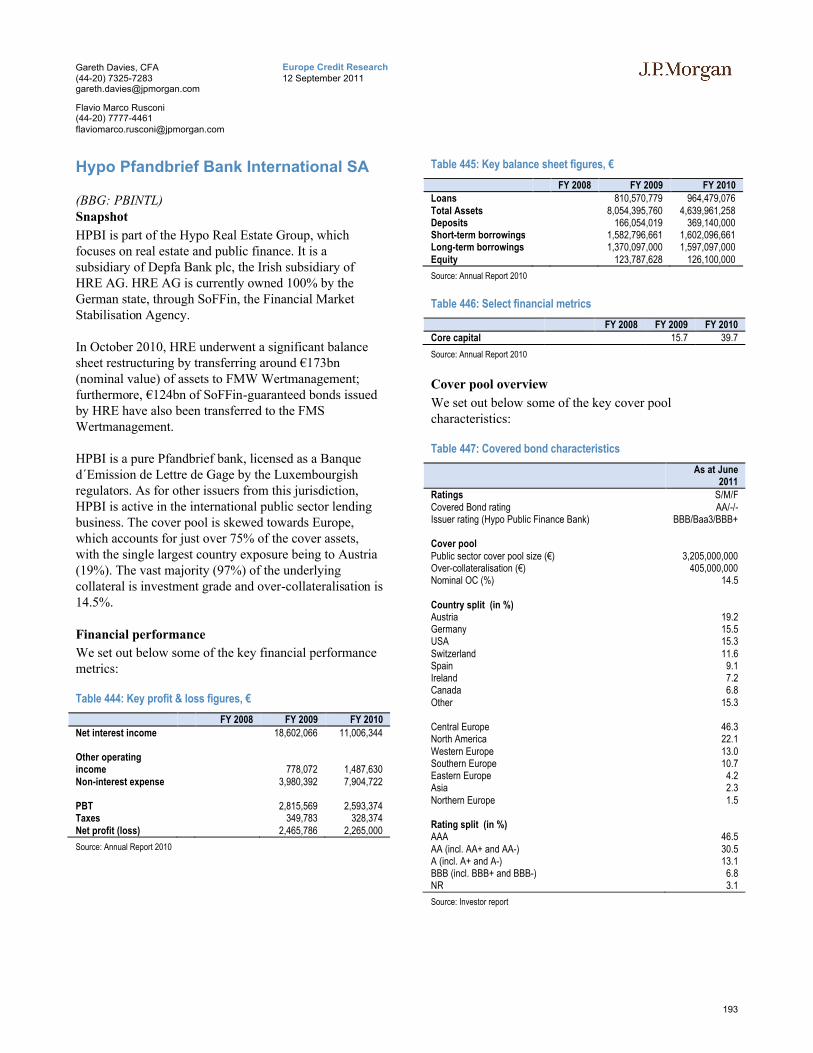
193
Europe Credit Research12 September 2011
Gareth Davies, CFA(44-20) [email protected]
Flavio Marco Rusconi(44-20) [email protected]
Hypo Pfandbrief Bank International SA
(BBG: PBINTL)Snapshot
HPBI is part of the Hypo Real Estate Group, which focuses on real estate and public finance. It is a subsidiary of Depfa Bank plc, the Irish subsidiary of HRE AG. HRE AG is currently owned 100% by the German state, through SoFFin, the Financial Market Stabilisation Agency.
In October 2010, HRE underwent a significant balance sheet restructuring by transferring around €173bn (nominal value) of assets to FMW Wertmanagement; furthermore, €124bn of SoFFin-guaranteed bonds issued by HRE have also been transferred to the FMS Wertmanagement.
HPBI is a pure Pfandbrief bank, licensed as a Banque d´Emission de Lettre de Gage by the Luxembourgish regulators. As for other issuers from this jurisdiction, HPBI is active in the international public sector lending business. The cover pool is skewed towards Europe, which accounts for just over 75% of the cover assets, with the single largest country exposure being to Austria (19%). The vast majority (97%) of the underlying collateral is investment grade and over-collateralisation is 14.5%.
Financial performance
We set out below some of the key financial performance metrics:
Table 444: Key profit & loss figures, €
FY 2008 FY 2009 FY 2010
Net interest income 18,602,066 11,006,344
Other operating income 778,072 1,487,630Non-interest expense 3,980,392 7,904,722
PBT 2,815,569 2,593,374Taxes 349,783 328,374Net profit (loss) 2,465,786 2,265,000
Source: Annual Report 2010
Table 445: Key balance sheet figures, €
FY 2008 FY 2009 FY 2010Loans 810,570,779 964,479,076Total Assets 8,054,395,760 4,639,961,258Deposits 166,054,019 369,140,000Short-term borrowings 1,582,796,661 1,602,096,661Long-term borrowings 1,370,097,000 1,597,097,000Equity 123,787,628 126,100,000
Source: Annual Report 2010
Table 446: Select financial metrics
FY 2008 FY 2009 FY 2010Core capital 15.7 39.7
Source: Annual Report 2010
Cover pool overview
We set out below some of the key cover pool characteristics:
Table 447: Covered bond characteristics
As at June 2011
Ratings S/M/FCovered Bond rating AA/-/-Issuer rating (Hypo Public Finance Bank) BBB/Baa3/BBB+
Cover poolPublic sector cover pool size (€) 3,205,000,000Over-collateralisation (€) 405,000,000Nominal OC (%) 14.5
Country split (in %)Austria 19.2 Germany 15.5 USA 15.3 Switzerland 11.6 Spain 9.1 Ireland 7.2 Canada 6.8 Other 15.3
Central Europe 46.3 North America 22.1 Western Europe 13.0 Southern Europe 10.7 Eastern Europe 4.2 Asia 2.3 Northern Europe 1.5
Rating split (in %)AAA 46.5 AA (incl. AA+ and AA-) 30.5 A (incl. A+ and A-) 13.1 BBB (incl. BBB+ and BBB-) 6.8 NR 3.1
Source: Investor report
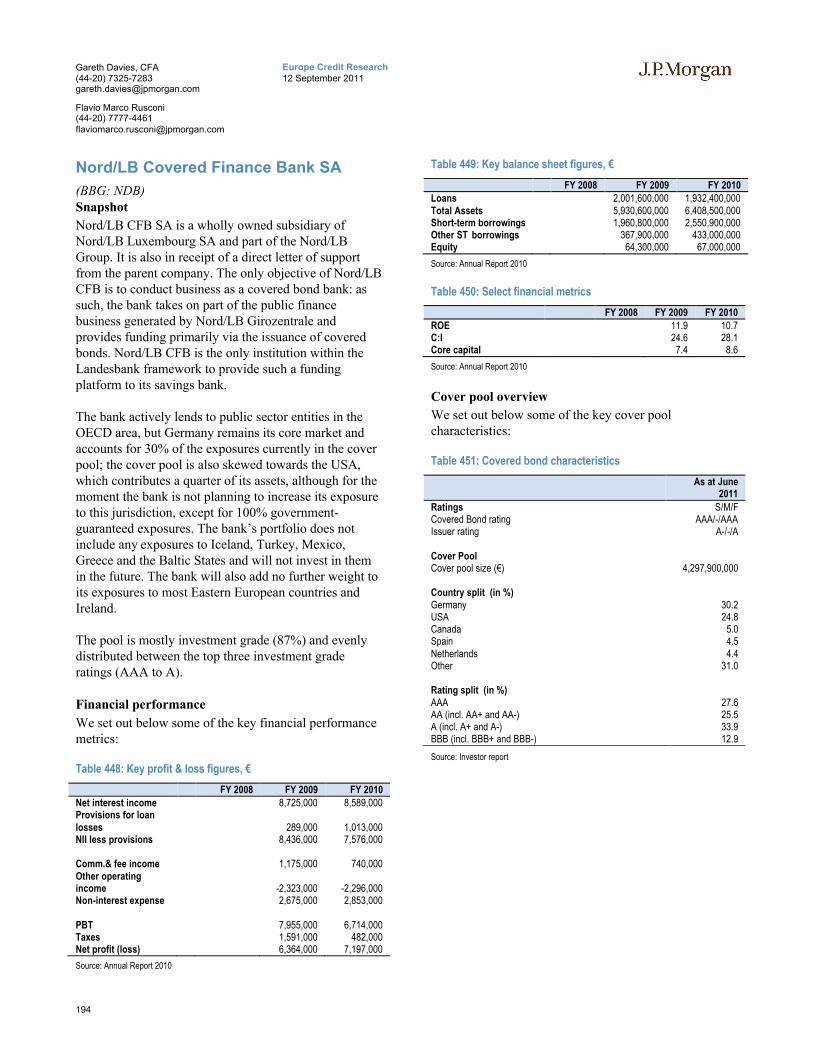
194
Europe Credit Research12 September 2011
Gareth Davies, CFA(44-20) [email protected]
Flavio Marco Rusconi(44-20) [email protected]
Nord/LB Covered Finance Bank SA
(BBG: NDB)Snapshot
Nord/LB CFB SA is a wholly owned subsidiary of Nord/LB Luxembourg SA and part of the Nord/LB Group. It is also in receipt of a direct letter of support from the parent company. The only objective of Nord/LB CFB is to conduct business as a covered bond bank: as such, the bank takes on part of the public finance business generated by Nord/LB Girozentrale and provides funding primarily via the issuance of covered bonds. Nord/LB CFB is the only institution within the Landesbank framework to provide such a funding platform to its savings bank.
The bank actively lends to public sector entities in the OECD area, but Germany remains its core market and accounts for 30% of the exposures currently in the cover pool; the cover pool is also skewed towards the USA, which contributes a quarter of its assets, although for the moment the bank is not planning to increase its exposure to this jurisdiction, except for 100% government-guaranteed exposures. The bank’s portfolio does not include any exposures to Iceland, Turkey, Mexico, Greece and the Baltic States and will not invest in them in the future. The bank will also add no further weight to its exposures to most Eastern European countries and Ireland.
The pool is mostly investment grade (87%) and evenly distributed between the top three investment grade ratings (AAA to A).
Financial performance
We set out below some of the key financial performance metrics:
Table 448: Key profit & loss figures, €
FY 2008 FY 2009 FY 2010Net interest income 8,725,000 8,589,000Provisions for loan losses 289,000 1,013,000NII less provisions 8,436,000 7,576,000
Comm.& fee income 1,175,000 740,000Other operating income -2,323,000 -2,296,000Non-interest expense 2,675,000 2,853,000
PBT 7,955,000 6,714,000Taxes 1,591,000 482,000Net profit (loss) 6,364,000 7,197,000
Source: Annual Report 2010
Table 449: Key balance sheet figures, €
FY 2008 FY 2009 FY 2010Loans 2,001,600,000 1,932,400,000Total Assets 5,930,600,000 6,408,500,000Short-term borrowings 1,960,800,000 2,550,900,000Other ST borrowings 367,900,000 433,000,000Equity 64,300,000 67,000,000
Source: Annual Report 2010
Table 450: Select financial metrics
FY 2008 FY 2009 FY 2010ROE 11.9 10.7C:I 24.6 28.1Core capital 7.4 8.6
Source: Annual Report 2010
Cover pool overview
We set out below some of the key cover pool characteristics:
Table 451: Covered bond characteristics
As at June 2011
Ratings S/M/FCovered Bond rating AAA/-/AAAIssuer rating A-/-/A
Cover PoolCover pool size (€) 4,297,900,000
Country split (in %)Germany 30.2 USA 24.8 Canada 5.0 Spain 4.5 Netherlands 4.4 Other 31.0
Rating split (in %)AAA 27.6 AA (incl. AA+ and AA-) 25.5 A (incl. A+ and A-) 33.9 BBB (incl. BBB+ and BBB-) 12.9
Source: Investor report

195
Europe Credit Research12 September 2011
Gareth Davies, CFA(44-20) [email protected]
Flavio Marco Rusconi(44-20) [email protected]
Ne
w Z
ea
lan
d C
ove
red
Bo
nd
s

196
Europe Credit Research12 September 2011
Gareth Davies, CFA(44-20) [email protected]
Flavio Marco Rusconi(44-20) [email protected]
New Zealand Covered Bonds
Legislative snapshot
There is no special covered bond legislation in New Zealand. Therefore, since only two banks have issued covered bonds so far, we provide a brief overview of the structure of each programme in the issuer profiles section below.
In October and November 2010 the Reserve Bank of New Zealand opened a consultation period in order to evaluate the potential introduction of a legislative framework and a uniform covered bond structure. The first result of the consultation was the imposition in March 2011 of a 10% limit on the issuance of covered bonds by locally-incorporated banks.

197
Europe Credit Research12 September 2011
Gareth Davies, CFA(44-20) [email protected]
Flavio Marco Rusconi(44-20) [email protected]
New Zealand covered bond & macro backdrop
Figure 121: CB Issuance, €mm
Source: ECBC, latest data available
Figure 122: CN Outstanding, €mm
Source: ECBC, latest data available
Figure 123: New Zealand real GDP growth, y-on-y, %
Source: Bloomberg
Figure 124: New Zealand unemployment level, %
Source: Bloomberg
Figure 125: New Zealand CPI and base rate, %
Source: Bloomberg
Figure 126: New Zealand consumer confidence index, #
Source: Bloomberg
Figure 127: New Zealand house price growth, %
Source: OECD
Figure 128: New Zealand dwelling sales, #
Source: Bloomberg
0
200
400
600
800
1,000
1,200
1,400
2003 2004 2005 2006 2007 2008 2009 2010
Mortgage
0
200
400
600
800
1,000
1,200
1,400
2003 2004 2005 2006 2007 2008 2009 2010
Mortgage
-4
-2
0
2
4
6
8
Mar
-00
Mar
-01
Mar
-02
Mar
-03
Mar
-04
Mar
-05
Mar
-06
Mar
-07
Mar
-08
Mar
-09
Mar
-10
Mar
-11
Real GDP growth
0
1
2
3
4
5
6
7
8
Mar
-00
Mar
-01
Mar
-02
Mar
-03
Mar
-04
Mar
-05
Mar
-06
Mar
-07
Mar
-08
Mar
-09
Mar
-10
Mar
-11
Unemployment
0123456789
Mar
-00
Mar
-01
Mar
-02
Mar
-03
Mar
-04
Mar
-05
Mar
-06
Mar
-07
Mar
-08
Mar
-09
Mar
-10
Mar
-11
Inflation Base rate
0
20
40
60
80
100
120
140
Mar
-00
Mar
-01
Mar
-02
Mar
-03
Mar
-04
Mar
-05
Mar
-06
Mar
-07
Mar
-08
Mar
-09
Mar
-10
Mar
-11
Cons. Confidence
-15%-10%
-5%0%5%
10%15%20%25%30%
Mar
-01
Mar
-02
Mar
-03
Mar
-04
Mar
-05
Mar
-06
Mar
-07
Mar
-08
Mar
-09
Mar
-10
Mar
-11
House price growth
0
2,000
4,000
6,000
8,000
10,000
12,000
Jan-
00
Jan-
01
Jan-
02
Jan-
03
Jan-
04
Jan-
05
Jan-
06
Jan-
07
Jan-
08
Jan-
09
Jan-
10
Jan-
11
Dwelling sales
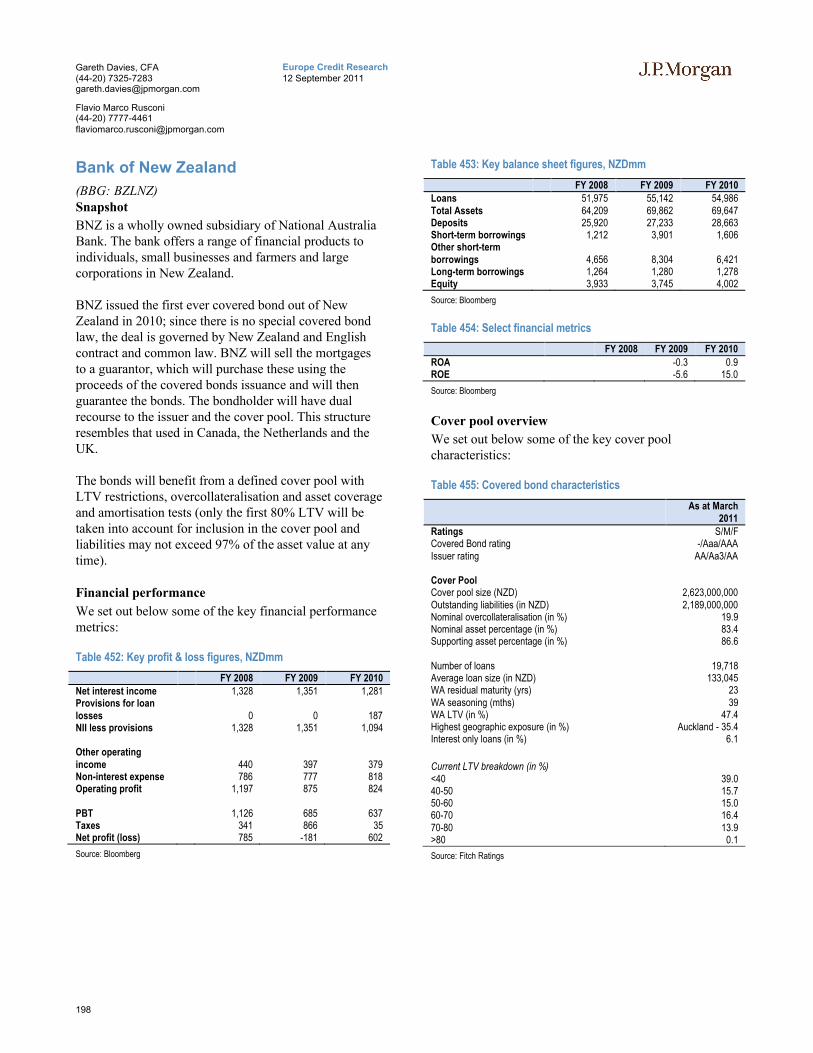
198
Europe Credit Research12 September 2011
Gareth Davies, CFA(44-20) [email protected]
Flavio Marco Rusconi(44-20) [email protected]
Bank of New Zealand
(BBG: BZLNZ)Snapshot
BNZ is a wholly owned subsidiary of National Australia Bank. The bank offers a range of financial products to individuals, small businesses and farmers and large corporations in New Zealand.
BNZ issued the first ever covered bond out of New Zealand in 2010; since there is no special covered bond law, the deal is governed by New Zealand and English contract and common law. BNZ will sell the mortgages to a guarantor, which will purchase these using the proceeds of the covered bonds issuance and will then guarantee the bonds. The bondholder will have dual recourse to the issuer and the cover pool. This structure resembles that used in Canada, the Netherlands and the UK.
The bonds will benefit from a defined cover pool with LTV restrictions, overcollateralisation and asset coverage and amortisation tests (only the first 80% LTV will be taken into account for inclusion in the cover pool and liabilities may not exceed 97% of the asset value at any time).
Financial performance
We set out below some of the key financial performance metrics:
Table 452: Key profit & loss figures, NZDmm
FY 2008 FY 2009 FY 2010Net interest income 1,328 1,351 1,281Provisions for loan losses 0 0 187NII less provisions 1,328 1,351 1,094
Other operating income 440 397 379Non-interest expense 786 777 818Operating profit 1,197 875 824
PBT 1,126 685 637Taxes 341 866 35Net profit (loss) 785 -181 602
Source: Bloomberg
Table 453: Key balance sheet figures, NZDmm
FY 2008 FY 2009 FY 2010Loans 51,975 55,142 54,986 Total Assets 64,209 69,862 69,647 Deposits 25,920 27,233 28,663 Short-term borrowings 1,212 3,901 1,606 Other short-term borrowings 4,656 8,304 6,421 Long-term borrowings 1,264 1,280 1,278 Equity 3,933 3,745 4,002
Source: Bloomberg
Table 454: Select financial metrics
FY 2008 FY 2009 FY 2010
ROA -0.3 0.9ROE -5.6 15.0
Source: Bloomberg
Cover pool overview
We set out below some of the key cover pool characteristics:
Table 455: Covered bond characteristics
As at March 2011
Ratings S/M/FCovered Bond rating -/Aaa/AAAIssuer rating AA/Aa3/AA
Cover PoolCover pool size (NZD) 2,623,000,000Outstanding liabilities (in NZD) 2,189,000,000Nominal overcollateralisation (in %) 19.9 Nominal asset percentage (in %) 83.4 Supporting asset percentage (in %) 86.6
Number of loans 19,718 Average loan size (in NZD) 133,045 WA residual maturity (yrs) 23 WA seasoning (mths) 39 WA LTV (in %) 47.4 Highest geographic exposure (in %) Auckland - 35.4 Interest only loans (in %) 6.1
Current LTV breakdown (in %)<40 39.0 40-50 15.7 50-60 15.0 60-70 16.4 70-80 13.9 >80 0.1
Source: Fitch Ratings

199
Europe Credit Research12 September 2011
Gareth Davies, CFA(44-20) [email protected]
Flavio Marco Rusconi(44-20) [email protected]
Westpac New Zealand
(BBG: WSTP)Snapshot
Westpac New Zealand is part of the Westpac Banking Corporation, the Australian financial services group. In New Zealand the bank offers a range of financial products to individuals, farmers and SMEs and corporate and institutional clients.
As for BNZ, Westpac New Zealand covered bonds use a securitisation-like structure. The bonds are direct, unconditional and senior obligations of Westpac New Zealand and the bondholders have full dual recourse to the cover pool and the issuer. Westpac needs to maintain an asset percentage of 90%, which translates into a committed OC of 11%. Only the first 75% LTV will be considered for the asset coverage test.
Financial performance
We set out below some of the key financial performance metrics:
Table 456: Key profit & loss figures (Westpac Group), AUDmm
FY 2008 FY 2009 FY 2010Net interest income 7,237 11,667 11,867Provisions for loan losses 931 3,238 1,456NII less provisions 6,306 8,429 10,411
Comm.& fee income 2,060 2,637 2,433Other operating income 1,034 1,254 1,699Non-interest expense 5,313 7,053 7,360Operating profit 4,904 6,222 8,048
PBT 5,219 6,096 8,038Taxes 1,287 2,579 1,626Net profit (loss) 3,859 3,446 6,346
Source: Bloomberg
Table 457: Key balance sheet figures (Westpac Group), AUDmm
FY 2008 FY 2009 FY 2010Loans 313,545 463,459 477,655Total Assets 439,676 589,587 618,277Deposits 233,730 329,456 337,385Short-term borrowings 83,402 70,394 66,745Other short-term borrowings 19,541 27,252 30,853Long-term borrowings 54,264 92,180 106,971Equity 19,471 36,571 40,118
Source: Bloomberg
Table 458: Select financial metrics (Westpac Group)
FY 2008 FY 2009 FY 2010NIM 2.0 2.6 2.2ROA 0.9 0.7 1.1ROE 23.1 13.2 17.4ROC 2.8 2.0 3.1C:I 47.7 42.7 43.6Core Capital 7.8 8.1 9.1
Source: Bloomberg
Cover pool overview
We set out below some of the key cover pool characteristics:
Table 459: Covered bond characteristics
As at July 2011
Ratings S/M/FCovered Bond rating -/Aaa/AAAIssuer rating AA/Aa3/AA
Cover PoolCover pool size (NZD) 2,750,000,000Outstanding liabilities (in NZD) 1,774,408,732Asset percenatge (%) 84.5Asset coverage ratio (%) 131.8
Number of loans 22,359Average loan size (in NZD) 117,184WA residual maturity (mths) 276WA seasoning (mths) 33WA Current LTV Limit (%) 57.2 WA Current LTV (%) 55.7
Interest only (%) 12.4 Fixed rate loans (%) 67.6 Largest concentration (%) Auckland - 22.1
LTV limit breakdown (in %)0-50 47.7 50-55 5.8 55-60 6.4 60-65 7.0 65-70 7.9 70-75 9.4 75-80 15.5 >80 0.3
Current LTV breakdown (in %)0-50 50.5 50-55 6.1 55-60 6.0 60-65 7.1 65-70 7.8 70-75 9.6 75-80 13.0
Source: Fitch Ratings

200
Europe Credit Research12 September 2011
Gareth Davies, CFA(44-20) [email protected]
Flavio Marco Rusconi(44-20) [email protected]

201
Europe Credit Research12 September 2011
Gareth Davies, CFA(44-20) [email protected]
Flavio Marco Rusconi(44-20) [email protected]
No
rwe
gia
n C
ove
red
Bo
nd
s

202
Europe Credit Research12 September 2011
Gareth Davies, CFA(44-20) [email protected]
Flavio Marco Rusconi(44-20) [email protected]
Norwegian Covered Bonds
Legislative snapshot
We set out in Table 460 a snapshot of key covered bond attributes in the Norway.
Table 460: Norwegian Covered Bond legislative overview
Attribute CommentaryFrameworkLegislative Framework Act on Financing Activity and Financial Institutions (No. 40 of 10 June 1988), as amended in 2007 (No. 11 of
6 March 2007), along with accompanying regulationsTypes of covered bonds OneStructure of Issuer Direct issuance? No
Comments (if any) Norwegian covered bonds are issued by specialised mortgage credit institutions ('Boligkreditt'), special purpose subsidiaries of the main lenders with restricted business activities. They have a license from the Norwegian FSA (specialist banking principle)
Bankruptcy remoteness Segregation of assets in a special cover register, with a preferential claim on register collateral. Insolvency of the issuer does not necessarily result in acceleration of the outstanding liabilities. If however the Cover Pool fails to meet the requirements of the Act, the holders of CB benefit from a priority claim over the proceeds of a sale of the assets in the cover pool. In this case, the CB investors retain the benefit of any shortfall claim against the issuing institution which ranks pari passu with other senior, unsecured claims
Dual claim Yes. To the special purpose subsidiary onlyBond format Typically, fixed rate, with a mix of hard and soft bullets bonds, with the ability to extend maturities by up to 12
months at the discretion of the issuerSupervision Kredittilsynet (Norwegian FSA)Cover pool
Eligible assets Mortgage Loans can be originated by the issuer, by the parent bank or from another bank. Residential mortgages, commercial mortgages issued in the EEA or OECD can be included in the cover pools
LTV caps "Hard" (loans above the maximum can not be included in the cover pool). Residential (up to 75% LTV) and commercial (up to 60% LTV) mortgages for inclusion in the cover pool
Public Sector Public sector assets must be granted to or guaranteed by a public body in either the EEA or OECDNon-performing collateral NPLs greater than 90d must be removed from the cover pool calculationsSubstitution Assets Up to 20% of cover pool can be substitute assets (30% can be temporarily allowed)
Hedging Used to minimise interest rate, currency, credit or other risksValuation Individual market values. Should LTVs rise above the maximum thresholds set out above through falling
property valuations, the portion of the mortgage loan under these maximum levels may be included in the cover pool calculations, while bondholders continue to benefit from the collateral amount above these thresholds
Other comments (if any) All assets must be recorded in a cover pool registerRequirements
ALM matching Asset coverage The nominal value of the cover pool must at all times exceed the aggregate value of claims under the covered bonds. NPV of cover pool should always remain above that of the liabilities; cashflows from pool and derivatives should be enough to cover payments on liabilities and derivatives; FX risk should be hedged and the issuer must set limits for cashflow mismatches using a parallel +/- 100bp shift in the curve. Over-collateralisation requirements are not defined by legislation (voluntary over-collateralisation is protected to the benefit of CB investors)
Interest coverage The CB issuer must ensure that the payment flows from the cover pool enable the mortgage credit institution to honour its payment obligations towards holders of covered bonds and counterparties to derivative contracts
Other (if any) No mandatory OC, but voluntary OC is considered bankruptcy remoteConsequence of breach Tests must be complied withMonitoring Kredittilsynet (Norwegian FSA) appoints an independent party to check that the value of the cover pool
exceeds that of the claims and that the register is in accordance with the laws and regulations.Other
Compliance with EU legislation
UCITS and CRD compliant.
Source: National legislation, J.P. Morgan Covered Bond Research

203
Europe Credit Research12 September 2011
Gareth Davies, CFA(44-20) [email protected]
Flavio Marco Rusconi(44-20) [email protected]
Norwegian covered bond & macro backdrop
Figure 129: CB issuance, €mm
Source: ECBC. Latest data available displayed
Figure 130: CB outstanding, €mm
Source: ECBC. Latest data available displayed
Figure 131: Norwegian real GDP growth, y-on-y, %
Source: Bloomberg
Figure 132: Norwegian unemployment level, %
Source: Bloomberg
Figure 133: Norwegian CPI and base rate, %
Source: Bloomberg
Figure 134: Norwegian consumer confidence, balance of survey
Source: Bloomberg
Figure 135: Norwegian house price growth, y-on-y, %
Source: Bloomberg
Figure 136: Norwegian building permits, #
Source: Bloomberg
0
5,000
10,000
15,000
20,000
25,000
30,000
35,000
2003 2004 2005 2006 2007 2008 2009 2010
Mortgage Public Sector
0
10,000
20,000
30,000
40,000
50,000
60,000
70,000
80,000
2003 2004 2005 2006 2007 2008 2009 2010
Mortgage Public Sector
-3
-2
-1
0
1
2
3
4
5
Mar
-00
Mar
-01
Mar
-02
Mar
-03
Mar
-04
Mar
-05
Mar
-06
Mar
-07
Mar
-08
Mar
-09
Mar
-10
Mar
-11
Real GDP growth
0112233445
Mar
-00
Mar
-01
Mar
-02
Mar
-03
Mar
-04
Mar
-05
Mar
-06
Mar
-07
Mar
-08
Mar
-09
Mar
-10
Mar
-11
Unemployment
-1012345678
Mar
-00
Mar
-01
Mar
-02
Mar
-03
Mar
-04
Mar
-05
Mar
-06
Mar
-07
Mar
-08
Mar
-09
Mar
-10
Mar
-11
Inflation Base rate
-15-10-505
101520253035
Mar
-00
Mar
-01
Mar
-02
Mar
-03
Mar
-04
Mar
-05
Mar
-06
Mar
-07
Mar
-08
Mar
-09
Mar
-10
Mar
-11
Consumer confidence
-10%
-5%
0%
5%
10%
15%
20%
Mar
-01
Mar
-02
Mar
-03
Mar
-04
Mar
-05
Mar
-06
Mar
-07
Mar
-08
Mar
-09
Mar
-10
Mar
-11
OECD HP nominal growth
0
20
40
60
80
100
120
Mar
-00
Mar
-01
Mar
-02
Mar
-03
Mar
-04
Mar
-05
Mar
-06
Mar
-07
Mar
-08
Mar
-09
Mar
-10
Mar
-11
OECD Building permits index

204
Europe Credit Research12 September 2011
Gareth Davies, CFA(44-20) [email protected]
Flavio Marco Rusconi(44-20) [email protected]
DnB NOR Boligkreditt ASA (‘DNB’)
(BBG: DNBNOR)Snapshot
DnB NOR Boligkreditt (‘DNB’) is the covered bond issuer set up by DnB NOR Bank ASA, Norway’s leading financial services group. DnB NOR has a 30% market share of the retail lending market and accounts for 35% of corporate lending in Norway. It is 34% owned by the Norwegian Government.
The covered bond programme, set up in June 2007, is rated AAA by all three agencies and totals around €40bn. The pool is entirely backed by Norwegian residential mortgages, originated within DnB NOR Bank’s distribution network.
Financial performance
We set out below some of the key financial performance metrics:
Table 461: Key profit & loss figures, NOKmm
FY 2008 FY 2009 FY 2010Net interest income 958 2,962 2,320Provisions for loan losses n/a n/a n/aNII less provisions 958 2,962 2,320
Comm.& fee income 28 46 46Other operating income n/a n/a 7Non-interest expense 443 869 1,336Operating profit (loss) 1,429 1,214 2,724
PBT 1,429 1,217 2,724Taxes 398 343 763Net profit (loss) 1,031 873 1,961
Source: Bloomberg
Table 462: Key balance sheet figures, NOKmm
FY 2008 FY 2009 FY 2010Loans 198,482 337,111 397,640Total Assets 226,347 350,943 410,528Deposits n/a n/a n/aShort-term borrowings 0 0 94,307Other ST borrowings n/a n/a n/a2,015 9,106Long-term borrowings 217,270 336,402 292,495Equity 6,527 11,650 12,748
Source: Bloomberg
Table 463: Select financial metrics
FY 2008 FY 2009 FY 2010NIM n/a n/a n/aROA n/a 0.3 0.5 ROE n/a 9.6 16.1 ROC n/a 0.3 0.5 C:I 23.6 41.6 32.9 Core capital 6.3 8.0 7.4
Source: Bloomberg
Cover pool overview
We set out below some of the key cover pool characteristics:
Table 464: Covered bond characteristics
As at 31 May 2011
Covered Bond rating S/M/F AAA/Aaa/AAAParent rating S/M/F (DnB Nor Bank) A+/Aa3/A+
Total Cover Pool Balance: (NOK000) 421,705,396Substitution assets: 0Over-collateralisation 35.1
WA Loan Balance: (NOK) 1,039,346No. of Loans: 405,741WA Seasoning (in months): 52WA Remaining term (in months): 266WA Indexed LTV (in %): 55.4Interest only mortgages (in %): 39.9Fixed rate mortgages (in %) 5.6
Source: Investor Report
Table 465: Collateral pool LTV breakdown
Current LTV ranges As at 31 May 2011
0-<=40% 20.6>40%-<=50% 11.9>50%-<=60% 17.5>60%-<=70% 28.3>70%-<=75% 15.8>75% 5.9
Source: Investor report

205
Europe Credit Research12 September 2011
Gareth Davies, CFA(44-20) [email protected]
Flavio Marco Rusconi(44-20) [email protected]
Nordea Eiendomskreditt
(BBG: NBHSS)Snapshot
Nordea Eiendomskreditt (‘NE’) is a 100% owned subsidiary of Nordea Bank Norge ASA, part of the larger Nordea Group, a well established financial group catering to the Nordic and Baltic states, where it is consistently one of the largest by market share, with a small but growing presence in new European markets. No geographical market accounts for more than a quarter of income, out of a customer base of around 10mm households and corporates.
The purpose of the issuer is to acquire and provide residential mortgage loans and finance its activities mainly through covered bond issuance. Loans in NE are originated by Nordea Bank Norge, and subsequently transferred to NE.
Financial performance
We set out below some of the key financial performance metrics:
Table 466: Nordea Group: Key profit & loss figures, £mm
FY 2008 FY 2009 FY 2010Net interest income 41,982 46,156 41,308Provisions for loan losses 3,841 12,988 7,038NII less provisions 38,141 33,169 34,270
Comm.& fee income 20,872 21,570 23,661Other operating income 1,418 918 929Non-interest expense 41,100 46,209 44,960Operating profit (loss) 27,804 26,456 28,609
PBT 27,994 26,876 29,138Taxes 5,968 6,616 7,815Net profit (loss) 22,018 20,225 21,275
Source: Bloomberg
Table 467: Nordea Group: Key balance sheet figures, £mm
FY 2008 FY 2009 FY 2010Loans 2,574,800 2,343,000 2,449,400Total Assets 4,604,900 4,211,300 4,528,100Deposits 1,443,300 1,274,300 1,375,200Short-term borrowings 504,435 433,047 317,588Other ST borrowings 4,449 4,688 3,914Long-term borrowings 1,138,400 1,142,600 1,242,200Equity 172,927 186,030 191,024
Source: Bloomberg
Table 468: Nordea Group: Select financial metrics
FY 2008 FY 2009 FY 2010NIM 1.48 1.42 1.25ROA 0.62 0.47 0.49ROE 15.35 11.55 11.36ROC 1.56 1.16 1.22C:I 53.05 49.99 51.96Core capital 7.40 10.20 9.80
Source: Bloomberg
Cover pool overview
We set out below some of the key cover pool characteristics:
Table 469: Covered bond characteristics
As at 31 March 2011
Covered Bond rating S/M/F -/Aaa/AAAIssuer rating S/M/F (Nordea Bank Norge) AA-/Aa2/AA-
Total Cover Pool Balance: (NOK mm) 77,960 Substitute collateral (NOK mm) 45.4OC level (%)
WA Loan Balance: (NOK) 1,150,000No. of Loans: 69,969No. of Borrowers 65,758WA Seasoning (in months): 30 WA Current LTV (%) 57.6 WA Indexed LTV (%) 54.2
Source: Investor Report
Table 470: Collateral pool LTV breakdown
Current LTV ranges As at 31 March 20110-<=40% 74.3>40%-<=50% 11.3>50%-<=60% 8.2>60%-<=70% 4.9>70%-<=75% 1.3>75% 0.0
Source: Investor report

206
Europe Credit Research12 September 2011
Gareth Davies, CFA(44-20) [email protected]
Flavio Marco Rusconi(44-20) [email protected]
SpareBank 1 Boligkreditt ASA
(BBG: SPABOL)Snapshot
SpareBank 1 Boligkreditt (‘SpareBank’) is a mortgage company licensed by the Norwegian FSA. It is a separate legal entity established in accordance with the Norwegian covered bonds legislation in order to acquire mortgages from banks in the SpareBank 1 Alliance and finance further lending via the issuance of covered bonds. The Alliance is a combination of 17 Norwegian local and regional savings banks and two commercial banks owned by these banks. It is the second largest Norwegian retail mortgage lender, with a market share of 20% of retail loans and 16.1% of corporate lending. The assets backing SpareBank 1's covered bond programme are 100% Norwegian residential mortgages.
SpareBank 1 Gruppen AS is owned by Sparebanken Hedmark (9%), SpareBank 1 Nord-Norge (16%), SpareBank 1 SMN (20%), SpareBank 1 SR-Bank (29%), and the cooperating savings banks a further 18%. Together, they constitute the country’s second largest lender.
Financial performance
We set out below some of the key financial performance metrics:
Table 471: Key profit & loss figures, NOKmm
FY 2008 FY 2009 FY 2010Net interest income 104 108 137Provisions for loan losses 0 0 n/aNII less provisions 104 108 137
n/a n/a n/aComm.& fee income n/a n/a n/aOther operating income -35 29 -7Non-interest expense 22 19 24Operating profit (loss) 47 117 105
3 0 n/aPBT 44 117 105Taxes 12 33 30Net profit (loss) 32 84 76
Source: Bloomberg
Table 472: Key balance sheet figures, NOKmm
FY 2008 FY 2009 FY 2010Loans 42,494 80,154 94,742Total Assets 53,326 84,233 105,079Deposits 0 0 n/aShort-term borrowings 5,905 1,992 390Other ST borrowings 0 0 n/aLong-term borrowings 500 3,475 97,791Equity 1,678 3,683 4,805
Source: Bloomberg
Table 473: Select financial metrics
FY 2008 FY 2009 FY 2010NIM n/a 0.17 n/aROA 0.00 0.00 0.08ROE 3.76 3.14 1.79ROC 0.78 0.98 0.14C:I 32.19 14.20 18.68Core capital n/a n/a n/a
Source: Bloomberg
Cover pool overview
We set out below some of the key cover pool characteristics:
Table 474: Covered bond characteristics
As at 31 March 2011
Covered Bond rating S/M/F -/Aaa/AAAIssuer rating S/M/F -/A1/A-
Total Cover Pool Balance: (NOK000) 82,160,601Substitute collateral (NOK000) 12,372,175
WA Loan Balance: (NOK)No. of Loans: 75,905WA Seasoning (in months): 1,082,414 WA Original LTV (in %): 57.0WA Current LTV (in %): 50.1WA Interest Rate (in %): 3.72
Source: Investor Report
Table 475: Collateral pool LTV breakdown
Current LTV ranges As at 31 March 20110-<=40% 30.1>40%-<=50% 14.3>50%-<=60% 18.1>60%-<=70% 18.6>70%-<=75% 18.8>75% 0.0
Source: Investor report
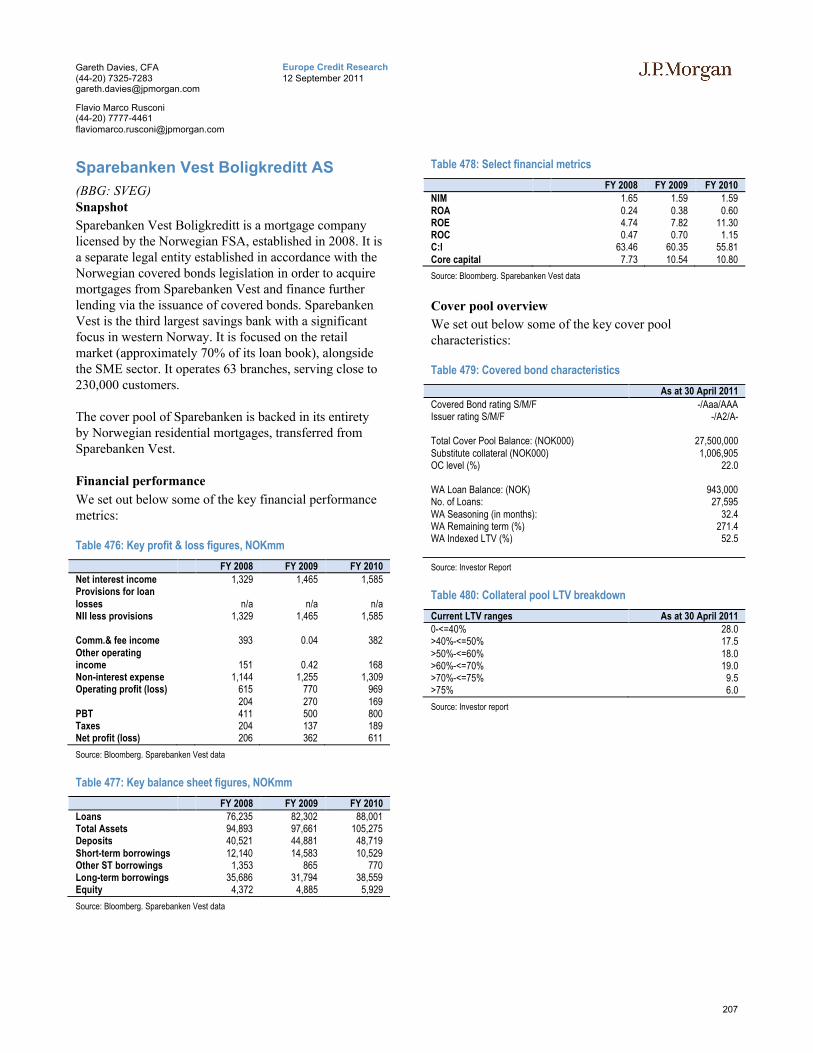
207
Europe Credit Research12 September 2011
Gareth Davies, CFA(44-20) [email protected]
Flavio Marco Rusconi(44-20) [email protected]
Sparebanken Vest Boligkreditt AS
(BBG: SVEG)Snapshot
Sparebanken Vest Boligkreditt is a mortgage company licensed by the Norwegian FSA, established in 2008. It is a separate legal entity established in accordance with the Norwegian covered bonds legislation in order to acquire mortgages from Sparebanken Vest and finance further lending via the issuance of covered bonds. Sparebanken Vest is the third largest savings bank with a significant focus in western Norway. It is focused on the retail market (approximately 70% of its loan book), alongside the SME sector. It operates 63 branches, serving close to 230,000 customers.
The cover pool of Sparebanken is backed in its entirety by Norwegian residential mortgages, transferred from Sparebanken Vest.
Financial performance
We set out below some of the key financial performance metrics:
Table 476: Key profit & loss figures, NOKmm
FY 2008 FY 2009 FY 2010Net interest income 1,329 1,465 1,585Provisions for loan losses n/a n/a n/aNII less provisions 1,329 1,465 1,585
Comm.& fee income 393 0.04 382Other operating income 151 0.42 168Non-interest expense 1,144 1,255 1,309Operating profit (loss) 615 770 969
204 270 169PBT 411 500 800Taxes 204 137 189Net profit (loss) 206 362 611
Source: Bloomberg. Sparebanken Vest data
Table 477: Key balance sheet figures, NOKmm
FY 2008 FY 2009 FY 2010Loans 76,235 82,302 88,001Total Assets 94,893 97,661 105,275Deposits 40,521 44,881 48,719Short-term borrowings 12,140 14,583 10,529Other ST borrowings 1,353 865 770Long-term borrowings 35,686 31,794 38,559Equity 4,372 4,885 5,929
Source: Bloomberg. Sparebanken Vest data
Table 478: Select financial metrics
FY 2008 FY 2009 FY 2010NIM 1.65 1.59 1.59ROA 0.24 0.38 0.60ROE 4.74 7.82 11.30ROC 0.47 0.70 1.15C:I 63.46 60.35 55.81Core capital 7.73 10.54 10.80
Source: Bloomberg. Sparebanken Vest data
Cover pool overview
We set out below some of the key cover pool characteristics:
Table 479: Covered bond characteristics
As at 30 April 2011
Covered Bond rating S/M/F -/Aaa/AAAIssuer rating S/M/F -/A2/A-
Total Cover Pool Balance: (NOK000) 27,500,000 Substitute collateral (NOK000) 1,006,905OC level (%) 22.0
WA Loan Balance: (NOK) 943,000No. of Loans: 27,595WA Seasoning (in months): 32.4 WA Remaining term (%) 271.4 WA Indexed LTV (%) 52.5
Source: Investor Report
Table 480: Collateral pool LTV breakdown
Current LTV ranges As at 30 April 20110-<=40% 28.0>40%-<=50% 17.5>50%-<=60% 18.0>60%-<=70% 19.0>70%-<=75% 9.5>75% 6.0
Source: Investor report

208
Europe Credit Research12 September 2011
Gareth Davies, CFA(44-20) [email protected]
Flavio Marco Rusconi(44-20) [email protected]
Terra Boligkreditt AS
(BBG: TERBOL)Snapshot
Terra Boligkreditt (‘Terra’) is a specialised credit institution, fully owned by Terra Gruppen AS. Terra Gruppen itself is owned by 78 local Terra banks (98% ownership) and was constituted in order to provide its shareholder banks access to areas that are too small to make entering their market cost effective. The company therefore negotiates on behalf of all the banks to arrange banking solutions that deliver strategic benefits and economies of scale. The shareholder banks are committed to using the solutions negotiated for the group in the most important areas.
Terra banks rank as the fourth largest lender to the retail sector, with a market share of 11%, while the focus on the corporate market is limited. Terra operates approximately 190 branches across the country.
Financial performance
We set out below some of the key financial performance metrics:
Table 481: Key profit & loss figures, NOKmm
FY 2008 FY 2009 FY 2010Net interest income 72 139 176Provisions for loan losses n/a n/a n/aNII less provisions n/a n/a n/a
n/a n/a n/aComm.& fee income 37 63 109Other operating income 0 0 0Non-interest expense 27 35 35Operating profit (loss) n/a n/a n/a
n/a n/a n/aPBT 9 48 36Taxes 2 13 10Net profit (loss) 6 35 26
Source: Bloomberg
Table 482: Select financial metrics
FY 2008 FY 2009 FY 2010NIM n/a n/a n/aROA n/a n/a n/aROE 1.30 5.40 3.39ROC 0.05 0.16 0.08C:I 37.08 25.57 20.14Core capital 16.63 11.25 12.39
Source: Bloomberg
Cover pool overview
We set out below some of the key cover pool characteristics:
Table 483: Covered bond characteristics
As at 30 June 2011
Covered Bond rating S/M/F -/Aa2/-Issuer rating S/M/F n/a
Total Cover Pool Balance (€mm): 4,003WA Loan Balance (€): 170,801No. of Loans: 23,435WA Current LTV (in %): 46.3WA Indexed LYV (in %): 42.2Cooperative housing (in %): 13.0Substitute assets (in %): 7.0Fixed rate mortgages (in %) 7.2
Source: Investor Report
Table 484: Collateral pool LTV breakdown
Current LTV ranges As at 30 June 20110-<=40% 26.0>40%-<=50% 13.0>50%-<=60% 61.0>60%-<=70% 26.0>70%-<=75% 0.0>75% 0.0
Source: Investor report

209
Europe Credit Research12 September 2011
Gareth Davies, CFA(44-20) [email protected]
Flavio Marco Rusconi(44-20) [email protected]
Po
rtu
gu
ese
Co
ve
red
Bo
nd
s

210
Europe Credit Research12 September 2011
Gareth Davies, CFA(44-20) [email protected]
Flavio Marco Rusconi(44-20) [email protected]
Portuguese Covered Bonds
Legislative snapshot
We set out in Table 485 a snapshot of key covered bond attributes in Portugal.
Table 485: Portuguese Covered Bond legislative overview
Attribute CommentaryFrameworkLegislative Framework Decree 59/2006 and Decree 298/1992, Notices 5-8/2006, Reg instrument 13/2006Types of covered bonds Two. Mortgage CB (Obrigacoes Hipotecarias) and Public Sector CB (Obrigacoes Sobre o Sector Publico): Structure of Issuer Direct issuance? Yes and No. The originator can either issue CB directly from the institution’s balance sheet or can transfer
the assets to a specialised credit institution (Mortgage Credit Institution or MCI) who then issues the bonds Comments (if any) Portuguese programmes to date have used the direct issuance model
Bankruptcy remoteness No acceleration on issuer insolvency, although a two-thirds majority of bondholders can vote to accelerate the programme following issuer dissolution
Dual claim Yes. Should the cover pool be insufficient to satisfy CB bondholders, a claim pari passu to other unsecured bondholders within the insolvency estate exists
Bond format Typically, fixed rate, soft bullet, with the ability to extend maturities by up to 12 months at the discretion of the issuer. Maturities must be greater than 2 years and less than 50 years
Supervision Bank of Portugal and CMVMCover poolEligible assets Mortgage European Union first-lien mortgages (or second-lien where the first-lien is also included). Insured or
guaranteed loans can also be includedLTV caps "Hard" (loans above the maximum can not be included in/must be removed from the cover pool). Both
residential (max LTV 80%) and commercial (max LTV 60%) within the EU; the property has to be valued every three years for residential properties (or annually for exposures >€500k) and annually for commercial ones
Public Sector Loans granted and debt issued or guaranteed by governments or local authorities within the EUNon-performing collateral NPLs greater than 90d must be removed from the cover poolSubstitution Assets Substitute collateral is limited to a maximum of 20% of the cover pool, and can include cash deposits with the
Bank of Portugal or other credit institutions rated at least A-, government bonds or other eligible bonds (including ECB Tier 1 assets)
Hedging Used to minimise interest rate, currency, credit or other risks. Entered on the asset register and rank pari passu with CB holders. Must be sourced from an EU or OECD bank rated at least A-. Do not accelerate on issuer insolvency
Valuation Individual market values. Independent revaluations must occur at least every three years for loans that exceed 5% of an institution's own funds, €500k for residential property or €1mm for commercial property. The value of mortgaged property must also be checked by the institution on a periodic basis (3 years for residential, annually for commercial). Cover pools are monitored by a designated independent supervisor.
Other comments (if any) Bondholders also benefit from the protection of a bondholder representative charged with implementing the deliberations of the bondholder meetings that may have established early redemption of the programme, represent bondholders in any legal action etc. Credit facilities can also be used to finance redemption or interest payments on outstanding CB
RequirementsALM matching Asset coverage Nominal cover required, with minimum 5.26% OC for mortgage bonds, none required for public sector bonds.
Interest coverage Yes. Interest paid on the mortgage bonds can never exceed interest received from the cover poolOther (if any) The average maturity of outstanding bonds can not exceed the average life of the mortgage claims. NPV of
assets must exceed NPV of CB. Must also be met for a 200bp parallel shift in the yield curveConsequence of breach Failure to meet the above requirements requires the issuing institution to either add mortgage or substitution
collateral, or to repurchase outstanding bonds from the secondary market. Other regulatory actions by the BdP
Monitoring Independent auditor must verify compliance with all legal and regulatory requirements as well as auditing collateral. Annual reports to the BdP
OtherCompliance with EU legislation
UCITS and CRD compliant
Source: National legislation, J.P. Morgan Covered Bond Research

211
Europe Credit Research12 September 2011
Gareth Davies, CFA(44-20) [email protected]
Flavio Marco Rusconi(44-20) [email protected]
Portuguese covered bond & macro backdrop
Figure 137: Portuguese CB issuance, €mm
Source: ECBC. Latest data available displayed
Figure 138: Portuguese CB outstanding, €mm
Source: ECBC. Latest data available displayed
Figure 139: Portuguese real GDP growth, y-on-y, %
Source: Source: Bloomberg
Figure 140: Portuguese unemployment level, %
Source: Bloomberg
Figure 141: Portuguese CPI and base rate, %
Source: Bloomberg
Figure 142: Portuguese consumer confidence, balance of survey
Source: Bloomberg
Figure 143: Portuguese house price growth, %
Source: INE
Figure 144: Portuguese outstanding mortgages (€mm) and annual growth of mortgage stock, %
Source: ECB
0
2,000
4,000
6,000
8,000
10,000
12,000
14,000
2003 2004 2005 2006 2007 2008 2009 2010
Mortgage Public Sector
0
5,000
10,000
15,000
20,000
25,000
30,000
35,000
2003 2004 2005 2006 2007 2008 2009 2010
Mortgage Public Sector
-5-4-3-2-1012345
Mar
-00
Mar
-01
Mar
-02
Mar
-03
Mar
-04
Mar
-05
Mar
-06
Mar
-07
Mar
-08
Mar
-09
Mar
-10
Mar
-11
Real GDP growth
0
2
4
6
8
10
12
14
Mar
-00
Mar
-01
Mar
-02
Mar
-03
Mar
-04
Mar
-05
Mar
-06
Mar
-07
Mar
-08
Mar
-09
Mar
-10
Mar
-11
Unemployment
-3-2-10123456
Mar
-00
Mar
-01
Mar
-02
Mar
-03
Mar
-04
Mar
-05
Mar
-06
Mar
-07
Mar
-08
Mar
-09
Mar
-10
Mar
-11
Inflation Base rate
-60
-50
-40
-30
-20
-10
0
Mar
-00
Mar
-01
Mar
-02
Mar
-03
Mar
-04
Mar
-05
Mar
-06
Mar
-07
Mar
-08
Mar
-09
Mar
-10
Mar
-11
Cons. Confidence
-8%
-6%
-4%
-2%
0%
2%
4%
6%
Sep
-05
Jan-
06
May
-06
Sep
-06
Jan-
07
May
-07
Sep
-07
Jan-
08
May
-08
Sep
-08
Jan-
09
May
-09
Sep
-09
Jan-
10
May
-10
Sep
-10
Jan-
11
House price growth
0%2%4%6%8%10%12%14%
16%18%
0
20,000
40,000
60,000
80,000
100,000
120,000
140,000
Dec
-02
Jun-
03
Dec
-03
Jun-
04
Dec
-04
Jun-
05
Dec
-05
Jun-
06
Dec
-06
Jun-
07
Dec
-07
Jun-
08
Dec
-08
Jun-
09
Dec
-09
Jun-
10
Dec
-10
Jun-
11
Outstanding mortgages Growth in o/s mortgages

212
Europe Credit Research12 September 2011
Gareth Davies, CFA(44-20) [email protected]
Flavio Marco Rusconi(44-20) [email protected]
Banco Comercial Portugues (‘Millennium bcp’)
(BBG: BCPPL)Snapshot
Banco Comercial Portugues was founded in 1985 and in 2004 was rebranded as Millennium bcp to unite under one name the different brands that made up the group’s retail banking operations.
Within Portugal, group activities include the universal bank (Millenium bcp), mutual fund management company (Millenium bcp gestao de activos), mortgages (BII), insurance (Millennium bcp Ageas) and private property fund management (Interfundos). After securing a strong presence in the domestic market, BCP has also expanded into overseas markets, such as Poland, Greece, Turkey, Angola, Mozambique and the USA. In the Iberian market, Millennium bcp and Banco Sabadell established an agreement according to which Millennium bcp supports Banco Sabadell's Customers in Portugal and Banco Sabadell supports Millennium bcp's customers in Spain.
Financial performance
We set out below some of the key financial performance metrics:
Table 486: Key profit & loss figures, €mm
FY 2007 FY 2008 FY 2009 FY 2010Net interest income 1,565 1,758 1,337 1,553Provisions for loan losses
260 545 560 713
NII less provisions 1,305 1,213 777 839
Comm.& fee income 926 897 866 34Other operating income 111 75 57 34Non-interest expense 2,010 1,828 1,674 1,720Operating profit (loss) 724 376 252 511
PBT 688 342 296 358Taxes 70 84 46 -3Net profit (loss) 563 201 225 302
Source: Bloomberg
Table 487: Key balance sheet figures, €mm
FY 2007 FY 2008 FY 2009 FY 2010Loans 65,650 75,165 75,191 73,905 Total Assets 88,166 94,424 95,550 100,010 Deposits 39,247 44,694 46,066 45,515 Short-term borrowings 9,432 9,339 10,306 20,077 Other ST borrowings 2,862 9,209 7,940 5,573 Long-term borrowings 29,724 23,114 22,185 20,177 Equity 4,899 6,248 7,221 7,247
Source: Bloomberg
Table 488: Select financial metrics
FY 2007 FY 2008 FY 2009 FY 2010NIM 2.0 2.1 1.5 1.7 ROA 0.6 0.2 0.2 0.2 ROE 13.8 3.6 4.2 3.5 ROC 1.4 0.6 0.6 0.8 C:I 64.0 64.5 65.5 56.7 Core capital 5.5 7.1 9.3 9.2
Source: Bloomberg
Cover pool overview
We set out below some of the key cover pool characteristics:
Table 489: Covered bond characteristics
As at 31 March 2011
Covered Bond rating S/M/F -/Baa3/BBB+Issuer rating S/M/F BBB-/Ba1/BBB-
Current OC (%) 25.7
Cover pool size (€) 9,116,355,643Number of loans 179,813Avg loan (€) 50,699
Fixed rate mortgages (%) 7.9WA seasoning (mths) 62.6Second homes (%) 4.5Loans in arrears (%) 1.0Top Regional concentration (%) Lisbon 28%
WA LTV (in %) 47.1
Source: Investor Report
Table 490: Covered pool LTV breakdown
Current LTV ranges As at 31 March 2011
0-<=40% 36.3>40%-<=50% 15.4>50%-<=60% 16.3>60%-<=70% 17.2>70%-<=80% 14.8
Source: Investor Report

213
Europe Credit Research12 September 2011
Gareth Davies, CFA(44-20) [email protected]
Flavio Marco Rusconi(44-20) [email protected]
Banco Espirito Santo (‘BES’)
(BBG: BESPL)Snapshot
Banco Espirito Santo (‘BES’) is Portugal’s largest listed bank and the second largest financial institution by net assets, with an average market share of 20.3% in the domestic market with 2.1mm clients. The institution has a free float of 40.5%, with the majority of share capital held by the core shareholders of EFSG (40%) and Credit Agricole (c11%).
As well as a full range of retail and commercial banking services offered in Portugal, BES also specialises in Private Banking, Corporate Banking and Investment Banking. BES also operates in overseas markets, focusing on those with cultural and economic ties to Portugal (Angola, Brazil, Spain and the Maghreb).
Financial performance
We set out below some of the key financial performance metrics:
Table 491: Key profit & loss figures, €mm
FY 2007 FY 2008 FY 2009 FY 2010Net interest income 1,004 1,178 1,290 1,357Provisions for loan losses 213 274 540 352NII less provisions 791 904 750 1,005
Comm.& fee income 716 709 786 887Other operating income 27 0 96 0Non-interest expense 1,081 1,144 1,243 1,362Operating profit (loss) 778 611 586 750
PBT 788 511 685 701Taxes 153 83 110 44Net profit (loss) 607 402 522 511
Source: Bloomberg
Table 492: Key balance sheet figures, €mm
FY 2007 FY 2008 FY 2009 FY 2010
Loans 42,170 47,049 48,979 50,829 Total Assets 68,355 75,187 82,297 83,655 Deposits 22,348 24,566 24,661 30,383 Short-term borrowings 8,984 12,492 10,713 14,345 Other ST borrowings 1,848 2,744 1,970 2,348 Long-term borrowings 26,408 27,426 35,740 26,402 Equity 5,414 4,653 6,939 7,476
Source: Bloomberg
Table 493: Select financial metrics
FY 2007 FY 2008 FY 2009 FY 2010NIM 1.7 1.8 1.8 1.8 ROA 1.0 0.6 0.7 0.6 ROE 13.8 9.4 10.5 8.2 ROC 1.6 1.0 1.1 1.3 C:I 49.6 53.9 50.2 53.1 Core capital 7.5 6.6 8.3 8.8
Source: Bloomberg
Cover pool overview
We set out below some of the key cover pool characteristics:
Table 494: Covered bond characteristics
As at 31 March 2011
Covered Bond rating S/M/F -/Baa3/-Issuer rating S/M/F BBB-/Ba1/-Cover pool size (€) 4,950,329,942 Number of loans 92,355 Avg loan (€) 53,601
Current OC (%) 19.0
Fixed rate mortgages (%) 3.1 WA seasoning (mths) 64.3 Second homes (%) 9.3 BTL (%) 1.3 Loans in arrears (%) 0.0
Top Regional concentration (%) Lisbon City 28%
Source: Investor Report
Table 495: Covered pool LTV breakdown
Current LTV ranges As at 31 March 2011
0-<=40% 15.8>40%-<=50% 12.1>50%-<=60% 18.0>60%-<=70% 24.2>70%-<=80% 29.9
Source: Investor Report

214
Europe Credit Research12 September 2011
Gareth Davies, CFA(44-20) [email protected]
Flavio Marco Rusconi(44-20) [email protected]
Banco Portugues de Investimento (‘BPI’)
(BBG: BPIPL)Snapshot
The BPI group, headed by Banco BPI, is a financial services group offering services to both retail and corporate customers. It is the fourth largest private financial group with a market share of approximately 11% in deposits and loans and more than seventeen percent in asset management.
The group's commercial bank (Banco BPI) serves 1.6mm individuals, companies and institutions with close to 700 branches. BPI also provides investment banking services on the Iberian peninsula and asset management. The group is also active in Angola, where it has a 20% market share in deposits via its controlling stake in Banco de Fomento. In addition to Angola, BPI also owns a 30% stake in Mozambique’s BCI.
Financial performance
We set out below some of the key financial performance metrics:
Table 496: Key profit & loss figures, €mm
FY 2007 FY 2008 FY 2009 FY 2010Net interest income 630 649 589 630Provisions for loan losses 112 144 166 121NII less provisions 518 505 423 509
Comm.& fee income 348 315 322 338Other operating income 94 258 103 101Non-interest expense 647 722 744 786Operating profit (loss) 450 340 323 269
PBT 481 229 319 285Taxes 109 51 45 -6Net profit (loss) 355 150 175 185
Source: Bloomberg
Table 497: Key balance sheet figures, €mm
FY 2007 FY 2008 FY 2009 FY 2010Loans 27,231 29,275 29,956 30,055 Total Assets 40,546 43,025 47,449 45,660 Deposits 19,906 23,611 22,488 23,106 Short-term borrowings 3,759 2,036 7,488 5,979 Other ST borrowings 1,217 2,954 2,637 2,467 Long-term borrowings 6,273 7,185 9,736 8,423 Equity 1,905 1,961 2,303 1,964
Source: Bloomberg
Table 498: Select financial metrics
FY 2007 FY 2008 FY 2009 FY 2010NIM 1.8 1.7 1.4 1.4 ROA 0.9 0.4 0.4 0.4 ROE 23.0 9.6 10.5 11.2 ROC 3.1 1.4 1.7 1.6 C:I 52.1 58.5 58.9 65.5 Core capital 6.2 8.8 8.6 9.1
Source: Bloomberg
Cover pool overview
We set out below some of the key cover pool characteristics:
Table 499: Mortgage covered bond characteristics
As at 31 March 2011
Covered Bond rating S/M/F A+/A3/A-Issuer rating S/M/F BBB-/Baa3/BBB-Cover pool size (€) 4,472,700,195Number of loans 82,891Avg loan (€) 52,876
Current OC (%) 26.9
Fixed rate mortgages (%) 0.0 Second homes (%) 2.4 BTL (%) 0.8 Loans in arrears (%) 0.0
Top Regional concentration (%) Lisbon 29%
WA original LTV (in %) 65.6WA current LTV (in %) 55.6WA seasoning (mths) 64.3
0-<=40% 18.8>40%-<=50% 14.8>50%-<=60% 18.8>60%-<=70% 23.9>70%-<=80% 23.6
Source: Investor Report
Table 500: Public Sector covered bond characteristics
Current LTV ranges As at 31 March 2011
Covered Bond rating S/M/F BBB/A3/-Issuer rating S/M/F BBB/A3/BBB-Cover pool size (€) 499,404,612Number of loans 959Avg loan (€) 516,352
Top 10 borrowers (in %) 52.0 Top 50 borrowers (in %) 84.9 WA seasoning (mths) 31.2 WA remaining term (mths) 95.0
Source: Investor Report
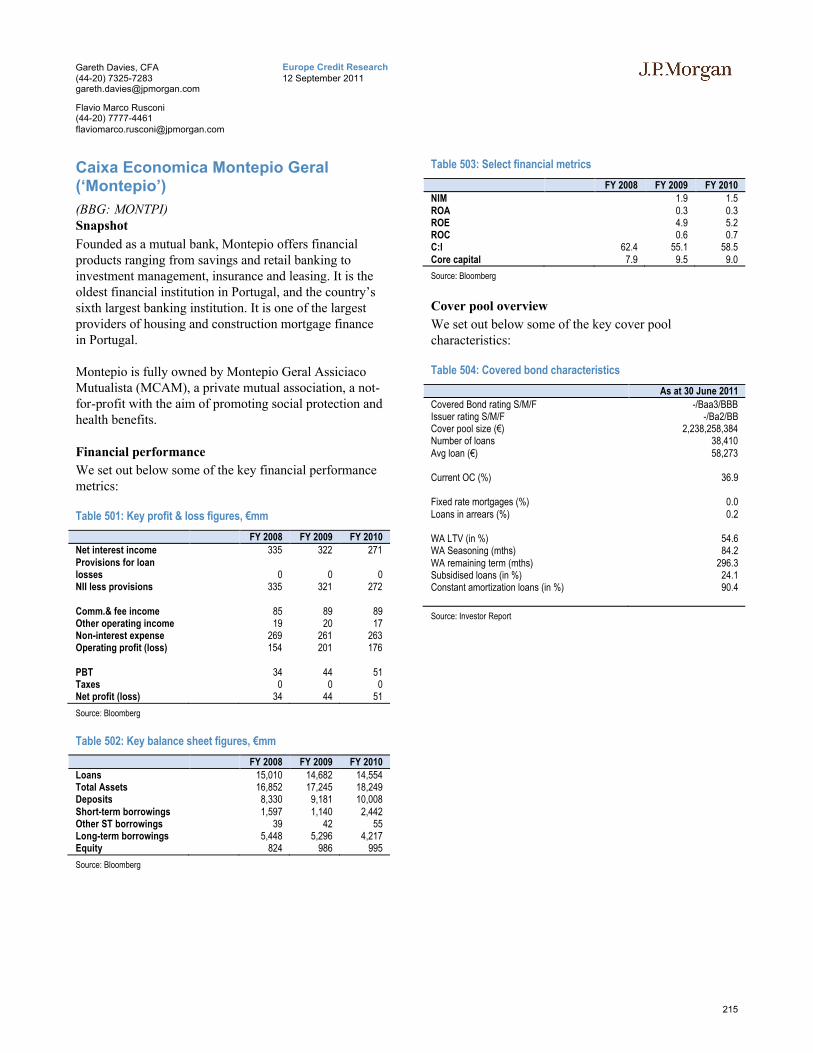
215
Europe Credit Research12 September 2011
Gareth Davies, CFA(44-20) [email protected]
Flavio Marco Rusconi(44-20) [email protected]
Caixa Economica Montepio Geral (‘Montepio’)
(BBG: MONTPI)Snapshot
Founded as a mutual bank, Montepio offers financial products ranging from savings and retail banking to investment management, insurance and leasing. It is the oldest financial institution in Portugal, and the country’s sixth largest banking institution. It is one of the largest providers of housing and construction mortgage finance in Portugal.
Montepio is fully owned by Montepio Geral Assiciaco Mutualista (MCAM), a private mutual association, a not-for-profit with the aim of promoting social protection and health benefits.
Financial performance
We set out below some of the key financial performance metrics:
Table 501: Key profit & loss figures, €mm
FY 2008 FY 2009 FY 2010Net interest income 335 322 271Provisions for loan losses 0 0 0NII less provisions 335 321 272
Comm.& fee income 85 89 89Other operating income 19 20 17Non-interest expense 269 261 263Operating profit (loss) 154 201 176
PBT 34 44 51Taxes 0 0 0Net profit (loss) 34 44 51
Source: Bloomberg
Table 502: Key balance sheet figures, €mm
FY 2008 FY 2009 FY 2010Loans 15,010 14,682 14,554 Total Assets 16,852 17,245 18,249 Deposits 8,330 9,181 10,008 Short-term borrowings 1,597 1,140 2,442 Other ST borrowings 39 42 55 Long-term borrowings 5,448 5,296 4,217 Equity 824 986 995
Source: Bloomberg
Table 503: Select financial metrics
FY 2008 FY 2009 FY 2010NIM 1.9 1.5 ROA 0.3 0.3 ROE 4.9 5.2 ROC 0.6 0.7 C:I 62.4 55.1 58.5 Core capital 7.9 9.5 9.0
Source: Bloomberg
Cover pool overview
We set out below some of the key cover pool characteristics:
Table 504: Covered bond characteristics
As at 30 June 2011
Covered Bond rating S/M/F -/Baa3/BBBIssuer rating S/M/F -/Ba2/BBCover pool size (€) 2,238,258,384Number of loans 38,410Avg loan (€) 58,273
Current OC (%) 36.9
Fixed rate mortgages (%) 0.0 Loans in arrears (%) 0.2
WA LTV (in %) 54.6WA Seasoning (mths) 84.2WA remaining term (mths) 296.3Subsidised loans (in %) 24.1Constant amortization loans (in %) 90.4
Source: Investor Report

216
Europe Credit Research12 September 2011
Gareth Davies, CFA(44-20) [email protected]
Flavio Marco Rusconi(44-20) [email protected]
Caixa Geral de Depositos (‘CGD’)
(BBG: CXGD)Snapshot
Caixa Geral de Depositos was founded in 1876 as a savings bank and is a public limited company, whose only shareholder is the Portuguese government. The Bank is the leading universal bank in the Republic (significant market shares in customer deposits and mortgage lending), and the dominant financial group. The Group has 5mm customers domestically, or approximately half the population, with a branch network of over 800 branches.
The institution is structured along a number of business lines including commercial banking, investment banking & venture capital, asset management, specialised credit (including Leasing & Factoring and consumer credit); insurance (both life and non-life) and health care. The bank also operates outside of Portugal, with the main foreign markets being Brazil and Mexico.
Financial performance
We set out below some of the key financial performance metrics:
Table 505: Key profit & loss figures, €mm
FY 2007 FY 2008 FY 2009 FY 2010Net interest income 2,032 2,201 1,641 1,613Provisions for loan losses 249 448 676 51NII less provisions 1,783 1,754 965 1,562
Comm.& fee income 491 533 592 649Other operating income 2,642 2,751 2,244 1,881Non-interest expense 3,928 4,653 3,622 3,135Operating profit (loss) 1,072 631 379 1,081
PBT 1,075 662 374 364Taxes 178 157 70 65Net profit (loss) 856 459 279 251
Source: Bloomberg
Table 506: Key balance sheet figures, €mm
FY 2007 FY 2008 FY 2009 FY 2010
Loans 66,844 75,311 77,222 81,907 Total Assets 103,554 111,060 120,985 125,862 Deposits 54,039 60,128 64,256 67,680 Short-term borrowings 8,841 6,952 6,479 14,604 Other ST borrowings 2,474 2,784 2,232 1,936 Long-term borrowings 19,675 23,694 29,252 22,839 Equity 5,541 5,484 7,157 7,840
Source: Bloomberg
Table 507: Select financial metrics
FY 2007 FY 2008 FY 2009 FY 2010NIM 2.2 2.2 1.5 1.4 ROA 0.9 0.4 0.2 0.2 ROE 18.7 10.0 5.5 4.1 ROC 3.0 1.4 0.8 0.7 C:I 74.4 80.8 76.7 72.5 Core capital 6.7 7.0 8.5 8.9
Source: Bloomberg
Cover pool overview
We set out below some of the key cover pool characteristics:
Table 508: Mortgage covered bond characteristics
As at 30 June 2011
Covered Bond rating S/M/F -/Baa3/A-Issuer rating S/M/F BBB-/Ba1/BBB-Cover pool size (€) 11,238,126,029Number of loans 261,569Avg loan (€) 42,964Current OC (%) 32.8
WA current LTV (in %) 52.5WA seasoning (mths) 84.7WA remaining term (yrs) 23.4
LTV breakdown (in %)0-<=40% 23.9>40%-<=50% 16.0>50%-<=60% 17.8>60%-<=70% 20.1>70%-<=80% 22.2
Regional breakdown (in%)Lisbon 27.8Porto 13.9Setubal 10.3Braga 6.2Faro 4.9
Source: Investor Report
Table 509: Public Sector covered bond characteristics
Current LTV ranges As at 30 June 2011
Covered Bond rating S/M/F -/Baa3/BBBIssuer rating S/M/F BBB-/Ba1/BBB-Cover pool size (€) 1,256,051,004Number of loans 2,589Avg loan (€) 485,149Current OC (%) 32.6
Top 5 regional exposures (in%)Lisbon 15.4Porto 13.6Setubal 8.1Santarem 7.4Aveiro 6.7
Source: Investor Report
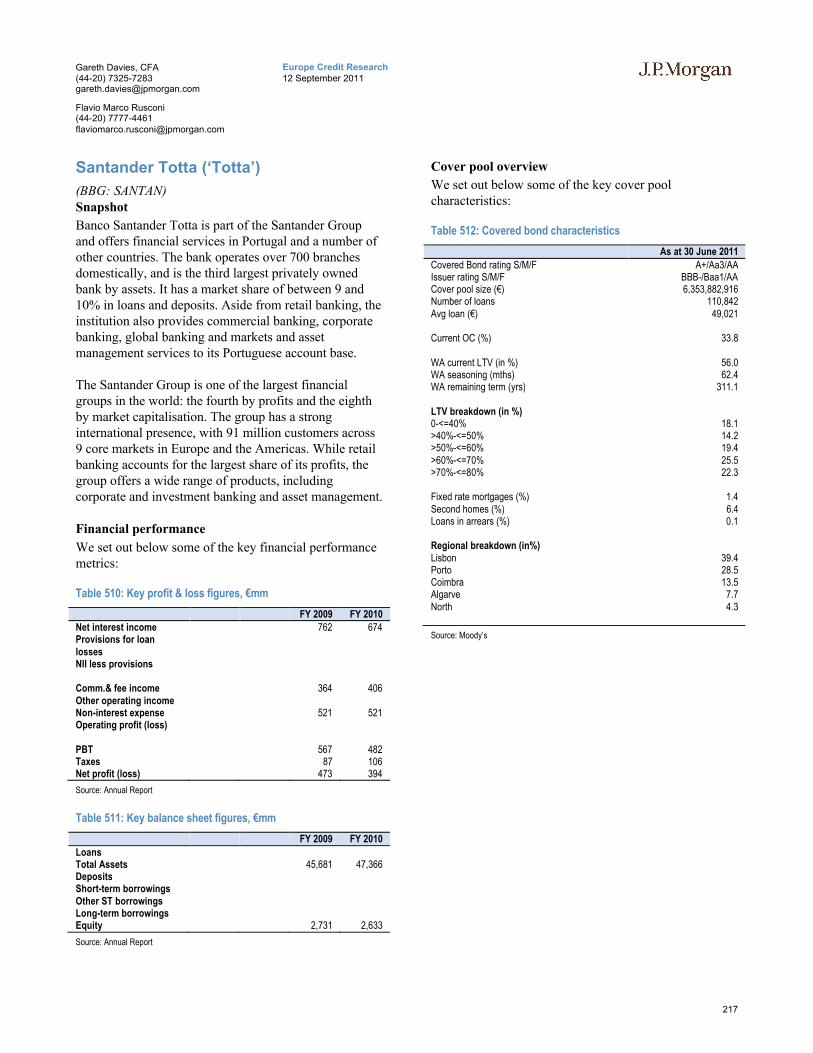
217
Europe Credit Research12 September 2011
Gareth Davies, CFA(44-20) [email protected]
Flavio Marco Rusconi(44-20) [email protected]
Santander Totta (‘Totta’)
(BBG: SANTAN)Snapshot
Banco Santander Totta is part of the Santander Group and offers financial services in Portugal and a number of other countries. The bank operates over 700 branches domestically, and is the third largest privately owned bank by assets. It has a market share of between 9 and 10% in loans and deposits. Aside from retail banking, the institution also provides commercial banking, corporate banking, global banking and markets and asset management services to its Portuguese account base.
The Santander Group is one of the largest financial groups in the world: the fourth by profits and the eighth by market capitalisation. The group has a strong international presence, with 91 million customers across 9 core markets in Europe and the Americas. While retail banking accounts for the largest share of its profits, the group offers a wide range of products, including corporate and investment banking and asset management.
Financial performance
We set out below some of the key financial performance metrics:
Table 510: Key profit & loss figures, €mm
FY 2009 FY 2010Net interest income 762 674Provisions for loan lossesNII less provisions
Comm.& fee income 364 406Other operating incomeNon-interest expense 521 521Operating profit (loss)
PBT 567 482Taxes 87 106Net profit (loss) 473 394
Source: Annual Report
Table 511: Key balance sheet figures, €mm
FY 2009 FY 2010
LoansTotal Assets 45,681 47,366 DepositsShort-term borrowingsOther ST borrowingsLong-term borrowingsEquity 2,731 2,633
Source: Annual Report
Cover pool overview
We set out below some of the key cover pool characteristics:
Table 512: Covered bond characteristics
As at 30 June 2011
Covered Bond rating S/M/F A+/Aa3/AAIssuer rating S/M/F BBB-/Baa1/AACover pool size (€) 6,353,882,916 Number of loans 110,842 Avg loan (€) 49,021
Current OC (%) 33.8
WA current LTV (in %) 56.0WA seasoning (mths) 62.4 WA remaining term (yrs) 311.1
LTV breakdown (in %)0-<=40% 18.1>40%-<=50% 14.2>50%-<=60% 19.4>60%-<=70% 25.5>70%-<=80% 22.3
Fixed rate mortgages (%) 1.4 Second homes (%) 6.4 Loans in arrears (%) 0.1
Regional breakdown (in%)Lisbon 39.4Porto 28.5Coimbra 13.5Algarve 7.7North 4.3
Source: Moody’s

218
Europe Credit Research12 September 2011
Gareth Davies, CFA(44-20) [email protected]
Flavio Marco Rusconi(44-20) [email protected]

219
Europe Credit Research12 September 2011
Gareth Davies, CFA(44-20) [email protected]
Flavio Marco Rusconi(44-20) [email protected]
Sp
an
ish
Co
ve
red
Bo
nd
s

220
Europe Credit Research12 September 2011
Gareth Davies, CFA(44-20) [email protected]
Flavio Marco Rusconi(44-20) [email protected]
Spanish Covered Bonds
Legislative snapshot
We set out in Table 513 a snapshot of key covered bond attributes in Spain.
Table 513: Spanish Covered Bond legislative overview: Standalone programmes
Attribute CommentaryFrameworkLegislative Framework Special law-based covered bonds. Mortgage Market Law 41/2007, Law 2/1981, Royal Decree
716/2009, Law 22/2003Types of covered bonds Two. Mortgage Covered Bonds (Cedulas Hipotecarias or CH) and Public Sector Covered Bonds
(Cedulas Territoriales or CT)Structure of Issuer Direct issuance? Yes. Issuers are either specialist or universal credit institutions; the collateral is kept on the
balance sheet of the issuer and not transferred to a separate legal entityComments (if any)
Bankruptcy remoteness All assets are recorded on the cover register. No acceleration occurs in case of insolvency of the issuer
Dual claim Yes. Covered bond holders’ preferential claim protected by lawBond format Typically, fixed rate, hard bulletSupervision Bank of Spain, Ministry of Economy and Commerce, CNMV (Spanish Securities Commission)Cover poolEligible assets Mortgage EU mortgages. Bondholder claims are guaranteed by the entire mortgage book of the issuer
(both residential and commercial mortgage assets, as well as both eligible and ineligible mortgages) of the lender (excluding any collateral pledged in other transactions such as bonos hipotecarios)
LTV caps "Hard" (loans above the maximum are not included in the cover pool as 'eligible' collateral). Residential mortgages (max 80% LTV) and commercial mortgages (max 60% LTV); if there are additional guarantees, LTVs can be raised to 95% and 80% respectively. No loans or part of loans are allowed if LTVs are above limits (they instead form part of the 'ineligible' mortgage book which still stand to the benefit of CH investors)
Public Sector Public sector exposures to EEA countries back public sector covered bonds in the form of loans or credits to central governments, local authorities or public companies linked to such institutions
Non-performing collateral Remain as part of the 'ineligible' mortgage bookSubstitution Assets CH can be backed up to a limit of 5% of issued capital by substitution assets, including EU
government bonds, other cedulas, mortgage bonds, MBS, eligible bank debt and other low risk, high quality assets
Hedging Used to minimise interest rate or currency risks. Entered on the asset register and rank pari passu with CB holders. Must be sourced from an EU or OECD bank rated at least A+/A1. Do not accelerate on issuer insolvency
Valuation Properties are valued by the lender or by a valuation company at origination. If the value of the property falls by over 20% (and exists for at least 12 months), the lender has the right to ask the extension of the loan to other assets to cover the required the 80% LTV limit; if the borrower does not take any action within two months, the lender can assume that it has decided to repay the loan in full. No indexation of mortgage collateral post-inclusion in the pool occurs
Other comments (if any)RequirementsALM matching Asset coverage Minimum OC of 25% for eligible mortgages and 43% for public sector exposures is legally
required. If minimum OC breached, there is a grace period of 10 days for mortgage collateral and 3 months for public sector collateral
Interest coverage Not applicableOther (if any) Minimum asset-liability NPV of 102%. The average maturity of outstanding bonds can not exceed
the average life of the mortgage claimsConsequence of breach Failure to meet the above requirements requires the issuing institution to either grant new
mortgages and add to the pool; add substitution collateral, to repurchase outstanding bonds from the secondary market; or to deposit cash or public funds at the BdE. Other regulatory actions by the BdE
Monitoring No specific cover pool monitor as collateral pool is backed by the entire mortgage book. Oversight provided through institutional audit process
OtherCompliance with EU legislation UCITS and CRD compliant
Source: National legislation, J.P. Morgan Covered Bond Research

221
Europe Credit Research12 September 2011
Gareth Davies, CFA(44-20) [email protected]
Flavio Marco Rusconi(44-20) [email protected]
Table 514: Spanish Covered Bond legislative overview: Multi-Cedulas programmes f
Attribute CommentaryFrameworkLegislative Framework Mortgage Market Law 41/2007, Royal Decree 716/2009, Law 22/2003Types of covered bonds One. Multi-Cedulas (MC) are backed by a collection of individually issued CHs and CTs as
described aboveStructure of Issuer Direct issuance? Yes. From an SPV
Comments (if any) The FTA (Fondo Titulización de Activos, or SPV) is managed by an SGFT (Sociedad Gestora de Fondo de Titulización), which is registered with CNMV (Spanish Securities Commission)
Bankruptcy remoteness Yes. Underlying CH or CT bonds are aggregated in an FTA, or bankruptcy remote vehicle, from which a multi-issuer backed covered bond is issued
Dual claim At the underlying CH or CT level. No cross-collateralisation of individual constituent CH or CT in the MC
Bond format Typically, fixed rate, soft bullet. Extendible maturity to allow the liquidation of the collateral pool backing the indiviudal CH or CTs backing the MC. Typically extendible to the longest CH or CT maturity in the pool, plus a work-out period (between three and twenty years)
Supervision Bank of Spain, Ministry of Economy and Commerce, CNMV Cover poolEligible assets Mortgage The collateral backing the multi-cedula are the individually structured covered bonds, which
in turn are backed by the mortgage or public-sector portfolios of the respective contributing institutions. The collateral used in MC are individual issues of cedulas with a dual claim to the issuer and the specific underlying assets
LTV caps At the underlying levelPublic Sector At the underlying levelNon-performing collateral At the underlying levelSubstitution Assets At the underlying level
Hedging Derivatives permitted. The SGFT uses OC, reserve funds, excess spread and liquidity facilities (similar to features used in a traditional securitisation) to match payments of the underlying pooled cedulas with those of the MC
Valuation At the underlying levelOther comments (if any)RequirementsALM matching Asset coverage Payment terms of the MC typically mirror those of the underlying CH or CT, ensuring no
funding mismatch. Interest coverage Liquidity lines or reserve funds provide only structural support in terms of covering the
payment of timely interest or expenses upon CH or CT default. The liquidity facilities are available to scheduled maturity, with MC become akin to pass-throughs if an underlying CH or CT is not redeemed on its expected maturity
Other (if any) Failure to pay interest on the MC can occur because the issuer of an underlying CH or CT has defaulted and the liquidity provider has either defaulted itself, or the facility has been depleted. Failure to pay principal on the MC can occur because the CH or CT issuer has defaulted and it has not proved possible to liquidate sufficient collateral in the underlying pool by the legal final maturity of the MC (either due to asset insufficiency or timing).
Consequence of breach n/aMonitoring TrusteeOtherCompliance with EU legislation Non UCITS and Non CRD compliant
Source: National legislation, J.P. Morgan Covered Bond Research
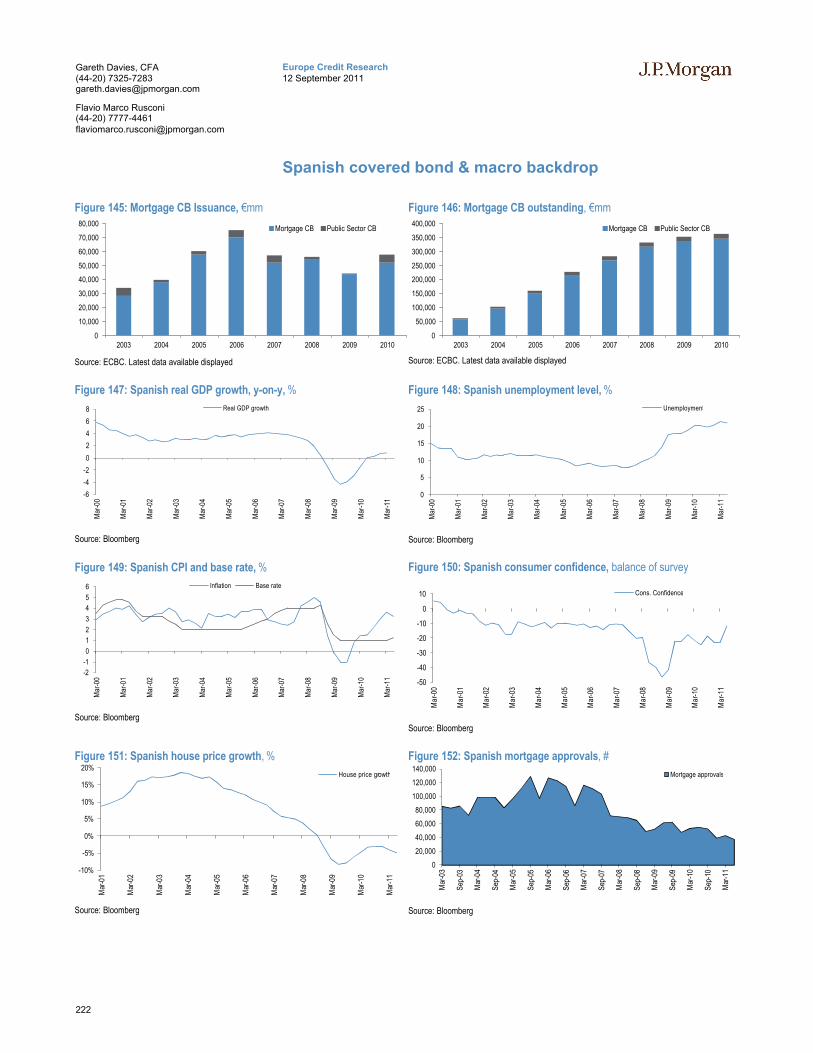
222
Europe Credit Research12 September 2011
Gareth Davies, CFA(44-20) [email protected]
Flavio Marco Rusconi(44-20) [email protected]
Spanish covered bond & macro backdrop
Figure 145: Mortgage CB Issuance, €mm
Source: ECBC. Latest data available displayed
Figure 146: Mortgage CB outstanding, €mm
Source: ECBC. Latest data available displayed
Figure 147: Spanish real GDP growth, y-on-y, %
Source: Bloomberg
Figure 148: Spanish unemployment level, %
Source: Bloomberg
Figure 149: Spanish CPI and base rate, %
Source: Bloomberg
Figure 150: Spanish consumer confidence, balance of survey
Source: Bloomberg
Figure 151: Spanish house price growth, %
Source: Bloomberg
Figure 152: Spanish mortgage approvals, #
Source: Bloomberg
0
10,000
20,000
30,000
40,000
50,000
60,000
70,000
80,000
2003 2004 2005 2006 2007 2008 2009 2010
Mortgage CB Public Sector CB
0
50,000
100,000
150,000
200,000
250,000
300,000
350,000
400,000
2003 2004 2005 2006 2007 2008 2009 2010
Mortgage CB Public Sector CB
-6
-4
-2
0
2
4
6
8
Mar
-00
Mar
-01
Mar
-02
Mar
-03
Mar
-04
Mar
-05
Mar
-06
Mar
-07
Mar
-08
Mar
-09
Mar
-10
Mar
-11
Real GDP growth
0
5
10
15
20
25
Mar
-00
Mar
-01
Mar
-02
Mar
-03
Mar
-04
Mar
-05
Mar
-06
Mar
-07
Mar
-08
Mar
-09
Mar
-10
Mar
-11
Unemployment
-2
-1
0
1
2
3
4
5
6
Mar
-00
Mar
-01
Mar
-02
Mar
-03
Mar
-04
Mar
-05
Mar
-06
Mar
-07
Mar
-08
Mar
-09
Mar
-10
Mar
-11
Inflation Base rate
-50
-40
-30
-20
-10
0
10
Mar
-00
Mar
-01
Mar
-02
Mar
-03
Mar
-04
Mar
-05
Mar
-06
Mar
-07
Mar
-08
Mar
-09
Mar
-10
Mar
-11
Cons. Confidence
-10%
-5%
0%
5%
10%
15%
20%
Mar
-01
Mar
-02
Mar
-03
Mar
-04
Mar
-05
Mar
-06
Mar
-07
Mar
-08
Mar
-09
Mar
-10
Mar
-11
House price growth
0
20,000
40,000
60,000
80,000
100,000
120,000
140,000
Mar
-03
Sep
-03
Mar
-04
Sep
-04
Mar
-05
Sep
-05
Mar
-06
Sep
-06
Mar
-07
Sep
-07
Mar
-08
Sep
-08
Mar
-09
Sep
-09
Mar
-10
Sep
-10
Mar
-11
Mortgage approvals

223
Europe Credit Research12 September 2011
Gareth Davies, CFA(44-20) [email protected]
Flavio Marco Rusconi(44-20) [email protected]
Standalone programmes:
Banco Bilbao Vizcaya Argentina (‘BBVA’)
(BBG: BBVASM)Snapshot
Banco Bilbao Vizcaya Argentaria (‘BBVA’) is the second largest Spanish financial institution with a strong international presence. The Group counts 35 million individual and corporate customers in over 32 countries and offers a wide range of financial services and products.
In Spain and Portugal, BBVA focuses on commercial and retail banking, consumer finance and insurance, as well as business development for SMEs and other companies and institutions.
The other main business line is Wholesale Banking & Asset Management. This division offers asset management, investment banking and global markets and product management throughout Europe, the Americas and Asia. BBVA targets Mexico and the Latin American markets in particular, where it offers pension, insurance and private banking products and services.
BBVA issued cédulas hipotecarias and territoriales. So far in 2011, it has issued €5.5bn in mortgage covered bonds and €2.1bn in public sector covered bonds.
Financial performance
We set out below some of the key financial performance metrics:
Table 515: Key profit & loss figures, €mm
FY 2008 FY 2009 FY 2010
Net interest income 12,133 14,325 13,849Provisions for loan losses 2,797 5,199 4,718NII less provisions 9,336 9,126 9,131
Comm.& fee income 5,539 5,305 5,382Other operating income 3,559 3,400 3,543Non-interest expense 13,991 12,845 13,542Operating profit 6,002 6,530 6,408
PBT 6,926 5,736 6,422Taxes 1,541 1,141 1,427Net profit (loss) 5,020 4,210 4,606
Source: Bloomberg
Table 516: Key balance sheet figures, €mm
FY 2008 FY 2009 FY 2010Real Estate Loans 145,522 148,874 150,782 Commercial Loans 107,686 51,021 90,408 Consumer Loans 127,890 126,488 135,868 Other Loans 105,745 112,864 120,934 Total Assets 542,650 535,065 552,738 Deposits 239,007 242,582 275,789 Short-term borrowings 74,225 75,936 74,776 Other short-term borrowings 46,252 36,044 38,819 Long-term borrowings 121,144 117,817 102,600 Equity 26,705 30,763 37,475
Source: Bloomberg
Table 517: Select financial metrics
FY 2008 FY 2009 FY 2010
NIM 2.5 2.9 2.8 ROA 1.0 0.8 0.8 ROE 19.0 15.3 14.1 ROC 2.2 1.9 2.2 C:I 59.6 50.5 53.3 Core Capital 7.9 9.4 10.5
Source: Bloomberg
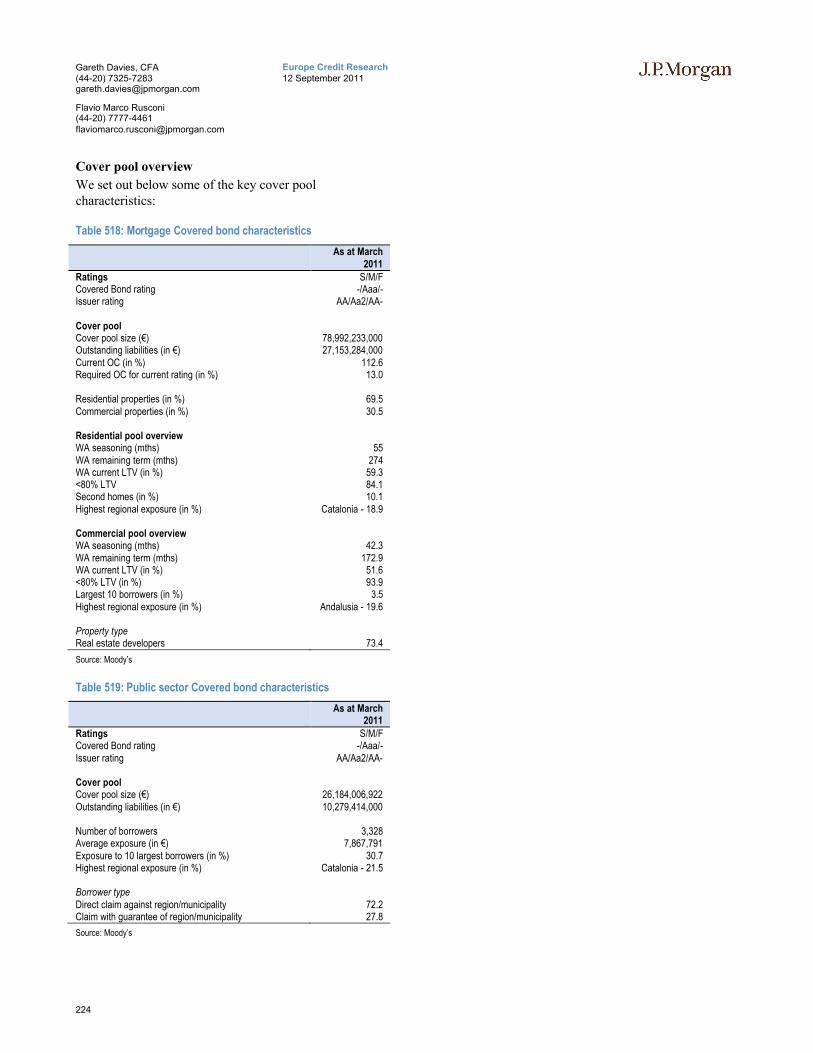
224
Europe Credit Research12 September 2011
Gareth Davies, CFA(44-20) [email protected]
Flavio Marco Rusconi(44-20) [email protected]
Cover pool overview
We set out below some of the key cover pool characteristics:
Table 518: Mortgage Covered bond characteristics
As at March 2011
Ratings S/M/FCovered Bond rating -/Aaa/-Issuer rating AA/Aa2/AA-
Cover poolCover pool size (€) 78,992,233,000Outstanding liabilities (in €) 27,153,284,000Current OC (in %) 112.6Required OC for current rating (in %) 13.0
Residential properties (in %) 69.5Commercial properties (in %) 30.5
Residential pool overviewWA seasoning (mths) 55 WA remaining term (mths) 274 WA current LTV (in %) 59.3 <80% LTV 84.1 Second homes (in %) 10.1 Highest regional exposure (in %) Catalonia - 18.9
Commercial pool overviewWA seasoning (mths) 42.3 WA remaining term (mths) 172.9 WA current LTV (in %) 51.6 <80% LTV (in %) 93.9 Largest 10 borrowers (in %) 3.5 Highest regional exposure (in %) Andalusia - 19.6
Property typeReal estate developers 73.4
Source: Moody’s
Table 519: Public sector Covered bond characteristics
As at March 2011
Ratings S/M/FCovered Bond rating -/Aaa/-Issuer rating AA/Aa2/AA-
Cover poolCover pool size (€) 26,184,006,922Outstanding liabilities (in €) 10,279,414,000
Number of borrowers 3,328Average exposure (in €) 7,867,791Exposure to 10 largest borrowers (in %) 30.7Highest regional exposure (in %) Catalonia - 21.5
Borrower type Direct claim against region/municipality 72.2Claim with guarantee of region/municipality 27.8
Source: Moody’s

225
Europe Credit Research12 September 2011
Gareth Davies, CFA(44-20) [email protected]
Flavio Marco Rusconi(44-20) [email protected]
Banco CAM
(BBG: CAJAME)Snapshot
Banco CAM was created as part of the reorganisation of the cajas system in Spain. Initially, CAM was originally to merge with Cajastur, Caja Santander y Cantabria and Caja Extremadura to form the new Banco Base, but the merger failed. Subsequently, the government injected capital but required the caja to restructure as a commercial bank, as part of a set of conditions for receiving public funds.
Before becoming Banco CAM, CAM was the fourth-largest savings bank in Spain by assets and was itself the product of the merger, over the years, of over 30 smaller cajas from the Valencia and Alicante provinces, which remain its core markets. Its core business remainsoffering banking services to individuals and SMEs. CAM’s role will be to manage social welfare projects financed through dividends paid by Banco CAM and act as holding company.
Financial performance
We set out below some of the key financial performance metrics:
Table 520: Key profit & loss figures, €mm
FY 2008 FY 2009 FY 2010Net interest income 1,292 1,456 909Provisions for loan losses 982 71 134NII less provisions 311 1,385 774
Comm.& fee income 231 232 199Other operating income 742 178 90Non-interest expense 1,415 756 787Operating profit -185 1,226 284
PBT 387 274 201Taxes -45 -2 -43Net profit (loss) 390 277 244
Source: Bloomberg
Table 521: Key balance sheet figures, €mm
FY 2008 FY 2009 FY 2010Real Estate Loans 42,288 39,150 36,171 Loans 58,495 52,429 50,850 Total Assets 75,473 71,442 70,667 Deposits 41,397 44,440 43,299 Short-term borrowings 13,147 9,814 12,326 Other short-term borrowings 578 417 390 Long-term borrowings 13,352 12,369 10,674 Equity 3,576 2,907 2,012
Source: Bloomberg
Table 522: Select financial metrics
FY 2008 FY 2009 FY 2010NIM 1.8 2.1 1.3 ROA 0.5 0.4 0.3 ROE 12.3 9.4 9.9 ROC 1.5 1.0 0.9 C:I 63.4 n/a 64.4 Core Capital 8.5 n/a n/a
Source: Bloomberg
Cover pool overview
We set out below some of the key cover pool characteristics:
Table 523: Mortgage covered bond characteristics
As at March 2011
Ratings S/M/FCovered Bond rating -/Baa1/-Issuer rating -/Ba1/BB+
Cover poolCover pool size (€) 32,961,970,736Outstanding liabilities (in €) 10,466,600,000Estimated eligible collateral (in €) 21,107,992,220Current OC (in %) 214.9
Residential properties (in %) 41.2Commercial properties (in %) 58.8
Residential pool overviewPool balance (in €) 13,593,540,437Average loan (in €) 81,289WA current LTV (in %) 61.7Highest regional exposure (in %) Valencia - 44.1
LTV breakdown0-40% LTV 21.1 41-50% LTV 11.1 51-60% LTV 14.0 61-70% LTV 15.2 71-80% LTV 16.9 >80% LTV 21.7
Commercial pool overviewPool balance (in €) 19,368,430,299 Average loan (in €) 157,324 WA seasoning (mths) 36 WA current LTV (in %) 59.9 Highest regional exposure (in %) Valencia - 40.4
LTV breakdown0-40% LTV 23.8 41-50% LTV 12.3 51-60% LTV 13.5 61-70% LTV 16.5 71-80% LTV 17.3 >80% LTV 16.6
Source: Moody’s

226
Europe Credit Research12 September 2011
Gareth Davies, CFA(44-20) [email protected]
Flavio Marco Rusconi(44-20) [email protected]
Table 524: Public sector Covered bond characteristics
As at 31 Mar 2010
Ratings S/M/FCovered Bond rating -/A3/-
Cover poolCover pool size (€) 1,111,736,153Outstanding liabilities (in €) 400,000,000Current OC (in %) 177.9
Average exposure (in €) 739,186 Exposure to 10 largest borrowers (in %) 40.6 Highest regional exposure (in %) Valencia - 64.9
Borrower type Direct claim against region/municipality/federal state 88.6 Other 11.4
Source: Moody’s

227
Europe Credit Research12 September 2011
Gareth Davies, CFA(44-20) [email protected]
Flavio Marco Rusconi(44-20) [email protected]
Banco Espanol de Credito (‘Banesto’)
(BBG: BANEST)Snapshot
Banco Espanol de Credito (‘Banesto’) was founded in Madrid in 1902 with French capital but is currently 97% owned by the Santander Group.
Banesto’s main activity in Spain is commercial banking, particularly retail banking to individuals and SMEs. It also offers private and personal banking products to wealthy individuals. The bank also offers wholesale banking services, including corporate banking, treasury, capital markets, stock market brokerage and international business.
Banesto issues cédulas hipotecarias. So far this year it has issued €1.5bn of mortgage covered bonds, paying up to MS+190bp for a 4 years maturity bond.
Financial performance
We set out below some of the key financial performance metrics:
Table 525: Key profit & loss figures, €mm
FY 2008 FY 2009 FY 2010Net interest income 1,774 1,841 1,766Provisions for loan losses 300 452 811NII less provisions 1,475 1,389 955
Comm.& fee income 706 662 667Other operating income 162 129 281Non-interest expense 1,356 1,462 1,220Operating profit 1,137 954 784
PBT 1,081 779 608Taxes 306 221 151Net profit (loss) 780 560 460
Source: Bloomberg
Table 526: Key balance sheet figures, €mm
FY 2008 FY 2009 FY 2010Real Estate Loans 37,615 37,716 38,163 Loans 72,899 72,220 70,789 Total Assets 120,479 126,221 120,620 Deposits 41,919 40,961 47,071 Short-term borrowings 12,407 14,028 7,551 Other short-term borrowings 7,751 9,215 8,293 Long-term borrowings 30,552 32,258 31,719 Equity 5,154 5,473 5,477
Source: Bloomberg
Table 527: Select financial metrics
FY 2008 FY 2009 FY 2010NIM 1.6 1.6 1.6 ROA 0.7 0.5 0.4 ROE 16.0 10.6 8.5 ROC 1.2 0.9 0.7 C:I 45.7 48.8 40.8 Core Capital 7.7 8.7 n/a
Source: Bloomberg
Cover pool overview
We set out below some of the key cover pool characteristics:
Table 528: Covered bond characteristics
As at June 2011
Ratings S/M/FCovered Bond rating -/Aaa/AAIssuer rating AA/A2/AA
Cover poolCover pool size (€) 30,929,134,841Outstanding liabilities (in €) 17,889,360,000Estimated eligible collateral (in €) 24,156,002,808Current OC (in %) 72.9 Required OC for current rating (in %) 28.0
Residential properties (in %) 78.8 Commercial properties (in %) 21.2
Residential pool overviewPool balance (in €) 23,668,377,045 Number of loans 222,152 Average loan (in €) 106,541 Estimated WA current LTV (in %) 57.4 Highest regional exposure (in %) Andalusia - 22.5 Second homes (in %) 1.6
LTV breakdown0-40% LTV 20.5 41-50% LTV 11.7 51-60% LTV 14.7 61-70% LTV 20.8 71-80% LTV 17.8 >80% LTV 14.5
Commercial pool overviewPool balance (in €) 6,353,022,309 Number of loans 8,754 Average loan (in €) 725,728 WA remaining term (mths) 123 Estimated WA current LTV (in %) 56.0 Largest 10 borrowers (in %) 18.2 Highest regional exposure (in %) Madrid - 33.6
LTV breakdown0-40% LTV 25.3 41-50% LTV 10.5 51-60% LTV 15.7 61-70% LTV 15.3 71-80% LTV 14.3 >80% LTV 18.8
Source: Moody’s

228
Europe Credit Research12 September 2011
Gareth Davies, CFA(44-20) [email protected]
Flavio Marco Rusconi(44-20) [email protected]
Banco Pastor
(BBG: PASSM)Snapshot
Banco Pastor is the seventh largest banking group in Spain and the leader in Galicia, where it has a market share of loans and deposits of over 10% in 2010. Despite its strong ties with the domestic region, 62% of its branches are located outside of Galicia.
The bank focuses on deposit-taking and lending to individuals and SMEs but also offers investment management and pension funds products. It operates a network of over 600 branches throughout Spain and has a small international presence, with 10 branches in Europe and the Americas.
The largest shareholder is the Fundacion Pedro Burrie de la Maza (a private foundation devoted to promoting the development of Galicia), which holds approximately 42% of the institution’s share capital. The other largest single shareholders are Nocaixagalicia (5.4%), Ponte Gadea group (5.1%) and Casagrande Cartagena (3.9%), while 24% and 19% are in the hands of retail and institutional investors respectively.
Banco Pastor issues cédulas hipotecarias.
Financial performance
We set out below some of the key financial performance metrics:
Table 529: Key profit & loss figures, €mm
FY 2008 FY 2009 FY 2010
Net interest income 526 540 473Provisions for loan losses 229 588 283NII less provisions 297 -49 190
Comm.& fee income 187 178 161Other operating income 70 69 65Non-interest expense 448 433 445Operating profit 264 113 95
PBT 199 125 13Taxes 57 26 -12Net profit (loss) 164 101 62
Source: Bloomberg
Table 530: Key balance sheet figures, €mm
FY 2008 FY 2009 FY 2010Real Estate Loans 11,746 13,447 13,939 Loans 20,788 20,385 21,652 Total Assets 27,121 32,325 31,135 Deposits 13,247 13,659 15,025 Short-term borrowings 3,186 7,303 6,699 Other short-term borrowings 1,459 1,078 637 Long-term borrowings 7,197 8,317 7,002 Equity 1,507 1,610 1,606
Source: Bloomberg
Table 531: Select financial metrics
FY 2008 FY 2009 FY 2010NIM 2.1 1.9 1.6 ROA 0.6 0.3 0.2 ROE 11.0 6.9 4.3 ROC 1.4 0.7 0.4 C:I 46.2 36.7 52.1 Core Capital 7.5 10.6 10.6
Source: Bloomberg

229
Europe Credit Research12 September 2011
Gareth Davies, CFA(44-20) [email protected]
Flavio Marco Rusconi(44-20) [email protected]
Cover pool overview
We set out below some of the key cover pool characteristics:
Table 532: Covered bond characteristics
As at March 2011
Ratings S/M/FCovered Bond rating -/Baa1/-Issuer rating -/Ba1/-
Cover poolCover pool size (€) 13,179,568,062Outstanding liabilities (in €) 6,233,100,000Estimated eligible collateral (in €) 8,751,272,400Current OC (in %) 111.4 Required OC for current rating (in %) 11.0
Residential properties (in %) 50.4 Commercial properties (in %) 49.6
Residential pool overviewPool balance (in €) 6,439,470,641 Number of loans 54,467 Average loan (in €) 118,227 WA seasoning (mths) 35 WA remaining term (mths) 320 WA current LTV (in %) 58.6 Highest regional exposure (in %) Catalonia - 23.0
LTV breakdown0-40% LTV 21.9 41-50% LTV 10.7 51-60% LTV 14.0 61-70% LTV 18.9 71-80% LTV 31.2 >80% LTV 3.3
Commercial pool overviewPool balance (in €) 6,344,920,825 Number of loans 7,576 Average loan (in €) 837,503 WA seasoning (mths) 27.6 WA remaining term (mths) 155.9 WA current LTV (in %) 47.2 Largest 10 loans (in %) 7.8 Largest 10 borrowers (in %) 17.9 Highest regional exposure (in %) Galicia - 27.6
LTV breakdown0-40% LTV 44.8 41-50% LTV 12.1 51-60% LTV 12.9 61-70% LTV 12.8 71-80% LTV 10.4 >80% LTV 7.0
Source: Moody’s

230
Europe Credit Research12 September 2011
Gareth Davies, CFA(44-20) [email protected]
Flavio Marco Rusconi(44-20) [email protected]
Banco Popular Espanol
(BBG: POPSM)Snapshot
Banco Popular Espanol is currently the third largest commercial financial group in Spain, although much smaller than the two institutions in front of it, Santander and BBVA, and set to be overtaken by Bankia once the integration of the underlying lenders is finalised. The group focuses exclusively on the domestic retail and commercial banking businesses, with a network of over 2,300 branches and a market share of around 5% (and around 10% in a number of SME-related lines of business).
In 2010, Banco Popular entered into a JV with Credit Mutuel to create a new bank in Spain, to which the group will contribute €2bn of loans and €1.7bn of AUM. In 2011, BPE joined forces with Allianz, combining its asset management operations with the insurer's pensions and insurance businesses.
Banco Popular issues cédulas hipotecarias.
Financial performance
We set out below some of the key financial performance metrics:
Table 533: Key profit & loss figures, €mm
FY 2008 FY 2009 FY 2010Net interest income 2,559 2,830 2,462Provisions for loan losses 905 1,520 1,106NII less provisions 1,654 1,310 1,356
Comm.& fee income 1,016 885 867.915Other operating income 132 60 319Non-interest expense 1,539 1,485 1,698Operating profit 1,391 1,176 1,044
PBT 1,461 1,073 833Taxes 390 293 228Net profit (loss) 1,052 766 590
Source: Bloomberg
Table 534: Key balance sheet figures, €mm
FY 2008 FY 2009 FY 2010Real Estate Loans 48,420 47,782 48,896 Loans 89,780 94,956 96,032 Total Assets 110,376 129,290 130,140 Deposits 44,973 52,908 59,324 Short-term borrowings 14,264 23,900 12,650 Other short-term borrowings 2,396 2,107 2,138 Long-term borrowings 31,740 32,991 25,402 Equity 8,346 8,448 8,252
Source: Bloomberg
Table 535: Select financial metrics
FY 2008 FY 2009 FY 2010NIM 2.5 2.5 2.0 ROA 1.0 0.6 0.5 ROE 16.2 11.0 7.7 ROC 1.8 1.2 0.9 C:I 37.7 33.6 42.3 Core Capital 8.1 9.1 9.6
Source: Bloomberg

231
Europe Credit Research12 September 2011
Gareth Davies, CFA(44-20) [email protected]
Flavio Marco Rusconi(44-20) [email protected]
Cover pool overview
We set out below some of the key cover pool characteristics:
Table 536: Covered bond characteristics
As at June 2011
Ratings S/M/FCovered Bond rating AAA/Aaa/AA+Issuer rating A-/A2/A-
Cover poolCover pool size (€) 35,617,095,287Outstanding liabilities (in €) 18,752,800,000Eligible collateral (in €) 24,603,673,600Current OC (in %) 89.9
Residential properties (in %) 39.0 Commercial properties (in %) 61.0
Residential pool overviewPool balance (in €) 13,687,771,111 Number of loans 143,831 Average loan (in €) 95,103 WA seasoning (mths) 44 WA remaining term (mths) 259 WA current LTV (in %) 57.7 Holiday homes 16.9 Highest regional exposure (in %) Andalusia - 31.9
LTV breakdown0-40% LTV 22.0 41-50% LTV 11.7 51-60% LTV 14.7 61-70% LTV 18.6 71-80% LTV 18.4 >80% LTV 14.7
Commercial pool overviewPool balance (in €) 21,367,592,178 Number of loans 45,393 Average loan (in €) 470,724 WA seasoning (mths) 29 WA remaining term (mths) 140 WA current LTV (in %) 50.3 Largest 10 loans (in %) 5.8 Largest 10 borrowers (in %) 7.3 Highest regional exposure (in %) Andalusia - 23.0
LTV breakdown0-40% LTV 33.8 41-50% LTV 12.8 51-60% LTV 14.1 61-70% LTV 15.1 71-80% LTV 8.7 >80% LTV 15.5
Property typeRetail 23.6 Land 22.0 Real estate developments 21.7 Office 18.5 Industrial 12.3 Other 2.0
Source: Moody’s

232
Europe Credit Research12 September 2011
Gareth Davies, CFA(44-20) [email protected]
Flavio Marco Rusconi(44-20) [email protected]
Banco Sabadell
(BBG: SABSM)Snapshot
Banco Sabadell is Spain’s sixth largest banking group, and offers a wide range of financial products throughout the country via different brands and names. The group also operates in Africa, Asia and the Americas via a number of branches, representative offices and subsidiaries or part-owned companies.
Banco Sabadell is structured along five business lines: Commercial Banking; Corporate Banking & Global Operations; Markets & Private Banking, BS America and Bancassurance. The group's largest business line is Commercial Banking, which provides a range of financial products and services for large and medium-sized companies, SMEs, other small businesses, individuals and administrations.
The Corporate Banking & Global Operations department deals with the bank’s largest customers, who require unique features and complexity; it offers Structured Finance, Treasury and Capital Markets and Corporate Finance services.
Banco Sabadell issues cédulas hipotecarias
Financial performance
We set out below some of the key financial performance metrics:
Table 537: Key profit & loss figures, €mm
FY 2008 FY 2009 FY 2010Net interest income 1,460 1,615 1,475Provisions for loan losses 571 226 396NII less provisions 889 1,390 1,079
Comm.& fee income 610 562 571Other operating income 87 64 72Non-interest expense 1,224 1,286 1,316Operating profit 480 1,028 670
PBT 260 571 464Taxes 12 45 81Net profit (loss) 674 522 380
Source: Bloomberg
Table 538: Key balance sheet figures, €mm
FY 2008 FY 2009 FY 2010Real Estate Loans 35,677 36,280 40,016Loans 63,006 63,233 73,981Total Assets 80,378 82,823 97,099Deposits 36,442 37,407 48,843Short-term borrowings 8,722 9,577 10,334Other short-term borrowings 1,513 2,701 2,743Long-term borrowings 24,118 24,852 21,894Equity 4,448 5,297 5,689
Source: Bloomberg
Table 539: Select financial metrics
FY 2008 FY 2009 FY 2010NIM 2.0 2.1 1.8ROA 0.9 0.6 0.4ROE 14.9 10.8 7.0ROC 1.7 1.3 0.9C:I 52.7 49.6 54.2Core Capital 7.3 9.1 9.4
Source: Bloomberg

233
Europe Credit Research12 September 2011
Gareth Davies, CFA(44-20) [email protected]
Flavio Marco Rusconi(44-20) [email protected]
Cover pool overview
We set out below some of the key cover pool characteristics:
Table 540: Covered bond characteristics
As at March 2011
Ratings S/M/FCovered Bond rating -/Aaa/-Issuer rating A/A3/A-
Cover poolCover pool size (€) 22,152,304,607Outstanding liabilities (in €) 12,938,700,000Estimated eligible collateral (in €) 18,114,180,000Current OC (in %) 71.2 Required OC for current rating (in %) 59.0
Residential properties (in %) 45.0 Commercial properties (in %) 55.0
Residential pool overviewNumber of loans 95,622 Average loan (in €) 104,162 WA seasoning (mths) 49 WA current LTV (in %) 55.8 Highest regional exposure (in %) Catalonia - 39.4 Second homes (in %) 15.6
LTV breakdown0-40% LTV 23.7 41-50% LTV 13.2 51-60% LTV 16.4 61-70% LTV 19.5 71-80% LTV 17.6 >80% LTV 9.6
Commercial pool overviewNumber of loans 27,228 Average loan (in €) 447,778 WA seasoning (mths) 34 WA current LTV (in %) 50.4 Largest 10 loans (in %) 5.1 Largest 10 borrowers (in %) 10.9 Highest regional exposure (in %) Catalonia - 41.4
Property type Real estate developments 26.9 Land 26.5 Industrial 9.4 Retail 8.2 Office 5.4 Hotel 5.4 Other 18.2
LTV breakdown0-40% LTV 31.3 41-50% LTV 16.9 51-60% LTV 19.3 61-70% LTV 18.0 71-80% LTV 9.4 >80% LTV 5.1
Source: Moody’s

234
Europe Credit Research12 September 2011
Gareth Davies, CFA(44-20) [email protected]
Flavio Marco Rusconi(44-20) [email protected]
Banco Santander
(BBG: SANTAN)Snapshot
The Santander Group is the fourth largest bank in the world by profits and the eighth by market capitalisation.
The group has a strong international presence, with 91 million customers across 9 core markets in Europe and the Americas.
The group’s core activity, and the largest source of its profits, is traditional retail banking. In continental Europe, it operates in Spain, Portugal and Germany, offering retail and wholesale banking, asset management and insurance products. In the UK it focuses mostly on retail banking. Outside of Europe, Santander has branches and subsidiaries in Latin America, mainly in Brazil, Mexico, Chile and Argentina and in the US, where it operates under the name Sovereign Bank.
The bank’s secondary focus is on commercial banking, insurance, asset management and global private banking.
Banco Santander issues both cédulas hipotecarias and territoriales.
Financial performance
We set out below some of the key financial performance metrics:
Table 541: Key profit & loss figures, €mm
FY 2008 FY 2009 FY 2010Net interest income 18,091 26,735 29,586Provisions for loan losses 5,897 11,088 10,267NII less provisions 12,194 15,647 19,320
Comm.& fee income 9,741 10,726 11,680Other operating income 1,302 1,155 1,411Non-interest expense 17,051 20,870 22,579Operating profit 9,661 10,904 12,437
PBT 10,849 10,588 12,052Taxes 1,836 1,207 2,923Net profit (loss) 8,876 8,943 8,181
Source: Bloomberg
Table 542: Key balance sheet figures, €mm
FY 2008 FY 2009 FY 2010Real Estate Loans 351,609 411,778 430 Commercial Loans 178,364 186,693 207,371 Consumer Loans 347,201 379,297 395,622 Other Loans 113,789 134,433 140,858 Total Assets 1,049,632 1,110,529 1,212,017 Deposits 378,749 468,283 575,360 Short-term borrowings 141,395 149,535 99,137 Other short-term borrowings 115,879 91,112 121,180 Long-term borrowings 266,516 243,295 226,116 Equity 60,001 73,871 80,914
Source: Bloomberg
Table 543: Select financial metrics
FY 2008 FY 2009 FY 2010NIM 2.0 2.7 2.8ROA 0.9 0.8 0.7ROE 15.7 14.2 11.4ROC 1.8 1.9 1.9C:I 50.0 46.6 47.6Core Capital 9.1 10.1 10.0
Source: Bloomberg

235
Europe Credit Research12 September 2011
Gareth Davies, CFA(44-20) [email protected]
Flavio Marco Rusconi(44-20) [email protected]
Cover pool overview
We set out below some of the key cover pool characteristics:
Table 544: Mortgage Covered bond characteristics
As at March 2011
Ratings S/M/FCovered Bond rating -/Aaa/AAAIssuer rating AA/Aa2/AA
Cover poolCover pool size (€) 54,507,420,570Outstanding liabilities (in €) 27,410,000,000Current OC (in %) 98.9Required OC for current rating (in %) 17.5
Residential properties (in %) 57.3Commercial properties (in %) 42.7
Residential pool overviewNumber of loans 352,572Average loan (in €) 88,587WA Current LTV (%) 58.6 Second homes (in %) 5.0 Highest regional exposure (in %) Madrid - 21.3
LTV breakdown0-40% 26.3 41-60% 23.8 61-80% 24.7 >80% 25.2
Commercial pool overviewEstimated WA current LTV (in %) 56.1 Highest regional exposure (in %) Madrid - 23.2
LTV breakdown0-40% 29.2 41-60% 24.4 61-80% 23.6 >80% 22.8
Source: Moody’s
Table 545: Public sector Covered bond characteristics
As at June 2011
Ratings S/M/FCovered Bond rating -/Aaa/-Issuer rating AA/Aa2/AA
Cover poolCover pool size (€) 7,858,309,241 Outstanding liabilities (in €) 3,000,000,000 Current OC (in %) 161.9
Average exposure (in €) 4,742,492 Exposure to 10 largest borrowers (in %) 50.3 Highest regional exposure (in %) Andalusia - 17.6
Borrower type Direct claim against region/municipality/federal state 95.5 Claim with guarantee of region/municipality 4.5
Source: Moody’s

236
Europe Credit Research12 September 2011
Gareth Davies, CFA(44-20) [email protected]
Flavio Marco Rusconi(44-20) [email protected]
Bankia
(BBG: BKIASM)Snapshot
Bankia, the result of the institutional protection scheme (SIP) combining Caja Madrid, Bancaja, Caixa Layetana, Caja Avila, Caja Segovia, Caja Rioja and Caja Insular de Canarias, is one of the largest financial groups in Spain, with pro forma total assets of €292bn at the end of 2010. The individual savings banks will be responsible for the management of social welfare projects financed with the dividends paid by Bankia.
There is still very little information on the breakdown of the group’s assets, but according to Moody's, as of March 2011 loans to individuals contributed to 69% of the loans book, followed by loans to corporates (28%).
The group will have a market share of above 20% in 8 Spanish provinces and of 12-13% in the national market for a number of key retail banking products, according to Moody's, although this is likely to be reduced somewhat as a number of branches will be closed as part of the integration process.
The international presence of the bank is limited, with only Caja Madrid operating outside of the core domestic market.
Financial performance
We set out below some of the key financial performance metrics:
Table 546: Key profit & loss figures, €mm
FY 2008 FY 2009 FY 2010Net interest income 3,289Provisions for loan losses 33NII less provisions 3,256
Comm.& fee income 150Other operating income 150Non-interest expense 2,915Operating profit 2,587
PBT 359Taxes 3Net profit (loss) 357
Source: Bloomberg
Table 547: Key balance sheet figures, €mm
FY 2008 FY 2009 FY 2010Loans 196,283 Total Assets 292,188 Deposits 144,715 Short-term borrowings 49,496 Other short-term borrowings 15,735 Long-term borrowings 64,186 Equity 13,413
Source: Bloomberg
Table 548: Select financial metrics
FY 2008 FY 2009 FY 2010
C:I 52.7
Source: Bloomberg
Cover pool overview
We set out below the latest key cover pool characteristics available for the two largest contributors to Bankia’s cover pool, Caja Madrid and Bancaja.
Table 549: Caja Madrid Mortgage Covered bond characteristics
As at March 2011
Cover poolCover pool size (€) 68,412,875,072Outstanding liabilities (in €) 32,835,750,000Current OC (in %) 46,790,943,750
Residential properties (in %) 73.9Commercial properties (in %) 26.1
Residential pool overviewAverage loan (in €) 99,050WA current LTV (in %) 62.5Highest regional exposure (in %) Madrid - 44.3
LTV breakdown0-40% LTV 16.0 41-50% LTV 11.0 51-60% LTV 14.7 61-70% LTV 18.8 71-80% LTV 25.0 >80% LTV 14.5
Commercial pool overviewWA current LTV (in %) 64.5 Highest regional exposure (in %) Madrid - 37.8 Real estate developments 76.0
LTV breakdown0-40% LTV 17.6 41-50% LTV 9.1 51-60% LTV 17.1 61-70% LTV 21.3 71-80% LTV 18.2 >80% LTV 16.7
Source: Moody’s

237
Europe Credit Research12 September 2011
Gareth Davies, CFA(44-20) [email protected]
Flavio Marco Rusconi(44-20) [email protected]
Table 550: Bancaja Mortgage Covered bond characteristics
As at September 2010
Cover poolCover pool size (€) 31,270,373,785Outstanding liabilities (in €) 7,828,920,000Estimated eligible collateral (in €) 14,326,923,600Current OC (in %) 299.4 Required OC for current rating (in %) 65.0
Residential properties (in %) 36.8 Commercial properties (in %) 63.2
Residential pool overviewNumber of loans 114,131 Average loan (in €) 100,738 WA seasoning (mths) 34 WA remaining term (mths) 341 WA current LTV (in %) 66.3 Second homes (in %) 10.7 Prior ranks (in %) 3.3 Highest regional exposure (in %) Valencia - 49.5
LTV breakdown0-40% LTV 12.4 41-50% LTV 9.2 51-60% LTV 13.3 61-70% LTV 19.5 71-80% LTV 28.4 >80% LTV 17.2
Commercial pool overviewNumber of loans 22,128 Average loan (in €) 893,577 WA seasoning (mths) 30 WA remaining term (mths) 167 WA current LTV (in %) 56.7 Largest 10 loans (in %) 4.9 Largest 10 borrowers (in %) 17.6 Highest regional exposure (in %) Valencia - 49.0
Property typeReal estate developers 38.5 Land 36.2 Office 20.1 Industrial 5.2
LTV breakdown0-40% LTV 22.5 41-50% LTV 11.8 51-60% LTV 16.2 61-70% LTV 26.3 71-80% LTV 14.8 >80% LTV 8.6
Source: Moody’s
Table 551: Caja Madrid Public sector Covered bond characteristics
As at March 2011
Cover poolCover pool size (€) 3,028,033,252Outstanding liabilities (in €) 1,825,000,000Current OC (in %) 65.9
Average exposure (in €) 5,407,202Exposure to 10 largest borrowers (in %) 40.9Highest regional exposure (in %) Madrid - 47.8
Borrower type Direct claim against region/municipality/federal state 68.8Claim with guarantee of region/municipality 31.2
Source: Moody’s

238
Europe Credit Research12 September 2011
Gareth Davies, CFA(44-20) [email protected]
Flavio Marco Rusconi(44-20) [email protected]
Bankinter
(BBG: BKTSM)Snapshot
Bankinter was founded in 1962 as a JV between Santander and Bank of America. Initially, it was set up as an industrial bank, but it was transformed into a commercial bank for its listing on the Madrid stock exchange in 1972.
It is currently amongst the top 6 Spanish financial institutions and provides a range of banking and financial services to individuals, SMEs and corporates in its core domestic market.
The bank was one of the first to embrace the new ways to reach clients and do banking in the modern age: more than 60% of its retail banking transactions are now performed through remote channels, such as telephone and the internet, which alone contributes for 46% of all transactions.
Bankinter has maintained relatively tight underwriting standards, despite growing through the years, and as a consequence it has one of the best performing mortgage books amongst Spanish financial institutions.
More than 20% of the bank is owned by France’s Credit Agricole. Bankinter issues cédulas hipotecarias.
Financial performance
We set out below some of the key financial performance metrics:
Table 552: Key profit & loss figures, €mm
FY 2008 FY 2009 FY 2010Net interest income 681 796 564Provisions for loan losses 186 219 216NII less provisions 495 577 348
Comm.& fee income 303 271 261.479Other operating income 29 470 234Non-interest expense 639 1,037 745Operating profit 291 370 219
PBT 337 346 205Taxes 85 92 54Net profit (loss) 252 254 151
Source: Bloomberg
Table 553: Key balance sheet figures, €mm
FY 2008 FY 2009 FY 2010Real Estate Loans 29,300 29,153 32,396 Loans 40,897 39,877 41,679 Total Assets 53,470 54,467 54,152 Deposits 17,294 16,601 19,215 Short-term borrowings 11,256 7,583 5,764 Other short-term borrowings 1,598 1,900 2,114 Long-term borrowings 15,414 19,620 18,539 Equity 1,965 2,583 2,580
Source: Bloomberg
Table 554: Select financial metrics
FY 2008 FY 2009 FY 2010NIM 1.4 1.5 1.1 ROA 0.5 0.5 0.3 ROE 13.6 11.2 5.8 ROC 0.8 0.7 0.5 C:I 54.1 62.2 60.9 Core Capital 7.4 7.4 7.3
Source: Bloomberg

239
Europe Credit Research12 September 2011
Gareth Davies, CFA(44-20) [email protected]
Flavio Marco Rusconi(44-20) [email protected]
Cover pool overview
We set out below some of the key cover pool characteristics:
Table 555: Covered bond characteristics
As at June 2011
Ratings S/M/FCovered Bond rating -/Aaa/-Issuer rating A/A2/-
Cover poolCover pool size (€) 17,638,034,450Outstanding liabilities (in €) 7,029,325,166Current OC (in %) 150.9 Required OC for current rating (in %) 46.0
Residential properties (in %) 59.9 Commercial properties (in %) 40.1
Residential pool overviewPool balance (in €) 10,563,599,110 Number of loans 89,919 Average loan (in €) 117,479 WA seasoning (mths) 46 WA current LTV (in %) 60.2 Highest regional exposure (in %) Madrid - 35.6 Second homes (in %) 8.6
LTV breakdown0-40% LTV 22.8 41-50% LTV 13.2 51-60% LTV 16.3 61-70% LTV 17.8 71-80% LTV 20.3 >80% LTV 9.6
Commercial pool overviewPool balance (in €) 7,074,435,340 Number of loans 25,659 Average loan (in €) 275,710 WA seasoning (mths) 38 WA remaining term (mths) 196 WA current LTV (in %) 70.6 Largest 10 borrowers (in %) 4.9 Highest regional exposure (in %) Madrid - 29.1
Property type Retail 19.7 Real estate developments 11.1 Land 11.0 Office 1.6 Other 56.8
LTV breakdown0-40% LTV 26.8 41-50% LTV 14.8 51-60% LTV 15.0 61-70% LTV 14.2 71-80% LTV 7.7 >80% LTV 21.5
Source: Moody’s

240
Europe Credit Research12 September 2011
Gareth Davies, CFA(44-20) [email protected]
Flavio Marco Rusconi(44-20) [email protected]
Bilbao Bizkaia Kutxa (‘BBK’)
(BBG: BILBIZ)Snapshot
Caja de Ahorros de Bilbao y Vizcaya (BBK) is a savings bank based in the Basque Country, where most of its client base is located. The bank is the product of the merger of Caja de Ahorros Municipal de Bilbao and the Bizkaiko Aurrezki Kutxa-Caja de Ahorros Vizcaína. According to Moody's, the bank has leading market shares in the Basque Country provinces: 42% and 28% of deposits and lending respectively.
In 2010, BBK won a bid for Cajasur, the Cordoba-based caja that was put into administration earlier in the year. The acquisition became effective as of January 2011, when all assets and liabilities of Cajasur were transferred to BBK.
In 2011, BBK signed an agreement with the other two Basque savings banks, Kutxa and Vital Kutxa, which will lead to the creation of Kutxa Bank in January 2012, although the three banks will keep their own brand names in their traditional territories. The three cajas will transfer assets and liabilities to the new entity but will continue to manage social welfare projects separately.
BBK will be the largest contributor to Kutxa Bank with 57%, followed by Kutxa (32%) and Vital Kutxa (11%).
The bank issues cédulas hipotecarias.
Financial performance
We set out below some of the key financial performance metrics:
Table 556: Key profit & loss figures, €mm
FY 2008 FY 2009 FY 2010Net interest income 548 490 514Provisions for loan losses 145 158 113NII less provisions 404 332 401
Comm.& fee income 144 151 166Other operating income 209 162 171Non-interest expense 574 506 443Operating profit 281 146 296
PBT 327 275 234Taxes -15 -18 -29Net profit (loss) 339 289 258
Source: Bloomberg
Table 557: Key balance sheet figures, €mm
FY 2008 FY 2009 FY 2010Real Estate Loans 14,866 15,515 16,139 Loans 20,978 21,178 21,601 Total Assets 29,667 29,806 29,112 Deposits 17,095 16,884 17,133 Short-term borrowings 2,074 4,332 4,606 Other short-term borrowings 90 191 144 Long-term borrowings 2,512 1,263 812 Equity 3,914 4,123 3,978
Source: Bloomberg
Table 558: Select financial metrics
FY 2008 FY 2009 FY 2010NIM 2.0 1.8 1.9 ROA 1.2 1.0 0.9 ROE 7.8 7.3 6.4 ROC 2.9 2.5 2.3 C:I 56.7 61.6 50.9 Core Capital n/a 14.6 16.7
Source: Bloomberg

241
Europe Credit Research12 September 2011
Gareth Davies, CFA(44-20) [email protected]
Flavio Marco Rusconi(44-20) [email protected]
Cover pool overview
We set out below some of the key cover pool characteristics:
Table 559: Covered bond characteristics
As at June 2011
Ratings S/M/FCovered Bond rating -/A1/-Issuer rating A/Baa3/A
Cover poolCover pool size (€) 13,833,918,424Outstanding liabilities (in €) 4,137,900,000Estimated eligible collateral (in €) 9,033,035,700Current OC (in %) 234.3 Required OC for current rating (in %) 17.0
Residential properties (in %) 80.9 Commercial properties (in %) 19.1
Residential pool overviewPool balance (in €) 11,190,810,150 Average loan (in €) 106,684 WA seasoning (mths) 47 WA current LTV (in %) 62.8 Highest regional exposure (in %) Basque Country
- 50.6 Second homes (in %) 4.7
LTV breakdown0-40% LTV 18.2 41-50% LTV 11.8 51-60% LTV 13.1 61-70% LTV 13.9 71-80% LTV 20.9 >80% LTV 22.1
Commercial pool overviewPool balance (in €) 2,643,108,092 Average loan (in €) 233,387 WA seasoning (mths) 53 WA current LTV (in %) 48.2 Highest regional exposure (in %) Basque Country
- 67.4
Property typeRED 41.7 Retail 19.9 Land 9.8 Industrial 9.1 Office 3.3 Other 13.8
LTV breakdown0-40% LTV 43.7 41-50% LTV 13.0 51-60% LTV 12.4 61-70% LTV 11.8 71-80% LTV 9.0 >80% LTV 10.3
Source: Moody’s

242
Europe Credit Research12 September 2011
Gareth Davies, CFA(44-20) [email protected]
Flavio Marco Rusconi(44-20) [email protected]
Caixa d’Estalvis de Catalunya, Tarragona i Manresa (‘CatalunyaCaixa’)
(BBG: CAIXAC)Snapshot
CatalunyaCaixa Group was formed in July 2010, the outcome of the merger of Caixa Catalunya, Caixa Tarragona and Caixa Manresa, three institutions closely linked to the Catalunya region. The merger took place under the framework of the FROB and the wider process of the restructuring of the Spanish cajas system.
The new institution has more than €81 billion in consolidated assets and offers local retail banking and personal financial advisory services and products through 1,200 branches.
The largest of the three underlying cajas is Caxia d’Estalvis de Catalunya, a Barcelona-based savings bank with strong ties to the region, where it was the second largest savings bank in terms of market share.
Caixa Catalunya issues CH and CT.
Financial performance
We set out below some of the key financial performance metrics:
Table 560: Key profit & loss figures, €mm
FY 2008 FY 2009 FY 2010Net interest income 943 869 325Provisions for loan losses 771 33 3NII less provisions 172 836 322
Comm.& fee income 350 327 194Other operating income 12 1,344 277Non-interest expense 735 2,091 764Operating profit -131 563 56
PBT 205 75 12Taxes 20 -2 -6Net profit (loss) 194 79 18
Source: Bloomberg
Table 561: Key balance sheet figures, €mm
FY 2008 FY 2009 FY 2010Real Estate Loans 35,533 33,096 39,726Loans 50,011 44,381 51,689Total Assets 63,627 63,650 76,585Deposits 26,828 25,859 38,451Short-term borrowings 9,884 26,319 25,219Other short-term borrowings 772 1,437 1,790Long-term borrowings 19,806 2,302 3,782Equity 2,765 2,835 2,106
Source: Bloomberg
Table 562: Select financial metrics
FY 2008 FY 2009 FY 2010NIM n/a n/a 0.5ROA 0.3 0.1 0.0ROE 6.3 2.9 0.7ROC 0.5 0.2 0.1C:I 53.5 77.5 92.6Core Capital 6.3 6.1 7.4
Source: Bloomberg
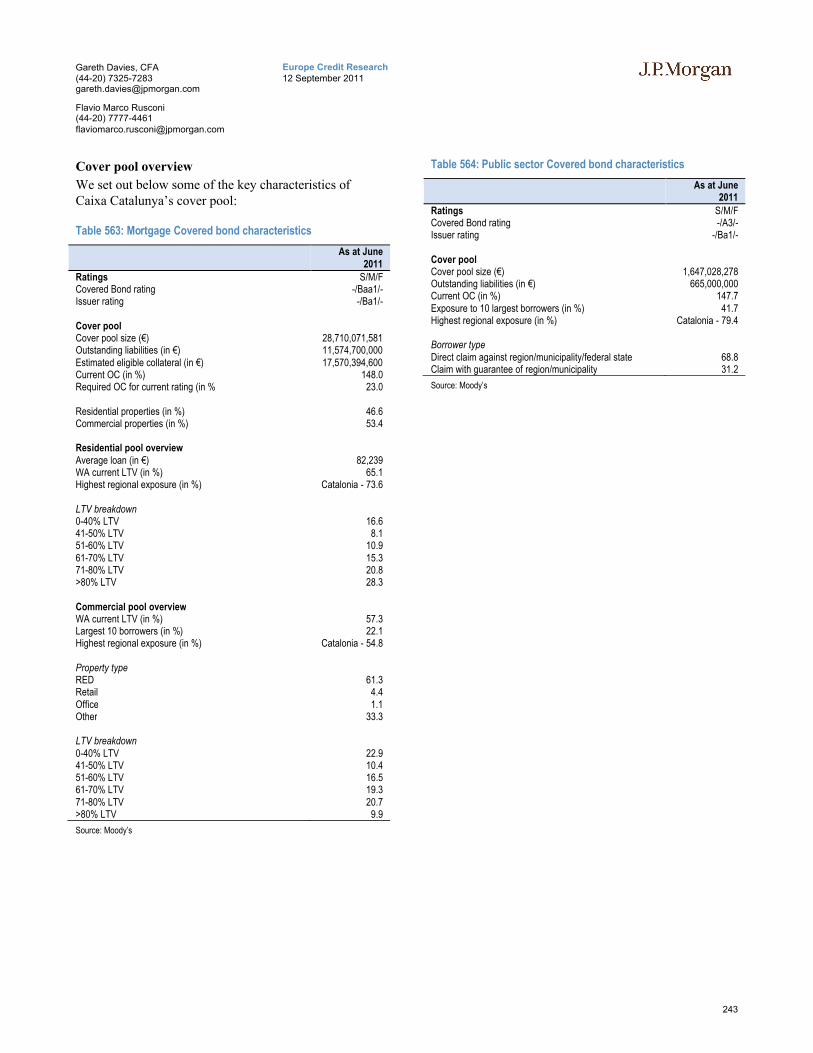
243
Europe Credit Research12 September 2011
Gareth Davies, CFA(44-20) [email protected]
Flavio Marco Rusconi(44-20) [email protected]
Cover pool overview
We set out below some of the key characteristics of Caixa Catalunya’s cover pool:
Table 563: Mortgage Covered bond characteristics
As at June 2011
Ratings S/M/FCovered Bond rating -/Baa1/-Issuer rating -/Ba1/-
Cover poolCover pool size (€) 28,710,071,581Outstanding liabilities (in €) 11,574,700,000Estimated eligible collateral (in €) 17,570,394,600Current OC (in %) 148.0Required OC for current rating (in % 23.0
Residential properties (in %) 46.6 Commercial properties (in %) 53.4
Residential pool overviewAverage loan (in €) 82,239 WA current LTV (in %) 65.1 Highest regional exposure (in %) Catalonia - 73.6
LTV breakdown0-40% LTV 16.6 41-50% LTV 8.1 51-60% LTV 10.9 61-70% LTV 15.3 71-80% LTV 20.8 >80% LTV 28.3
Commercial pool overviewWA current LTV (in %) 57.3 Largest 10 borrowers (in %) 22.1 Highest regional exposure (in %) Catalonia - 54.8
Property typeRED 61.3 Retail 4.4 Office 1.1 Other 33.3
LTV breakdown0-40% LTV 22.9 41-50% LTV 10.4 51-60% LTV 16.5 61-70% LTV 19.3 71-80% LTV 20.7 >80% LTV 9.9
Source: Moody’s
Table 564: Public sector Covered bond characteristics
As at June 2011
Ratings S/M/FCovered Bond rating -/A3/-Issuer rating -/Ba1/-
Cover poolCover pool size (€) 1,647,028,278 Outstanding liabilities (in €) 665,000,000 Current OC (in %) 147.7 Exposure to 10 largest borrowers (in %) 41.7 Highest regional exposure (in %) Catalonia - 79.4
Borrower type Direct claim against region/municipality/federal state 68.8 Claim with guarantee of region/municipality 31.2
Source: Moody’s
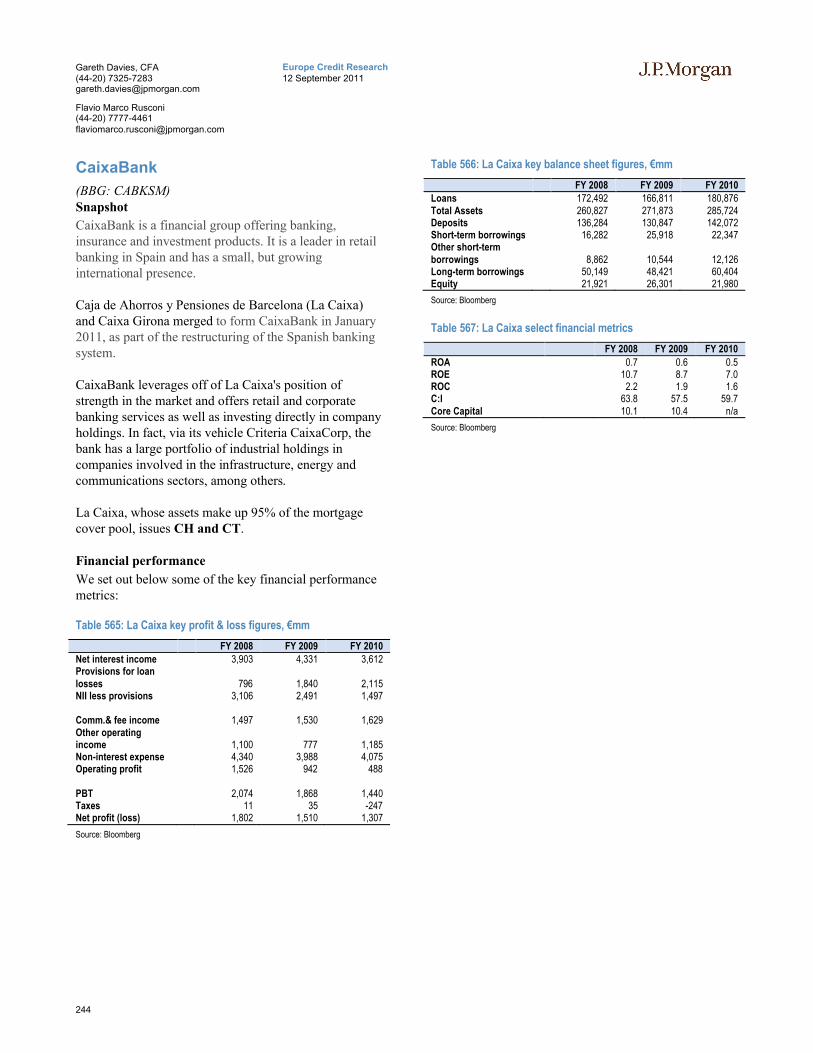
244
Europe Credit Research12 September 2011
Gareth Davies, CFA(44-20) [email protected]
Flavio Marco Rusconi(44-20) [email protected]
CaixaBank
(BBG: CABKSM)Snapshot
CaixaBank is a financial group offering banking, insurance and investment products. It is a leader in retail banking in Spain and has a small, but growing international presence.
Caja de Ahorros y Pensiones de Barcelona (La Caixa)and Caixa Girona merged to form CaixaBank in January 2011, as part of the restructuring of the Spanish banking system.
CaixaBank leverages off of La Caixa's position of strength in the market and offers retail and corporate banking services as well as investing directly in company holdings. In fact, via its vehicle Criteria CaixaCorp, the bank has a large portfolio of industrial holdings in companies involved in the infrastructure, energy and communications sectors, among others.
La Caixa, whose assets make up 95% of the mortgage cover pool, issues CH and CT.
Financial performance
We set out below some of the key financial performance metrics:
Table 565: La Caixa key profit & loss figures, €mm
FY 2008 FY 2009 FY 2010Net interest income 3,903 4,331 3,612Provisions for loan losses 796 1,840 2,115NII less provisions 3,106 2,491 1,497
Comm.& fee income 1,497 1,530 1,629Other operating income 1,100 777 1,185Non-interest expense 4,340 3,988 4,075Operating profit 1,526 942 488
PBT 2,074 1,868 1,440Taxes 11 35 -247Net profit (loss) 1,802 1,510 1,307
Source: Bloomberg
Table 566: La Caixa key balance sheet figures, €mm
FY 2008 FY 2009 FY 2010Loans 172,492 166,811 180,876 Total Assets 260,827 271,873 285,724 Deposits 136,284 130,847 142,072 Short-term borrowings 16,282 25,918 22,347 Other short-term borrowings 8,862 10,544 12,126 Long-term borrowings 50,149 48,421 60,404 Equity 21,921 26,301 21,980
Source: Bloomberg
Table 567: La Caixa select financial metrics
FY 2008 FY 2009 FY 2010
ROA 0.7 0.6 0.5 ROE 10.7 8.7 7.0 ROC 2.2 1.9 1.6 C:I 63.8 57.5 59.7 Core Capital 10.1 10.4 n/a
Source: Bloomberg
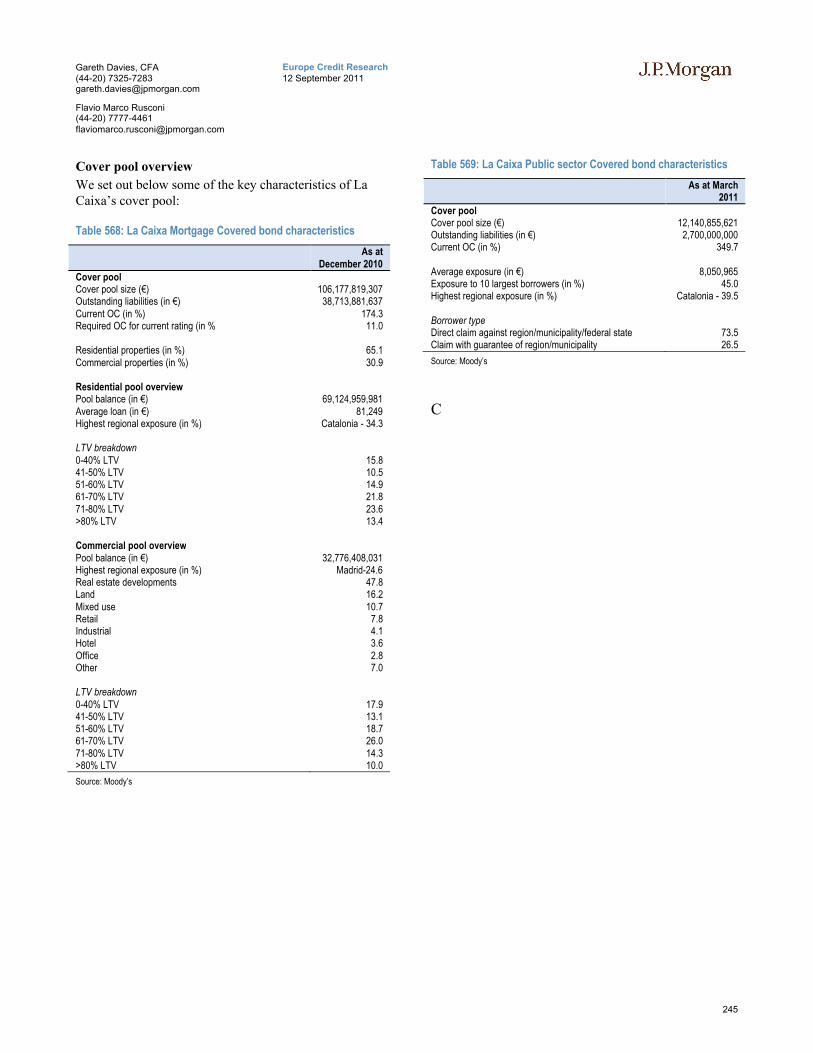
245
Europe Credit Research12 September 2011
Gareth Davies, CFA(44-20) [email protected]
Flavio Marco Rusconi(44-20) [email protected]
Cover pool overview
We set out below some of the key characteristics of La Caixa’s cover pool:
Table 568: La Caixa Mortgage Covered bond characteristics
As at December 2010
Cover poolCover pool size (€) 106,177,819,307Outstanding liabilities (in €) 38,713,881,637Current OC (in %) 174.3Required OC for current rating (in % 11.0
Residential properties (in %) 65.1Commercial properties (in %) 30.9
Residential pool overviewPool balance (in €) 69,124,959,981Average loan (in €) 81,249Highest regional exposure (in %) Catalonia - 34.3
LTV breakdown0-40% LTV 15.841-50% LTV 10.551-60% LTV 14.961-70% LTV 21.871-80% LTV 23.6>80% LTV 13.4
Commercial pool overviewPool balance (in €) 32,776,408,031Highest regional exposure (in %) Madrid-24.6Real estate developments 47.8Land 16.2Mixed use 10.7Retail 7.8Industrial 4.1Hotel 3.6Office 2.8Other 7.0
LTV breakdown0-40% LTV 17.941-50% LTV 13.151-60% LTV 18.761-70% LTV 26.071-80% LTV 14.3>80% LTV 10.0
Source: Moody’s
Table 569: La Caixa Public sector Covered bond characteristics
As at March 2011
Cover poolCover pool size (€) 12,140,855,621Outstanding liabilities (in €) 2,700,000,000Current OC (in %) 349.7
Average exposure (in €) 8,050,965Exposure to 10 largest borrowers (in %) 45.0Highest regional exposure (in %) Catalonia - 39.5
Borrower type Direct claim against region/municipality/federal state 73.5Claim with guarantee of region/municipality 26.5
Source: Moody’s
C

246
Europe Credit Research12 September 2011
Gareth Davies, CFA(44-20) [email protected]
Flavio Marco Rusconi(44-20) [email protected]
Caja de Ahorros y Monte de Piedad de Guipúzcoa y San Sebastián (‘Kutxa’)
(BBG: KUTXA)Snapshot
Kutxa is one of three Basque savings banks. As of January 2012, it will join forces with the other two (BBK and Caja Vital Kutxa) to form Kutxa Bank. See BBK and Caja Vital Kutxa profiles for further details. According to Fitch, at this point it will rank as the 14th largest caja in Spain once the integration process is complete. While based in its home province of Gipuzkoa, 209 of Kutxa’s 347 branches at end H1 2010 were situated outside Gipuzkoa and mostly opened in the 2003-2007 expansion plan. Its activities are predominantly retail in nature, with the bank focused on deposit-taking and retail lending.
Kutxa is mainly funded by a large deposit base which accounted for 75% of lending at end H1 2010. Wholesale funding is mainly through mortgage-covered bonds.
Financial performance
We set out below some of the key financial performance metrics:
Table 570: Key profit & loss figures, €mm
FY 2008 FY 2009 FY 2010Net interest income 311 327 279Provisions for loan losses -32 139 97NII less provisions 343 188 182
Comm.& fee income 124 117 122Other operating income 44 83 66Non-interest expense 368 396 362Operating profit 288 146 88
PBT 60 12 4Taxes -51 -38 -21Net profit (loss) 111 50 24
Source: Bloomberg
Table 571: Key balance sheet figures, €mm
FY 2008 FY 2009 FY 2010Loans 16,062 15,711 15,683Total Assets 21,266 21,095 20,851Deposits 17,058 15,532 15,470Short-term borrowings 558 1,032 1,276Equity 2,175 2,310 2,188
Source: Bloomberg
Cover pool overview
We set out below some of the key characteristics of the cover pool:
Table 572: Mortgage Covered bond characteristics
As at March 2011
Ratings S/M/FCovered Bond rating AAA/-/-Issuer rating A/-/A-
Cover poolCover pool size (€) 8,626,500,000Outstanding liabilities (in €) 2,500,000,000Eligible collateral (in €) 5,606,500,000Current OC (in %) 145.1
Residential properties (in %) 79.3Commercial properties (in %) 20.7
Residential pool overviewPool balance (in €) 6,843,600,000Average loan (in €) 97,495WA seasoning (mths) 47.8WA current LTV (in %) 58.2Highest regional exposure (in %) Basque Country
Commercial pool overviewPool balance (in €) 1,782,900,000Average loan (in €) 391,512WA seasoning (mths) 46.8WA current LTV (in %) 39.7Highest regional exposure (in %) Basque Country
Source: Moody’s

247
Europe Credit Research12 September 2011
Gareth Davies, CFA(44-20) [email protected]
Flavio Marco Rusconi(44-20) [email protected]
Caja Vital Kutxa
(BBG: VITAL)Snapshot
Caja Vital Kutxa (full name Caja de Ahorros de Vitoria y Álava Araba eta Gasteizko Aurrezki Kutxa) was formed in 1990 through the merger of the Caja Provincial de Ahorros de Álava and Caja de Ahorros y Monte de Piedad de Vitoria – Gasteizko Aurrezki Kutxa.
It offers retail banking products in its domestic Basque Country region. From January 2012, it will join forces with the other two Basque savings banks, BBK and Kutxa, to form Kutxa Bank (see BBK profile for details).
Financial performance
We set out below some of the key financial performance metrics:
Table 573: Key profit & loss figures, €mm
FY 2008 FY 2009 FY 2010Net interest income 144 130 92Provisions for loan losses 28 6 43NII less provisions 117 123 49
Comm.& fee income 42 42 43Other operating income 16 24 23Non-interest expense 115 105 122Operating profit 91 112 -2
PBT 88 76 36Taxes 12 7 -2Net profit (loss) 75 68 38
Source: Bloomberg
Table 574: Key balance sheet figures, €mm
FY 2008 FY 2009 FY 2010Loans 6,505 6,556 6,529Total Assets 8,726 9,252 8,644Deposits 5,764 6,040 6,421Short-term borrowings 379 415 246Other short-term borrowings 39 34 33Long-term borrowings 918 1,129 1,004Equity 802 854 844
Source: Bloomberg
Table 575: Select financial metrics
FY 2008 FY 2009 FY 2010NIM 2 2 1ROA 1 1 0ROE 10 8 5ROC 3 2 2C:I 49 46 75
Source: Bloomberg
Cover pool overview
We set out below some of the key characteristics of the cover pool:
Table 576: Mortgage Covered bond characteristics
As at March 2011
Ratings S/M/FCovered Bond rating -/Aaa/-Issuer rating -/A3/A-
Cover poolCover pool size (€) 4,887,501,555Outstanding liabilities (in €) 1,372,000,000Estimated eligible collateral (in €) 2,354,352,000Current OC (in %) 256.2Required OC for current rating (in %) 47.5
Residential properties (in %) 64.2Commercial properties (in %) 35.8
Residential pool overviewPool balance (in €) 3,138,935,098 Average loan (in €) 97,229 WA seasoning (mths) 54 WA current LTV (in %) 62.2 Highest regional exposure (in %) Basque Country
- 61.5 Second homes (in %) 5.5
LTV breakdown0-40% LTV 18.2 41-50% LTV 10.8 51-60% LTV 13.7 61-70% LTV 16.3 71-80% LTV 21.5 >80% LTV 19.5
Commercial pool overviewPool balance (in €) 1,748,566,457 Average loan (in €) 459,303 WA seasoning (mths) 45 WA current LTV (in %) 64.7 Highest regional exposure (in %) Basque Country
- 56.1
Property typeLand 45.8 RED 15.9 Industrial 13.6 Retail 10.2 Other 14.5
LTV breakdown0-40% LTV 15.0 41-50% LTV 9.6 51-60% LTV 12.0 61-70% LTV 16.5 71-80% LTV 26.0 >80% LTV 20.9
Source: Moody’s

248
Europe Credit Research12 September 2011
Gareth Davies, CFA(44-20) [email protected]
Flavio Marco Rusconi(44-20) [email protected]
Cajamar Caja Rural
(BBG: CAJAMA)Snapshot
Cajamar is the result of the fusion of the Rural Savings banks of Almería and Málaga, Caja Rural del Duero and the incorporation of the co-operatives Campo de Cartagena and Grumeco. Finally, in 2010, Caja Rural de Baleares merged with Cajamar.
It is the largest bank in the Grupo Cooperativo Cajamar, which provides banking services across Spain. It is the 19th largest bank in Spain, reaching over 2.5mm customers via a thousand branches in 14 autonomous regions.
Cajamar issues cédulas hipotecarias.
Financial performance
We set out below some of the key financial performance metrics:
Table 577: Key profit & loss figures, €mm
FY 2008 FY 2009 FY 2010Net interest income 498 546 428Provisions for loan losses 12 200 n/aNII less provisions 486 345 428
Comm.& fee income 110 100 109Other operating income 15 36 51Non-interest expense 358 389 417Operating profit 290 125 221
PBT 134 70 32Taxes 8 5 0Net profit (loss) 127 66 36
Source: Bloomberg
Table 578: Key balance sheet figures, €mm
FY 2008 FY 2009 FY 2010Real Estate Loans 17,711 19,073 19,609 Loans 23,319 24,188 24,982 Total Assets 25,154 27,679 29,809 Deposits 18,052 20,314 21,541 Short-term borrowings 3,150 1,649 1,625 Other short-term borrowings 18 6 31 Long-term borrowings 1,579 3,029 3,661 Equity 1,826 2,212 2,324
Source: Bloomberg
Table 579: Select financial metrics
FY 2008 FY 2009 FY 2010NIM 2.2 1.6ROA 0.2 0.1ROE 3.3 1.6ROC 1.0 0.4C:I 53.6 64.7
Source: Bloomberg

249
Europe Credit Research12 September 2011
Gareth Davies, CFA(44-20) [email protected]
Flavio Marco Rusconi(44-20) [email protected]
Cover pool overview
We set out below some of the key cover pool characteristics:
Table 580: Covered bond characteristics
As at June 2011
Ratings S/M/FCovered Bond rating -/A1/-Issuer rating -/Baa3/A
Cover poolCover pool size (€) 13,523,108,689Outstanding liabilities (in €) 3,682,800,000Estimated eligible collateral (in €) 8,006,407,200Current OC (in %) 267.2 Required OC for current rating (in %) 28.0
Residential properties (in %) 55.1 Commercial properties (in %) 44.9
Residential pool overviewPool balance (in €) 7,454,013,799 Average loan (in €) 90,625 WA seasoning (mths) 40 WA current LTV (in %) 60.7 Highest regional exposure (in %) Andalusia - 43.7 Second homes (in %) 12.1
LTV breakdown0-40% LTV 18.3 41-50% LTV 11.0 51-60% LTV 14.4 61-70% LTV 19.2 71-80% LTV 27.0 >80% LTV 10.1
Commercial pool overviewPool balance (in €) 6,069,094,890 Average loan (in €) 284,707 WA seasoning (mths) 41 WA current LTV (in %) 56.3 Highest regional exposure (in %) Andalusia - 57.5
Property typeReal Estate Developers 41.6 Land 24.6 Retail 19.2 Other 14.5
LTV breakdown0-40% LTV 33.5 41-50% LTV 13.4 51-60% LTV 15.5 61-70% LTV 14.7 71-80% LTV 8.4 >80% LTV 14.5
Source: Moody’s
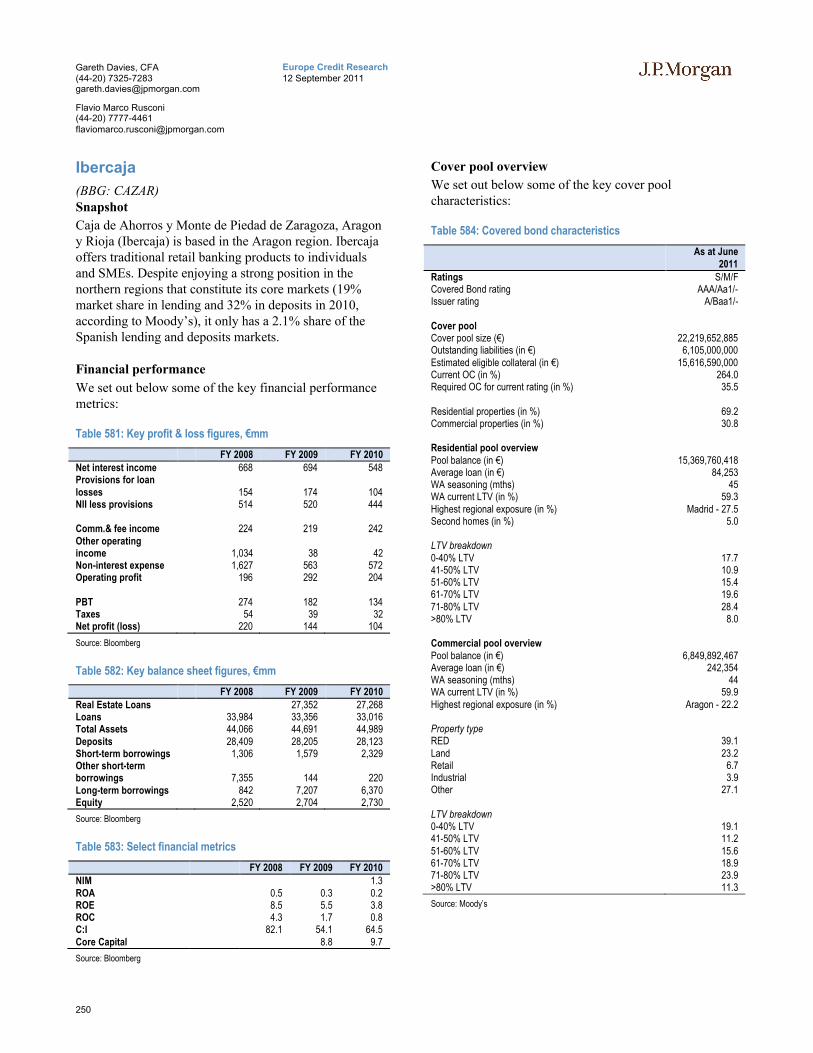
250
Europe Credit Research12 September 2011
Gareth Davies, CFA(44-20) [email protected]
Flavio Marco Rusconi(44-20) [email protected]
Ibercaja
(BBG: CAZAR)Snapshot
Caja de Ahorros y Monte de Piedad de Zaragoza, Aragon y Rioja (Ibercaja) is based in the Aragon region. Ibercaja offers traditional retail banking products to individuals and SMEs. Despite enjoying a strong position in the northern regions that constitute its core markets (19% market share in lending and 32% in deposits in 2010, according to Moody’s), it only has a 2.1% share of the Spanish lending and deposits markets.
Financial performance
We set out below some of the key financial performance metrics:
Table 581: Key profit & loss figures, €mm
FY 2008 FY 2009 FY 2010Net interest income 668 694 548Provisions for loan losses 154 174 104NII less provisions 514 520 444
Comm.& fee income 224 219 242Other operating income 1,034 38 42Non-interest expense 1,627 563 572Operating profit 196 292 204
PBT 274 182 134Taxes 54 39 32Net profit (loss) 220 144 104
Source: Bloomberg
Table 582: Key balance sheet figures, €mm
FY 2008 FY 2009 FY 2010Real Estate Loans 27,352 27,268 Loans 33,984 33,356 33,016 Total Assets 44,066 44,691 44,989 Deposits 28,409 28,205 28,123 Short-term borrowings 1,306 1,579 2,329 Other short-term borrowings 7,355 144 220 Long-term borrowings 842 7,207 6,370 Equity 2,520 2,704 2,730
Source: Bloomberg
Table 583: Select financial metrics
FY 2008 FY 2009 FY 2010NIM 1.3 ROA 0.5 0.3 0.2 ROE 8.5 5.5 3.8 ROC 4.3 1.7 0.8 C:I 82.1 54.1 64.5 Core Capital 8.8 9.7
Source: Bloomberg
Cover pool overview
We set out below some of the key cover pool characteristics:
Table 584: Covered bond characteristics
As at June 2011
Ratings S/M/FCovered Bond rating AAA/Aa1/-Issuer rating A/Baa1/-
Cover poolCover pool size (€) 22,219,652,885Outstanding liabilities (in €) 6,105,000,000Estimated eligible collateral (in €) 15,616,590,000Current OC (in %) 264.0 Required OC for current rating (in %) 35.5
Residential properties (in %) 69.2 Commercial properties (in %) 30.8
Residential pool overviewPool balance (in €) 15,369,760,418 Average loan (in €) 84,253 WA seasoning (mths) 45 WA current LTV (in %) 59.3 Highest regional exposure (in %) Madrid - 27.5 Second homes (in %) 5.0
LTV breakdown0-40% LTV 17.7 41-50% LTV 10.9 51-60% LTV 15.4 61-70% LTV 19.6 71-80% LTV 28.4 >80% LTV 8.0
Commercial pool overviewPool balance (in €) 6,849,892,467 Average loan (in €) 242,354 WA seasoning (mths) 44 WA current LTV (in %) 59.9 Highest regional exposure (in %) Aragon - 22.2
Property typeRED 39.1 Land 23.2 Retail 6.7 Industrial 3.9 Other 27.1
LTV breakdown0-40% LTV 19.1 41-50% LTV 11.2 51-60% LTV 15.6 61-70% LTV 18.9 71-80% LTV 23.9 >80% LTV 11.3
Source: Moody’s

251
Europe Credit Research12 September 2011
Gareth Davies, CFA(44-20) [email protected]
Flavio Marco Rusconi(44-20) [email protected]
Santander Consumer Finance
(BBG: SANTAN)Snapshot
Santander Consumer Finance is a leading consumer finance company present in 17 countries: Austria, Belgium, the Czech Republic, Denmark, Finland, Germany, Italy, Netherlands, Norway, Poland, Portugal, Russia, the Slovak Republic, Spain, Sweden, UK and USA.
The company is part of the Santander Group, one of the largest financial groups in the world (see separate profile), and offers its products mainly though point of sales but also branches, internet and telemarketing platforms.
Santander Consumer Finance issues cédulas hipotecarias.
Financial performance
We set out below some of the key financial performance metrics:
Table 585: Key profit & loss figures, €mm
FY 2008 FY 2009 FY 2010Net interest income 214 106Provisions for loan losses -1 7NII less provisions 215 99
Comm.& fee income 43 39.528Other operating income 5 0Non-interest expense 52 34Operating profit 397 417
PBT 484 434Taxes 10 20Net profit (loss) 466 455
Source: Bloomberg
Table 586: Key balance sheet figures, €mm
FY 2008 FY 2009 FY 2010Loans 21,625 21,922 Total Assets 26,205 26,769 Equity 6,377 7,380
Source: Bloomberg
Cover pool overview
We set out below some of the key cover pool characteristics:
Table 587: Covered bond characteristics
As at June 2010
Ratings S/M/FCovered Bond rating -/Aa1/-Issuer rating (Santander Group) AA/Aa2/AA
Cover poolCover pool size (€) 2,641,048,731Outstanding liabilities (in €) 1,350,000,000Current OC (in %) 95.6 Required OC for current rating (in %) 26.0
Residential properties (in %) 97.4 Commercial properties (in %) 2.6
Residential pool overviewPool balance (in €) 2,572,289,079 Average loan (in €) 78,414 WA seasoning (mths) 56 WA current LTV (in %) 66.3 Highest regional exposure (in %) Andalusia - 35.6 Second homes (in %) 0.4
LTV breakdown0-40% LTV 13.8 41-50% LTV 8.9 51-60% LTV 10.5 61-70% LTV 16.7 71-80% LTV 22.8 >80% LTV 27.3
Source: Moody’s

252
Europe Credit Research12 September 2011
Gareth Davies, CFA(44-20) [email protected]
Flavio Marco Rusconi(44-20) [email protected]
Unicaja
(BBG: UNICAJ)Snapshot
Montes de Piedad y Caja de Ahorros de Ronda, Cádiz, Almería, Málaga y Antequera (Unicaja) is a Malaga-based savings bank with a strong regional presence in Andalusia. In 2010, as part of the Spanish saving banks system restructuring, Caja Provincial de Ahorros de Jaen became the latest addition to the group.
Unicaja has a network of 935 branches in around eighteen Spanish provinces and international offices in Brussels, London and Frankfurt. Furthermore, Unicaja's international presence is widened through CECA’s network of representative offices and 2,000 foreign corresponding banks.
Financial performance
We set out below some of the key financial performance metrics:
Table 588: Key profit & loss figures, €mm
FY 2008 FY 2009 FY 2010Net interest income 714 801 698Prov. for loan losses 260 342 206NII less provisions 455 459 492
Comm.& fee income 160 150 146Other operating inc. 61 50 54Non-interest expense 507 504 539Operating profit 324 311 274PBT 338 231 156Taxes 52 26 5Net profit (loss) 286 205 151
Source: Bloomberg
Table 589: Key balance sheet figures, €mm
FY 2008 FY 2009 FY 2010Loans 24,396 23,955 25Total Assets 32,156 34,185 34Deposits 24,422 21,969 25Short-term borrowings 1,022 1,591 2Other short-term borrowings 44 81 0Long-term borrowings 3,360 5,033 4Equity 2,724 2,908 3
Source: Bloomberg
Table 590: Select financial metrics
FY 2008 FY 2009 FY 2010ROA 1 1 1ROE 10 7 10ROC 4 2 3C:I 45 42 52
Source: Bloomberg
Cover pool overview
We set out below some of the key cover pool characteristics:
Table 591: Covered bond characteristics
As at June 2011
Ratings S/M/FCovered Bond rating -/Aaa/-Issuer rating -/A1/A
Cover poolCover pool size (€) 17,077,087,276Outstanding liabilities (in €) 9,499,100,000Estimated eligible collateral (in €) 13,007,117,630Current OC (in %) 79.8Required OC for current rating (in %) 32.5
Residential properties (in %) 70.2Commercial properties (in %) 29.8
Residential pool overviewPool balance (in €) 11,984,660,862Average loan (in €) 73,158WA seasoning (mths) 59WA current LTV (in %) 59.6Highest regional exposure (in %) Andalusia - 93.3Second homes (in %) 4.2
LTV breakdown0-40% LTV 18.641-50% LTV 12.251-60% LTV 15.561-70% LTV 20.671-80% LTV 26.2>80% LTV 6.9
Commercial pool overviewPool balance (in €) 5,092,426,414Average loan (in €) 203,779WA seasoning (mths) 54WA current LTV (in %) 60.7Highest regional exposure (in %) Andalusia - 90.0
Property typeRED 36.5 Land 18.5 Retail 11.0 Industrial 5.9 Office 2.1 Other 26.0
LTV breakdown0-40% LTV 28.1 41-50% LTV 16.6 51-60% LTV 15.6 61-70% LTV 14.5 71-80% LTV 9.5 >80% LTV 15.7
Source: Moody’s

253
Europe Credit Research12 September 2011
Gareth Davies, CFA(44-20) [email protected]
Flavio Marco Rusconi(44-20) [email protected]
Multi-Cedulas
Multi-cedulas take a portfolio of mortgage or public-sector backed Spanish covered bonds (CH or CT) issued by a small group of Spanish financial institutions (predominantly savings banks), and uses broadly similar structural features as in an RMBS deal (over-collateralisation, liquidity facilities and rating agency approaches) to package these individual bonds into a combined, multi-cedula issue.
Each outstanding series of multi-cedula is backed by a different pool of underlying CH, with each CH being a full-recourse obligation of the individual issuer. The underlying CH, as if directly holding a single-issue cedula, are backed by the issuing bank’s entire mortgage pool. In the ABS world, there are also multi-seller Spanish RMBS backed by partial collateral pools contributed by a similarly small number of institutions. In fact there is a high degree of overlap between multi-cedula issuers and multi-seller RMBS participants.
Despite their ostensible similarities, there are, however, some differences between multi-cedulas and RMBS. In a multi-cedula transaction, investors are backed by a portfolio of CH that remains static throughout the life of the transaction, (although the underlying collateral backing these CH bonds changes over time).
Where the two secured funding forms diverge however is in the revolving nature of the underlying pools. Under a multi-cedula, the ‘static’ CH in the transaction are each backed by a ‘dynamic’ pool of mortgage collateral on each individual issuer's balance sheet. In a multi-seller RMBS, the initial contributed collateral pools from each institution are static.
Furthermore, multi-cedulas are of a bullet nature and, being a covered bond, are full-recourse obligations of the issuer, collateralised by a pool of mortgages or loans. Asin other securitisations, Spanish RMBS are not an obligation of the originator, but rather of the issuing vehicle (typically an SPV). Should the collateral pool prove insufficient to redeem outstanding bonds, then junior bondholders (in reverse order up the capital stack) will incur principal losses. Should underlying mortgages in the covered bond collateral pool default, however, the obligation remains on the issuing institution to repay the bond in full, with credit risk on the collateral pool only passing to investors on default of the issuing institution.
A chain is however only as strong as its weakest link, and this is also true of any multi-cedula. Ratings (and by derivation, bond pricing) therefore consider the weakest/lowest rated contributing caja. Poor performance of the issuing entity, or in the collateral pools backing the individual bonds, therefore naturally affects the ratings of the multi-cedulas. In the ABS space, only the performance of the pool affects ratings (ignoring any potential effects if the issuer was also a counterparty to the transaction).
Programmes
There are 7 multi-cedulas programmes, although one (IM Cedulas GBP) is entirely made up of collateral from Grupo Banco Popular companies.
Of the remaining six programmes, only one is a public sector multi-cedula (AyT Cedulas Territoriales), while the remaining five are backed by mortgage collateral.
Overall, outstanding bonds (for which we could find a collateral split by lender) total €132bn, of which only €1.6bn are multi-cedulas-territoriales (in addition, the GBP platform account for another €6.4bn). The largest programme is AyT Cedulas Cajas Global with an outstanding amount of €46.5bn, followed by AyT Cedulas Cajas (€28.5bn) and Cedulas TDA (€26.4bn).

254
Europe Credit Research12 September 2011
Gareth Davies, CFA(44-20) [email protected]
Flavio Marco Rusconi(44-20) [email protected]
Table 592: Multi-cedula contributors by post-merger institution (Banca Civica to Caja Espana-Duero), % of collateral
% €mm
Ban
ca C
ivic
a
Ban
ca M
arch
Ban
co d
e V
alen
cia
Ban
co G
alle
go
Ban
co P
asto
r
Ban
co P
opu
lar
Esp
ano
l
Ban
kia
Ban
kin
ter
Ban
kpim
e
BA
SE
BB
K B
ank
Caj
aSu
r
BE
S (
Po
rtu
gal
)
Cai
xa O
nti
nye
nt
Cai
xa P
olle
nca
Caj
a E
spañ
a-D
uer
o
To
tal O
/S
AyT Cedulas Cajas III 10.3 4.1 15.9 4.6 4.0 3,500AyT Cedulas Cajas IV 19.3 9.2 9.5 9.2 3,800AyT Cedulas Cajas V 19.5 5.2 12.9 4.8 1.3 3.2 3,100AyT Cedulas Cajas VI 26.4 19.4 9.1 12.1 0.9 3,300AyT Cedulas Cajas VII 8.6 7.1 32.9 11.4 1,750AyT Cedulas Cajas VIII 1.8 13.0 14.6 14.6 0.2 4.8 4,100AyT Cedulas Cajas IX 13.7 8.7 16.0 4.0 0.5 8.0 5,000AyT Cedulas Cajas X 6.4 9.9 12.8 7.7 10.3 3,900
CEDULAS TDA 2 3.0 9.3 7.5 10.0 2,000CEDULAS TDA 3 7.5 3.0 15.3 15.0 2,000CEDULAS TDA 5 6.0 7.0 28.3 1,500CEDULAS TDA 6 2.3 22.8 20.0 3,000CEDULAS TDA 7 1.5 17.3 8.8 5.0 2,000CEDULAS TDA 13 2.3 23.4 29.4 4.7 1.9 23.4 2,140CEDULAS TDA 15 9.7 1.5 2.7 1.2 0.5 4.8 2,070CEDULAS TDA 17 15.4 15.4 1,950CEDULAS TDA 18 16.9 2.8 16.9 28.2 4.0 1,770CEDULAS TDA 19 33.3 33.3 33.3 4,500CEDULAS TDA 21 21.7 29.0 3,450
IM Cedulas 2 16.9 27.1 10.2 1,475IM Cedulas 3 4.7 9.4 7.5 1,060IM Cedulas 4 8.4 24.1 9.6 24.1 7.2 2,075IM Cedulas 5 20.0 8.0 12.0 1,250IM Cedulas M1 6.3 6.0 6.0 1,655IM Cedulas 7 22.0 20.0 1,250IM Cedulas 9 19.6 7.8 3.9 5.9 1,275IM Cedulas 10 11.5 19.2 7.7 1,300IM Cedulas 14 41.7 1,200
Ayt Cedulas Territoriales Cajas 2 7.5 25.6 7.5 665Ayt Cedulas Territoriales Cajas 4 32.6 2.1 10.4 25.9 965
IM CEDULAS 1 BANCO POPULAR 100.0 2,000CEDULAS GBP 3 100.0 2,000CEDULAS GBP 5 100.0 2,350
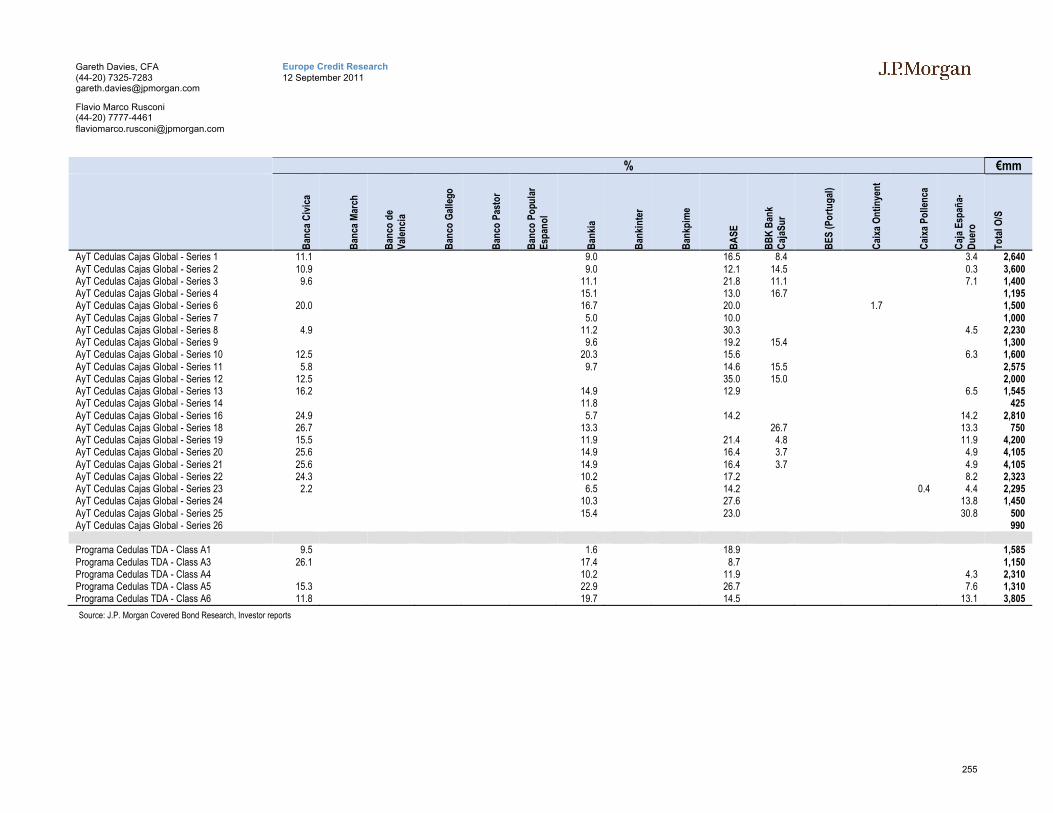
255
Europe Credit Research12 September 2011
Gareth Davies, CFA(44-20) [email protected]
Flavio Marco Rusconi(44-20) [email protected]
% €mm
Ban
ca C
ivic
a
Ban
ca M
arch
Ban
co d
e V
alen
cia
Ban
co G
alle
go
Ban
co P
asto
r
Ban
co P
opu
lar
Esp
ano
l
Ban
kia
Ban
kin
ter
Ban
kpim
e
BA
SE
BB
K B
ank
Caj
aSu
r
BE
S (
Po
rtu
gal
)
Cai
xa O
nti
nye
nt
Cai
xa P
olle
nca
Caj
a E
spañ
a-D
uer
o
To
tal O
/S
AyT Cedulas Cajas Global - Series 1 11.1 9.0 16.5 8.4 3.4 2,640AyT Cedulas Cajas Global - Series 2 10.9 9.0 12.1 14.5 0.3 3,600AyT Cedulas Cajas Global - Series 3 9.6 11.1 21.8 11.1 7.1 1,400AyT Cedulas Cajas Global - Series 4 15.1 13.0 16.7 1,195AyT Cedulas Cajas Global - Series 6 20.0 16.7 20.0 1.7 1,500AyT Cedulas Cajas Global - Series 7 5.0 10.0 1,000AyT Cedulas Cajas Global - Series 8 4.9 11.2 30.3 4.5 2,230AyT Cedulas Cajas Global - Series 9 9.6 19.2 15.4 1,300AyT Cedulas Cajas Global - Series 10 12.5 20.3 15.6 6.3 1,600AyT Cedulas Cajas Global - Series 11 5.8 9.7 14.6 15.5 2,575AyT Cedulas Cajas Global - Series 12 12.5 35.0 15.0 2,000AyT Cedulas Cajas Global - Series 13 16.2 14.9 12.9 6.5 1,545AyT Cedulas Cajas Global - Series 14 11.8 425AyT Cedulas Cajas Global - Series 16 24.9 5.7 14.2 14.2 2,810AyT Cedulas Cajas Global - Series 18 26.7 13.3 26.7 13.3 750AyT Cedulas Cajas Global - Series 19 15.5 11.9 21.4 4.8 11.9 4,200AyT Cedulas Cajas Global - Series 20 25.6 14.9 16.4 3.7 4.9 4,105AyT Cedulas Cajas Global - Series 21 25.6 14.9 16.4 3.7 4.9 4,105AyT Cedulas Cajas Global - Series 22 24.3 10.2 17.2 8.2 2,323AyT Cedulas Cajas Global - Series 23 2.2 6.5 14.2 0.4 4.4 2,295AyT Cedulas Cajas Global - Series 24 10.3 27.6 13.8 1,450AyT Cedulas Cajas Global - Series 25 15.4 23.0 30.8 500AyT Cedulas Cajas Global - Series 26 990
Programa Cedulas TDA - Class A1 9.5 1.6 18.9 1,585Programa Cedulas TDA - Class A3 26.1 17.4 8.7 1,150Programa Cedulas TDA - Class A4 10.2 11.9 4.3 2,310Programa Cedulas TDA - Class A5 15.3 22.9 26.7 7.6 1,310Programa Cedulas TDA - Class A6 11.8 19.7 14.5 13.1 3,805
Source: J.P. Morgan Covered Bond Research, Investor reports

256
Europe Credit Research12 September 2011
Gareth Davies, CFA(44-20) [email protected]
Flavio Marco Rusconi(44-20) [email protected]
Table 593: Multi-cedula contributors by post-merger institution (Caja Laboral to UNNIM), % of collateral
% €mm
Caj
a L
abor
al
Caj
a T
res
Caj
a V
ital
Caj
amar
CA
M
Cat
alu
nya
Cai
xa
Iber
caja
Ipar
Ku
txa
Ku
txa
La
Cai
xa
Mar
eNo
stru
m
No
vaC
aixa
Gal
icia
Sab
adel
l Gro
up
Un
icaj
a
UN
NIM
To
tal O
/S
AyT Cedulas Cajas III 5.3 4.3 8.6 8.6 16.0 4.4 14.0 3,500AyT Cedulas Cajas IV 1.6 1.6 7.9 1.3 9.2 17.6 6.6 7.0 3,800AyT Cedulas Cajas V 3.2 7.3 4.8 2.4 6.5 16.0 0.8 12.1 3,100AyT Cedulas Cajas VI 3.0 3.0 7.6 3.0 9.1 6.4 3,300AyT Cedulas Cajas VII 8.6 5.7 5.7 14.3 5.7 1,750AyT Cedulas Cajas VIII 2.2 12.2 7.3 3.0 14.4 2.4 5.6 3.7 4,100AyT Cedulas Cajas IX 4.0 8.0 2.0 13.1 8.0 4.0 10.0 5,000AyT Cedulas Cajas X 6.8 10.3 9.0 20.5 3.8 2.6 3,900
CEDULAS TDA 2 15.0 18.8 5.0 10.0 10.0 11.5 2,000CEDULAS TDA 3 15.0 3.8 3.8 15.0 3.0 12.5 6.3 2,000CEDULAS TDA 5 6.7 4.7 20.0 14.0 13.3 1,500CEDULAS TDA 6 4.0 16.7 8.3 6.7 13.3 5.8 3,000CEDULAS TDA 7 20.0 5.0 30.0 7.5 5.0 2,000CEDULAS TDA 13 14.0 0.9 2,140CEDULAS TDA 15 12.1 19.3 24.2 12.1 2.4 9.7 2,070CEDULAS TDA 17 25.6 25.6 2.6 15.4 1,950CEDULAS TDA 18 25.4 5.6 1,770CEDULAS TDA 19 4,500CEDULAS TDA 21 14.5 17.4 2.9 14.5 3,450
IM Cedulas 2 33.9 11.9 1,475IM Cedulas 3 18.9 47.2 12.3 1,060IM Cedulas 4 9.6 4.8 4.8 7.2 2,075IM Cedulas 5 40.0 4.0 8.0 8.0 1,250IM Cedulas M1 30.2 30.2 21.1 1,655IM Cedulas 7 42.0 8.0 8.0 1,250IM Cedulas 9 23.5 39.2 1,275IM Cedulas 10 15.4 7.7 23.1 15.4 1,300IM Cedulas 14 33.3 25.0 1,200
Ayt Cedulas Territoriales Cajas 2 22.6 14.3 22.6 665Ayt Cedulas Territoriales Cajas 4 10.4 4.1 5.2 9.3 965
IM CEDULAS 1 BANCO POPULAR 2,000CEDULAS GBP 3 2,000CEDULAS GBP 5 2,350

257
Europe Credit Research12 September 2011
Gareth Davies, CFA(44-20) [email protected]
Flavio Marco Rusconi(44-20) [email protected]
% €mm
Caj
a L
abor
al
Caj
a T
res
Caj
a V
ital
Caj
amar
CA
M
Cat
alu
nya
Cai
xa
Iber
caja
Ipar
Ku
txa
Ku
txa
La
Cai
xa
Mar
eNo
stru
m
No
vaC
aixa
Gal
icia
Sab
adel
l Gro
up
Un
icaj
a
UN
NIM
To
tal O
/S
AyT Cedulas Cajas Global - Series 1 1.1 0.8 7.4 3.6 10.8 16.5 2.8 8.7 2,640AyT Cedulas Cajas Global - Series 2 2.2 0.3 4.2 7.9 1.3 17.2 7.9 3.2 9.1 3,600AyT Cedulas Cajas Global - Series 3 1.4 6.8 1.3 2.3 9.3 9.3 3.7 5.2 1,400AyT Cedulas Cajas Global - Series 4 4.2 6.3 8.4 8.4 19.7 8.4 1,195AyT Cedulas Cajas Global - Series 6 5.0 10.0 20.0 6.7 1,500AyT Cedulas Cajas Global - Series 7 5.0 10.0 15.0 5.0 20.0 20.0 10.0 1,000AyT Cedulas Cajas Global - Series 8 7.6 6.7 4.5 9.0 11.2 4.5 5.6 2,230AyT Cedulas Cajas Global - Series 9 3.8 15.4 7.7 23.1 5.8 1,300AyT Cedulas Cajas Global - Series 10 4.7 9.4 6.3 6.3 12.5 6.3 1,600AyT Cedulas Cajas Global - Series 11 1.9 19.4 7.8 11.7 11.7 1.9 2,575AyT Cedulas Cajas Global - Series 12 7.5 15.0 2.5 10.0 2.5 2,000AyT Cedulas Cajas Global - Series 13 10.7 12.9 12.9 6.5 6.5 1,545AyT Cedulas Cajas Global - Series 14 5.9 11.8 47.1 23.5 425AyT Cedulas Cajas Global - Series 16 4.3 27.8 8.9 2,810AyT Cedulas Cajas Global - Series 18 6.7 13.3 750AyT Cedulas Cajas Global - Series 19 6.0 17.9 10.7 4,200AyT Cedulas Cajas Global - Series 20 3.0 1.2 4.9 16.4 3.7 5.4 4,105AyT Cedulas Cajas Global - Series 21 3.0 1.2 4.9 16.4 3.7 5.4 4,105AyT Cedulas Cajas Global - Series 22 3.0 4.8 6.5 2.2 15.1 6.5 2.2 2,323AyT Cedulas Cajas Global - Series 23 9.2 6.5 13.1 17.4 8.7 8.7 8.7 2,295AyT Cedulas Cajas Global - Series 24 6.9 10.3 31.0 1,450AyT Cedulas Cajas Global - Series 25 30.8 500AyT Cedulas Cajas Global - Series 26 9.1 15.2 25.3 40.4 10.1 990
Programa Cedulas TDA - Class A1 18.9 12.6 12.6 15.8 10.1 1,585Programa Cedulas TDA - Class A3 8.7 26.1 13.0 1,150Programa Cedulas TDA - Class A4 13.0 4.3 23.4 19.9 13.0 2,310Programa Cedulas TDA - Class A5 7.6 19.8 1,310Programa Cedulas TDA - Class A6 3.9 3.3 5.3 15.2 13.1 3,805
Source: J.P. Morgan Covered Bond Research, Investor reports

258
Europe Credit Research12 September 2011
Gareth Davies, CFA(44-20) [email protected]
Flavio Marco Rusconi(44-20) [email protected]

259
Europe Credit Research12 September 2011
Gareth Davies, CFA(44-20) [email protected]
Flavio Marco Rusconi(44-20) [email protected]
Sw
ed
ish
Co
ve
red
Bo
nd
s

260
Europe Credit Research12 September 2011
Gareth Davies, CFA(44-20) [email protected]
Flavio Marco Rusconi(44-20) [email protected]
Swedish Covered Bonds
Legislative snapshot
We set out in Table 594 a snapshot of key covered bond attributes in Sweden.
Table 594: Swedish Covered Bond legislative overview
Attribute CommentaryFrameworkLegislative Framework Covered Bond (Issuance) Act, 2004, as amended in 2010Types of covered bonds OneStructure of Issuer Direct issuance? Yes. On balance sheet issuance by a universal credit institution with a special license granted by the
Swedish FSA Comments (if any) 2010 amendment gave the bankruptcy administrator an express mandate to take out liquidity loans and enter
into other agreements for the purpose of maintaining matching between the cover pool, covered bonds and derivative contracts following issuer insolvency. The administrator now has an extensive mandate to enter into agreements, not only to achieve a liquidity balance but also to achieve a balance in respect of currencies, interest rates and interest periods
Bankruptcy remoteness In the event of bankruptcy, holders of covered bonds and certain eligible counterparties to derivative contracts related to the covered bonds benefit from a priority claim over the cover pool. Holders continue to receive timely payments following the institution's bankruptcy as long as compliance with the Covered Bond Act broadly and specifically the asset-liability matching requirements are maintained. If the Cover Pool fails to meet the requirements of the Act, the holders of CB would instead benefit from a priority claim over the proceeds of a sale of the assets in the cover pool. In this case, the CB investors retain the benefit of any shortfall claim against the institution which ranks pari passu with other senior, unsecured claims
Dual claim Yes. Should the cover pool be insufficient to satisfy CB bondholders, a claim pari passu to other unsecured bondholders within the insolvency estate exists
Bond format Typically, fixed rate, hard bulletSupervision Swedish FSA monitors that the issuing institution complies with the Covered Bond Act and associated
regulationsCover pool
Eligible assets Mortgage Eligible collateral from the EEA for mortgage assets. Commercial property exposures are limited to a maximum of 10% of assets.
LTV caps "Hard" (loans above the maximum can not be included in the cover pool). Maximum LTV for residential mortgages (75%), agricultural properties (70%), commercial properties (60% LTV and 10% of the collateral pool)
Public Sector EEA and OECD for public sector assetsNon-performing collateral NPLs greater than 60d must be removed from the cover pool calculationsSubstitution Assets Maximum 20% substitute assets (30% can be temporarily allowed). Can consist of cash, investments in
sovereign and sub-sovereign assetsHedging Used to minimise interest rate, currency, credit or other risksValuation Individual market values with regular revaluations of mortgage collateral required. Should LTVs rise above
the maximum thresholds set out above through falling property valuations, the portion of the mortgage loan under these maximum levels may be included in the cover pool calculations
Other comments (if any) All assets and eligible derivative contracts must be entered into a special registerRequirements
ALM matching Asset coverage The nominal value of the cover pool must at all times exceed the aggregate value of claims under the covered bonds. Same requirement on an NPV basis. The cover pool must also be matched in terms of currency, interest rate and maturity profile. Over-collateralisation requirements are not defined by legislation
Interest coverage The issuing institution must ensure that the flow of payments regarding assets in the cover pool, derivative agreements and covered bonds are such that the institution is at all times able to fulfill its payment obligations
Other (if any)Consequence of breachMonitoring In addition to the FSA, the regulator also appoints an independent asset inspector responsible for monitoring
the cover pool Register. The Inspector ensures that only eligible collateral and substitute assets are included on the Register, the valuation of the underlying collateral is in compliance with the Covered Bond Act, and that matching requirements are met
Other
Compliance with EU legislation
UCITS and CRD compliant.
Source: National legislation, J.P. Morgan Covered Bond Research

261
Europe Credit Research12 September 2011
Gareth Davies, CFA(44-20) [email protected]
Flavio Marco Rusconi(44-20) [email protected]
Swedish covered bond & macro backdrop
Figure 153: CB issuance, €mm
Source: ECBC. Latest data available displayed
Figure 154: CB outstanding, €mm
Source: ECBC. Latest data available displayed
Figure 155: Swedish real GDP growth, y-on-y, %
Source: Bloomberg
Figure 156: Swedish unemployment level, %
Source: Bloomberg
Figure 157: Swedish CPI and base rate, %
Source: Bloomberg
Figure 158: Swedish consumer confidence, balance of survey
Source: Bloomberg
Figure 159: Swedish house price growth, y-on-y, %
Source: Bloomberg
Figure 160: Swedish residential building permits, #
Source: Bloomberg
0
20,000
40,000
60,000
80,000
100,000
2003 2004 2005 2006 2007 2008 2009 2010
Mortgage
0
50,000
100,000
150,000
200,000
2003 2004 2005 2006 2007 2008 2009 2010
Mortgage
-8-6-4-202468
10
Mar
-00
Mar
-01
Mar
-02
Mar
-03
Mar
-04
Mar
-05
Mar
-06
Mar
-07
Mar
-08
Mar
-09
Mar
-10
Mar
-11
Real GDP growth
0123456789
10
Mar
-00
Mar
-01
Mar
-02
Mar
-03
Mar
-04
Mar
-05
Mar
-06
Mar
-07
Mar
-08
Mar
-09
Mar
-10
Mar
-11
Unemployment
-3-2-10123456
Mar
-00
Mar
-01
Mar
-02
Mar
-03
Mar
-04
Mar
-05
Mar
-06
Mar
-07
Mar
-08
Mar
-09
Mar
-10
Mar
-11
Inflation Base rate
-30
-20
-10
0
10
20
30
40
Mar
-00
Mar
-01
Mar
-02
Mar
-03
Mar
-04
Mar
-05
Mar
-06
Mar
-07
Mar
-08
Mar
-09
Mar
-10
Mar
-11
Cons. Confidence
-4%-2%0%2%4%6%8%
10%12%14%16%
Mar
-01
Mar
-02
Mar
-03
Mar
-04
Mar
-05
Mar
-06
Mar
-07
Mar
-08
Mar
-09
Mar
-10
Mar
-11
OECD HP nominal growth
0
2000
4000
6000
8000
10000
12000
14000
Mar
-00
Mar
-01
Mar
-02
Mar
-03
Mar
-04
Mar
-05
Mar
-06
Mar
-07
Mar
-08
Mar
-09
Mar
-10
Mar
-11
Residential building permits (sum of prev. 12 mths)

262
Europe Credit Research12 September 2011
Gareth Davies, CFA(44-20) [email protected]
Flavio Marco Rusconi(44-20) [email protected]
Landshypotek AB
(BBG: LANHYP)Snapshot
Landshypotek is a cooperative credit institution specialising in the financing of Swedish agriculture and forestry industries. Customers are members of the association that owns and operates the business, and are required to be farm or forestry landowners. Landshypotek provides a wide array of financial products to its members, including both banking and insurance services.
The mainstay of Landshypotek’s product range is first-lien mortgages, with supplemental bank and insurance services offered in partnership with other providers. Due to its cooperative structure, all members receive refunds on their interest payments when the institution makes a profit. The overwhelming majority of cover pool assets is secured on agricultural properties.
Financial performance
We set out below some of the key financial performance metrics:
Table 595: Key profit & loss figures, SEKmm
FY 2008 FY 2009 FY 2010Net interest income 345 304 472Provisions for loan losses n/a n/a n/aNII less provisions 345 304 472Commissions & fee income n/a n/a -9Other operating income 58 39 96Non-interest expense 220 220 208Operating profit (loss) 13 172 351PBT 13 172 351Taxes 1 43 77Net profit (loss) 12 129 274
Source: Bloomberg
Table 596: Key balance sheet figures, SEKmm
FY 2008 FY 2009 FY 2010
Loans 41,301 46,456 51,773 Total Assets 51,254 59,796 64,161 Deposits 32 45 105 Short-term borrowings 7,510 5,710 84 Other ST borrowings n/a n/a n/aLong-term borrowings 38,837 49,027 58,963 Equity 3,318 3,320 3,429
Source: Bloomberg
Table 597: Select financial metrics
FY 2008 FY 2009 FY 2010NIM n/a 0.57 0.78ROA n/a 0.23 0.44ROE n/a 3.89 8.11ROC n/a 0.24 0.45C:I 94.39 56.09 37.20Core capital n/a n/a n/a
Source: Bloomberg
Cover pool overview
We set out below some of the key cover pool characteristics:
Table 598: Covered bond characteristics
As at July 2011
Covered bond rating AAA/-/-Issuer rating A-/A3/A+
SEK mm
Cover pool 49,849 Substitute assets 21,930 Covered bonds 53,529 Over-collateralisation 14.60%
Average LTV (%) 39.7 Number of loans 133,984 Average loan size (SEK) 372,054 Agricultural properties (%) 98.8 Residential properties (%) 1.2
Source: Investor Report

263
Europe Credit Research12 September 2011
Gareth Davies, CFA(44-20) [email protected]
Flavio Marco Rusconi(44-20) [email protected]
Länsförsäkringar Hypotek AB
(BBG: LANSBK)Snapshot
Twenty-three regional insurance companies own Länsförsäkringar AB, and its subsidiaries, including both Länsförsäkringar Bank AB, and its mortgage subsidiary Länsförsäkringar Hypotek AB. The Group offers insurance, pensions and banking services to its customers.
Länsförsäkringar Bank is the fifth largest retail bank in Sweden, focusing primarily on private individuals and farmers. Banking services are conducted at the 125 branches of the regional insurance companies, along with more modern distribution channels, including telephone and internet banking.
Länsförsäkringar Hypotek is one of the largest retail mortgage institutions in Sweden, with lending of some SEK82bn as at March 2011, predominantly funded through the issuance of covered bonds. 81% of its lending is to private individuals, primarily in the form of mortgages.
Financial performance
We set out below some of the key financial performance metrics:
Table 599: Key profit & loss figures, SEKmm
FY 2008 FY 2009 FY 2010Net interest income 965 985 1,055Provisions for loan losses 76 100 37NII less provisions 889 885 1,018Commissions & fee income 200 188 197Other operating income 27 34 42Non-interest expense 585 653 659Operating profit (loss) 561 569 729PBT 561 569 729Taxes 166 162 184Net profit (loss) 395 407 546
Source: Bloomberg
Table 600: Key balance sheet figures, SEKmm
FY 2008 FY 2009 FY 2010Loans 39,831 44,311 43,438Total Assets 46,035 51,160 51,238Deposits 23,327 26,936 28,306Short-term borrowings 3,742 6,998 5,737Other ST borrowings 280 n/a n/aLong-term borrowings 14,789 12,411 11,732Equity 2,961 3,636 3,751
Source: Bloomberg
Table 601: Select financial metrics
FY 2008 FY 2009 FY 2010NIM 2.28 2.06 2.15ROA 0.88 0.82 1.07ROE 13.45 12.04 14.79ROC 1.97 1.78 2.47C:I 46.36 48.02 44.85Core capital 9.12 11.55 11.88
Source: Bloomberg
Cover pool overview
We set out below some of the key cover pool characteristics:
Table 602: Covered bond characteristics
As at 31 March 2011
Covered bond rating AAA/Aaa/-Issuer rating(Länsförsäkringar Bank) A/A2/-
Cover pool (SEK bn) 99Substitute assets (SEKbn) 16Over-collateralisation 21.0
Average LTV (%) 59.0 Number of loans 203,395 Average loan size (SEK) 385,000 Single family houses 79.0 Tenant-owned apartments 20.0 Leisure homes 1.0
Source: Investor Report
Table 603: Collateral pool LTV breakdown
Current LTV ranges As at 31 March 20110-<=40% 14.0>40%-<=50% 10.0>50%-<=60% 16.0>60%-<=70% 29.0>70%-<=75% 31.0>75% 0.0
Source: Investor Report

264
Europe Credit Research12 September 2011
Gareth Davies, CFA(44-20) [email protected]
Flavio Marco Rusconi(44-20) [email protected]
Nordea Hypotek AB
(BBG: NHBSS)Snapshot
Nordea Hypotek is a wholly owned subsidiary of Nordea Bank AB, the Nordic region’s largest financial institution. Nordea Hypotek is the third largest mortgage lender in Sweden, granting loans to Swedish households, municipalities, municipal housing companies and corporates.
The purpose of the lending is primarily to finance properties, agriculture and municipal activities, with a central emphasis on housing finance. Collateral consists predominantly of mortgages on residential property, tenant-owned apartments or municipal guarantees. Nordea also issues covered bonds through its Danish subsidiary (Nordea Realkredit), alongside its Norwegian and Finnish operations (Nordea Eiendomskreditt and Nordea Bank Finland Oyj).
Financial performance
We set out below some of the key financial performance metrics:
Table 604: Key profit & loss figures, SEKmm
FY 2008 FY 2009 FY 2010Net interest income 49,055 56,096 49,223Provisions for loan losses 4,488 15,785 8,387NII less provisions 44,567 40,311 40,836Commissions & fee income 24,388 26,215 28,194Other operating income 1,657 1,115 1,107Non-interest expense 48,025 56,159 53,573Operating profit (loss) 32,489 32,153 34,090PBT 32,710 32,663 34,720Taxes 6,974 8,041 9,312Net profit (loss) 25,727 24,580 25,351
Source: Bloomberg
Table 605: Key balance sheet figures, SEKmm
FY 2008 FY 2009 FY 2010
Loans 2,905,450 2,896,371 2,824,328Total Assets 5,196,220 5,205,288 5,220,950Deposits 1,628,673 1,575,061 1,585,505Short-term borrowings 569,215 535,252 366,161Other ST borrowings 5,020 5,795 4,512Long-term borrowings 1,284,581 1,412,270 1,432,240Equity 195,135 229,936 220,563
Source: Bloomberg
Table 606: Select financial metrics
FY 2008 FY 2009 FY 2010NIM 1.48 1.29 1.03ROA 0.62 0.47 0.49ROE 15.35 11.55 11.36ROC 1.56 1.16 1.22C:I 53.05 49.99 51.96Core capital 7.40 11.40 11.40
Source: Bloomberg
Cover pool overview
We set out below some of the key cover pool characteristics:
Table 607: Covered bond characteristics
As at July 2011
Covered bond rating AAA/Aaa/-Issuer rating AA-/Aa2/AA-
Cover pool (SEK bn) 403.8 Substitute assets (SEKbn) 11.3 Over-collateralisation 25.8%
WA Current LTV (%) 59.4 WA Indexed LTV (%) 53.2
Number of loans 725,002 Average loan size (SEK) 511,000 Single family houses 45.6 Tenant owned units 19.2 Multi family houses 16.0 Other houses, agricultural, commercial, public sector
19.3
Source: Investor Report
Table 608: Collateral pool LTV breakdown
Current LTV ranges As at 31 March 20110-<=40% 69.2>40%-<=50% 12.0>50%-<=60% 9.5>60%-<=70% 6.8>70%-<=75% 2.4>75% 0.0
Source: Investor report

265
Europe Credit Research12 September 2011
Gareth Davies, CFA(44-20) [email protected]
Flavio Marco Rusconi(44-20) [email protected]
Skandinaviska Enskilda Banken AB
(BBG: SEB)Snapshot
Skandinaviska Enskilda Banken AB, or SEB, is one of Northern Europe’s leading financial groups, and the second largest bank in Sweden after Nordea. The group is predominantly focused on banking activities (although it also carries out life insurance business in selected markets) and is a leading universal bank in Sweden and the Baltic states.
In other Nordic countries, SEB’s operations focus on wholesale and investment banking, along with wealth management. The group also offers banking services in Germany, focusing on wholesale banking, commercial real estate finance, asset management and retail banking.
Financial performance
We set out below some of the key financial performance metrics:
Table 609: Key profit & loss figures, SEKmm
FY 2008 FY 2009 FY 2010Net interest income 18,832 18,154 16,173Provisions for loan losses 3,268 12,030 1,837NII less provisions 15,564 6,124 14,336
3,444 4,646 3,226Comm.& fee income 19,877 17,995 18,671Other operating income 4,007 5,714 3,380Non-interest expense 30,030 29,977 27,698Operating profit (loss) 12,862 4,502 11,915
391 151 810PBT 12,471 4,351 11,105Taxes 2,421 2,482 2,521Net profit (loss) 10,041 1,114 6,745
Source: Bloomberg
Table 610: Key balance sheet figures, SEKmm
FY 2008 FY 2009 FY 2010Loans 1,296,777 1,187,837 1,074,879Total Assets 2,510,702 2,308,227 2,179,821Deposits 841,034 801,088 711,541Short-term borrowings 429,425 397,433 212,624Other ST borrowings 240,657 129,959 124,880Long-term borrowings 576,449 492,406 556,035Equity 83,729 99,669 99,543
Source: Bloomberg
Table 611: Select financial metrics
FY 2008 FY 2009 FY 2010NIM 0.89 0.84 0.84ROA 0.41 0.05 0.30ROE 12.55 1.22 6.79ROC 0.94 0.11 0.73C:I 61.17 60.45 62.77Core capital 10.10 13.90 14.20
Source: Bloomberg
Cover pool overview
We set out below some of the key cover pool characteristics:
Table 612: Covered bond characteristics
As at July 2011
Covered bond rating -/Aaa/-Issuer rating A/A1/A+
Total Cover Pool Balance: (SEKbn) 306.0 OC (%) 46.0
WA Loan Balance: (SEK) 591,460 No. of Loans: 517,424No. of Borrowers: 335,419No. of Properties: 221,108
Single family properties (%) 61.0Rental properties (%) 24.0Multifamily (%) 15.0
Floating rate loans (%) 61.0WA Legal Maturity (in months): 508WA LTV (in %): 45.0 WA Interest Rate on Floating rate Loans (in %): 3.21 WA Interest Rate on Fixed rate Loans (in %): 3.46
Source: Investor Report
Table 613: Collateral pool LTV breakdown
Current LTV ranges As at 31 March 2011
0-<=40% 46%>40%-<=50% 14%>50%-<=60% 12%>60%-<=70% 11%>70%-<=75% 17%
Source: Investor report

266
Europe Credit Research12 September 2011
Gareth Davies, CFA(44-20) [email protected]
Flavio Marco Rusconi(44-20) [email protected]
Stadshypotek Mortgage AB
(BBG: SHBASS)Snapshot
Stadshypotek AB is a wholly-owned domestic mortgage subsidiary of Svenska Handelsbanken AB. Handelsbanken is a universal bank offering both retail and commercial banking services in Sweden, along with operations in the other Nordic countries, as well as the UK. Its 461-strong branch network is organised along twelve regional banks, 6 of which are in Sweden, one each in Denmark, Finland and Norway and three in the UK.
Stadshypotek issues covered bonds in accordance with the Swedish Covered Bond Act, with both a domestic and international programme available to investors. The bonds are backed by a pool of Swedish mortgages.
Financial performance
We set out below some of the key financial performance metrics:
Table 614: Key profit & loss figures, SEKmm
FY 2008 FY 2009 FY 2010Net interest income 3,900 6,067 5,501Provisions for loan losses -75 -31 -38NII less provisions 3,975 6,098 5,463
Comm.& fee income 12 10 10Other operating income n/a n/a n/aNon-interest expense 234 246 270Operating profit (loss) 3,682 5,761 5,408
PBT 3,682 5,761 5,408Taxes 1,027 1,521 1,423Net profit (loss) 2,655 4,240 3,895
Source: Bloomberg
Table 615: Key balance sheet figures, SEKmm
FY 2008 FY 2009 FY 2010Loans 615,263 684,920 758,855Total Assets 659,498 722,790 796,681Deposits n/a n/a n/aShort-term borrowings 182,602 212,983 294,417Other ST borrowings 3,231 3,860 8,607Long-term borrowings 439,204 467,335 458,681Equity 20,018 21,692 24,431
Source: Bloomberg
Table 616: Select financial metrics
FY 2008 FY 2009 FY 2010NIM n/a 0.90 0.72ROA n/a 0.61 0.71ROE n/a 20.33 16.20ROC n/a 0.63C:I 5.03 3.57 4.30Core capital 5.90 28.40 36.80
Source: Bloomberg
Cover pool overview
We set out below some of the key cover pool characteristics:
Table 617: Covered bond characteristics
As at 30 June 2011
Covered bond rating -/Aaa/-Issuer rating (Stadshypotek AB) AA-/-/AA-
Cover pool (SEKbn) 661.6 Substitute assets 5.0 Covered bonds (SEKbn) 437.1 Over-collateralisation (%) 10.0
Average LTV 48.4 Number of loans 881,121 Average loan size (€) 584,100 Single family houses 37.1 Multi family houses 19.9 Other houses, commercial, agricultural 43.0
Source: Investor Report
Table 618: Collateral pool LTV breakdown
Current LTV ranges As at 30 June 2011
0-<=40% 82.4 >40%-<=50% 10.5 >50%-<=60% 6.9 >60%-<=70% 0.1 >70%-<=75% 0.0
Source: Investor report

267
Europe Credit Research12 September 2011
Gareth Davies, CFA(44-20) [email protected]
Flavio Marco Rusconi(44-20) [email protected]
Swedbank Mortgage AB
(BBG: SPNTAB)Snapshot
Swedbank Mortgage is the largest mortgage institution in Sweden. It has more than 1 million customers, financing more than one third of all the houses in Sweden. Swedbank Mortgage is a fully owned subsidiary of Swedbank, with its products primarily sold through the branch network of Swedbank and the savings banks (approximately 680 branches). Swedbank Mortgage lends only domestically. Its parent company focuses on the provision of banking services to private customers and small-and-medium-sized enterprises in Sweden and the Baltic states.
Swedbank Mortgage funds itself on both the Swedish and international capital markets, issuing covered bonds under its domestic bond programme, its EMTN programme as well as its Swedish MTN programme. The covered bonds are backed by a pool of Swedish mortgages.
Financial performance
We set out below some of the key financial performance metrics:
Table 619: Key profit & loss figures, SEKmm
FY 2008 FY 2009 FY 2010Net interest income 21,702 20,765 16,329Provisions for loan losses 3,156 24,641 2,810NII less provisions 18,546 -3,876 13,519
2,351 2,770 2,400Comm.& fee income 12,241 11,397 13,099Other operating income 4,179 2,556 2,166Non-interest expense 22,607 21,420 21,216Operating profit (loss) 14,710 -8,573 9,968
891 888 13PBT 13,819 -9,461 9,955Taxes 2,880 981 2,472Net profit (loss) 10,887 -10,511 7,444
Source: Bloomberg
Table 620: Key balance sheet figures, SEKmm
FY 2008 FY 2009 FY 2010Loans 1,287,424 1,290,667 1,187,226Total Assets 1,811,690 1,794,687 1,715,681Deposits 508,456 504,424 534,237Short-term borrowings 316,730 231,687 136,766Other ST borrowings 117,910 73,667 66,252Long-term borrowings 638,120 741,241 713,704Equity 86,462 89,974 95,035
Source: Bloomberg
Table 621: Select financial metrics
FY 2008 FY 2009 FY 2010NIM 1.37 1.24 1.01ROA 0.64 -0.58 0.42ROE 14.12 -11.95 8.07ROC 1.10 -0.99 0.75C:I 51.79 52.62 57.99Core capital 10.60 13.50 15.20
Source: Bloomberg
Cover pool overview
We set out below some of the key cover pool characteristics:
Table 622: Covered bond characteristics
As at July 2011
Covered bond rating AAA/Aaa/-Issuer rating A/A2/A
Cover pool (SEKbn) 642.9 Covered bonds (SEKbn) 506.1 Over-collateralisation (%) 27.0
Average LTV 56.0 Number of loans 1,535,061 Average loan size (€) 418,774 Single family houses 62.1 Multi family houses 28.8 Other houses, commercial, agricultural 9.1
Source: Investor Report

268
Europe Credit Research12 September 2011
Gareth Davies, CFA(44-20) [email protected]
Flavio Marco Rusconi(44-20) [email protected]
Swedish Covered Bond Corporation
(BBG: SCBCC)Snapshot
The Swedish Covered Bond Corporation (SCBC) is a wholly-owned subsidiary of the Swedish Housing Finance Corporation (SBAB), which in turn is owned in its entirety by the Kingdom of Sweden. SBAB offers loans and savings products, with a 100% domestic mortgage portfolio. SCBC does not engage in any lending activities itself, instead acquiring loans from SBAB as required.
SCBC's business activities are predominantly focused on issuing covered bonds, both domestically and on the international capital markets (accounting for 36% and 22% of its funding requirements respectively). The bonds are backed by Swedish residential mortgages.
Financial performance
We set out below some of the key financial performance metrics:
Table 623: Key profit & loss figures, SEKmm
FY 2008 FY 2009 FY 2010Net interest income 1,141 1,519 1,762Provisions for loan losses n/a n/a n/aNII less provisions n/a n/a n/a
Comm.& fee income n/a 44 50Other operating income -14 6 0Non-interest expense 520 578 604Operating profit (loss) 585 1,289 785
PBT n/a n/a n/aTaxes 161 338 208Net profit (loss) 424 951 577
Source: Bloomberg
Table 624: Key balance sheet figures, SEKmm
FY 2008 FY 2009 FY 2010LoansTotal Assets 253,294 294,075 316,925Deposits 3,542 4,653 6,083Short-term borrowings n/a n/a n/aOther ST borrowings n/a n/a n/aLong-term borrowings n/a n/a n/aEquity 6,432 7,377 8,014
Source: Bloomberg
Table 625: Select financial metrics
FY 2008 FY 2009 FY 2010NIM n/a n/a n/aROA n/a n/a n/aROE 6.70 13.80 7.50ROC n/a n/a n/aC:I n/a n/a n/aCore capital 7.60 7.40 8.70
Source: Bloomberg
Cover pool overview
We set out below some of the key cover pool characteristics:
Table 626: Covered bond characteristics
As at July 2011
S/M/FCovered bond rating AAA/Aaa/-Issuer rating (SBAB Bank AB) A+/A1/-
Mortgage certificate (SEK bn) 147.7 Pledges (SEK bn) 45.6 Municipal & govt g'tee (SEK bn) 4.9 KFA-Municipal g'tee (SEK bn) 0.3 BKN-Public sector g'tee (SEK bn) 0.4 Direct loans to municipalities (SEK bn) 0.6 Other (SEK bn) -
WA LTV mortgages 56.1 WA LTV pledges 63.9
Source: Investor Report
Table 627: Collateral pool LTV breakdown
Current LTV ranges As at 30 June 2011
0-<=40% 19.9 >40%-<=50% 10.2 >50%-<=60% 18.5 >60%-<=70% 14.1 >70%-<=75% 37.3
Source: Investor report

269
Europe Credit Research12 September 2011
Gareth Davies, CFA(44-20) [email protected]
Flavio Marco Rusconi(44-20) [email protected]
Sw
iss C
ove
red
Bo
nd
s

270
Europe Credit Research12 September 2011
Gareth Davies, CFA(44-20) [email protected]
Flavio Marco Rusconi(44-20) [email protected]
Swiss Covered Bonds
Legislative snapshot
We set out in Table 628 a snapshot of key covered bond attributes in Switzerland.
Table 628: Swiss Covered Bond legislative overview
Attribute CommentaryFrameworkLegislative Framework Issuance of Swiss Pfandbriefe is limited to just two institutions by law (Pfandbriefgesetz).One is used by
cantonal banks and the other by non-cantonal banks. Bonds are issued in Swiss Francs only. Types of covered bonds Swiss Pfandbriefe and the structured covered bonds issued by the large universal banks. Structure of Issuer Direct issuance? Both PBB and PBZ use the proceeds raised through pfandbrief issuance and pass them on to the member
institutions who originated the loans. The underlying mortgages remain on the member bank’s balance sheets, but PBB and PBZ receive a lien on the eligible cover assets.Bonds issued in the international capital markets by the two universal banks (Credit Suisse and UBS) have used a UK-style structured covered bond technology. The covered bonds are direct, senior unsecured and unconditional obligations of the issuer but guaranteed by a third party SPV that receives security over the cover pool upon issuer default.
Comments (if any) UBS and CS CB - Under the Swiss law concept of Pre-funding, the issuer has to pre-fund all of the guarantor's payment obligations to the bond holders and other transaction parties. The cover pool effectively collateralises these payments after the issuer has defaulted: if the issuer fails to make such payments, the guarantor can then use cashflows from the assets. No acceleration upon issuer default; only upon guarantor or Pfandbrief institute default.
Bankruptcy remoteness PfG – upon member bank insolvency, pfandbrief issuers would have a direct priority claim on the interest and principal payments of registered collateral. Finma can also require transfer of the collateral pool or arrange for sale of the cover assets.For UBS and CS, bankruptcy will result in the transfer of the security over the cover pool to the Guarantor. As mentioned above, the security will be perfected only if the issuer fails to meet its pre-funding obligations.
Dual claim Yes in both case. In case of PfG, the bondholder does not have direct recourse to the member bank, but only to the Pfandbrief institute. The institute, however, has direct recourse to the member banks. For UBS and CS covered bonds, immediate claim pari passu with unsecured bondholders and recourse to the cover pool.
Bond format UBS and CS covered bonds are fixed rate; the docs allow for the issuance of both hard and soft bullets.Supervision Swiss Banking Regulator (Finma), along with external, third-party audits.Cover pool
Eligible assets Mortgage Only Swiss prime mortgages residential mortgages.LTV caps PfG allows only for mortgages on real property and land. LTV limits stand at 67% for homes, 50% for
weekend holiday homes and 33% for apartments in holiday resorts. UBS has a hard cap of 100%. CS has soft cap of 70% but hard cap of 100% LTV.
Public Sector n/aNon-performing collateral UBS and CS do not have to substitute loans in arrears but less credit is given to them in the calculation of the
coverage ratio.Substitution Assets PfG: Substitute assets are defined as cash or Swiss marketable securities. There is no explicit cap on the
level of substitute assets. UBS and CS allow up to 15% substitute collateral.Hedging Permitted under UBS and CS to reduce risk. Natural matching under PfG and no derivatives allowed. Valuation Market values.Other comments (if any)
Requirements
ALM matching Asset coverage UBS and CS have committed to at least 11% OC or 90% asset percentage. Asset Coverage tests are designed to ensure that pool collateral is sufficient to meet future interest and principal cashflows on the outstanding covered bonds. Under the PfG, OC of at least 8%.
Interest coverage Interest Coverage test to ensure interest from the cover pool after hedges always exceeds payments due on the covered bonds.
Other (if any) UBS and CS have a pre-maturity test to ensure liquidity if the issuer is downgraded. They also need ot maintain a reserve fund for liquidity reasons.
Consequence of breach For UBS and CS, a breach of the ACT and ICT can lead to issuer EoD. Monitoring For PfG, there are the two Pfandbrief institutes. For UBS and CS, the are nominated trustee/cover pool
monitors.Other
Compliance with EU legislation
PfG is compliant with both UCITS and CRD; UBS and CS are not/
Source: National legislation, J.P. Morgan Covered Bond Research

271
Europe Credit Research12 September 2011
Gareth Davies, CFA(44-20) [email protected]
Flavio Marco Rusconi(44-20) [email protected]
Swiss covered bond backdrop
Figure 161: CB Issuance, €mm
Source: ECBC, latest data available
Figure 162: CB outstanding, €mm
Source: ECBC, latest data available
0
2,000
4,000
6,000
8,000
10,000
12,000
14,000
16,000
2003 2004 2005 2006 2007 2008 2009 2010
Mortgage Structured
0
10,000
20,000
30,000
40,000
50,000
60,000
70,000
2003 2004 2005 2006 2007 2008 2009 2010
Mortgage Structured

272
Europe Credit Research12 September 2011
Gareth Davies, CFA(44-20) [email protected]
Flavio Marco Rusconi(44-20) [email protected]
Credit Suisse Group AG
(BBG: CS)Snapshot
CS is a global financial services firm, headquartered in Zurich. The firm has a strong global presence with over 400 offices in 55 countries. It is the sixth largest bank globally by assets and market capitalisation and the fourth largest by assets under management, totaling just under CHF 1.3trn. The bank operates along three main business lines: private banking, investment banking and asset management and also provides retail banking services in Switzerland.
Private banking offers wealth management and banking services to individuals, high net-worth clients, SMEs and corporates. Assets under management total CHF 933bn and the bank can count over two million private banking clients worldwide, in addition to over 100,000 corporates and institutions, mostly located in Switzerland.
Through its investment banking business, the group offers global securities sales, trading and execution, prime brokerage and capital raising and advisory services, as well as comprehensive investment research to institutional clients around the world.
Asset management offers institutional and individual clients a range of products, both traditional and alternative. Clients are reached through the private and investment banking networks, a separate asset management distribution network and third-party channels
Financial performance
We set out below some of the key financial performance metrics:
Table 629: Key profit & loss figures, CHFmm
FY 2008 FY 2009 FY 2010Net interest income 8,536 6,891 6,541Provisions for loan losses 813 506 -79NII less provisions 7,723 6,385 6,620
Comm.& fee income 14,812 13,750 14,078Other operating income 385 619 397Non-interest expense 23,297 24,711 23,978Operating profit (loss) -14,816 7,933 7,278
PBT -14,902 8,077 7,487Taxes -4,596 1,835 1,548Net profit (loss) -8,218 6,724 5,098
Source: Bloomberg
Table 630: Key balance sheet figures, CHFmm
FY 2008 FY 2009 FY 2010Commercial Loans 114,754 112,929 139,298Consumer Loans 107,027 108,810 49,316Other Loans 15,655 16,836 31,245Total Assets 1,170,350 1,031,427 1,032,005Deposits 296,986 286,694 287,564Short-term borrowings 69,147 43,859 59,176Other ST borrowings 360,253 299,406 297,968Long-term borrowings 153,373 159,365 173,752Equity 47,221 50,416 45,151
Source: Bloomberg
Table 631: Select financial metrics
FY 2008 FY 2009 FY 2010NIM 0.9 0.9 0.8ROA -0.6 0.6 0.5ROE -21.8 18.7 13.6ROC -1.9 1.3 1.3C:I 300.0 72.9 75.2Core capital 13.3 16.3 17.2
Source: Bloomberg
Cover pool overview
We set out below some of the key cover pool characteristics:
Table 632: Covered bond characteristics
As at July 2011Ratings S/M/FCovered bond rating -/Aaa/AAAIssuer rating A/Aa2/AA-
Cover poolCover pool size (CHF) 7,703,982,578Number of properties 14,892Number of contracts 22,148Average loan balance (CHF) 347,841Available over-collateralisation (in %) 211 Excess over-collateralisation (in %) 162
WA remaining term of loans (yrs) 3.0WA LTV (%) 68.7Fixed rate assets (in %) 79.4Highest regional concentration (in %) Zurich - 23
Source: Investor Report
Table 633: Collateral pool LTV breakdown
Current LTV ranges As at July 20110-<=40% 6.4>40%-<=50% 7.1>50%-<=60% 11.3>60%-<=70% 24.8>70%-<=80% 26.5>80% 23.9
Source: Investor Report

273
Europe Credit Research12 September 2011
Gareth Davies, CFA(44-20) [email protected]
Flavio Marco Rusconi(44-20) [email protected]
UBS AG
(BBG: UBS)Snapshot
Headquartered in Zurich and Basel, UBS is a global financial services firm, offering wealth management, asset management and investment banking services in over 50 countries. The bank is by far the largest by assets under management (CHF 2.3trn) and focuses on the provision of financial services to private, corporate and institutional clients across a four-division structure.
Wealth Management & Swiss Bank focuses on HNW individuals (with the exception of clients in the Americas, who are served by Wealth Management Americas) and retail and corporate banking business in Switzerland. The division reaches clients in over 40 countries but maintains a strong foothold in the domestic market, where it maintains a leading position.
The two other divisions are Global Asset Management and the institution's Investment Bank.
The firm operates mostly out of the Americas and Switzerland, which together account for 74% of the group's workforce, while 16% is located in other European countries and 10% in Asia.
UBS has a 20% mortgage market share in Switzerland, despite the strong competition from local cantonal banks, and 28% of its funding comes from customer deposits.
Financial performance
We set out below some of the key financial performance metrics:
Table 634: Key profit & loss figures, CHFmm
FY 2008 FY 2009 FY 2010Net interest income 5,993 6,445 6,216Provisions for loan losses 2,996 1,832 66NII less provisions 2,997 4,613 6,150
Comm.& fee income 26,677 20,827 19,216Other operating income 269 707 834Non-interest expense 31,962 27,155 26,597Operating profit (loss) -25,394 -3,594 6,658
PBT -27,758 -2,562 7,455Taxes -6,837 -443 -381Net profit (loss) -21,292 -2,736 7,534
Source: Bloomberg
Table 635: Key balance sheet figures, CHFmm
FY 2008 FY 2009 FY 2010Loans 340,308 306,827 262,676Total Assets 2,014,815 1,340,538 1,317,247Deposits 465,741 410,475 332,301Short-term borrowings 251,310 124,740 104,180Long-term borrowings 187,181 192,426 174,990Equity 40,533 48,633 51,863
Source: Bloomberg
Table 636: Select financial metrics
FY 2008 FY 2009 FY 2010NIM 0.4 0.7 0.7ROA -1.0 -0.2 0.6ROE -61.4 -7.4 17.2ROC -2.7 -0.4 1.9C:I 485.1 107.9 78.5Core capital 11.0 15.4 17.8
Source: Bloomberg
Cover pool overview
We set out below some of the key cover pool characteristics:
Table 637: Covered bond characteristics
As at July 2011Ratings S/M/FCovered bond rating -/Aaa/AAAIssuer rating A+/Aa3/A+
Cover poolCover pool size (CHF) 14,196,519,368Number of loans 36,328Average loan balance (CHF) 391,758Available over-collateralisation (in %) 45.5Excess over-collateralisation (in %) 22.6
WA remaining term of loans (yrs) 3.3WA LTV (%) 55.4Fixed rate assets (in %) 82.2Highest regional concentration (in %) Lake Geneva Area - 33
Source: Investor Report
Table 638: Collateral pool LTV breakdown
Current LTV ranges As at July 20110-<=40% 17.4>40%-<=50% 17.2>50%-<=60% 23.4>60%-<=70% 21.2>70%-<=80% 19.1>80% 1.7
Source: Investor Report

274
Europe Credit Research12 September 2011
Gareth Davies, CFA(44-20) [email protected]
Flavio Marco Rusconi(44-20) [email protected]

275
Europe Credit Research12 September 2011
Gareth Davies, CFA(44-20) [email protected]
Flavio Marco Rusconi(44-20) [email protected]
UK
Co
ve
red
Bo
nd
s

276
Europe Credit Research12 September 2011
Gareth Davies, CFA(44-20) [email protected]
Flavio Marco Rusconi(44-20) [email protected]
UK Covered Bonds
Legislative snapshot
We set out in Table 639 a snapshot of key covered bond attributes in the UK.
Table 639: UK Covered Bond legislative overview
Attribute CommentaryFrameworkLegislative Framework Yes. The Regulated Covered Bonds (RCB) Regulations 2008 (as subsequently amended). Previously a
contract-law based covered bond regimeTypes of covered bonds RCBs and non-RCBsStructure of Issuer Direct issuance? Yes and No. Unsecured bonds are directly issued by the institution, but guaranteed by a third party vehicle
Comments (if any) UKCB are issued by credit institutions, where the CB are direct, unsecured, unsubordinated and unconditional obligations of the Issuer. Under the typical structure, the Issuer lends the sums received from bond issuance to a guarantor (usually a Limited Liability Partnership (LLP) SPV), with the LLP using the funds to purchase collateral from the originator. Under this structure, the LLP agrees to guarantee the Issuer’s obligations to covered bond investors, collateralising the guarantee with the purchased loans and securities acquired from the Issuer. This structure is similar to that used in the Netherlands.
Bankruptcy remoteness Similar to the Netherlands, in case of insolvency of the originator, the issuer exercises the financial guarantee over the pledged assets; if the issuer is insolvent, assets are formerly transferred to the SPV. No acceleration on issuer default, only on breach of the Asset Percentage Test
Dual claim YesBond format Typically, fixed rate, hard bullet. However, an ability to extend maturities by up to 12 months following issuer
insolvencySupervision Financial Services AuthorityCover pool
Eligible assets Mortgage Owing to the (initial) non-statutory nature of the UK covered bond framework, originators typically define their own eligibility criteria (see individual programme snapshots). Most programmes are backed by UK residential mortgages, with Bank of Scotland’s Social Housing CB programme being the exception
LTV caps "Soft" (loans above the maximum can be included in the cover pool, with 'credit' given for only the eligible portion of the asset under the Asset Coverage Test). RCB legislation says an 80% maximum LTV, most programmes use 75% maximum. BoS Social Housing CB uses 60%
Public Sector N/a as of todayNon-performing collateral Can remain in the cover pool, with declining recognition of 90d+ collateral contribution in calculating the
programme testsSubstitution Assets Substitution assets consisting of highly liquid, non-mortgage assets are also eligible for inclusion, up to
certain, pre-defined programme limitsHedging Used to minimise interest rate, currency, credit or other risksValuation Individual market values. Partial indexation occurs on any increases in asset values, full indexation occurs on
declines in asset valuesOther comments (if any)
Requirements
ALM matching Asset coverage Exact requirements prescribed by the issuers. Asset Coverage Test (ACT) is designed to ensure that pool collateral is sufficient to meet future interest and principal cashflows on the outstanding covered bonds. Pre-maturity tests designed to ensure the borrower can provide sufficient liquidity in case of downgrade (i.e. pre-defined period prior to scheduled bond redemption, if a borrower's short-term rating is below threshold, the borrower must fund a cash collateral account to ensure redemption). Amortisation tests are designed to ensure the issuer has the capacity to meet its obligations following a borrower EOD (nominal value of assets has to be greater than principal amount of o/s bonds, plus the costs associated with running the programme).
Interest coverage n/aOther (if any) Shelves must also comply with any other programme requirements. The RCB framework is proposed to be
tightened following a FSA consultation which ended in July 2011. Changes are expected to be adopted from 2013. Main developments are expected to include introduction of a formalised third party asset monitor, additional disclosure requirements, the ability to designate a programme as being single-asset, and the removal of eligibility of own-firm AAA securitisation bonds.
Consequence of breach Failure to rectify breach of ACT within a pre-defined period results in issuer insolvency. Breach of the Amortisation Test following issuer insolvency results in programme acceleration
Monitoring By issuerOther
Compliance with EU legislation
Dependant on programme, but generally UCITS and CRD compliant for RCBs
Source: National legislation, J.P. Morgan Covered Bond Research

277
Europe Credit Research12 September 2011
Gareth Davies, CFA(44-20) [email protected]
Flavio Marco Rusconi(44-20) [email protected]
UK covered bond & macro backdrop
Figure 163: CB issuance, €mm
Source: ECBC. Latest data available displayed
Figure 164: CB outstanding, €mm
Source: ECBC. Latest data available displayed
Figure 165: UK real GDP growth, y-on-y, %
Source: Bloomberg
Figure 166: UK unemployment level, %
Source: Bloomberg
Figure 167: UK CPI and base rate, %
Source: Bloomberg
Figure 168: UK consumer confidence, balance of survey
Source: Bloomberg
Figure 169: UK house price growth, y-on-y, %
Source: Bloomberg
Figure 170: UK mortgage loan approvals, #
Source: Bloomberg
0
20,000
40,000
60,000
80,000
100,000
120,000
140,000
2003 2004 2005 2006 2007 2008 2009 2010
Mortgage Public Sector
0
50,000
100,000
150,000
200,000
250,000
2003 2004 2005 2006 2007 2008 2009 2010
Mortgage Public Sector
-8
-6
-4
-2
0
2
4
6
Mar
-00
Mar
-01
Mar
-02
Mar
-03
Mar
-04
Mar
-05
Mar
-06
Mar
-07
Mar
-08
Mar
-09
Mar
-10
Mar
-11
Real GDP growth
0123456789
Mar
-00
Mar
-01
Mar
-02
Mar
-03
Mar
-04
Mar
-05
Mar
-06
Mar
-07
Mar
-08
Mar
-09
Mar
-10
Mar
-11
Unemployment
0
1
2
3
4
5
6
7
Mar
-00
Mar
-01
Mar
-02
Mar
-03
Mar
-04
Mar
-05
Mar
-06
Mar
-07
Mar
-08
Mar
-09
Mar
-10
Mar
-11
Inflation Base rate
-40-35-30-25-20-15-10-505
10
Mar
-00
Mar
-01
Mar
-02
Mar
-03
Mar
-04
Mar
-05
Mar
-06
Mar
-07
Mar
-08
Mar
-09
Mar
-10
Mar
-11
Cons. Confidence
-20-15-10
-505
1015202530
Mar
-00
Mar
-01
Mar
-02
Mar
-03
Mar
-04
Mar
-05
Mar
-06
Mar
-07
Mar
-08
Mar
-09
Mar
-10
Mar
-11
Nationwide house price growth
0100002000030000400005000060000700008000090000
100000
Jan-
00
Jan-
01
Jan-
02
Jan-
03
Jan-
04
Jan-
05
Jan-
06
Jan-
07
Jan-
08
Jan-
09
Jan-
10
Jan-
11
BBA Mortgage loan approvals
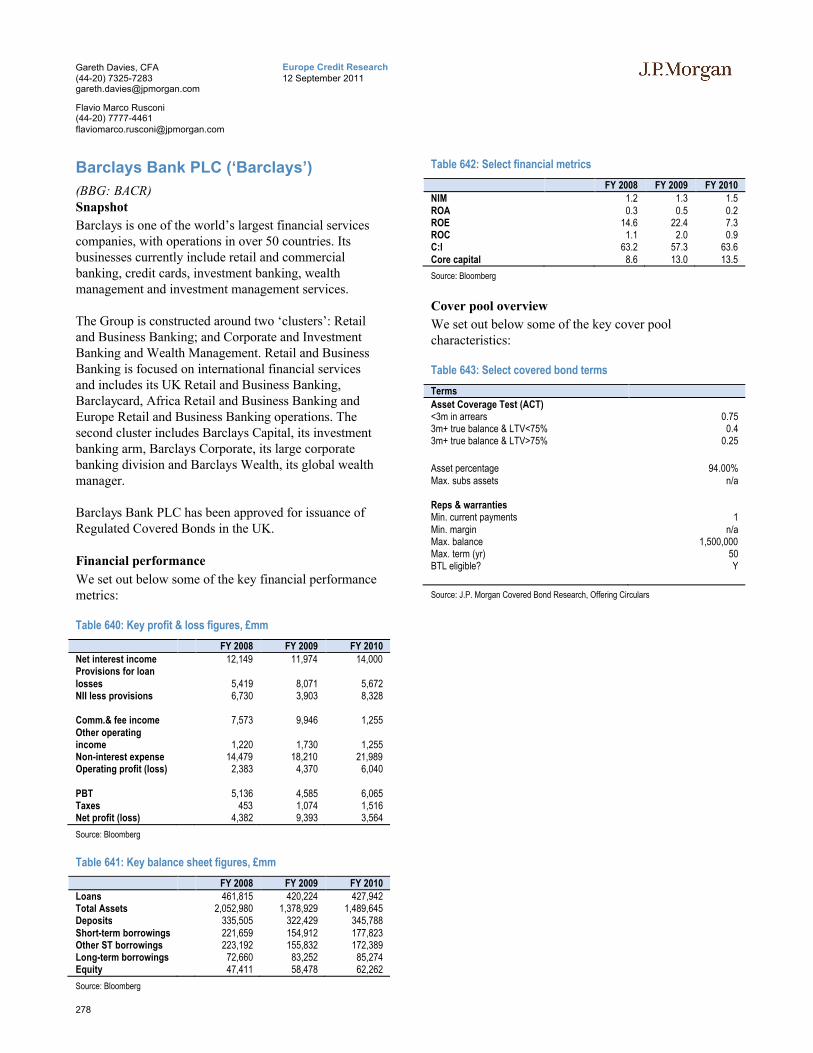
278
Europe Credit Research12 September 2011
Gareth Davies, CFA(44-20) [email protected]
Flavio Marco Rusconi(44-20) [email protected]
Barclays Bank PLC (‘Barclays’)
(BBG: BACR)Snapshot
Barclays is one of the world’s largest financial services companies, with operations in over 50 countries. Its businesses currently include retail and commercial banking, credit cards, investment banking, wealth management and investment management services.
The Group is constructed around two ‘clusters’: Retail and Business Banking; and Corporate and Investment Banking and Wealth Management. Retail and Business Banking is focused on international financial services and includes its UK Retail and Business Banking, Barclaycard, Africa Retail and Business Banking and Europe Retail and Business Banking operations. The second cluster includes Barclays Capital, its investment banking arm, Barclays Corporate, its large corporate banking division and Barclays Wealth, its global wealth manager.
Barclays Bank PLC has been approved for issuance of Regulated Covered Bonds in the UK.
Financial performance
We set out below some of the key financial performance metrics:
Table 640: Key profit & loss figures, £mm
FY 2008 FY 2009 FY 2010Net interest income 12,149 11,974 14,000Provisions for loan losses 5,419 8,071 5,672NII less provisions 6,730 3,903 8,328
Comm.& fee income 7,573 9,946 1,255Other operating income 1,220 1,730 1,255Non-interest expense 14,479 18,210 21,989Operating profit (loss) 2,383 4,370 6,040
PBT 5,136 4,585 6,065Taxes 453 1,074 1,516Net profit (loss) 4,382 9,393 3,564
Source: Bloomberg
Table 641: Key balance sheet figures, £mm
FY 2008 FY 2009 FY 2010Loans 461,815 420,224 427,942 Total Assets 2,052,980 1,378,929 1,489,645 Deposits 335,505 322,429 345,788 Short-term borrowings 221,659 154,912 177,823 Other ST borrowings 223,192 155,832 172,389 Long-term borrowings 72,660 83,252 85,274 Equity 47,411 58,478 62,262
Source: Bloomberg
Table 642: Select financial metrics
FY 2008 FY 2009 FY 2010NIM 1.2 1.3 1.5 ROA 0.3 0.5 0.2 ROE 14.6 22.4 7.3 ROC 1.1 2.0 0.9 C:I 63.2 57.3 63.6 Core capital 8.6 13.0 13.5
Source: Bloomberg
Cover pool overview
We set out below some of the key cover pool characteristics:
Table 643: Select covered bond terms
Terms
Asset Coverage Test (ACT)<3m in arrears 0.753m+ true balance & LTV<75% 0.43m+ true balance & LTV>75% 0.25
Asset percentage 94.00%Max. subs assets n/a
Reps & warrantiesMin. current payments 1Min. margin n/aMax. balance 1,500,000Max. term (yr) 50BTL eligible? Y
Source: J.P. Morgan Covered Bond Research, Offering Circulars

279
Europe Credit Research12 September 2011
Gareth Davies, CFA(44-20) [email protected]
Flavio Marco Rusconi(44-20) [email protected]
Table 644: Covered bond characteristics
As at July 2011Ratings S/M/FCovered bond rating AAA/Aaa/AAAIssuer rating A+/Aa3/AA-Fitch D:factor 18.60%Moody's TPI Probable
Cover pool Jul-11Total pool 14,007,522,766 Asset type:Mortgages 14,007,522,766 Cash n/aBonds outstanding 7,657,082,715
# mortgages 105,413Avg loan balance 132,882WA Indexed LTV 60.8 Indexed LTV>80% 9.9 Indexed LTV>90% 5.3 Indexed LTV>100% -
Interest only (%) 46.4 Fixed rate mtges (%) 34.3 Asset seasoning (mths) 35.7Current asset percentage (%) 74.9Amt of credit support n/a
Source: Investor Report

280
Europe Credit Research12 September 2011
Gareth Davies, CFA(44-20) [email protected]
Flavio Marco Rusconi(44-20) [email protected]
Bradford & Bingley PLC (‘Bradbi’)
(BBG: BRADBI)Snapshot
Bradford & Bingley Plc (‘Bradbi’) was the UK’s largest specialist Buy-to-Let mortgage lender, before its nationalisation in September 2008. In a two-part transaction, the savings arm and branch network of Bradbi were transferred to Santander (see Santander UK plc profile), while the rest of the group's operations,including the mortgage business, were transferred to public ownership. The covered bonds remain an obligation of the publicly-owned institution.
Approval of State Aid support was received from the EC on 25th January 2010. This extends the HM Treasury guarantee on Bradbi's covered bonds until institutional run-off is complete. Bradford & Bingley operations sit alongside those of Northern Rock (Asset Management) plc, the run-off institution of Northern Rock, under a single holding company called UK Asset Resolution (‘UKAR’). The companies remain separate legal entities, with their own balance sheets, liabilities and government support arrangements.
Financial performance
We set out below some of the key financial performance metrics:
Table 645: Key profit & loss figures, £mm
FY 2007 FY 2008 FY 2009 FY 2010Net interest income 548 737 612 608Provisions for loan losses 117 699 687 262NII less provisions 431 38 -75 346
Comm.& fee income 82 63 53 21Other operating income -64 206 45 6Non-interest expense 280 277 224 136Operating profit (loss) 175 -90 -209 284
PBT 126 134 -196 1,082Taxes 33 116 -98 262Net profit (loss) 93 18 -98 819
Source: Bloomberg
Table 646: Key balance sheet figures, £mm
FY 2007 FY 2008 FY 2009 FY 2010
Loans 40,445 41,826 38,986 36,402 Total Assets 51,985 55,923 49,395 45,359 Deposits 24,153 828 458 n/aShort-term borrowings 8,221 10,945 8,298 4,965 Other ST borrowings 658 22,067 27,776 27,794 Long-term borrowings 17,576 20,657 11,200 10,132 Equity 1,211 1,158 1,394 2,207
Source: Bloomberg
Table 647: Select financial metrics
FY 2007 FY 2008 FY 2009 FY 2010NIM 1.2 1.5 1.3 1.4 ROA 0.2 0.0 -0.2 1.7 ROE 7.1 1.5 -7.7 45.5 ROC 0.4 0.1 -0.4 4.3 C:I 49.0 31.2 31.9 19.9 Core capital 8.6 8.9 n/a n/a
Source: Bloomberg
Cover pool overview
We set out below some of the key cover pool characteristics:
Table 648: Select covered bond terms
Terms
Asset Coverage Test (ACT)<3m in arrears 0.753m+ true balance & LTV<75% 0.43m+ true balance & LTV>75% 0.4
Asset percentage 91.00%Max. subs assets 10.00%
Reps & warranties
Min. current payments 2Min. marginMax. balance 1,000,000Max. term (yr) 50BTL eligible? Y
Source: J.P. Morgan Covered Bond Research, Offering Circulars
Table 649: Covered bond characteristics
As at July 2011
Ratings S/M/FCovered bond rating AAA/Aa1/AAAIssuer rating -/Aa3/A+Fitch D:factor Not disclosedMoody's TPI Improbable
Cover pool Jul-11Total pool 9,652,130,114Asset type:Mortgages 9,651,077,323Cash 1,052,791Bonds outstanding 2,733,670,456
# mortgages 85,388Avg loan balance 113,026WA Indexed LTV 85.1 Indexed LTV>80% 70.6 Indexed LTV>90% 47.4 Indexed LTV>100% 21.8
Asset seasoning (mths) 65.3
Current asset percentage 71.0 Amt of credit support 3,816,558,422
Source: Investor Report

281
Europe Credit Research12 September 2011
Gareth Davies, CFA(44-20) [email protected]
Flavio Marco Rusconi(44-20) [email protected]
Coventry Building Society (‘Coventry’)
(BBG: COVBS)Snapshot
The Coventry Building Society (‘Coventry’) was formed in 1884, as a small localised financial institution in theEnglish midlands. Over time, and through a number of mergers, including the most recent with the Stroud & Swindon Building Society in 2010, the Coventry now sits as the UK’s third largest society with some £22bn of assets.
Coventry has been approved for issuance of Regulated Covered Bonds in the UK.
Financial performance
We set out below some of the key financial performance metrics:
Table 650: Key profit & loss figures, £mm
FY 2009 FY 2010Net interest income 125 146Provisions for loan losses n/a 0NII less provisions 125 146
Comm.& fee income 17 16Other operating income 1 0Non-interest expense 66 77Operating profit (loss) 77 85
PBT 56 101Taxes 13 16Net profit (loss) 44 85
Source: Bloomberg
Table 651: Key balance sheet figures, £mm
FY 2009 FY 2010
Loans 14,075 17,574 Total Assets 18,402 22,302 Short-term borrowings 2,018 1,333 Other ST borrowings n/a n/aLong-term borrowings 1,430 1,741 Equity 13,803 18,485
Source: Bloomberg
Table 652: Select financial metrics
FY 2007 FY 2008 FY 2009 FY 2010NIM n/a 0.8 ROA n/a 0.4 ROE n/a 0.5 ROC n/a 0.4 C:I 45.5 47.0 Core capital n/a n/a
Source: Bloomberg
Cover pool overview
We set out below some of the key cover pool characteristics:
Table 653: Select covered bond terms
Terms
Asset Coverage Test (ACT)<3m in arrears 0.753m+ true balance & LTV<75% 0.43m+ true balance & LTV>75% 0.25
Asset percentage 90.00%Max. subs assets 10.00%
Reps & warrantiesMin. current payments 2Min. margin 0.40%Max. balance 1,000,000Max. term (yr) 50BTL eligible? N/A
Source: J.P. Morgan Covered Bond Research, Offering Circulars
Table 654: Covered bond characteristics
As at July 2011
Ratings S/M/FCovered bond rating -/Aaa/AAA Issuer rating -/A3/A Fitch D:factor 15.7 Moody's TPI Probable
Cover pool Jul-11Total pool 3,418,853,341 Asset type:Mortgages 3,357,161,114 Substitution assets 1,012,112 Bonds outstanding 2,200,000,000
# mortgages 32,856 Avg loan balanceWA Indexed LTV 53.3 Indexed LTV>80% 0.2 Indexed LTV>90% - Indexed LTV>100% -
Asset seasoning (mths) 34.6
Current asset percentage n/a Amt of credit support 133,066,550
Source: Investor Report
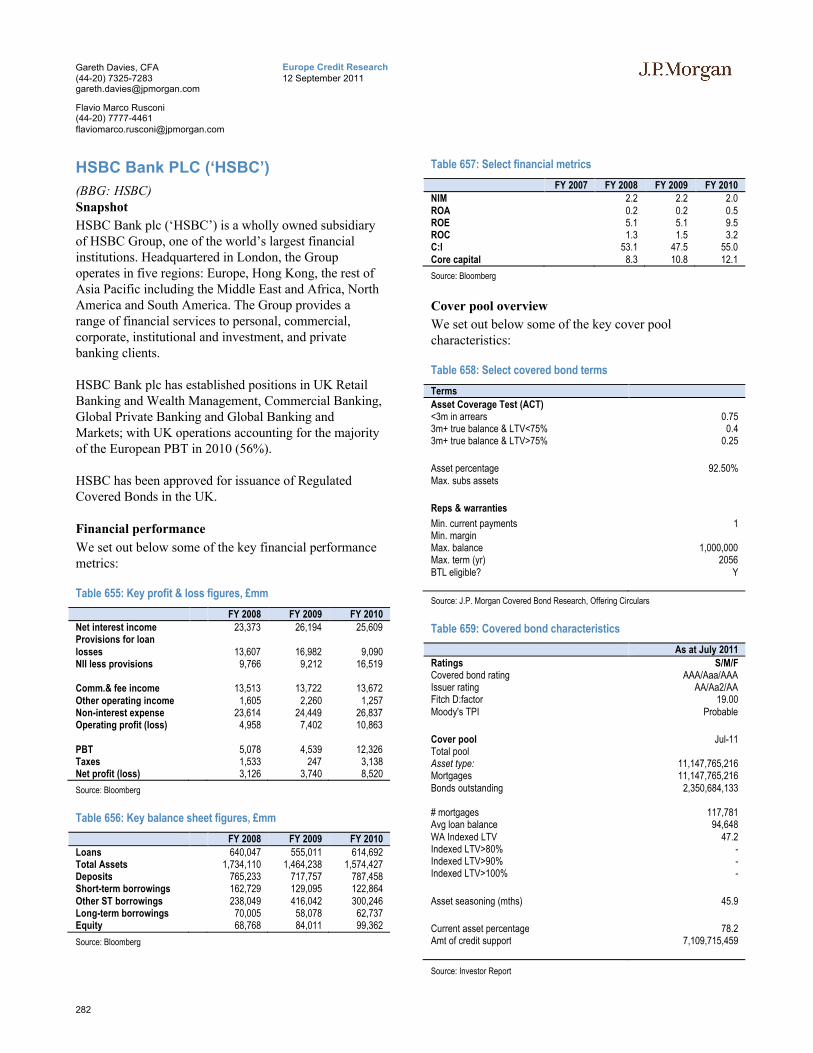
282
Europe Credit Research12 September 2011
Gareth Davies, CFA(44-20) [email protected]
Flavio Marco Rusconi(44-20) [email protected]
HSBC Bank PLC (‘HSBC’)
(BBG: HSBC)Snapshot
HSBC Bank plc (‘HSBC’) is a wholly owned subsidiary of HSBC Group, one of the world’s largest financial institutions. Headquartered in London, the Group operates in five regions: Europe, Hong Kong, the rest of Asia Pacific including the Middle East and Africa, North America and South America. The Group provides a range of financial services to personal, commercial, corporate, institutional and investment, and private banking clients.
HSBC Bank plc has established positions in UK Retail Banking and Wealth Management, Commercial Banking, Global Private Banking and Global Banking and Markets; with UK operations accounting for the majority of the European PBT in 2010 (56%).
HSBC has been approved for issuance of Regulated Covered Bonds in the UK.
Financial performance
We set out below some of the key financial performance metrics:
Table 655: Key profit & loss figures, £mm
FY 2008 FY 2009 FY 2010Net interest income 23,373 26,194 25,609Provisions for loan losses 13,607 16,982 9,090NII less provisions 9,766 9,212 16,519
Comm.& fee income 13,513 13,722 13,672Other operating income 1,605 2,260 1,257Non-interest expense 23,614 24,449 26,837Operating profit (loss) 4,958 7,402 10,863
PBT 5,078 4,539 12,326Taxes 1,533 247 3,138Net profit (loss) 3,126 3,740 8,520
Source: Bloomberg
Table 656: Key balance sheet figures, £mm
FY 2008 FY 2009 FY 2010
Loans 640,047 555,011 614,692 Total Assets 1,734,110 1,464,238 1,574,427 Deposits 765,233 717,757 787,458 Short-term borrowings 162,729 129,095 122,864 Other ST borrowings 238,049 416,042 300,246 Long-term borrowings 70,005 58,078 62,737 Equity 68,768 84,011 99,362
Source: Bloomberg
Table 657: Select financial metrics
FY 2007 FY 2008 FY 2009 FY 2010NIM 2.2 2.2 2.0 ROA 0.2 0.2 0.5 ROE 5.1 5.1 9.5 ROC 1.3 1.5 3.2 C:I 53.1 47.5 55.0 Core capital 8.3 10.8 12.1
Source: Bloomberg
Cover pool overview
We set out below some of the key cover pool characteristics:
Table 658: Select covered bond terms
Terms
Asset Coverage Test (ACT)<3m in arrears 0.753m+ true balance & LTV<75% 0.43m+ true balance & LTV>75% 0.25
Asset percentage 92.50%Max. subs assets
Reps & warranties
Min. current payments 1Min. marginMax. balance 1,000,000Max. term (yr) 2056BTL eligible? Y
Source: J.P. Morgan Covered Bond Research, Offering Circulars
Table 659: Covered bond characteristics
As at July 2011
Ratings S/M/FCovered bond rating AAA/Aaa/AAAIssuer rating AA/Aa2/AAFitch D:factor 19.00 Moody's TPI Probable
Cover pool Jul-11Total poolAsset type: 11,147,765,216 Mortgages 11,147,765,216 Bonds outstanding 2,350,684,133
# mortgages 117,781 Avg loan balance 94,648 WA Indexed LTV 47.2 Indexed LTV>80% - Indexed LTV>90% - Indexed LTV>100% -
Asset seasoning (mths) 45.9
Current asset percentage 78.2 Amt of credit support 7,109,715,459
Source: Investor Report

283
Europe Credit Research12 September 2011
Gareth Davies, CFA(44-20) [email protected]
Flavio Marco Rusconi(44-20) [email protected]
Leeds Building Society (‘Leeds’)
(BBG: LEED)Snapshot
The Leeds Building Society (‘Leeds’) was established in 1875, and has grown since to become the UK’s fifth largest building society by assets (£9.5bn of assets at the end of 2010, of which £6.5bn related to residential mortgages) with a branch network of 65 sites and some 684k customers. The society remains committed to its mutual status, being owned by its members.
Leeds has been approved for issuance of Regulated Covered Bonds in the UK.
Financial performance
We set out below some of the key financial performance metrics:
Table 660: Key profit & loss figures, £mm
FY 2008 FY 2009 FY 2010Net interest income 93 110 109Provisions for loan losses n/a 53 44NII less provisions 93 57 65
Comm.& fee income 20 19 19.7Other operating income 1 n/a 2Non-interest expense 46 42 41Operating profit (loss) 68 35 45
PBT 20 32 42Taxes 6 9 11Net profit (loss) 14 23 31
Source: Bloomberg
Table 661: Key balance sheet figures, £mm
FY 2008 FY 2009 FY 2010
Loans 7,479 7,334 7,314 Total Assets 10,137 9,545 9,503 Deposits 739 710 439 Short-term borrowings 689 539 483 Other ST borrowings 6,944 7,090 7,307 Long-term borrowings 1,285 715 761 Equity 461 478 505
Source: Bloomberg
Table 662: Select financial metrics
FY 2008 FY 2009 FY 2010
NIM n/a n/a n/aROA n/a 0.2 0.3 ROE n/a 4.8 6.3 ROC n/a 1.1 1.8 C:I 40.3 32.5 31.5 Core capital n/a n/a n/a
Source: Bloomberg
Cover pool overview
We set out below some of the key cover pool characteristics:
Table 663: Select covered bond terms
Terms
Asset Coverage Test (ACT)<3m in arrears 0.753m+ true balance & LTV<75% 0.43m+ true balance & LTV>75% 0.25
Asset percentage 93.50%Max. subs assets 15.00%
Reps & warrantiesMin. current payments 1Min. margin 0.15%Max. balance 1,000,000Max. term (yr) 50BTL eligible? Y (<15%)
Source: J.P. Morgan Covered Bond Research, Offering Circulars
Table 664: Covered bond characteristics
As at June 2011
Ratings S/M/FCovered bond rating -/Aaa/AAA Issuer rating -/A2/A Fitch D:factor 15.0 Moody's TPI Probable
Cover pool Jun-11Total pool 1,276,695,029 Asset type:Mortgages 1,276,695,029 Bonds outstanding 586,200,000
# mortgages 14,729 Avg loan balance 86,679 WA Indexed LTV 73.5 Indexed LTV>80% 44.8 Indexed LTV>90% 27.2 Indexed LTV>100% 12.0
Asset seasoning (mths) 51.1 BTL (%) 14.6
Current asset percentage 75.6 Amt of credit support n/a
Source: Investor Report

284
Europe Credit Research12 September 2011
Gareth Davies, CFA(44-20) [email protected]
Flavio Marco Rusconi(44-20) [email protected]
Lloyds Banking Group PLC (‘Lloyds’)
(BBG: LLOYDS)Snapshot
Following the acquisition of HBoS PLC, Lloyds TSB Group PLC was renamed Lloyds Banking Group PLC (‘LBG’), becoming at the same time the largest retail bank in the UK. Away from banking, LBG also owns Scottish Widows and Clerical Medical, which specialise in Pensions, Investments and Insurance. The Group is currently 41% owned by the UK government.
Bank of Scotland has two distributed covered bond programmes, one backed by residential mortgages (BoS Resi) and another backed by social housing (BoS SH) collateral. Lloyds TSB also has its own CB programme, backed by residential mortgages (L Resi).
LBG has been approved for issuance of Regulated Covered Bonds in the UK for the BoS Resi and L Resi programmes.
Financial performance
We set out below some of the key financial performance metrics:
Table 665: Key profit & loss figures, £mm
FY 2007 FY 2008 FY 2009 FY2010Net interest income 6,099 7,718 9,026 12,546Provisions for loan losses 1,796 3,012 16,673 10,952NII less provisions 4,303 4,706 -7,647 1,594
Comm.& fee income 3,224 3,231 4,254 4,415Other operating income -1,145 8,780 -7,680 -6,047Non-interest expense 6,167 15,957 13,670 12,774Operating profit (loss) 3,343 -8,407 -5,548 2,912
PBT 4,000 760 1,042 281Taxes 679 -38 -1,911 539Net profit (loss) 3,289 772 2,827 -320
Source: Bloomberg
Table 666: Key balance sheet figures, £mm
FY 2007 FY 2008 FY 2009 FY2010
Loans 209,814 240,344 626,969 592,597 Total Assets 353,346 436,033 1,027,255 991,574 Deposits 156,555 170,938 406,741 393,633 Short-term borrowings 74,948 125,040 188,108 148,907 Other ST borrowings 78,444 93,915 223,754 233,376 Long-term borrowings 27,673 34,440 162,573 166,554 Equity 12,425 9,699 44,107 46,902
Source: Bloomberg
Table 667: Select financial metrics
FY 2007 FY 2008 FY 2009 FY2010NIM 1.9 2.2 1.4 1.4 ROA 0.9 0.2 0.4 -0.0 ROE 28.2 7.2 10.7 -0.7 ROC 2.9 0.6 1.0 -0.1 C:I 52.0 154.7 52.2 44.4 Core capital 9.5 8.0 9.6 11.6
Source: Bloomberg
Cover pool overview
We set out below some of the key cover pool characteristics:
Table 668: Select covered bond terms
Terms BoS SH BoS Resi L Resi
Asset Coverage Test (ACT)<3m in arrears n/a 0.6 0.753m+ true balance & LTV<75% n/a 0.6 0.43m+ true balance & LTV>75% n/a 0.6 0.25
Asset percentage 100.00% 92.50% 93.00%Max. subs assets 25.00% 10.00% 10.00%
Reps & warranties
Min. current payments n/a 2 1Min. margin n/aMax. balance n/a 1,000,000 1,000,000Max. term (yr) n/a 50BTL eligible? n/a Y
Source: J.P. Morgan Covered Bond Research, Offering Circulars
Table 669: Covered bond characteristics
BoS SH BoS Resi L Resi
Ratings S/M/F S/M/F S/M/FCovered bond rating AAA/Aaa/AAA AAA/Aaa/AAA -/Aaa/AAAIssuer rating A/A1/AA- A/A1/AA- A/A1/AA-Fitch D:factor 6.90% 18.40% 14.10%Moody's TPI Probable-High Probable Probable
Cover pool Jun-11 Jun-11 Jun-11Total pool 4,114,150,227 45,709,111,804 18,829,517,368Asset type:Mortgages 3,411,989,120 39,243,270,568 14,641,547,552Cash 702,161,107 6,465,841,235 4,187,969,816Bonds outstanding 2,400,000,000 28,687,138,595 10,498,836,033
# mortgages 68 407,590 144,005Avg loan balance 50,176,311 96,281 101,674WA Indexed LTV n/a 71 59Indexed LTV>80% n/a 40 13Indexed LTV>90% n/a 24 2Indexed LTV>100% n/a 11 0Seasoning (mths) n/a 66 45Current asset % 86 70 80Amt of credit support 61,353,981 1,083,345,123 3,894,380,698
Source: Investor Report

285
Europe Credit Research12 September 2011
Gareth Davies, CFA(44-20) [email protected]
Flavio Marco Rusconi(44-20) [email protected]
Nationwide Building Society (‘Nationwide’)
(BBG: NWIDE)Snapshot
Nationwide Building Society (‘Nationwide’) is the world’s largest building society with assets of around £190bn, and is the UK’s third largest mortgage lender and savings provider. It operates 700 branches throughout the UK, with fifteen million members. Following an earlier merger with the Portman Building Society in 2007, Nationwide merged with two smaller societies since the start of the financial crisis (Derbyshire BS and Cheshire BS), as well as acquiring the assets and liabilities of the Dumfermline BS.
As a mutual organisation, Nationwide has no shareholders and is ultimately owned by its retail savings and residential mortgage customers. As such, bottom-line profitability is not the primary driver of activity, with some of the value generated by the business being given back to members through more competitive pricing.
Nationwide has been approved for issuance of Regulated Covered Bonds in the UK.
Financial performance
We set out below some of the key financial performance metrics:
Table 670: Key profit & loss figures, £mm
FY 2007 FY 2008 FY 2009 FY 2010Net interest income 1,502 1,821 1,774 1,715Provisions for loan losses 134 106 394 549NII less provisions 1,369 1,715 1,380 1,166
Comm.& fee income 335 334 359 378Other operating income 91 44 123 47Non-interest expense 1,149 1,284 1,631 1,248Operating profit (loss) 651 707 180 307
PBT 652 686 190 341Taxes 188 191 44 77Net profit (loss) 464 495 146 264
Source: Bloomberg
Table 671: Key balance sheet figures, £mm
FY 2007 FY 2008 FY 2009 FY 2010Loans 115,938 142,804 155,469 152,429Total Assets 137,379 179,027 202,353 191,397Deposits 86,795 113,816 128,292 120,943Short-term borrowings 27,395 37,204 40,003 30,656Other ST borrowings 3,373 1,940 6,947 5,619Long-term borrowings 12,716 18,403 21,877 27,461Equity 6,510 7,253 4,278 5,716
Source: Bloomberg
Table 672: Select financial metrics
FY 2007 FY 2008 FY 2009 FY 2010NIM 1.2 1.2 n/a n/aROA 0.4 0.3 0.1 0.1ROE 8.8 8.6 2.8 5.3ROC 1.0 0.9 0.2 0.4C:I 59.3 61.2 73.9 59.2Core capital 8.7 9.7 15.1 15.3
Source: Bloomberg
Cover pool overview
We set out below some of the key cover pool characteristics:
Table 673: Select covered bond terms
Terms
Asset Coverage Test (ACT)<3m in arrears 0.753m+ true balance & LTV<75% 0.43m+ true balance & LTV>75% 0.25
Asset percentage 93.00%Max. subs assets 10%
Reps & warrantiesMin. current payments 2Min. margin 0.15%Max. balance 1,000,000Max. term (yr) 50BTL eligible? Y
Source: J.P. Morgan Covered Bond Research, Offering Circulars
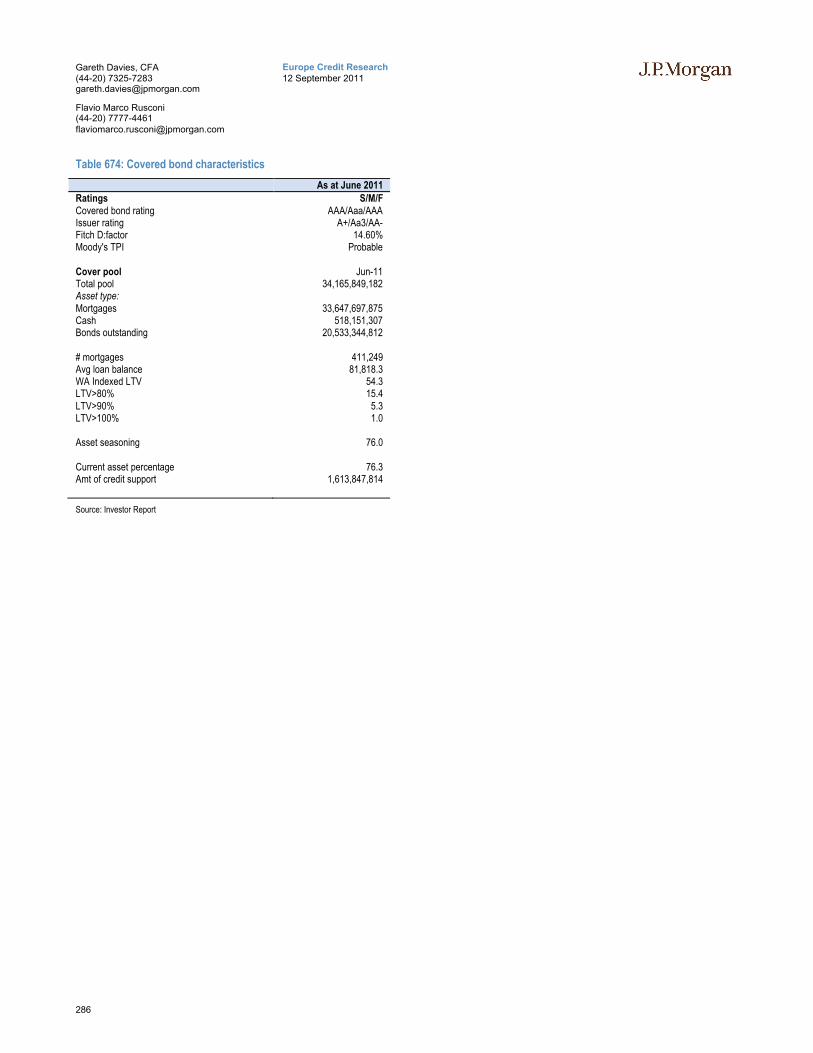
286
Europe Credit Research12 September 2011
Gareth Davies, CFA(44-20) [email protected]
Flavio Marco Rusconi(44-20) [email protected]
Table 674: Covered bond characteristics
As at June 2011Ratings S/M/FCovered bond rating AAA/Aaa/AAAIssuer rating A+/Aa3/AA-Fitch D:factor 14.60%Moody's TPI Probable
Cover pool Jun-11Total pool 34,165,849,182Asset type:Mortgages 33,647,697,875Cash 518,151,307Bonds outstanding 20,533,344,812
# mortgages 411,249 Avg loan balance 81,818.3 WA Indexed LTV 54.3 LTV>80% 15.4 LTV>90% 5.3 LTV>100% 1.0
Asset seasoning 76.0
Current asset percentage 76.3 Amt of credit support 1,613,847,814
Source: Investor Report
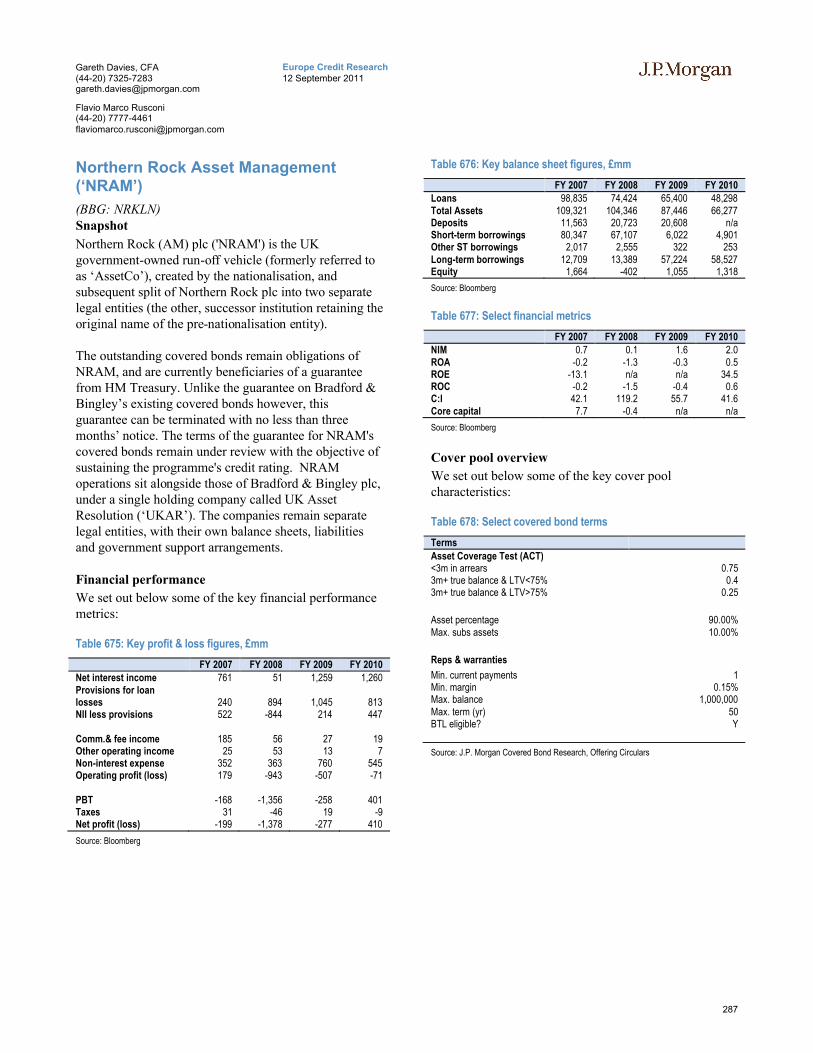
287
Europe Credit Research12 September 2011
Gareth Davies, CFA(44-20) [email protected]
Flavio Marco Rusconi(44-20) [email protected]
Northern Rock Asset Management (‘NRAM’)
(BBG: NRKLN)Snapshot
Northern Rock (AM) plc ('NRAM') is the UK government-owned run-off vehicle (formerly referred to as ‘AssetCo’), created by the nationalisation, and subsequent split of Northern Rock plc into two separate legal entities (the other, successor institution retaining the original name of the pre-nationalisation entity).
The outstanding covered bonds remain obligations of NRAM, and are currently beneficiaries of a guarantee from HM Treasury. Unlike the guarantee on Bradford & Bingley’s existing covered bonds however, this guarantee can be terminated with no less than three months’ notice. The terms of the guarantee for NRAM's covered bonds remain under review with the objective of sustaining the programme's credit rating. NRAM operations sit alongside those of Bradford & Bingley plc, under a single holding company called UK Asset Resolution (‘UKAR’). The companies remain separate legal entities, with their own balance sheets, liabilities and government support arrangements.
Financial performance
We set out below some of the key financial performance metrics:
Table 675: Key profit & loss figures, £mm
FY 2007 FY 2008 FY 2009 FY 2010Net interest income 761 51 1,259 1,260Provisions for loan losses 240 894 1,045 813NII less provisions 522 -844 214 447
Comm.& fee income 185 56 27 19Other operating income 25 53 13 7Non-interest expense 352 363 760 545Operating profit (loss) 179 -943 -507 -71
PBT -168 -1,356 -258 401Taxes 31 -46 19 -9Net profit (loss) -199 -1,378 -277 410
Source: Bloomberg
Table 676: Key balance sheet figures, £mm
FY 2007 FY 2008 FY 2009 FY 2010Loans 98,835 74,424 65,400 48,298Total Assets 109,321 104,346 87,446 66,277Deposits 11,563 20,723 20,608 n/aShort-term borrowings 80,347 67,107 6,022 4,901Other ST borrowings 2,017 2,555 322 253Long-term borrowings 12,709 13,389 57,224 58,527Equity 1,664 -402 1,055 1,318
Source: Bloomberg
Table 677: Select financial metrics
FY 2007 FY 2008 FY 2009 FY 2010NIM 0.7 0.1 1.6 2.0ROA -0.2 -1.3 -0.3 0.5ROE -13.1 n/a n/a 34.5ROC -0.2 -1.5 -0.4 0.6C:I 42.1 119.2 55.7 41.6Core capital 7.7 -0.4 n/a n/a
Source: Bloomberg
Cover pool overview
We set out below some of the key cover pool characteristics:
Table 678: Select covered bond terms
Terms
Asset Coverage Test (ACT)<3m in arrears 0.753m+ true balance & LTV<75% 0.43m+ true balance & LTV>75% 0.25
Asset percentage 90.00%Max. subs assets 10.00%
Reps & warranties
Min. current payments 1Min. margin 0.15%Max. balance 1,000,000Max. term (yr) 50BTL eligible? Y
Source: J.P. Morgan Covered Bond Research, Offering Circulars

288
Europe Credit Research12 September 2011
Gareth Davies, CFA(44-20) [email protected]
Flavio Marco Rusconi(44-20) [email protected]
Table 679: Covered bond characteristics
As at June 2011Ratings S/M/FCovered bond rating AAA/Aaa/AAAIssuer rating A/Aa3/A+Fitch D:factor 18.50%Moody's TPI Improbable
Cover pool Jun-11Total pool 18,916,703,298Asset type:Mortgages 11,006,708,489Cash 2,136,411,116Bonds outstanding 7,305,976,411
# mortgages 80,426 Avg loan balance 136,855WA Indexed LTV 95.2 LTV>80% 70.6 LTV>90% 24.9 LTV>100% 1.8
Asset seasoning 57.4
Current asset percentage 66.0 Amt of credit support 754,598,735
Source: Investor Report

289
Europe Credit Research12 September 2011
Gareth Davies, CFA(44-20) [email protected]
Flavio Marco Rusconi(44-20) [email protected]
Royal Bank of Scotland PLC (‘RBS’)
(BBG: RBS)Snapshot
Royal Bank of Scotland Group (‘RBS’) is one of Europe's largest financial groups. It is structured around six business lines: UK Personal which includes its retail, corporate and commercial banking and wealth management services; UK Corporate which serves UK corporate customers; RBS Insurance which includes the brands Direct Line, Churchill and Privilege; US Retail and Commercial Banking provided through the Group's Citizen Financial Group; European & Middle East Retail & Commercial Banking and its Global Banking & Markets division.
The Group remains majority owned by the UK government, with the ultimate goal of returning the institution to the private sector once restructuring is completed. RBS introduced its covered bond programme and issued its inaugural bond in 2010. RBS PLC has been approved for issuance of Regulated Covered Bonds in the UK.
Financial performance
We set out below some of the key financial performance metrics:
Table 680: Key profit & loss figures, £mm
FY 2008 FY 2009 FY 2010Net interest income 18,675 13,388 14,209Provisions for loan losses 8,072 13,899 9,256NII less provisions 10,603 -511 4,953
Comm.& fee income 9,831 8,738 8,193Other operating income 3,113 1,872 1,544Non-interest expense 23,881 19,844 20,429Operating profit (loss) -8,469 -5,822 -726
PBT -40,836 -2,647 -399Taxes -2,323 -429 634Net profit (loss) -23,710 -2,672 -1,001
Source: Annual Report
Table 681: Key balance sheet figures, £mm
FY 2008 FY 2009 FY 2010Loans 874,722 728,393 555,260Total Assets 2,401,652 1,696,486 1,453,576Deposits 581,369 545,849 428,599Short-term borrowings 403,162 295,840 214,208Other ST borrowings 225,849 97,962 368,335Long-term borrowings 120,659 113,518 97,268Equity 80,498 94,631 76,851
Source: Annual Report
Table 682: Select financial metrics
FY 2008 FY 2009 FY 2010NIM 1.4 1.1 1.4ROA -1.1 -0.2 -0.1ROE -43.4 -5.3 -1.5ROC -4.3 -0.3 -0.3C:I 101.9 67.9 68.1Core capital 10.0 14.1 12.9
Source: Bloomberg
Cover pool overview
We set out below some of the key cover pool characteristics:
Table 683: Select covered bond terms
Terms
Asset Coverage Test (ACT)<3m in arrears 75%>3m in arrears 40%
Asset percentage 90%Max. subs assets 15%
Reps & warranties
Min. current payments 1mMin. margin n/aMax. balance £2,600,000Max. term (yr) n/aBTL eligible? n/a<3m in arrears 75%
Source: J.P. Morgan Covered Bond Research, Offering Circulars

290
Europe Credit Research12 September 2011
Gareth Davies, CFA(44-20) [email protected]
Flavio Marco Rusconi(44-20) [email protected]
Table 684: Covered bond characteristics
As at July 2011Ratings S/M/FCovered bond rating -/Aaa/AAAIssuer rating A/A1/AA-Fitch D:factor 14.80%Moody's TPI Probable
Cover pool Jul-11Total pool 12,675,836,123Asset type:Mortgages 12,675,836,123Cash n/aBonds outstanding (€) 6,596,782,977
# mortgages 96,208 Avg loan balance 131,754WA Indexed LTV 64.1 Indexed LTV>80% 17.8 Indexed LTV>90% 4.1 Indexed LTV>100% 0.4 Asset seasoning 15.0
Current asset percentage 79.1 Amt of credit support 2,539,405,599
Source: Investor Report

291
Europe Credit Research12 September 2011
Gareth Davies, CFA(44-20) [email protected]
Flavio Marco Rusconi(44-20) [email protected]
Santander UK plc (‘Santander’)
(BBG: ABBEY)Snapshot
Santander UK (‘Santander’), is the umbrella name for the broader Santander Group’s UK operations, and includes the businesses of Abbey (since 2004), alongside its other UK brands, including Alliance & Leicester (full acquisition) and Bradford & Bingley (deposits & branches only) – both acquired during the financial crisis. In August 2010, Santander UK also agreed to purchase the parts of the banking businesses of RBS which are carried out through its RBS branches in England and Wales, as well as its NatWest branches in Scotland. Operating across 1,400 branches, the UK entity is organised into four main divisions: retail banking, corporate banking, global banking & markets and private banking.
Abbey National Treasury Services Plc (‘ANTS’) is a wholly owned subsidiary of Santander UK and is the issuing entity for its UKCB programme.
Santander has been approved for issuance of Regulated Covered Bonds in the UK.
Financial performance
We set out below some of the key financial performance metrics:
Table 685: Key profit & loss figures, £mm
FY 2007 FY 2008 FY 2009 FY 2010Net interest income 1,500 1,772 3,412 3,814Provisions for loan losses 344 348 842 712NII less provisions 1,156 1,424 2,570 3,102
Comm.& fee income 785 768 986 902Other operating income n/a n/a n/a n/aNon-interest expense 1,664 1,659 2,326 2,400Operating profit (loss) 864 1,094 1,690 2,125
PBT 864 1,094 1,690 2,125Taxes 179 275 445 542Net profit (loss) 685 811 1,190 1,583
Source: Bloomberg
Table 686: Key balance sheet figures, £mm
FY 2007 FY 2008 FY 2009 FY 2010Loans 112,147 180,176 186,804 195,132Total Assets 199,623 297,310 285,291 302,860Deposits 69,650 130,245 143,893 152,643Short-term borrowings 9,342 13,631 7,008 5,331Other ST borrowings 75,091 77,081 72,161 53,644Long-term borrowings 40,444 68,231 53,510 46,701Equity 3,442 6,697 7,222 12,274
Source: Bloomberg
Table 687: Select financial metrics
FY 2007 FY 2008 FY 2009 FY 2010NIM 0.8 0.9 1.5 1.9ROA 0.4 0.3 0.4 0.5ROE 21.2 17.4 19.1 16.5ROC 1.4 1.2 1.6 n/aC:I 56.6 52.0 46.1 41.0Core capital 5.4 6.2 6.8 11.5
Source: Bloomberg
Cover pool overview
We set out below some of the key cover pool characteristics:
Table 688: Select covered bond terms
Terms
Asset Coverage Test (ACT)<3m in arrears 0.753m+ true balance & LTV<75% 0.43m+ true balance & LTV>75% 0.25
Asset percentage 91.00%Max. subs assets 10.00%
Reps & warrantiesMin. current payments 1Min. margin 0.50%Max. balance 1,000,000Max. term (yr) 50BTL eligible? Y
Source: J.P. Morgan Covered Bond Research, Offering Circulars

292
Europe Credit Research12 September 2011
Gareth Davies, CFA(44-20) [email protected]
Flavio Marco Rusconi(44-20) [email protected]
Table 689: Covered bond characteristics
As at June 2011Ratings S/M/FCovered bond rating AAA/Aaa/AAAIssuer rating AA/Aa3/AA-Fitch D:factor 17.90%Moody's TPI Probable
Cover pool Jun-11Total pool 30,153,385,785Asset type:Mortgages 29,153,385,785Cash 1,000,000,000Bonds outstanding 19,953,700,113
# mortgagesAvg loan balance 112,575WA Indexed LTV 67.7 LTV>80% 19.1 LTV>90% 1.8 LTV>100% 0.2
Current asset percentage 76.7 Amt of credit support 992,101,675
Source: Investor Report

293
Europe Credit Research12 September 2011
Gareth Davies, CFA(44-20) [email protected]
Flavio Marco Rusconi(44-20) [email protected]
Yorkshire Building Society (‘Yorkshire’)
(BBG: YBS)Snapshot
Yorkshire Building Society (‘YBS’) is the UK’s second largest building society, and started in 1864. Following its recent merger (2010) with Chelsea BS, the institution has assets of over £30bn, with close to three million members and a branch network of more than 175 sites. YBS continues to be a mutual organisation owned by its depositors and mortgage borrowers.
YBS is currently in the process of merging with the Norwich & Peterborough BS, as well as acquiring the mortgage and savings businesses of Egg Banking PLC.
Yorkshire has been approved for issuance of Regulated Covered Bonds in the UK.
Financial performance
We set out below some of the key financial performance metrics:
Table 690: Key profit & loss figures, £mm
FY 2007 FY 2008 FY 2009 HY 2010Net interest income 188 165 148 112Provisions for loan losses n/a n/a 0 0NII less provisions 188 165 148 112
Comm.& fee income 34 32 34 19Other operating income 14 5 16 18Non-interest expense 170 157 141 84Operating profit (loss) 67 45 57 40
PBT 55 8 -13 65Taxes 15 -1 -9 12Net profit (loss) 39 9 -3 54
Source: Bloomberg
Table 691: Key balance sheet figures, £mm
FY 2007 FY 2008 FY 2009 HY 2010
Loans 15,362 16,292 14,979 23,221Total Assets 20,498 23,032 22,722 31,103Deposits 12,448 13,683 13,793 22,699Short-term borrowings 2,424 1,762 1,091 1,109Other ST borrowings 160 748 553 779Long-term borrowings 4,468 5,848 6,363 4,952Equity 954 909 900 1,282
Source: Bloomberg
Table 692: Select financial metrics
FY 2007 FY 2008 FY 2009 HY 2010NIM n/a n/a n/aROA 0.2 0.0 0.0ROE 4.2 0.9 -0.4ROC 0.6 0.1 0.0C:I 71.0 77.1 70.1Core capital n/a n/a n/a
Source: Bloomberg
Cover pool overview
We set out below some of the key cover pool characteristics:
Table 693: Select covered bond terms
Terms
Asset Coverage Test (ACT)<3m in arrears 0.753m+ true balance & LTV<75% 0.43m+ true balance & LTV>75% 0.25
Asset percentage 93.50%Max. subs assets 10.00%
Reps & warrantiesMin. current payments 2Min. margin 0.75Max. balance 1,000,000Max. term (yr) 50BTL eligible? N
Source: J.P. Morgan Covered Bond Research, Offering Circulars
Table 694: Covered bond characteristics
As at June 2011Ratings S/M/FCovered bond rating -/Aa1/AAAIssuer rating A-/Baa1/A-Fitch D:factor 14.00%Moody's TPI Probable
Cover pool Jun-11Total pool 7,322,724,781Asset type:Mortgages 4,634,187,816Cash 2,688,536,965Bonds outstanding 2,259,840,000
# mortgages 46,441 Avg loan balance 99,787WA Indexed LTV 62.3 Indexed LTV>80% 24.7 Indexed LTV>90% 12.5 Indexed LTV>100% 5.4
Asset seasoning 56.9
Current asset percentage 72.9 Amt of credit support 952,869,207
Source: Investor Report

294
Europe Credit Research12 September 2011
Gareth Davies, CFA(44-20) [email protected]
Flavio Marco Rusconi(44-20) [email protected]

295
Europe Credit Research12 September 2011
Gareth Davies, CFA(44-20) [email protected]
Flavio Marco Rusconi(44-20) [email protected]
US
Co
ve
red
Bo
nd

296
Europe Credit Research12 September 2011
Gareth Davies, CFA(44-20) [email protected]
Flavio Marco Rusconi(44-20) [email protected]
US Covered Bonds
Legislative snapshot
We set out in Table 695 a snapshot of key covered bond attributes in the USA.
Table 695: US Covered Bond legislative overview
Attribute CommentaryFrameworkLegislative Framework There is currently no special covered bond legislation. The current two covered bond programmes are
governed by the contractual law, together with a number of other US Federal regulations including SEC Rule 144a and FDIA Reg S.
Types of covered bonds n/aStructure of Issuer Direct issuance? Two tier approach, whereby the bonds are issued by an SPV. The sponsor bank issues $-denominated
floating rate mortgage bonds backed by loans that remain on the bank's balance sheet. The SPV’s sole purpose is to purchase these bonds using the funds from the issuance of covered bonds.
Comments (if any) A covered bond legislative framework is being discussed by Congress. The main issue remains the role of the FDIC in case of default and whether this may reduce the claim of covered bonds holders on the assets.
Bankruptcy remoteness If the sponsor bank defaults, substitution ceases. Following default of the SPV, the bonds can be declared immediately due and payable and the covered bond collateral can be liquidated to repay the covered bonds.
Dual claim YesBond format Fixed, bullet. Supervision Current issuers are regulated by the Office of the Comptroller of the Currency, part of the US Department of
Treasury.Cover poolEligible assets Mortgage Current issuers allow inclusions of first and second lien loans and home equity lines (JPM).
LTV caps n/aPublic Sector n/aNon-performing collateral n/aSubstitution Assets Substitute collateral in the form of cash, debt guaranteed by 0% risk weight entities, exposure to 10%/20%
risk weight entities and AAA-rated $-denominated RMBS is allowed. Hedging Derivatives are allowed to manage mismatches. Valuation The value of the properties is that estimated by the sponsor bank adjusted by the Office of Federal Housing
Enterprise Oversight HPI; falls in this index are fully passed on to the valuation but only 85% of the increases is considered. Only the first 75% of the property value is used in the ACT.
Other comments (if any)
Requirements
ALM matching Asset coverage The individual programmes have ACTs that ensure that the asset percentage remains below 96% for BA and 93% for JPM. A proceeds compliance test is also carried out to establish if the amounts credited to the bond and the outstanding principal amount of each underlying mortgage bond is greater than outstanding CB amounts.
Interest coverage n/aOther (if any)
Consequence of breach If after breach of coverage test no new collateral is added to ensure that ACT is passed, then there is an issuer EoD.
Monitoring Trustee/cover pool monitor.OtherCompliance with EU legislation Non UCITS and Non CRD compliant
Source: National legislation, J.P. Morgan Covered Bond Research

297
Europe Credit Research12 September 2011
Gareth Davies, CFA(44-20) [email protected]
Flavio Marco Rusconi(44-20) [email protected]
US covered bond & macro backdrop
Figure 171: Mortgage CB Issuance, €mm
Source: J.P. Morgan Covered Bond Research
Figure 172: Mortgage CB outstanding, €mm
Source: J.P. Morgan Covered Bond Research
Figure 173: USA real GDP growth, y-on-y, %
Source: Bloomberg
Figure 174: USA unemployment level, %
Source: Bloomberg
Figure 175: USA CPI and base rate, %
Source: Bloomberg
Figure 176: USA consumer confidence index, #
Source: Bloomberg
Figure 177: USA house price growth, %
Source: OECD
Figure 178: USA existing home sales (mm), and housing starts index (RHS), 000s
Source: Bloomberg
0
2,000
4,000
6,000
8,000
10,000
2003 2004 2005 2006 2007 2008 2009
0
2,000
4,000
6,000
8,000
10,000
12,000
14,000
2003 2004 2005 2006 2007 2008 2009
-6
-4
-2
0
2
4
6
Mar
-00
Mar
-01
Mar
-02
Mar
-03
Mar
-04
Mar
-05
Mar
-06
Mar
-07
Mar
-08
Mar
-09
Mar
-10
Mar
-11
Real GDP growth
0
2
4
6
8
10
12
Mar
-00
Mar
-01
Mar
-02
Mar
-03
Mar
-04
Mar
-05
Mar
-06
Mar
-07
Mar
-08
Mar
-09
Mar
-10
Mar
-11
Unemployment
-2-101234567
Mar
-03
Sep
-03
Mar
-04
Sep
-04
Mar
-05
Sep
-05
Mar
-06
Sep
-06
Mar
-07
Sep
-07
Mar
-08
Sep
-08
Mar
-09
Sep
-09
Mar
-10
Sep
-10
Mar
-11
Inflation Base rate
0
20
40
60
80
100
120
140
Mar
-00
Mar
-01
Mar
-02
Mar
-03
Mar
-04
Mar
-05
Mar
-06
Mar
-07
Mar
-08
Mar
-09
Mar
-10
Mar
-11
Cons. Confidence
-8%-6%-4%-2%0%2%4%6%8%
10%12%14%
Mar
-01
Mar
-02
Mar
-03
Mar
-04
Mar
-05
Mar
-06
Mar
-07
Mar
-08
Mar
-09
Mar
-10
Mar
-11
House price growth
0
200
400
600
800
1000
1200
1400
1600
0
1
2
3
4
5
6
7
8
Jan-
00
Jan-
01
Jan-
02
Jan-
03
Jan-
04
Jan-
05
Jan-
06
Jan-
07
Jan-
08
Jan-
09
Jan-
10
Jan-
11
Existing home sales New home sales (RHS)

298
Europe Credit Research12 September 2011
Gareth Davies, CFA(44-20) [email protected]
Flavio Marco Rusconi(44-20) [email protected]
Bank of America
(BBG: BAC)Snapshot
Bank of America is one of the leading global financial institutions and the largest American bank by assets, since its acquisition of both Countrywide Financial and Merrill Lynch in 2008.
Through its banking and non-banking subsidiaries in over 40 countries, BAC operates along six distinct business lines: Deposits, Global Card Services, through which it offers traditional retail banking services to 57 million customers in the domestic US market. Home Loans & Insurance products are sold in the USA through a network of over 5,900 branches, independent mortgage loan officers and a sales force offering online and telephone access. Global Commercial Banking provides a range of lending related products and services, integrated working capital management and treasury solutions to middle market companies, commercial real estate firms and governments.
Global Banking & Markets offers financial products, advisory services, financing, securities clearing, settlement and custody services globally to its institutional investor clients in support of their investing and trading activities. The bank also provides debt and equity underwriting and distribution capabilities, merger-related and other advisory services, and risk management products. Global Wealth & Investment Management focuses on wealthy individuals and offers tailored financial solutions.
Financial performance
We set out below some of the key financial performance metrics:
Table 696: Key profit & loss figures, $mm
FY 2008 FY 2009 FY 2010Net interest income 45,360 47,109 51,523Provisions for loan losses 26,825 48,570 28,435NII less provisions 18,535 -1,461 23,088
Comm.& fee income 36,785 48,412 39440Other operating income -5,115 -14 2,384Non-interest expense 40,594 61,530 68,888Operating profit 5,363 12,379 13,864
PBT 4,428 4,360 -1,323Taxes 420 -1,916 915Net profit (loss) 4,008 6,276 -2,238
Source: Bloomberg
Table 697: Key balance sheet figures, $mm
FY 2008 FY 2009 FY 2010Real Estate Loans 485,228 475,556 458,455 Commercial Loans 359,913 344,220 324,455 Consumer Loans 571,533 555,908 615,985 Loans 908,375 862,928 898,555Total Assets 1,817,943 2,230,232 2,264,909Deposits 882,997 991,611 1,010,430Short-term borrowings 464,823 489,285 466,557Other short-term borrowings 30,709 178,515 200,494Long-term borrowings 225,410 339,377 359,180Equity 177,052 231,444 228,248
Source: Bloomberg
Table 698: Select financial metrics
FY 2008 FY 2009 FY 2010NIM 3.2 3.1 3.1ROA 0.1 -0.1 -0.2ROE 1.8 -1.3 -1.8ROC 0.5 0.7 -0.2C:I 54.9 49.7 61.3Core Capital 9.2 10.4 11.2
Source: Bloomberg
Cover pool overview
We set out below some of the key cover pool characteristics:
Table 699: Covered bond characteristics
As at March 2011
Ratings S/M/FCovered Bond rating AA/Aa2/AAAIssuer rating (Bank of America Corp) A/A2/A+
Cover poolCover pool size ($) 9,733,000,000Outstanding liabilities (in $) 7,342,000,000Nominal asset percentage (in %) 75.4Supporting asset percentage (in %) 78
Number of loans 14,130.0 Average loan balance ($) 688,836 WA seasoning (mths) 46.0 Highest geographic exposure (in %) California - 41.1
Source: Fitch Ratings
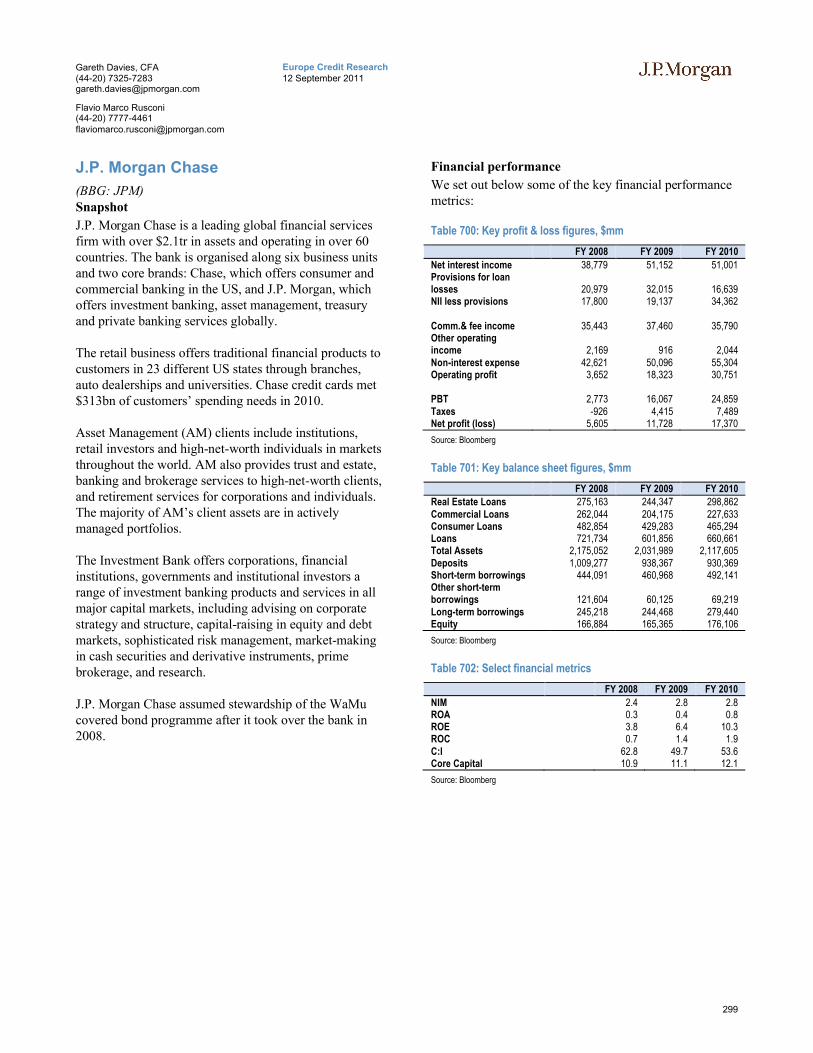
299
Europe Credit Research12 September 2011
Gareth Davies, CFA(44-20) [email protected]
Flavio Marco Rusconi(44-20) [email protected]
J.P. Morgan Chase
(BBG: JPM)Snapshot
J.P. Morgan Chase is a leading global financial services firm with over $2.1tr in assets and operating in over 60 countries. The bank is organised along six business units and two core brands: Chase, which offers consumer and commercial banking in the US, and J.P. Morgan, which offers investment banking, asset management, treasury and private banking services globally.
The retail business offers traditional financial products to customers in 23 different US states through branches, auto dealerships and universities. Chase credit cards met $313bn of customers’ spending needs in 2010.
Asset Management (AM) clients include institutions, retail investors and high-net-worth individuals in markets throughout the world. AM also provides trust and estate, banking and brokerage services to high-net-worth clients, and retirement services for corporations and individuals. The majority of AM’s client assets are in actively managed portfolios.
The Investment Bank offers corporations, financial institutions, governments and institutional investors a range of investment banking products and services in all major capital markets, including advising on corporate strategy and structure, capital-raising in equity and debt markets, sophisticated risk management, market-making in cash securities and derivative instruments, prime brokerage, and research.
J.P. Morgan Chase assumed stewardship of the WaMu covered bond programme after it took over the bank in 2008.
Financial performance
We set out below some of the key financial performance metrics:
Table 700: Key profit & loss figures, $mm
FY 2008 FY 2009 FY 2010
Net interest income 38,779 51,152 51,001Provisions for loan losses 20,979 32,015 16,639NII less provisions 17,800 19,137 34,362
Comm.& fee income 35,443 37,460 35,790Other operating income 2,169 916 2,044Non-interest expense 42,621 50,096 55,304Operating profit 3,652 18,323 30,751
PBT 2,773 16,067 24,859Taxes -926 4,415 7,489Net profit (loss) 5,605 11,728 17,370
Source: Bloomberg
Table 701: Key balance sheet figures, $mm
FY 2008 FY 2009 FY 2010Real Estate Loans 275,163 244,347 298,862 Commercial Loans 262,044 204,175 227,633 Consumer Loans 482,854 429,283 465,294 Loans 721,734 601,856 660,661 Total Assets 2,175,052 2,031,989 2,117,605 Deposits 1,009,277 938,367 930,369 Short-term borrowings 444,091 460,968 492,141 Other short-term borrowings 121,604 60,125 69,219 Long-term borrowings 245,218 244,468 279,440 Equity 166,884 165,365 176,106
Source: Bloomberg
Table 702: Select financial metrics
FY 2008 FY 2009 FY 2010
NIM 2.4 2.8 2.8ROA 0.3 0.4 0.8ROE 3.8 6.4 10.3ROC 0.7 1.4 1.9C:I 62.8 49.7 53.6Core Capital 10.9 11.1 12.1
Source: Bloomberg

300
Europe Credit Research12 September 2011
Gareth Davies, CFA(44-20) [email protected]
Flavio Marco Rusconi(44-20) [email protected]
Cover pool overview
We set out below some of the key cover pool characteristics:
Table 703: Covered bond characteristics
As at Jul 2011
Ratings S/M/FCovered Bond rating AA/-/AAIssuer rating (J.P. Morgan Chase Bank NA) AA-/Aa1/AA-
Cover poolCover pool size ($) 11,625,581,494Outstanding liabilities (in $) 7,784,300,000Excess credit support by asset coverage test (in %) 0.3Excess credit support by total loan balance (in %) 49.4
WA seasoning (mths) 73 WA LTV (in %) 64.8 Highest geographic exposure (in %) California - 53.1 Interest only loans (in %) 60.2 Primary residence (in %) 80.3 Single family residential property (in %) 87.3 Full documentation (in %) 32.0 WA FICO score 734.0
Loan purpose distribution (in %)Purchase 32.8 Construction 2.7 Improvement 0.5 Cash out refi 36.8 Non-cash out refi 27.2
FICO Score breakdown (in %)<600 2.2 600-700 25.7 700-800 58.7 >=800 13.5
Current LTV breakdown (in %)<=50 17.4 50.01-60 17.0 60.01-65 11.3 65.01-70 12.6 70.01-75 13.8 75.01-80 16.6 >80 11.4
Source: Investor report

301
Europe Credit Research12 September 2011
Gareth Davies, CFA(44-20) [email protected]
Flavio Marco Rusconi(44-20) [email protected]

302
Europe Credit Research12 September 2011
Gareth Davies, CFA(44-20) [email protected]
Flavio Marco Rusconi(44-20) [email protected]
Analyst Certification: The research analyst(s) denoted by an “AC” on the cover of this report certifies (or, where multiple research analysts are primarily responsible for this report, the research analyst denoted by an “AC” on the cover or within the document individually certifies, with respect to each security or issuer that the research analyst covers in this research) that: (1) all of the views expressed in this report accurately reflect his or her personal views about any and all of the subject securities or issuers; and (2) no part of any of the research analyst's compensation was, is, or will be directly or indirectly related to the specific recommendations or views expressed by the research analyst(s) in this report.
Important Disclosures
Explanation of Credit Research Ratings:Ratings System: J.P. Morgan uses the following sector/issuer portfolio weightings: Overweight (over the next three months, the recommended risk position is expected to outperform the relevant index, sector, or benchmark), Neutral (over the next three months, the recommended risk position is expected to perform in line with the relevant index, sector, or benchmark), and Underweight (over the next three months, the recommended risk position is expected to underperform the relevant index, sector, or benchmark). J.P. Morgan'sEmerging Market research uses a rating of Marketweight, which is equivalent to a Neutral rating.
Valuation & Methodology: In J.P. Morgan's credit research, we assign a rating to each issuer (Overweight, Underweight or Neutral) based on our credit view of the issuer and the relative value of its securities, taking into account the ratings assigned to the issuer by credit rating agencies and the market prices for the issuer's securities. Our credit view of an issuer is based upon our opinion as to whether the issuer will be able service its debt obligations when they become due and payable. We assess this by analyzing, among other things, the issuer's credit position using standard credit ratios such as cash flow to debt and fixed charge coverage (including and excluding capital investment). We also analyze the issuer's ability to generate cash flow by reviewing standard operational measures for comparable companies in the sector, such as revenue and earnings growth rates, margins, and the composition of the issuer's balance sheet relative to the operational leverage in its business.
J.P. Morgan Credit Research Ratings Distribution, as of June 30, 2011
Overweight Neutral UnderweightEMEA Credit Research Universe 30% 49% 21%
IB clients* 53% 63% 49%
Represents Ratings on the most liquid bond or 5-year CDS for all companies under coverage.*Percentage of investment banking clients in each rating category.
Analysts' Compensation: The research analysts responsible for the preparation of this report receive compensation based upon various factors, including the quality and accuracy of research, client feedback, competitive factors, and overall firm revenues, which include revenues from, among other business units, Institutional Equities, Fixed Income, and Investment Banking.
Other Disclosures
J.P. Morgan ("JPM") is the global brand name for J.P. Morgan Securities LLC ("JPMS") and its affiliates worldwide. J.P. Morgan Cazenove is a marketing name for the U.K. investment banking businesses and EMEA cash equities and equity research businesses of JPMorgan Chase & Co. and its subsidiaries. QIB Only
Options related research: If the information contained herein regards options related research, such information is available only to persons who have received the proper option risk disclosure documents. For a copy of the Option Clearing Corporation's Characteristics and Risks of Standardized Options, please contact your J.P. Morgan Representative or visit the OCC's website at http://www.optionsclearing.com/publications/risks/riskstoc.pdf
Legal Entities Disclosures U.S.: JPMS is a member of NYSE, FINRA,SIPC and the NFA. JPMorgan Chase Bank, N.A. is a member of FDIC and is authorized and regulated in the UK by the Financial Services Authority. U.K.: J.P. Morgan Securities Ltd. (JPMSL) is a member of the London Stock Exchange and is authorized and regulated by the Financial Services Authority. Registered in England & Wales No. 2711006. Registered Office 125 London Wall, London EC2Y 5AJ. South Africa: J.P. Morgan Equities Limited is a member of the Johannesburg Securities Exchange and is regulated by the FSB. Hong Kong: J.P. Morgan Securities (Asia Pacific) Limited (CE number AAJ321) is regulated by the Hong Kong Monetary Authority and the Securities and Futures Commission in Hong Kong. Korea: J.P. Morgan Securities (Far East) Ltd, Seoul Branch, is regulated by the Korea Financial Supervisory Service. Australia: J.P. Morgan Australia Limited (ABN 52 002 888 011/AFS Licence No: 238188) is regulated by ASIC and J.P. Morgan Securities Australia Limited (ABN 61 003 245 234/AFS Licence No: 238066) is a Market Participant with the ASX and regulated by ASIC. Taiwan: J.P.Morgan Securities (Taiwan) Limited is a participant of the Taiwan Stock Exchange (company-type) and regulated by the Taiwan Securities and Futures Bureau. India: J.P. Morgan India Private Limited, having its registered office at J.P. Morgan Tower, Off. C.S.T. Road, Kalina, Santacruz East, Mumbai - 400098, is a member of the National Stock Exchange of India Limited (SEBI Registration Number - INB 230675231/INF 230675231/INE 230675231) and Bombay Stock Exchange Limited (SEBI Registration Number - INB 010675237/INF 010675237) and is regulated by Securities and Exchange Board of India. Thailand: JPMorgan Securities (Thailand) Limited is a member of the Stock Exchange of Thailand and is regulated by the Ministry of Finance and the Securities and Exchange

303
Europe Credit Research12 September 2011
Gareth Davies, CFA(44-20) [email protected]
Flavio Marco Rusconi(44-20) [email protected]
Commission. Indonesia: PT J.P. Morgan Securities Indonesia is a member of the Indonesia Stock Exchange and is regulated by the BAPEPAM LK. Philippines: J.P. Morgan Securities Philippines Inc. is a member of the Philippine Stock Exchange and is regulated by the Securities and Exchange Commission. Brazil: Banco J.P. Morgan S.A. is regulated by the Comissao de Valores Mobiliarios (CVM) and by the Central Bank of Brazil. Mexico: J.P. Morgan Casa de Bolsa, S.A. de C.V., J.P. Morgan Grupo Financiero is a member of the Mexican Stock Exchange and authorized to act as a broker dealer by the National Banking and Securities Exchange Commission. Singapore: This material is issued and distributed in Singapore by J.P. Morgan Securities Singapore Private Limited (JPMSS) [MICA (P) 025/01/2011 and Co. Reg. No.: 199405335R] which is a member of the Singapore Exchange Securities Trading Limited and is regulated by the Monetary Authority of Singapore (MAS) and/or JPMorgan Chase Bank, N.A., Singapore branch (JPMCB Singapore) which is regulated by the MAS. Malaysia: This material is issued and distributed in Malaysia by JPMorgan Securities (Malaysia) Sdn Bhd (18146-X) which is a Participating Organization of Bursa Malaysia Berhad and a holder of Capital Markets Services License issued by the Securities Commission in Malaysia. Pakistan: J. P. Morgan Pakistan Broking (Pvt.) Ltd is a member of the Karachi Stock Exchange and regulated by the Securities and Exchange Commission of Pakistan. Saudi Arabia: J.P. Morgan Saudi Arabia Ltd. is authorized by the Capital Market Authority of the Kingdom of Saudi Arabia (CMA) to carry out dealing as an agent, arranging, advising and custody, with respect to securities business under licence number 35-07079 and its registered address is at 8th Floor, Al-Faisaliyah Tower, King Fahad Road, P.O. Box 51907, Riyadh 11553, Kingdom of Saudi Arabia. Dubai: JPMorgan Chase Bank, N.A., Dubai Branch is regulated by the Dubai Financial Services Authority (DFSA) and its registered address is Dubai International Financial Centre - Building 3, Level 7, PO Box 506551, Dubai, UAE.
Country and Region Specific Disclosures U.K. and European Economic Area (EEA): Unless specified to the contrary, issued and approved for distribution in the U.K. and the EEA by JPMSL. Investment research issued by JPMSL has been prepared in accordance with JPMSL's policies for managing conflicts of interest arising as a result of publication and distribution of investment research. Many European regulators require a firm to establish, implement and maintain such a policy. This report has been issued in the U.K. only to persons of a kind described in Article 19 (5), 38, 47 and 49 of the Financial Services and Markets Act 2000 (Financial Promotion) Order 2005 (all such persons being referred to as "relevant persons"). This document must not be acted on or relied on by persons who are not relevant persons. Any investment or investment activity to which this document relates is only available to relevant persons and will be engaged in only with relevant persons. In other EEA countries, the report has been issued to persons regarded as professional investors (or equivalent) in their home jurisdiction. Australia: This material is issued and distributed by JPMSAL in Australia to "wholesale clients" only. JPMSAL does not issue or distribute this material to "retail clients". The recipient of this material must not distribute it to any third party or outside Australia without the prior written consent of JPMSAL. For the purposes of this paragraph the terms "wholesale client" and "retail client" have the meanings given to them in section 761G of the Corporations Act 2001. Germany: This material is distributed in Germany by J.P. Morgan Securities Ltd., Frankfurt Branch and J.P.Morgan Chase Bank, N.A., Frankfurt Branch which are regulated by the Bundesanstalt für Finanzdienstleistungsaufsicht. Hong Kong: The 1% ownership disclosure as of the previous month end satisfies the requirements under Paragraph 16.5(a) of the Hong Kong Code of Conduct for Persons Licensed by or Registered with the Securities and Futures Commission. (For research published within the first ten days of the month, the disclosure may be based on the month end data from two months prior.) J.P. Morgan Broking (Hong Kong) Limited is the liquidity provider/market maker for derivative warrants, callable bull bear contracts and stock options listed on the Stock Exchange of Hong Kong Limited. An updated list can be found on HKEx website: http://www.hkex.com.hk. Japan: There is a risk that a loss may occur due to a change in the price of the shares in the case of share trading, and that a loss may occur due to the exchange rate in the case of foreign share trading. In the case of share trading, JPMorgan Securities Japan Co., Ltd., will be receiving a brokerage fee and consumption tax (shouhizei) calculated by multiplying the executed price by the commission rate which was individually agreed between JPMorgan Securities Japan Co., Ltd., and the customer in advance. Financial Instruments Firms: JPMorgan Securities Japan Co., Ltd., Kanto Local Finance Bureau (kinsho) No. 82 Participating Association / Japan Securities Dealers Association, The Financial Futures Association of Japan. Korea: This report may have been edited or contributed to from time to time by affiliates of J.P. Morgan Securities (Far East) Ltd, Seoul Branch. Singapore: JPMSS and/or its affiliates may have a holding in any of the securities discussed in this report; for securities where the holding is 1% or greater, the specific holding is disclosed in the Important Disclosures section above. India: For private circulation only, not for sale. Pakistan: For private circulation only, not for sale. New Zealand: This material is issued and distributed by JPMSAL in New Zealand only to persons whose principal business is the investment of money or who, in the course of and for the purposes of their business, habitually invest money. JPMSAL does not issue or distribute this material to members of "the public" as determined in accordance with section 3 of the Securities Act 1978. The recipient of this material must not distribute it to any third party or outside New Zealand without the prior written consent of JPMSAL. Canada: The information contained herein is not, and under no circumstances is to be construed as, a prospectus, an advertisement, a public offering, an offer to sell securities described herein, or solicitation of an offer to buy securities described herein, in Canada or any province or territory thereof. Any offer or sale of the securities described herein in Canada will be made only under an exemption from the requirements to file a prospectus with the relevant Canadian securities regulators and only by a dealer properly registered under applicable securities laws or, alternatively, pursuant to an exemption from the dealer registration requirement in the relevant province or territory of Canada in which such offer or sale is made. The information contained herein is under no circumstances to be construed as investment advice in any province or territory of Canada and is not tailored to the needs of the recipient. To the extent that the information contained herein references securities of an issuer incorporated, formed or created under the laws of Canada or a province or territory of Canada, any trades in such securities must be conducted through a dealer registered in Canada. No securities commission or similar regulatory authority in Canada has reviewed or in any way passed judgment upon these materials, the information contained herein or the merits of the securities described herein, and any representation to the contrary is an offence. Dubai: This report has been issued to persons regarded as professional clients as defined under the DFSA rules.
General: Additional information is available upon request. Information has been obtained from sources believed to be reliable but JPMorgan Chase & Co. or its affiliates and/or subsidiaries (collectively J.P. Morgan) do not warrant its completeness or accuracy except with respect to any disclosures relative to JPMS and/or its affiliates and the analyst's involvement with the issuer that is the subject of the research. All pricing is as of the close of market for the securities discussed, unless otherwise stated. Opinions and estimates constitute our judgment as of the date of this material and are subject to change without notice. Past performance is not indicative of future results. This material is not intended as an offer or solicitation for the purchase or sale of any financial instrument. The opinions and recommendations herein do not take into account individual client circumstances, objectives, or needs and are not intended as recommendations of particular securities, financial instruments or strategies to particular clients. The recipient of this report must make its own independent decisions regarding any securities or financial instruments mentioned herein. JPMS distributes in the U.S. research published by non-U.S. affiliates and accepts responsibility for its contents. Periodic updates may be provided on companies/industries based on company specific developments or announcements, market conditions or any other publicly available information. Clients should contact analysts and execute transactions through a J.P. Morgan subsidiary or affiliate in their home jurisdiction unless governing law permits otherwise.

304
Europe Credit Research12 September 2011
Gareth Davies, CFA(44-20) [email protected]
Flavio Marco Rusconi(44-20) [email protected]
"Other Disclosures" last revised June 13, 2011.
Copyright 2011 JPMorgan Chase & Co. All rights reserved. This report or any portion hereof may not be reprinted, sold or redistributed without the written consent of J.P. Morgan. #$J&098$#*P