jp m j.p. morgan aviation, transportation & defense conference, march … · j.p. morgan...
TRANSCRIPT

J P M
1J.P. Morgan Aviation, Transportation & Defense Conference 2011
J.P. Morgan Aviation, Transportation & Defense Conference, March 2011
TODAY’S AGENDA
Presentation of DS NORDEN (DNORD)
Company profile
R fRecent performance
Fleet values
Market expectations p
Full year financial guidance
Q & A
J.P. Morgan Aviation, Transportation & Defense Conference 2011 2
SNAPSHOT OF 140 YEARS’ OF HISTORY
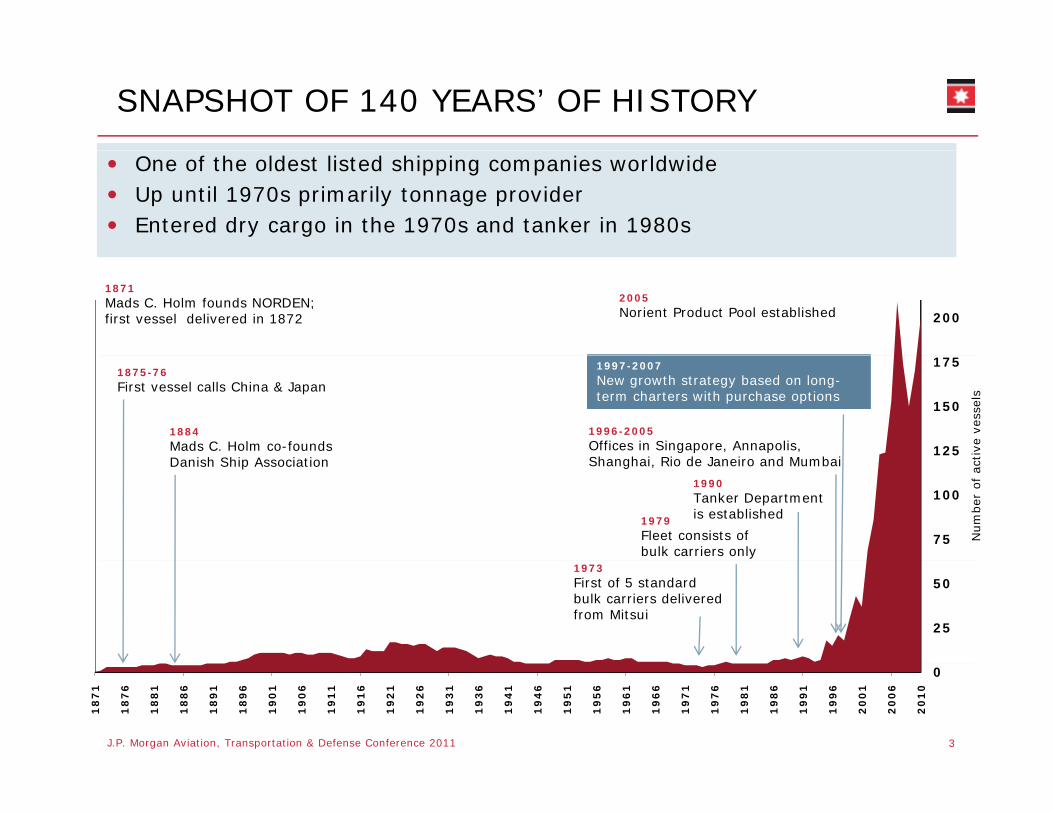
One of the oldest listed shipping companies worldwideUp until 1970s primarily tonnage providerEntered dry cargo in the 1970s and tanker in 1980s
200
1871Mads C. Holm founds NORDEN; first vessel delivered in 1872
2005Norient Product Pool established
125
150
175
tive
vess
els
1875-76First vessel calls China & Japan
1884Mads C. Holm co-foundsD i h Shi A i ti
1996-2005Offices in Singapore, Annapolis, Sh h i Ri d J i d M b i
1997-2007New growth strategy based on long-term charters with purchase options
75
100
Num
ber
of ac
t
1990Tanker Department is established
Danish Ship Association Shanghai, Rio de Janeiro and Mumbai
1979Fleet consists of bulk carriers only
25
501973First of 5 standard bulk carriers deliveredfrom Mitsui
3J.P. Morgan Aviation, Transportation & Defense Conference 2011
0
18
71
18
76
18
81
18
86
18
91
18
96
19
01
19
06
19
11
19
16
19
21
19
26
19
31
19
36
19
41
19
46
19
51
19
56
19
61
19
66
19
71
19
76
19
81
19
86
19
91
19
96
20
01
20
06
20
10
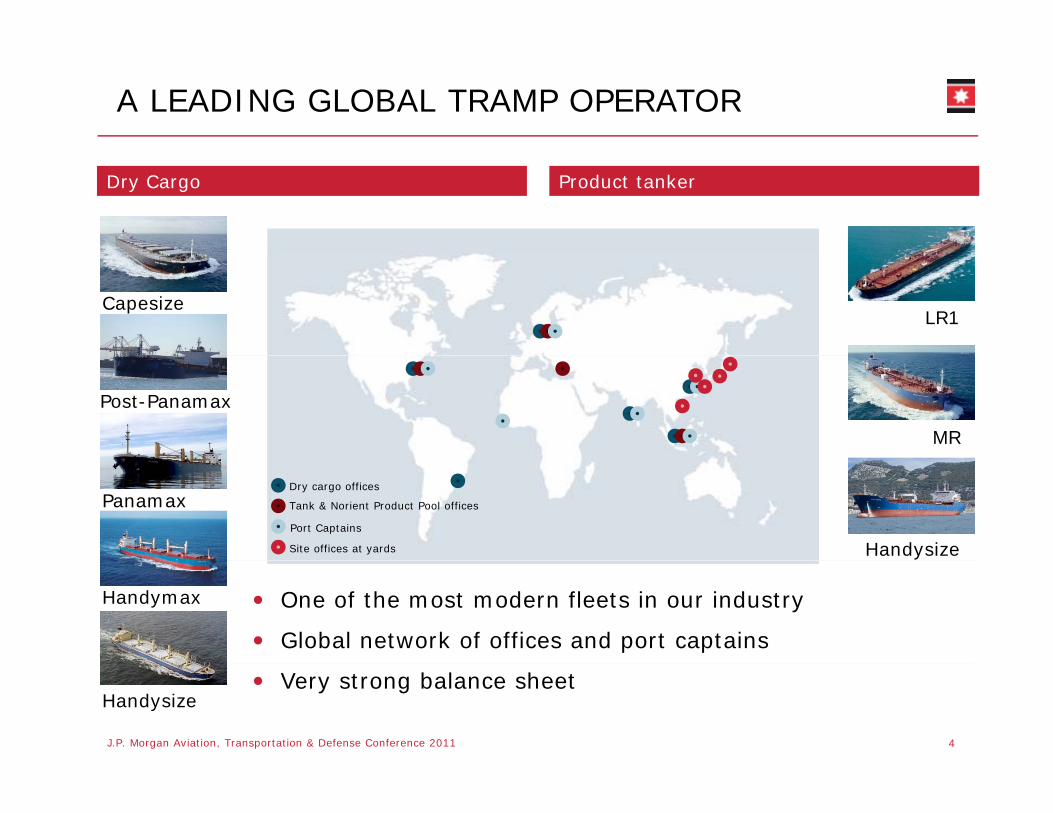
A LEADING GLOBAL TRAMP OPERATOR
Product tanker Dry Cargo
CapesizeLR1
Post-Panamax
MR
Panamax
Handysize
Dry cargo offices
Tank & Norient Product Pool offices
Port Captains
Site offices at yards
One of the most modern fleets in our industry
Global network of offices and port captains
Handymax
4J.P. Morgan Aviation, Transportation & Defense Conference 2011
Very strong balance sheetHandysize
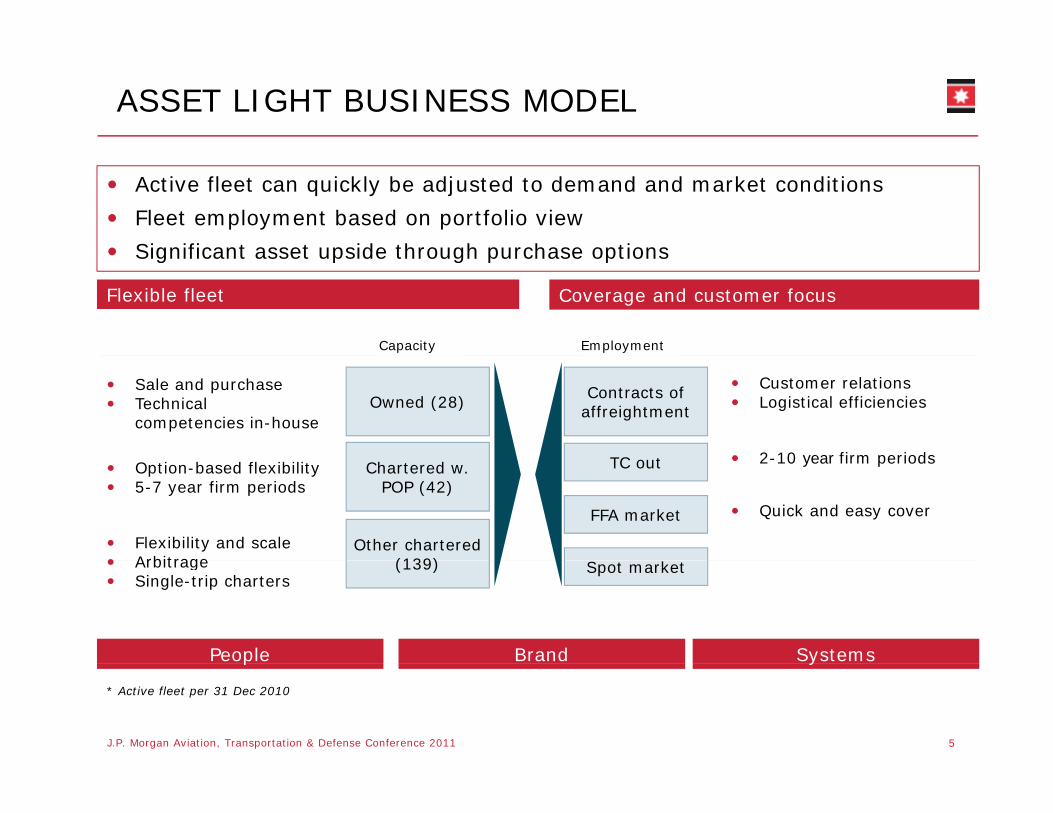
ASSET LIGHT BUSINESS MODEL
Active fleet can quickly be adjusted to demand and market conditions
Fleet employment based on portfolio view
Significant asset upside through purchase options
Coverage and customer focusFlexible fleet
Capacity Employment
Significant asset upside through purchase options
Sale and purchase Technical competencies in-house
Owned (28) Contracts of affreightment
TC t
Customer relationsLogistical efficiencies
2-10 year firm periodsChartered w.
POP (42)
Other chartered (139)
Option-based flexibility5-7 year firm periods
Flexibility and scaleArbitrage
TC out
FFA market
2-10 year firm periods
Quick and easy cover
People Brand Systems
(139)ArbitrageSingle-trip charters
Spot market
5J.P. Morgan Aviation, Transportation & Defense Conference 2011
p y
* Active fleet per 31 Dec 2010
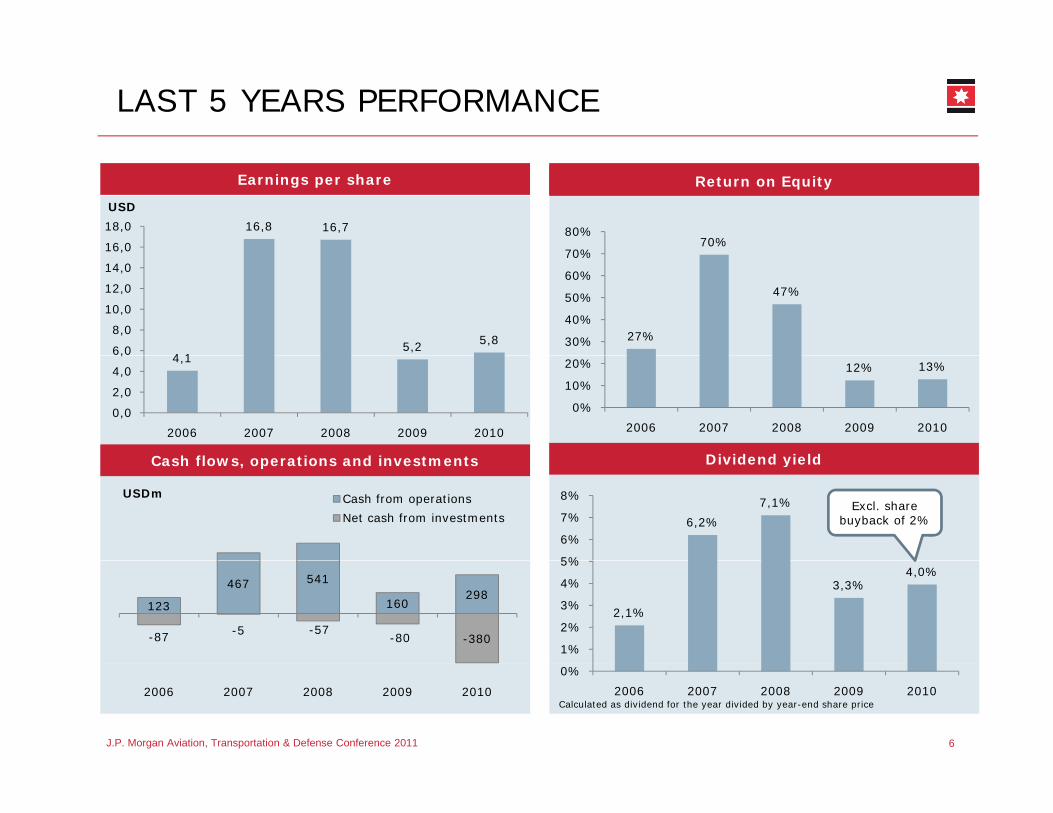
LAST 5 YEARS PERFORMANCE
Earnings per share Profit from vessel sales: USD 70mReturn on Equity
16,8 16,7
16,0
18,0
USD
70%70%
80%
4 15,2 5,8
6,0
8,0
10,0
12,0
14,0
,
27%
47%
30%
40%
50%
60%
70%
Cash flows operations and investments Dividend yield
4,1
0,0
2,0
4,0
,
2006 2007 2008 2009 2010
12% 13%
0%
10%
20%
2006 2007 2008 2009 2010
Cash flows, operations and investments Dividend yield
6,2%
7,1%
5%
6%
7%
8%Excl. share
buyback of 2%
USDm Cash from operations
Net cash from investments
2,1%
3,3%4,0%
1%
2%
3%
4%
5%
-87 -5 -57-80 -380
123
467 541
160298
J.P. Morgan Aviation, Transportation & Defense Conference 2011 6
Calculated as dividend for the year divided by year-end share price
0%
2006 2007 2008 2009 20102006 2007 2008 2009 2010

Financial strength = future profitable growth opportunities
Strong capital structure Gearing
Strong focus on cash flow generation
Cash in low-risk deposit accounts and iti
Net committed cash
USDm 2010 2009
Adjusted Net Interest Bearing 542 679securities
New-building orderbook fully covered by available cash
USD 58m bank debt; all but 4 ships paid cash
Adjusted Net Interest Bearing Assets* 542 679
T/C obligations** -1,925 -2,199
New building installments less proceeds from vessel sales** -329 -456
Gearing
cash
Equity ratio at 89%
Low gearing of book equity - gearing 0.2
Revenue from coverage** 1,377 1,203
Net commitments -335 -773
* Adjusted for prepayments on vessel sales and currency swaps. ** Present values
Cash and cash equivalents Gearing Cash and cash equivalents
623
829735
613
USDm
1,2
1,4
1,6
1,8
315 318
0,2
0,4
0,6
0,8
1,0
7J.P. Morgan Aviation, Transportation & Defense Conference 2011
2005 2006 2007 2008 2009 20100,0
2005 2006 2007 2008 2009 2010 2011
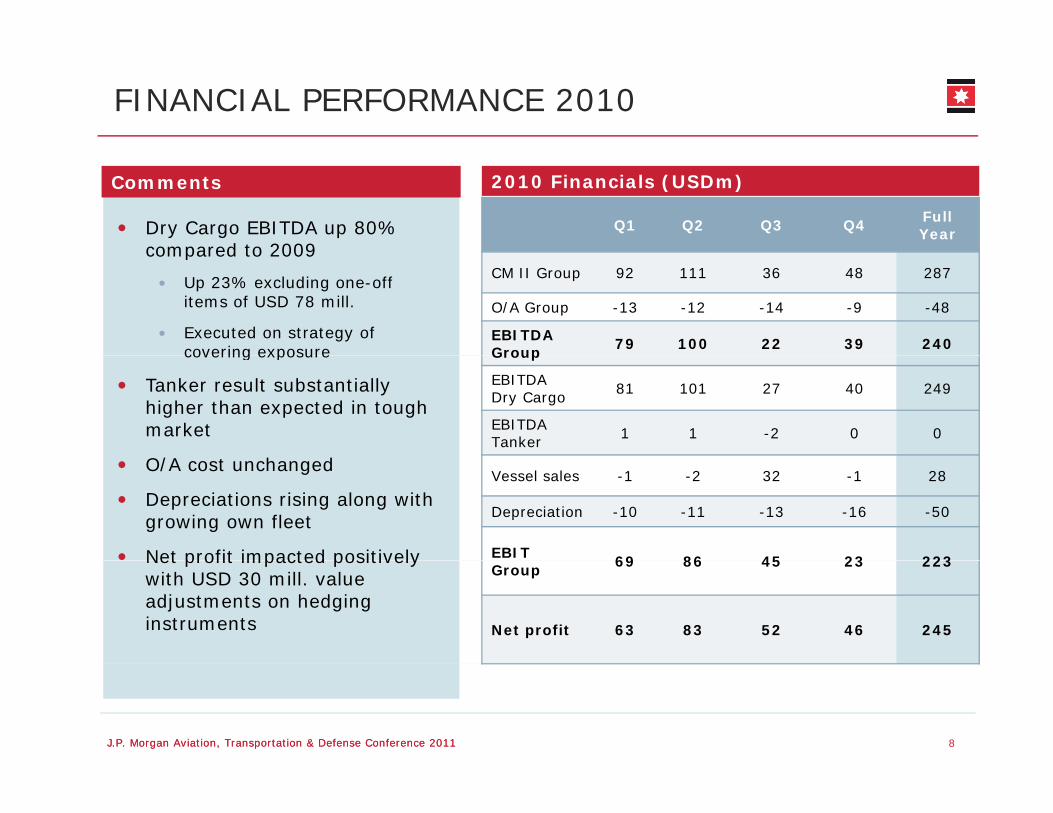
FINANCIAL PERFORMANCE 2010
Dry Cargo EBITDA up 80% compared to 2009
2010 Financials (USDm)
Q1 Q2 Q3 Q4 Full Year
Comments
compared to 2009
Up 23% excluding one-off items of USD 78 mill.
Executed on strategy of covering exposure
CM II Group 92 111 36 48 287
O/A Group -13 -12 -14 -9 -48
EBITDAGroup 79 100 22 39 240covering exposure
Tanker result substantially higher than expected in tough market
O/A t h d
Group
EBITDADry Cargo 81 101 27 40 249
EBITDATanker 1 1 -2 0 0
O/A cost unchanged
Depreciations rising along with growing own fleet
Net profit impacted positively
Vessel sales -1 -2 32 -1 28
Depreciation -10 -11 -13 -16 -50
EBIT 69 86 45 23 223Net profit impacted positively with USD 30 mill. value adjustments on hedging instruments
Group 69 86 45 23 223
Net profit 63 83 52 46 245
8J.P. Morgan Aviation, Transportation & Defense Conference 2011J.P. Morgan Aviation, Transportation & Defense Conference 2011
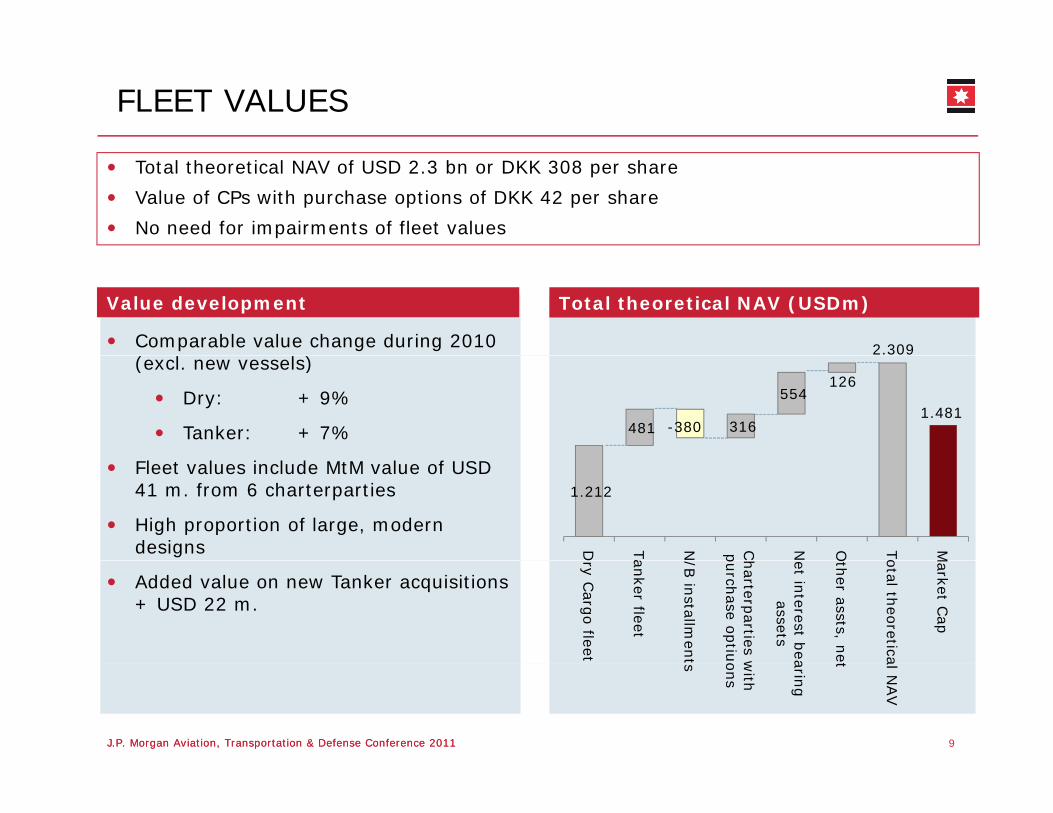
FLEET VALUES
Total theoretical NAV of USD 2.3 bn or DKK 308 per share
Value of CPs with purchase options of DKK 42 per share
No need for impairments of fleet values
Total theoretical NAV (USDm)Value development
2.309 Comparable value change during 2010 ( l l )
481 -380 316
554 126
1.481
(excl. new vessels)
Dry: + 9%
Tanker: + 7%
1.212
D Ta
N Cp N O To
M
Fleet values include MtM value of USD 41 m. from 6 charterparties
High proportion of large, modern designs D
ry Carg
o fleet
anker fleet
/B in
stallmen
t
harterp
arties wpurch
ase optiu
et interest b
eaassets
Oth
er assts, ne
otal th
eoretica
Market C
ap
Added value on new Tanker acquisitions + USD 22 m.
9J.P. Morgan Aviation, Transportation & Defense Conference 2011J.P. Morgan Aviation, Transportation & Defense Conference 2011
ts with
ons
aring
t al NAV
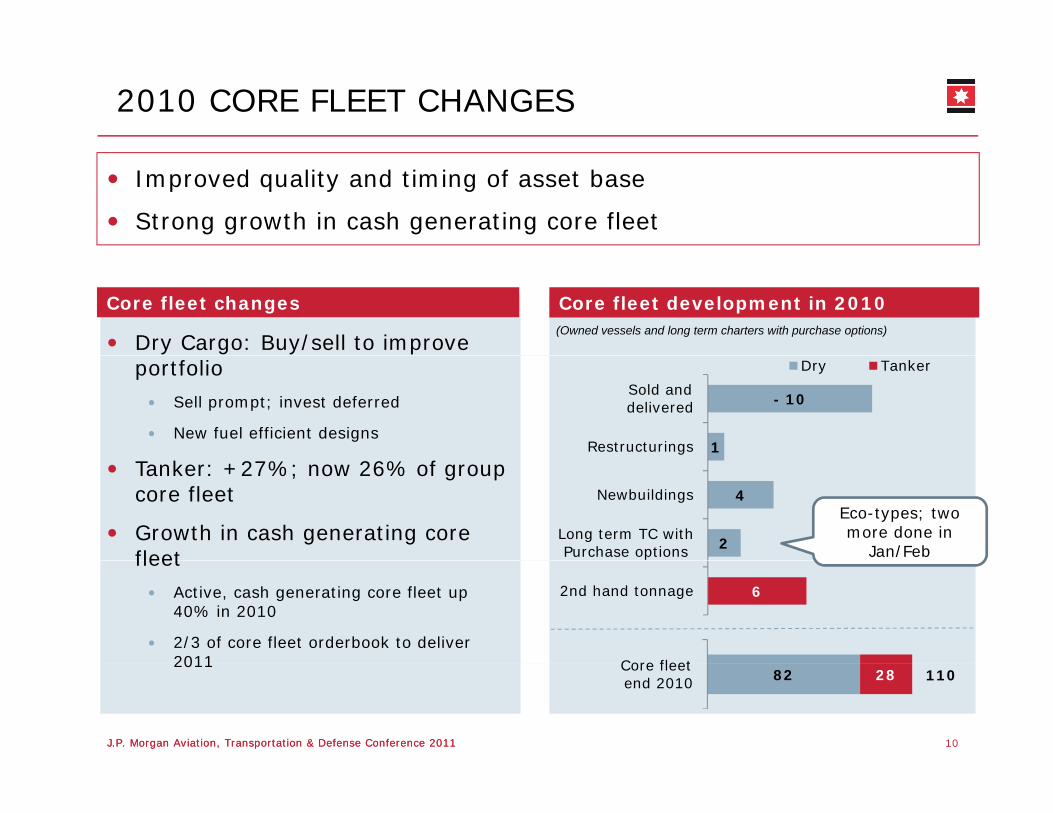
2010 CORE FLEET CHANGES
Improved quality and timing of asset base
Strong growth in cash generating core fleet
Core fleet development in 2010Core fleet changes(Owned vessels and long term charters with purchase options)
Dry Cargo: Buy/sell to improve
1
- 10
Restructurings
Sold and delivered
Dry TankerportfolioSell prompt; invest deferred
New fuel efficient designs
2
4
Long term TC with Purchase options
Newbuildings
Tanker: +27%; now 26% of group core fleet
Growth in cash generating core fleet
Eco-types; two more done in
Jan/Feb
62nd hand tonnage
Core fleet
fleetActive, cash generating core fleet up 40% in 2010
2/3 of core fleet orderbook to deliver 2011
10J.P. Morgan Aviation, Transportation & Defense Conference 2011J.P. Morgan Aviation, Transportation & Defense Conference 2011
82 28Core fleetend 2010 110
2011
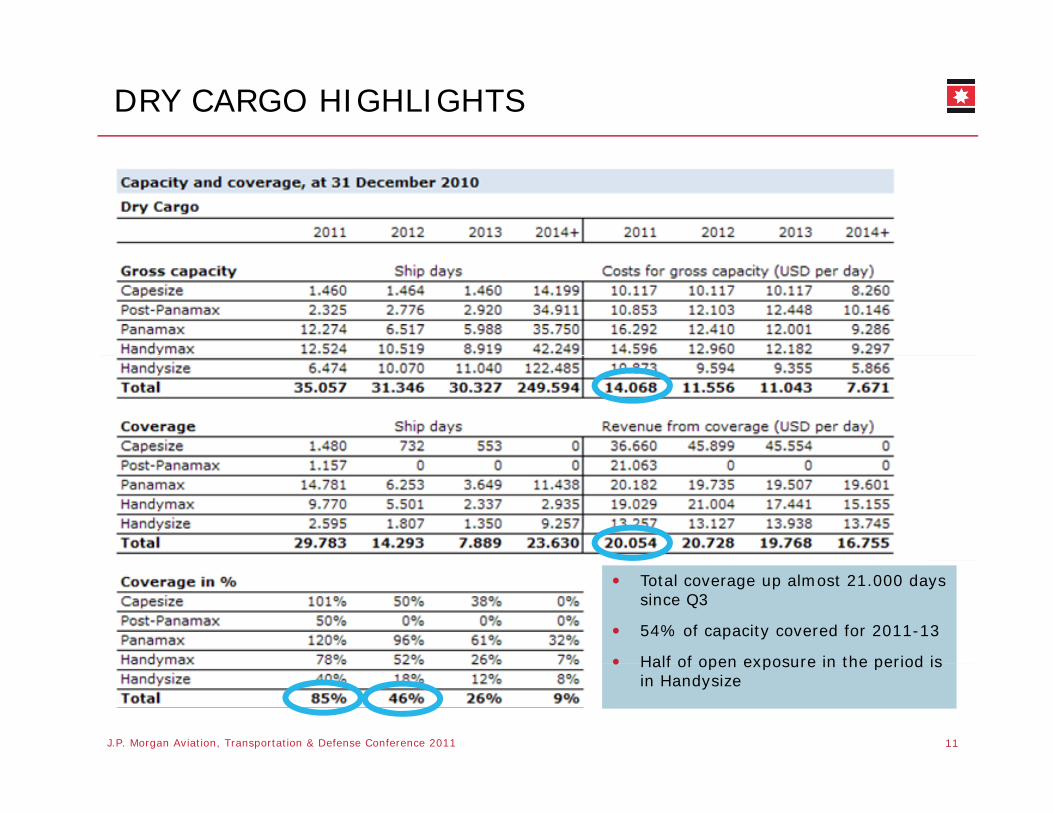
DRY CARGO HIGHLIGHTS
Total coverage up almost 21.000 days since Q3
54% of capacity covered for 2011-13
Half of open exposure in the period is
11J.P. Morgan Aviation, Transportation & Defense Conference 2011
Half of open exposure in the period is in Handysize
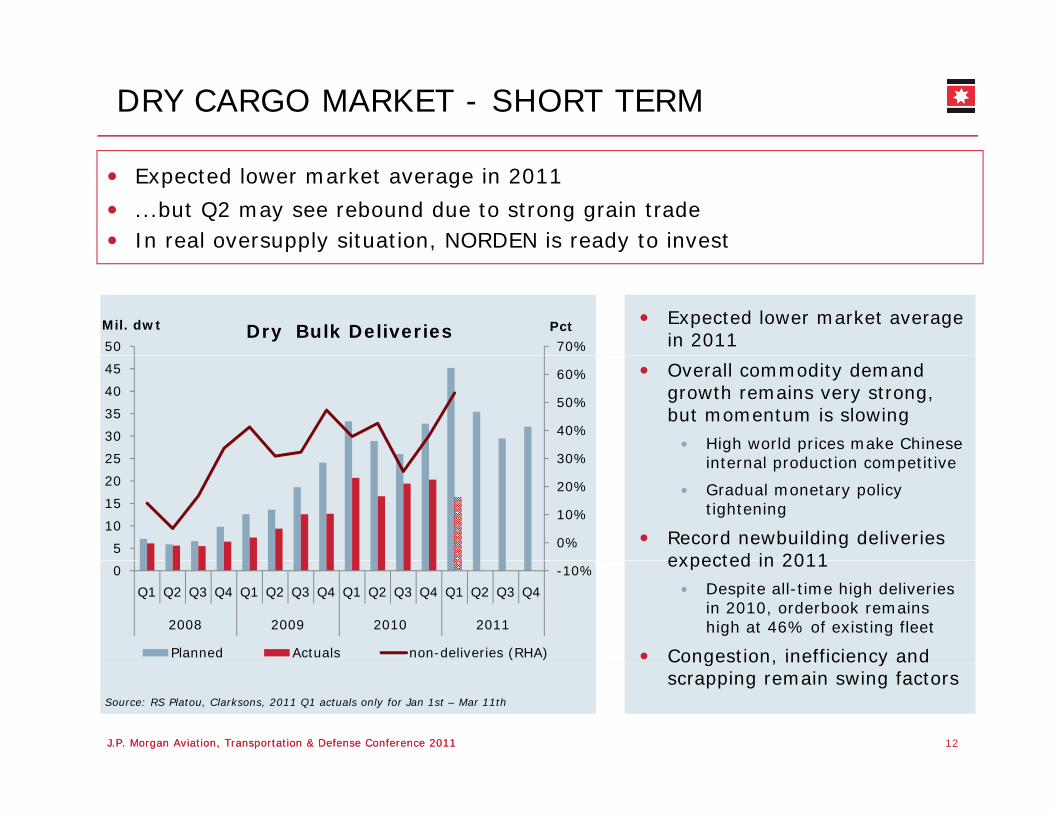
DRY CARGO MARKET - SHORT TERM
Expected lower market average in 2011
...but Q2 may see rebound due to strong grain tradeIn real oversupply situation, NORDEN is ready to invest
Expected lower market average in 201170%50
PctMil. dwt Dry Bulk Deliveries
Overall commodity demand growth remains very strong, but momentum is slowing
High world prices make Chinese i t l d ti titi30%
40%
50%
60%
25
30
35
40
45
internal production competitive
Gradual monetary policy tightening
Record newbuilding deliveries expected in 2011
0%
10%
20%
30%
5
10
15
20
25
expected in 2011Despite all-time high deliveries in 2010, orderbook remains high at 46% of existing fleet
Congestion, inefficiency and
-10%0
Q1 Q2 Q3 Q4 Q1 Q2 Q3 Q4 Q1 Q2 Q3 Q4 Q1 Q2 Q3 Q4
2008 2009 2010 2011
Planned Actuals non-deliveries (RHA)
12J.P. Morgan Aviation, Transportation & Defense Conference 2011J.P. Morgan Aviation, Transportation & Defense Conference 2011
Source: RS Platou, Clarksons, 2011 Q1 actuals only for Jan 1st – Mar 11th
g , yscrapping remain swing factors

DRY CARGO MARKET – LONG TERM
Continued high commodity prices expected to support investments in capacity expansionsBrazilian exports will have major impact on market
2011-13Planned iron ore export capacity expansions (mtpa)
2013 Large miners’ iron ore capacites (mtpa, % increase over 2010)
35
Monthly Chinese iron imports by source
Brazil Australia India+39%
20
25
30
per
mo
nth
46
7772
94
72
2
449
+67% +25%
5
10
15
e,
millio
n t
on
s p
26
112
14
2011 2012 2013
256 271
75
BHP RIO Vale FMG
+88%-
5
Jan-0
4
Jul-
04
Jan-0
5
Jul-
05
Jan-0
6
Jul-
06
Jan-0
7
Jul-
07
Jan-0
8
Jul-
08
Jan-0
9
Jul-
09
Jan-1
0
Jul-
10
Jan-1
1Iro
n o
re
13J.P. Morgan Aviation, Transportation & Defense Conference 2011J.P. Morgan Aviation, Transportation & Defense Conference 2011
Sources: China Customs, World Steel Dynamics
India Australia South Africa Brazil
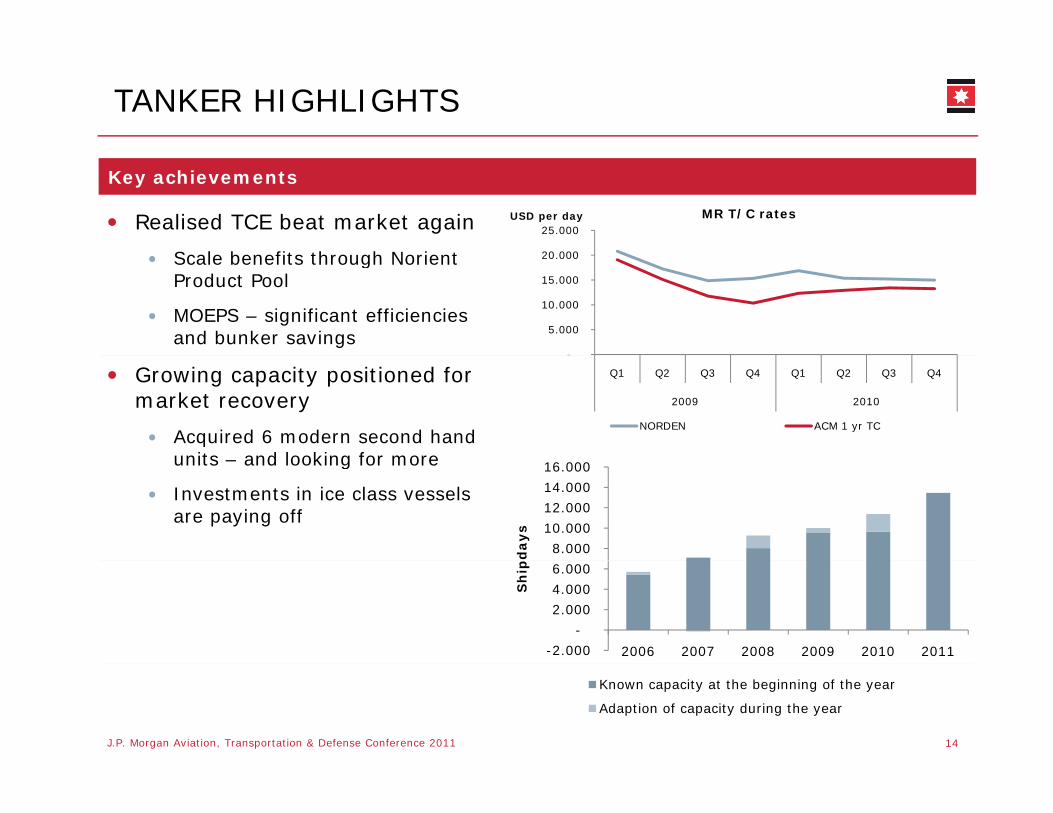
TANKER HIGHLIGHTS
Realised TCE beat market again
S l b fit th h N i t
Key achievements
20 000
25.000 USD per day MR T/C rates
Scale benefits through NorientProduct Pool
MOEPS – significant efficiencies and bunker savings
-
5.000
10.000
15.000
20.000
Growing capacity positioned for market recovery
Acquired 6 modern second hand units and looking for more
Q1 Q2 Q3 Q4 Q1 Q2 Q3 Q4
2009 2010
NORDEN ACM 1 yr TC
units – and looking for more
Investments in ice class vessels are paying off
8.000
10.000
12.000
14.000
16.000
pd
ays
-2.000
-
2.000
4.000
6.000
2006 2007 2008 2009 2010 2011
Sh
ip
14J.P. Morgan Aviation, Transportation & Defense Conference 2011
Known capacity at the beginning of the year
Adaption of capacity during the year

TANKER MARKET
Global oil demand driven by emerging marketsChinese and Indian refineries expected to drive increases in throughput
21 +4%
(Asia ex. OECD countries, mb/d)
19
20+6%
16
17
18
Q1 Q2 Q3 Q4 Q1 Q2 Q3 Q4 Q1 Q2 Q3 Q4 Q1 Q2 Q3 Q4
2008 2009 2010 2011
15J.P. Morgan Aviation, Transportation & Defense Conference 2011J.P. Morgan Aviation, Transportation & Defense Conference 2011
Source: IEA
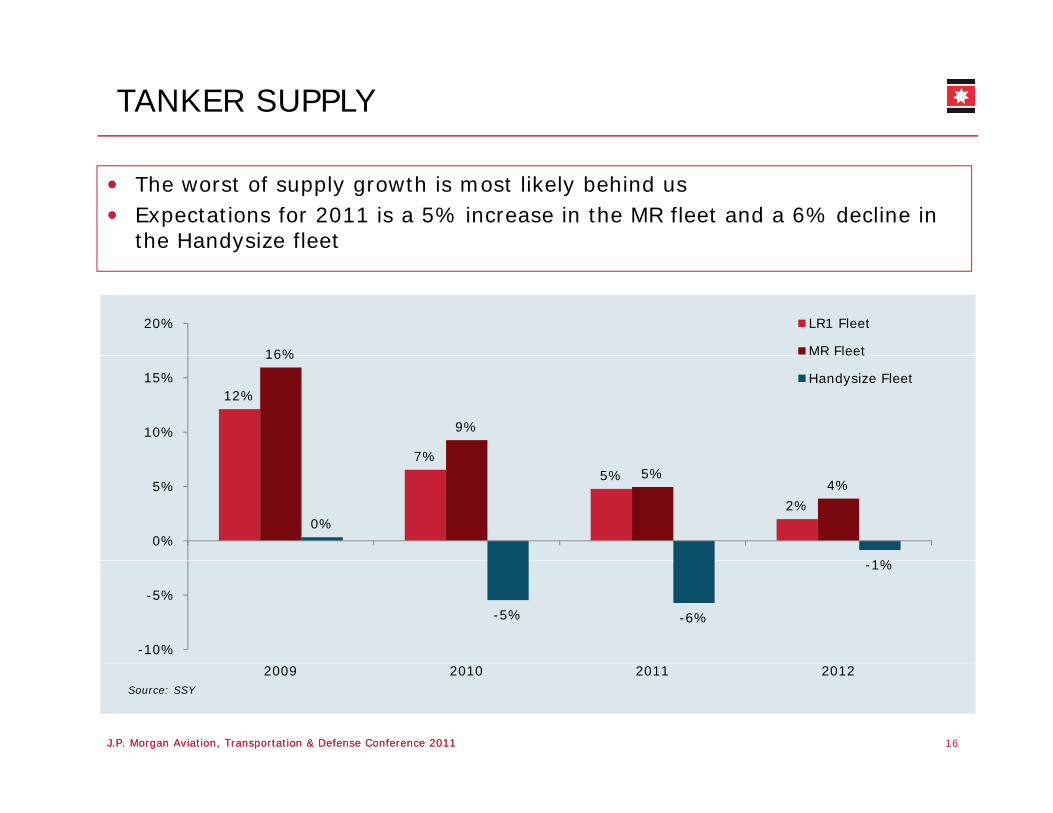
TANKER SUPPLY
The worst of supply growth is most likely behind usExpectations for 2011 is a 5% increase in the MR fleet and a 6% decline in the Handysize fleet
16%
20% LR1 Fleet
MR Fleet
12%
7%
16%
9%10%
15%
eet
Handysize Fleet
7%5%
2%
5%4%
0%
1%
0%
5%
-5% -6%
-1%
-10%
-5%
16J.P. Morgan Aviation, Transportation & Defense Conference 2011J.P. Morgan Aviation, Transportation & Defense Conference 2011
Source: SSY
2009 2010 2011 2012
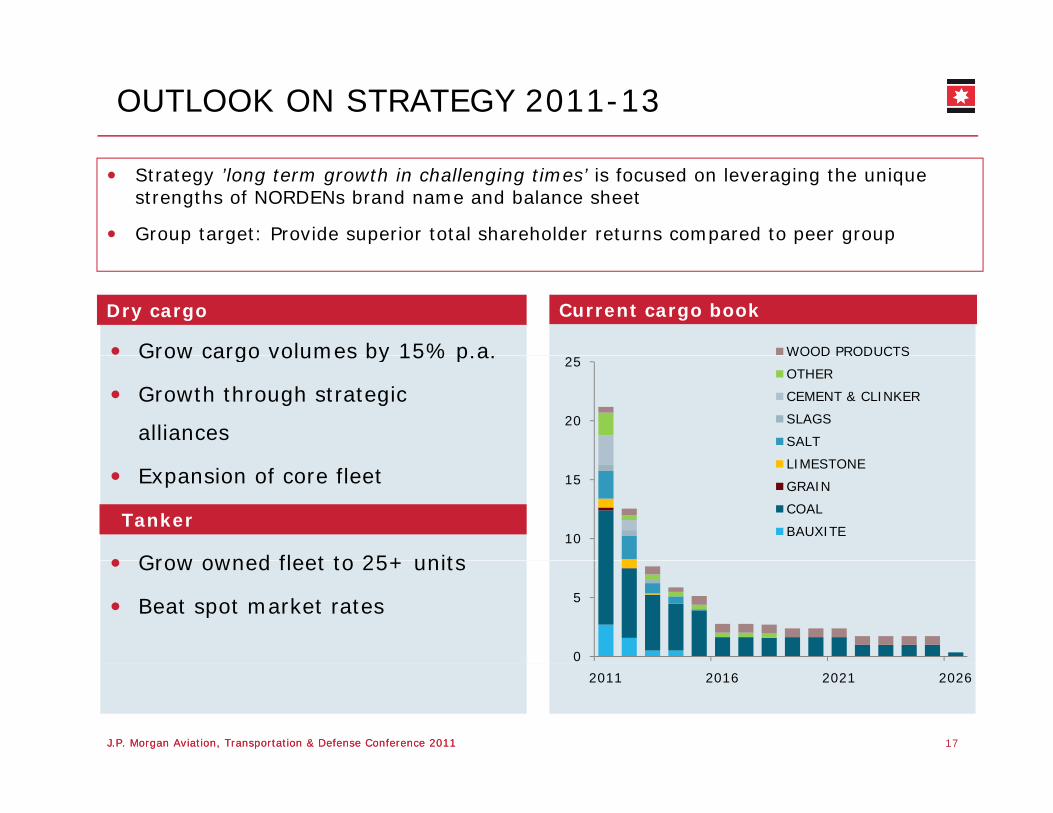
OUTLOOK ON STRATEGY 2011-13
Strategy ’long term growth in challenging times’ is focused on leveraging the unique strengths of NORDENs brand name and balance sheet
Group target: Provide superior total shareholder returns compared to peer group
Dry cargo
Grow cargo volumes by 15% p.a.
Current cargo book
WOOD PRODUCTSGrow cargo volumes by 15% p.a.
Growth through strategic
alliances20
25WOOD PRODUCTS
OTHER
CEMENT & CLINKER
SLAGS
SALT
Tanker
Expansion of core fleet
Grow owned fleet to 25+ units10
15LIMESTONE
GRAIN
COAL
BAUXITE
Grow owned fleet to 25+ units
Beat spot market rates
0
5
17J.P. Morgan Aviation, Transportation & Defense Conference 2011J.P. Morgan Aviation, Transportation & Defense Conference 2011
2011 2016 2021 2026

2011 FULL YEAR GUIDANCE
Key assumptionsOutlook
Guidance based on current capacity and coverage
USDm Dry Cargo Tanker Totaland coverage
Korea Line default on remaining 2.5 years of charter
Gain from settlement of USD 9 m
EBITDA
Profit from
125-155 20-30 135-175
Gain from settlement of USD 9 m. included in earnings
Only known and confirmed vessel sales are included in guidance
Profit from vessel sales
EBIT
-
55-95 g
Open capacity in Tankers employed at rates of USD 13,500 – 14,000 per dayCAPEX 260-300
Sensitivities
For each segment, a +/- 10% change in the forward curve will increase / reduce earnings by USD 10 mill.
Sensitivities
18J.P. Morgan Aviation, Transportation & Defense Conference 2011
FORWARD LOOKING STATEMENTS
This presentation contains certain forward-looking statements reflecting p g gthe management’s present judgment of future events and financial
results.
Statements relating to the remainder of 2011 and subsequent years are Statements relating to the remainder of 2011 and subsequent years are subject to uncertainty, and NORDEN’s actual results may therefore differ from the projections. Factors that may cause such variance include, but are not limited to, changes in macro-economic and political conditions,
particularly in the Company’s principal markets; changes to the Company’s rate assumptions and operating costs; volatility in rates and
tonnage prices; regulatory changes; any disruptions to traffic and operations as a result of external events, etc.
19J.P. Morgan Aviation, Transportation & Defense Conference 2011
THANK YOU FOR YOUR ATTENTION
Q&A Session
20J.P. Morgan Aviation, Transportation & Defense Conference 2011

BACK UP
21J.P. Morgan Aviation, Transportation & Defense Conference 2011
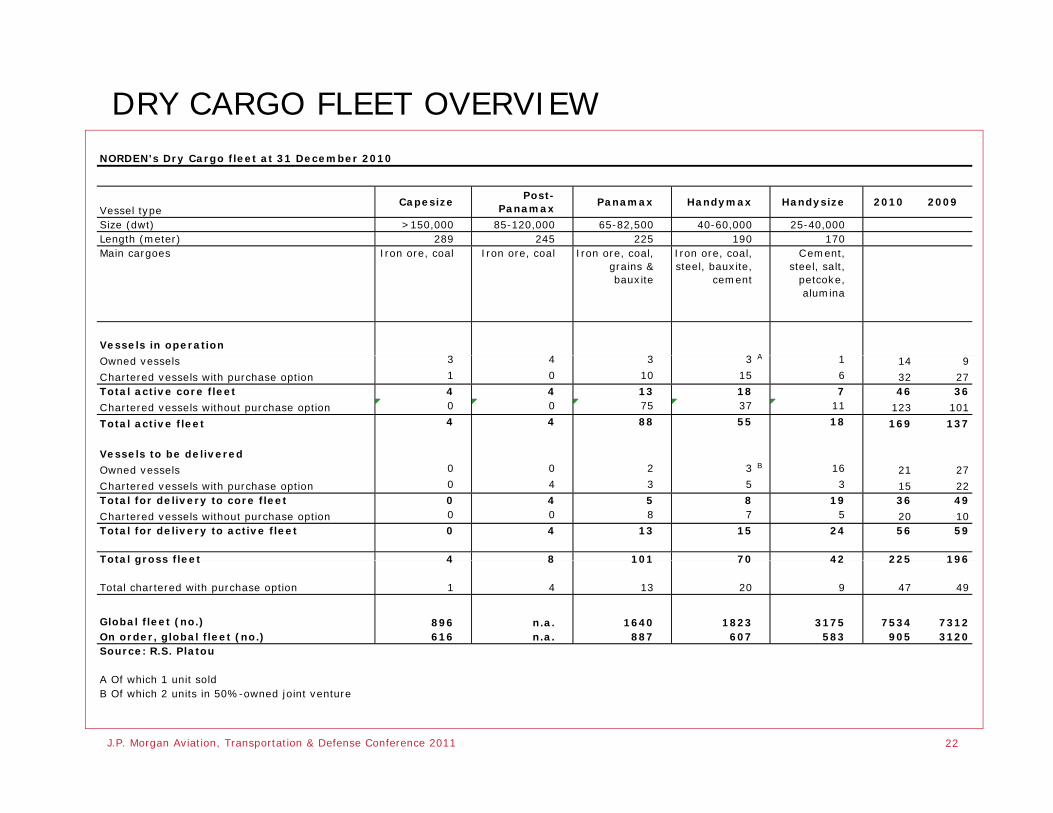
DRY CARGO FLEET OVERVIEWNORDEN's Dry Cargo fleet at 31 December 2010
Vessel typeCapesize
Post-Panamax
Panamax Handymax Handysize 2010 2009
Size (dwt) >150,000 85-120,000 65-82,500 40-60,000 25-40,000Length (meter) 289 245 225 190 170Main cargoes Iron ore coal Iron ore coal Iron ore coal Iron ore coal Cement Main cargoes Iron ore, coal Iron ore, coal Iron ore, coal,
grains & bauxite
Iron ore, coal, steel, bauxite,
cement
Cement, steel, salt,
petcoke, alumina
Vessels in operation3 4 3 3 A 1Owned vessels 3 4 3 3 A 1 14 9
Chartered vessels with purchase option 1 0 10 15 6 32 27Total active core fleet 4 4 13 18 7 46 36
Chartered vessels without purchase option 0 0 75 37 11 123 101
Total active fleet 4 4 88 55 18 169 137
Vessels to be delivered
Owned vessels 0 0 2 3 B 16 21 27
Chartered vessels with purchase option 0 4 3 5 3 15 22Total for delivery to core fleet 0 4 5 8 19 36 49
Chartered vessels without purchase option 0 0 8 7 5 20 10Total for delivery to active fleet 0 4 13 15 24 56 59
Total gross fleet 4 8 101 70 42 225 196Total gross fleet 4 8 101 70 42 225 196
Total chartered with purchase option 1 4 13 20 9 47 49
Global fleet (no.) 896 n.a. 1640 1823 3175 7534 7312On order, global fleet (no.) 616 n.a. 887 607 583 905 3120Source: R.S. Platou
22J.P. Morgan Aviation, Transportation & Defense Conference 2011
A Of which 1 unit soldB Of which 2 units in 50%-owned joint venture

TANKER FLEET OVERVIEWNORDEN's Tanker fleet at 31 December 2010NORDEN s Tanker fleet at 31 December 2010
Vessel typeLR1 MR Handysize 2010 2009
Size (dwt) 60-75,000 42-60,000 27-42,000Length (meter) 230 180 170M i F l d F l d F l d Main cargoes Fuel and
heating oil, gasoline,
diesel, jet fuel, naphtha
Fuel and heating oil,
gasoline, veg. oil,
diesel
Fuel and heating oil,
gasoline, veg. oil, diesel
l i iVessels in operation
Owned vessels 0 4 10 14 9
Chartered vessels with purchase option 0 10 0 10 5Total active core fleet 0 14 10 24 14
Chartered vessels without purchase option 1 5 10 16 13
Total active fleet 1 19 20 40 27
Vessels to be delivered
Owned vessels 0 2 1 3 2
Chartered vessels with purchase option 0 1 0 1 6Total for delivery to core fleet 0 3 1 4 8
Chartered vessels without purchase option 0 0 0 0 0p pTotal for delivery to active fleet 0 3 1 4 8
Total gross fleet 1 22 21 44 35
Total chartered with purchase option 0 11 0 11 11
23J.P. Morgan Aviation, Transportation & Defense Conference 2011
Global fleet (no.) 430 1.027 818 2.275 2.225On order, global fleet (no.) 63 188 49 300 531Source: SSY
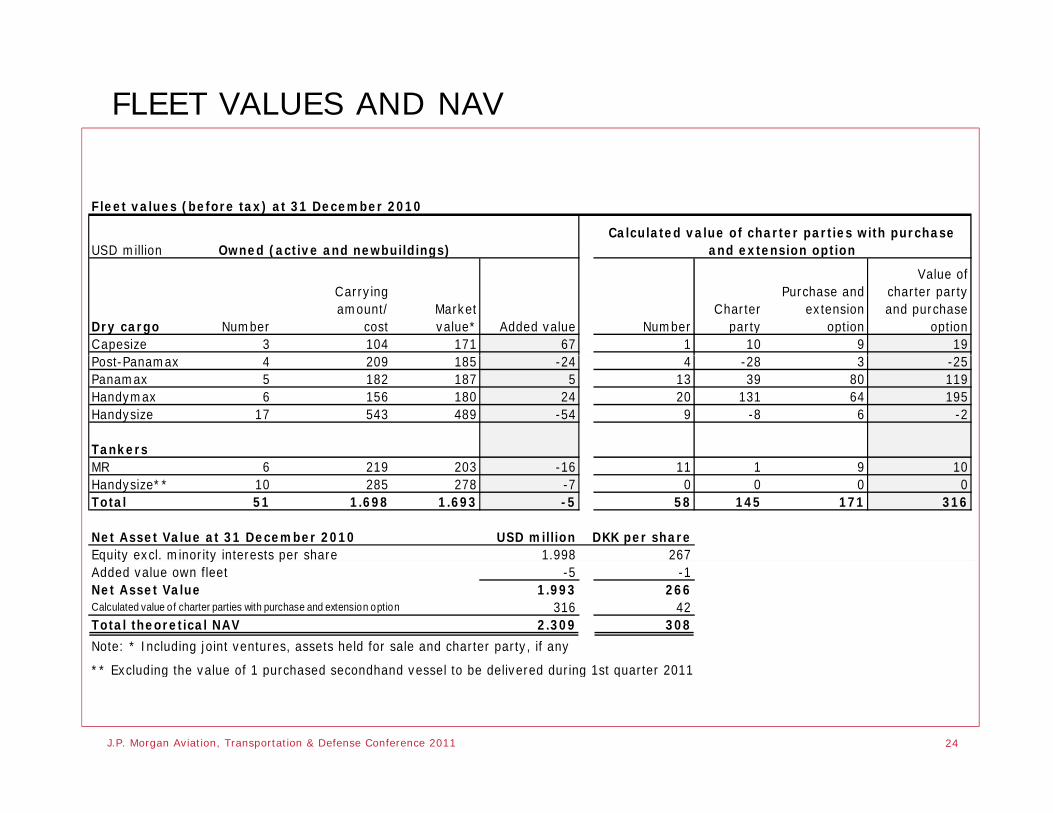
FLEET VALUES AND NAV
Fleet values (before tax) at 31 December 2010
Calculated value of charter parties with purchase and extension optionOwned (active and newbuildings)USD million
Dry cargo Number
Carrying amount/
costMarketvalue* Added value Number
Charter party
Purchase and extension
option
Value of charter party and purchase
optionCapesize 3 104 171 67 1 10 9 19
and extension optionOwned (active and newbuildings)USD million
Post-Panamax 4 209 185 -24 4 -28 3 -25Panamax 5 182 187 5 13 39 80 119Handymax 6 156 180 24 20 131 64 195Handysize 17 543 489 -54 9 -8 6 -2
TankersMR 6 219 203 -16 11 1 9 10Handysize** 10 285 278 -7 0 0 0 0Total 51 1.698 1.693 -5 58 145 171 316
Net Asset Value at 31 December 2010 USD million DKK per shareEquity excl. minority interests per share 1.998 267q y y pAdded value own fleet -5 -1Net Asset Value 1.993 266Calculated value of charter parties with purchase and extension option 316 42Total theoretical NAV 2.309 308
Note: * Including joint ventures, assets held for sale and charter party, if any
24J.P. Morgan Aviation, Transportation & Defense Conference 2011
** Excluding the value of 1 purchased secondhand vessel to be delivered during 1st quarter 2011

2010 COMMODITIES AND GEOGRAPHIES
Geographical distribution of imports (2010) Transports, Dry Cargo 2010
Western Europe China Other
India North America South America
Coal Iron ore
Grain Salt
80%
90%
100%
India North America South America
Other Asia Japan Cement and clinker Other
50%
60%
70%
80%
45%7%
20%
10%
20%
30%
40%
12%
9%
8%
0%
NORDEN Market
J.P. Morgan Aviation, Transportation & Defense Conference 2011 25

COVERAGE AND CAPACITY – DRY CARGO
Capacity and coverage, at 31 December 2010
Dry Cargo
2011 2012 2013 2014+ 2011 2012 2013 2014+
Gross capacity Ship days Costs for gross capacity (USD per day)Gross capacityCapesize 1.460 1.464 1.460 14.199 10.117 10.117 10.117 8.260Post-Panamax 2.325 2.776 2.920 34.911 10.853 12.103 12.448 10.146Panamax 12.274 6.517 5.988 35.750 16.292 12.410 12.001 9.286Handymax 12.524 10.519 8.919 42.249 14.596 12.960 12.182 9.297Handysize 6.474 10.070 11.040 122.485 10.873 9.594 9.355 5.866
Ship days Costs for gross capacity (USD per day)
Handysize 6.474 10.070 11.040 122.485 10.873 9.594 9.355 5.866Total 35.057 31.346 30.327 249.594 14.068 11.556 11.043 7.671
CoverageCapesize 1.480 732 553 0 36.660 45.899 45.554 0Post-Panamax 1.157 0 0 0 21.063 0 0 0
Ship days Revenue from coverage (USD per day)
Panamax 14.781 6.253 3.649 11.438 20.182 19.735 19.507 19.601Handymax 9.770 5.501 2.337 2.935 19.029 21.004 17.441 15.155Handysize 2.595 1.807 1.350 9.257 13.257 13.127 13.938 13.745Total 29.783 14.293 7.889 23.630 20.054 20.728 19.768 16.755
Coverage in %Capesize 101% 50% 38% 0%Post-Panamax 50% 0% 0% 0%Panamax 120% 96% 61% 32%Handymax 78% 52% 26% 7%Handysize 40% 18% 12% 8%
26J.P. Morgan Aviation, Transportation & Defense Conference 2011
Handysize 40% 18% 12% 8%Total 85% 46% 26% 9%
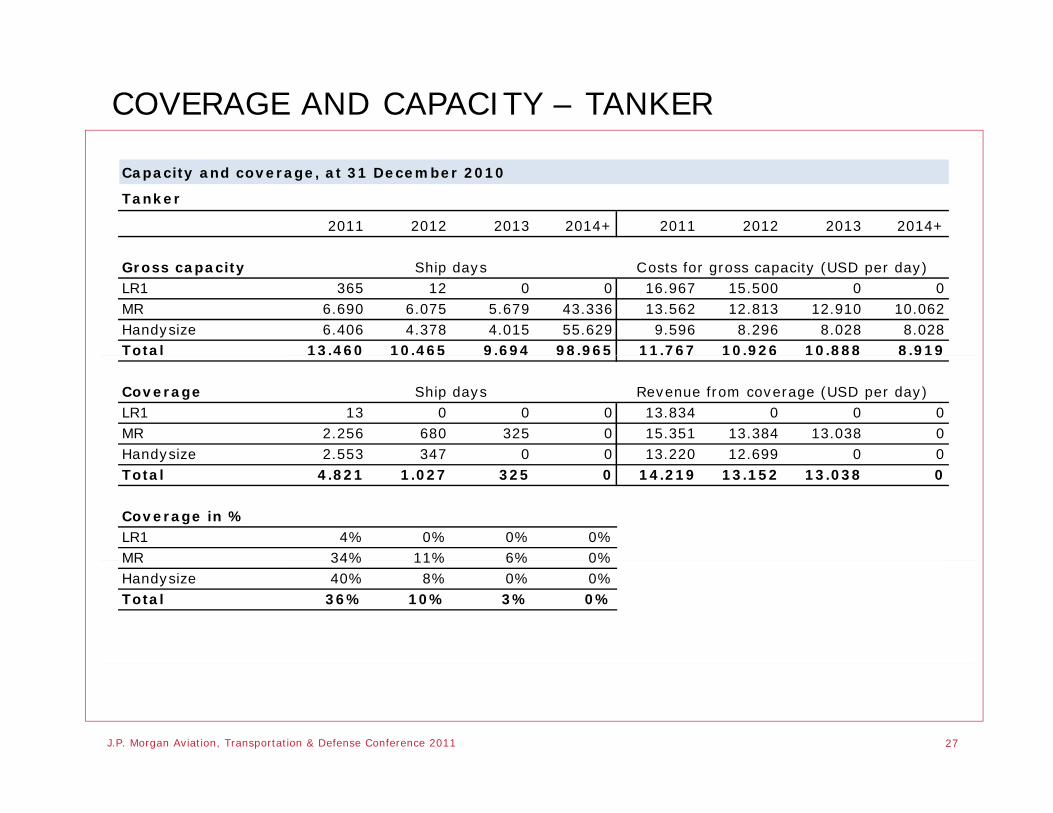
COVERAGE AND CAPACITY – TANKER
Capacity and coverage, at 31 December 2010
Tanker
2011 2012 2013 2014+ 2011 2012 2013 2014+
Gross capacityLR1 365 12 0 0 16.967 15.500 0 0MR 6.690 6.075 5.679 43.336 13.562 12.813 12.910 10.062Handysize 6.406 4.378 4.015 55.629 9.596 8.296 8.028 8.028Total 13.460 10.465 9.694 98.965 11.767 10.926 10.888 8.919
Ship days Costs for gross capacity (USD per day)
o
CoverageLR1 13 0 0 0 13.834 0 0 0MR 2.256 680 325 0 15.351 13.384 13.038 0Handysize 2.553 347 0 0 13.220 12.699 0 0
Ship days Revenue from coverage (USD per day)
Handysize 2.553 347 0 0 13.220 12.699 0 0Total 4.821 1.027 325 0 14.219 13.152 13.038 0
Coverage in %LR1 4% 0% 0% 0%MR 34% 11% 6% 0%MR 34% 11% 6% 0%Handysize 40% 8% 0% 0%Total 36% 10% 3% 0%
27J.P. Morgan Aviation, Transportation & Defense Conference 2011
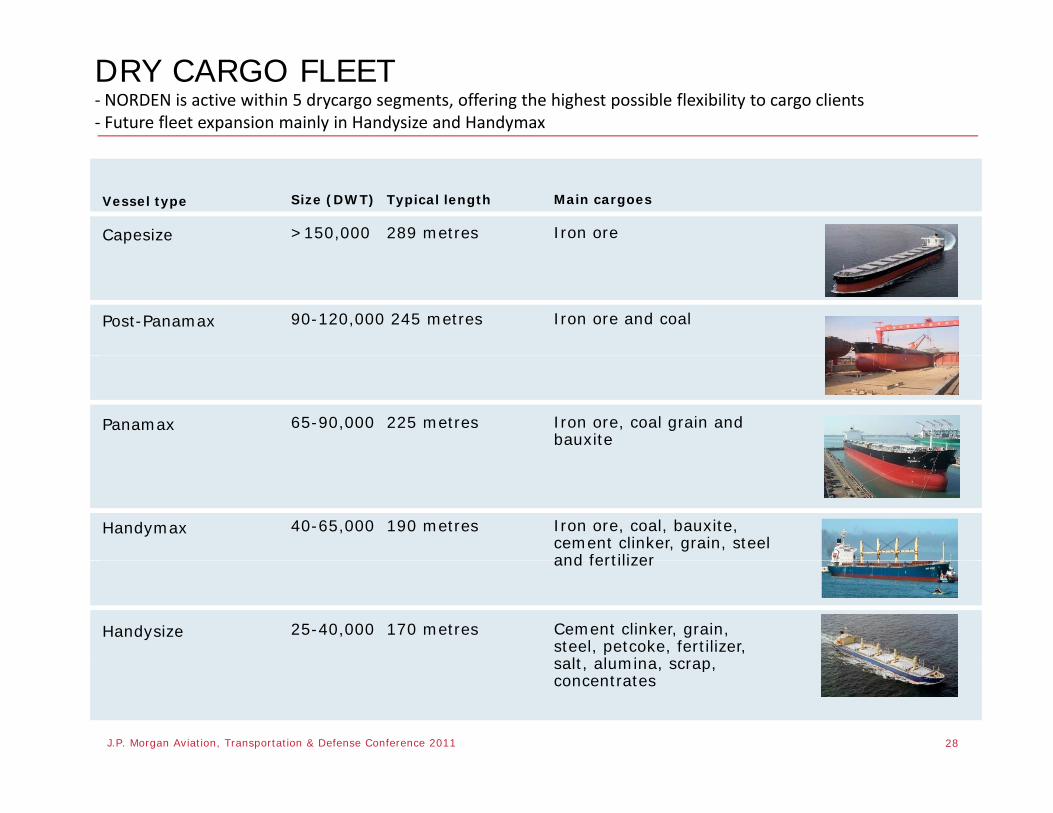
DRY CARGO FLEET‐ NORDEN is active within 5 drycargo segments, offering the highest possible flexibility to cargo clients‐ Future fleet expansion mainly in Handysize and Handymax
Size (DWT) Typical length
>150,000 289 metres
Main cargoes
Iron ore
Vessel type
Capesize
90-120,000 245 metres Iron ore and coalPost-Panamax
65-90,000 225 metres
Edit / no
Iron ore, coal grain and bauxite
Panamax
40-65,000 190 metres
/
cranes
Iron ore, coal, bauxite, cement clinker, grain, steel and fertilizer
Handymax
25-40,000 170 metres
and fertilizer
Cement clinker, grain, steel, petcoke, fertilizer, salt alumina scrap
Handysize
28J.P. Morgan Aviation, Transportation & Defense Conference 2011
salt, alumina, scrap, concentrates
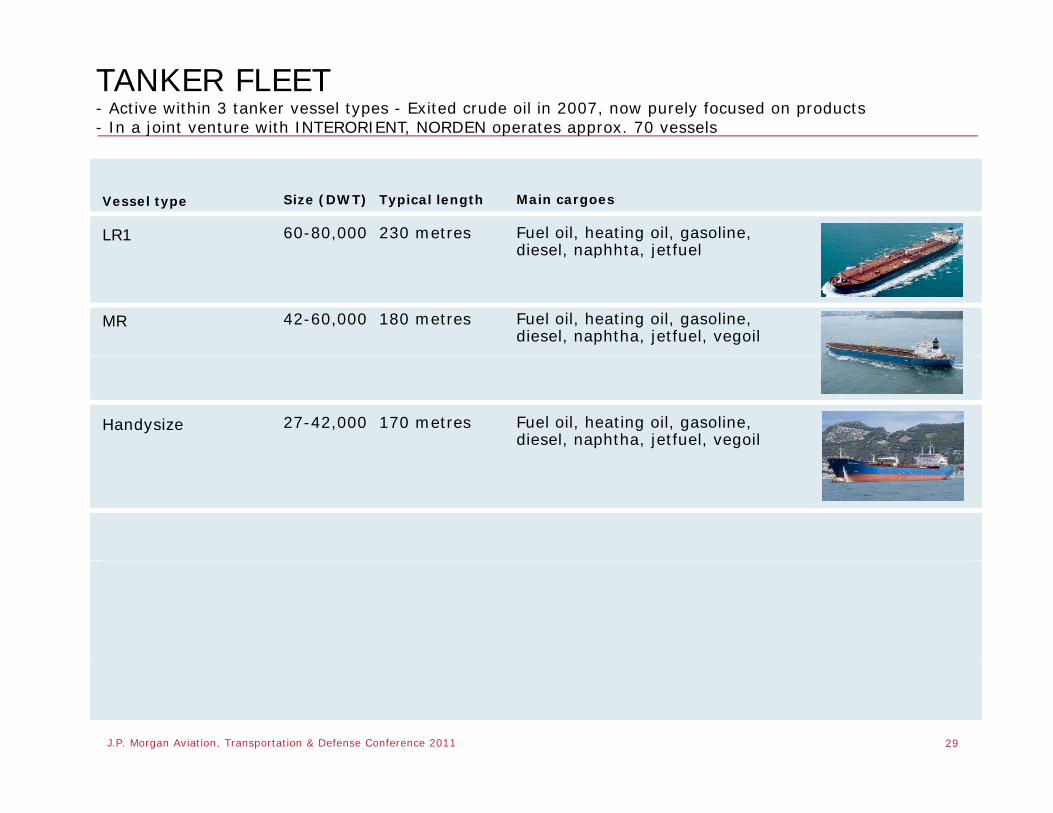
TANKER FLEET- Active within 3 tanker vessel types - Exited crude oil in 2007, now purely focused on products- In a joint venture with INTERORIENT, NORDEN operates approx. 70 vessels
Size (DWT) Typical length
60-80,000 230 metres
Main cargoes
Fuel oil, heating oil, gasoline, diesel naphhta jetfuel
Vessel type
LR1
42-60,000 180 metres
diesel, naphhta, jetfuel
Fuel oil, heating oil, gasoline, diesel, naphtha, jetfuel, vegoil
MR
27-42,000 170 metres Fuel oil, heating oil, gasoline, diesel, naphtha, jetfuel, vegoil
Handysize
29J.P. Morgan Aviation, Transportation & Defense Conference 2011
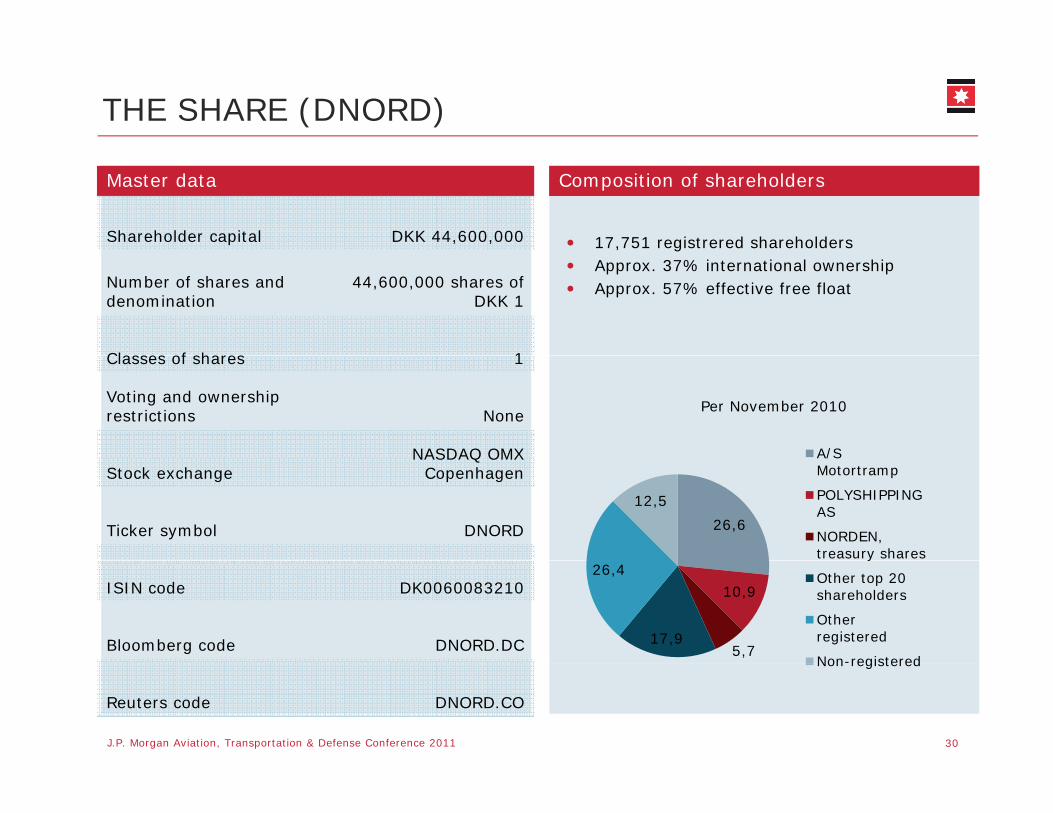
THE SHARE (DNORD)
17,751 registrered shareholdersShareholder capital DKK 44,600,000
Master data Composition of shareholders
Approx. 37% international ownershipApprox. 57% effective free floatNumber of shares and
denomination44,600,000 shares of
DKK 1
Classes of shares 1Classes of shares 1
Voting and ownershiprestrictions None
NASDAQ OMX
Per November 2010
A/S Stock exchange
NASDAQ OMX Copenhagen
Ticker symbol DNORD 26,6
12,5
A/S Motortramp
POLYSHIPPING AS
NORDEN, treasury shares
ISIN code DK0060083210
Bloomberg code DNORD.DC
10,9
5,717,9
26,4y
Other top 20 shareholders
Other registered
Non-registered
J.P. Morgan Aviation, Transportation & Defense Conference 2011
Reuters code DNORD.CO
30
Non registered