the joan shorenstein center on the press, politics and...
TRANSCRIPT
The Joan Shorenstein Center on thePress, Politics and Public Policy
Working Paper Series
Rainbow’s End: Public Support for Democracyin the New South Africa
By Richard MorinShorenstein Fellow, Fall 1999
The Washington Post
#2000-10
Copyright 2000, President and Fellows of Harvard CollegeAll rights reserved

2
This paper is written to honor the talented and dedicated journalists of Independent Newspapers(South Africa) who produced the “Reality Check” series: Ryland Fisher, Roger Friedman, ShaunJohnson, Karen MacGregor, Eric Ntabazalila, Judith Soal and Simon Zwane.
3
Challenges to Democracy in South Africa
The two headlines on the front page of the Cape Times on this South African summer
morning in February told of two democracies battling their own worst impulses. Terrorists had
bombed another police station in downtown Cape Town, killing a woman passerby. And in
equally large type: "Lewinsky to Testify."
To this newly arrived visitor from the United States, the juxtaposed headlines were at once
startling and revealing. Eight thousand miles away, the world's most powerful and successful
democracy lurched toward a constitutional crisis over a sex scandal that most Americans
viewed as inconsequential. Meanwhile in South Africa, one of the world's newest democracies
confronted issues of life and death, stability and chaos.
The story of South Africa's political transformation from international pariah to the Rainbow
Nation has been told often, and told well. In April 1999, a team of reporters and editors from
Independent Newspapers, the largest newspaper chain in the country, added another chapter to
this inspiring narrative. These journalists, drawn from newspapers around the country, worked
as a team to report the findings of a survey of 3,000 South Africans who shared their views on
democracy, race relations, reconciliation and national unity in the new South Africa.
The project was called “Reality Check.” The five-part series ran April 19-23, 1999, two
weeks before voters went to the polls to cast ballots in the second free and democratic election
in South Africa’s history.
The survey and resulting stories clarified the challenges that democracy faces in South
Africa: widespread unemployment, particularly among the black majority; an anemic economy; a
soaring crime rate and the gaping disparities between white and black South Africans. "But the
strongest message that came through in the survey was an unequivocally positive one," wrote
Mollyann Brodie, Drew Altman and Michael Sinclair of the Henry J. Kaiser Family Foundation,
which jointly sponsored the survey with Independent Newspapers. "Finding after finding
4
underscored the South African people's commitment to democracy and national unity; their
confidence in South Africa's major institutions; their realism about the pace of change; and their
optimism for the future.”1
It is doubtlessly true that South Africa has come quickly down the freedom trail; perhaps
even further than visionaries like Nelson Mandela and Bishop Desmond Tutu could have
imagined. But do South Africans believe this transformation will continue? Or do they expect the
democratic moment—this golden age--will quickly pass into blood and chaos? More to the
point, what are the sources of optimism and uncertainty about the future of democracy? Do the
factors that encourage optimism among blacks provoke uncertainty among whites? What
lessons, if any, should politicians and policymakers glean from these survey data as they
attempt to consolidate and deepen democracy in South Africa?
The sometimes-surprising answers to these questions occupy the rest of this paper. As this
analysis will suggest, pessimism about the future of democracy frequently comes from
unexpected sources. The most pessimistic South Africans are black, not white. Even more
unexpectedly, the ethnic group that now dominates political life in South Africa—the Xhosa, the
tribe of Mandela and his successor Thabo Mbeki—express the most uncertainty about
democracy’s future.
These data also suggest that crime may be killing democracy in South Africa, or at the least,
eroding public confidence in democratic institutions and systems. At the same time, broad
mistrust of police, the army and the courts complicates efforts to combat crime.
The enormous gap between rich and poor South Africans, a legacy of apartheid, also sharply
reduce belief that democracy will endure. Democratic institutions appear threatened by
unrealistically high expectations about the ability of democracy to deal effectively—and
quickly—with the country’s biggest problems.
Yet counterpoised against these pessimistic signs is equally compelling evidence that South
Africans stand poised to once again to defy long odds and pessimistic predictions about their

5
future. After all, recent history has already proven that South Africa is a place where political
miracles can happen.
The Survey: An Overview
Data for this analysis comes from the Reality Check survey, a joint project of the Henry J.
Kaiser Family Foundation and Independent Newspapers of South Africa. A nationally
representative sample of 3,000 South Africans was surveyed in face-to-face interviews in
November and December of 1998. The questionnaire was administered to respondents by
trained interviewers in the eleven official languages of South Africa. In theory, the sample
should provide statistically reliable results for the South African adult population as a whole, as
well as for South Africa’s major racial groups and provinces. Margin of sampling error for the
overall results is plus or minus 2 percentage points.
The Kaiser Foundation, Independent Newspapers and two South African research firms,
Strategy & Tactics and the Community Agency for Social Inquiry (CASE), jointly developed the
survey questionnaire. Data analysis for the Reality Check project was led by David Everatt and
Ross Jennings of Strategy & Tactics, and by Mollyann Brodie, vice president of public opinion
research at the Kaiser Family Foundation. This author served as a consultant to reporters and
editors on the Reality Check team after the survey was completed.
The survey revealed a broad national consensus on the central principles of democracy.
Nine in 10 South Africans believed voting should be private. Nine in 10 believed that the “right to
vote for the party of my choice defines democracy.” Eight in 10 supported the right of a free
press. Three in four agreed that “for good government we must have strong opposition.”
It was not always so. “The basic democratic principles—such as multi-partyism, a strong
opposition and an unfettered political right to choose—are now widely accepted notions
compared to five years ago, when attempts to assert them often led to hostilities,” concluded
Simon Zwane, a reporter on the Reality Check reporting team.2

6
South Africans expressed high levels of confidence for many key democratic institutions.
Overwhelming majorities expressed confidence in the national government in Pretoria, the
Parliament and in their local governments. Standing alone, these expressions of confidence in
all levels of government are noteworthy; when compared to the results of similar questions
asked in other countries, these findings are little short of astonishing. Nearly eight in 10 South
Africans said they expected the national government in Pretoria to do “the right thing” almost all
or most of the time—more than twice the proportion of Americans who express similar
confidence in the federal government.
Yet the story of South Africa often is two stories: One black, the other white.3 The racial
divide, once enforced by law and state-sponsored terrorism, continues to run deep and wide
through the heart of South Africa. The persistence of this sad division is reflected in these
survey results. Whites are far less confident of the national government than Africans, though a
majority still expressed high levels of trust. The confidence gap narrows when blacks and whites
are asked to evaluate their provincial and local governments.
If these were the biggest racial differences laid open in this survey, the numbers might be
cause for celebration, not concern. They are not. Other questions that probe more deeply into
attitudes toward other key democratic institutions reveal larger and more disquieting differences.
Table I here
As Table 1 illustrates, blacks consistently expressed significantly more confidence in each of
10 institutions critical to democracy-building in South Africa. Black and white attitudes were
roughly similar in only two areas. More than six blacks and whites said they “a great deal” or
“quite a lot” of confidence toward the churches, a positive but not necessarily surprising result.
The second area of agreement underscores the difficult challenges that face South Africans
today. More than a third--35 percent--of black South Africans expressed high levels of

7
confidence in the South African Police Service (SAPS), a view shared by 31 percent of whites.
Significantly, however, when ranked in terms of confidence, the police finished at the bottom
among blacks, reflecting the legacy of oppression of blacks by the police under apartheid as
well as continuing instances of mistreatment and brutality by a haphazardly trained, demoralized
and disproportionately white police force. Among whites sampled, the police were the second
highest rated institution, behind the churches.
While not embracing politics, the overwhelming majority of South Africans—both black and
white--sees the need for vigorous, contested elections. Three in four agreed that "for good
government, we must have strong opposition." About half – 52 percent – acknowledged that
they "didn't really like politics, but it's important to keep in touch with what's happening," while 36
percent said it was important to them "to be as involved as possible" in politics. Only one in
eight – 12 percent–said, “politics is a waste of time."
The survey suggests that South Africans believe that much has gone right in the Mandela
years. Nearly half – 48 percent –said public education has gotten better, while and 23 percent
said there's been no change. Only 29 percent said education has gotten worse, a view shared
by a disproportionately large number of white South Africans. Nearly four in 10 – 37 percent –
said relations between the races had improved, while 42 percent reported no change. One in
five reported that relations between the races had eroded.
In other important areas of South African life, the results are distinctly more troubling. About
eight in 10 – 85 percent – said crime has gotten worse. And nearly two in three – 64 percent –
said the economy had declined.
"This survey of South Africans certainly underscores South Africa's challenges but it also
shows that the new South Africa has made a good beginning and there is cause of guarded
optimism about the future," the Kaiser team wrote. "When viewed in the context of South
Africa's history and what might have been, the survey illuminates South Africa's standing as
perhaps the leading example of democratic transformation in the world." 4
8
Some Theories and Some Hypotheses
South Africans remain deeply ambivalent about the future of democracy. A question asked at
the end of the Independent Newspapers-Kaiser survey captures this tension: “Thinking ahead to
when Mandela leaves office. Will South Africa remain a democracy country?”
A bare majority of South Africans – 54 percent –said they believed that South Africa will
remain democratic. Another 38 percent said they were unsure. Only 8 percent doubted
democracy would survive. Even among white South Africans, only one in eight offered this
pessimistic view.
For practical as well as theoretical reasons we collapse together those who were unsure
and those who answered the question in the negative into a single category. Only 8 percent of
our sample offered a purely pessimistic view. Such a small sample places constraints on how
far we can press for answers to our questions, and how successful we will be.5 It also is
reasonable to suspect that social desirability bias is hard at work in this question. The arduous
but ultimately successful struggle against apartheid still burns brightly in the memories of South
Africans. The international acclaim that greeted the fall of apartheid --including two Nobel Peace
Prizes to the principle architects of the democratic movement--still ring in their ears. Even those
with the deepest doubts might think it disrespectful or unpatriotic to predict so quick an end to
the democracy. The relatively low levels of overt pessimism also may reflect what political
theorist Larry Diamond in another context has called the “bias for hope”—the belief that even
against long odds and in defiance of overwhelming contrary evidence, miracles do happen in
politics.
We divide our sample into two groups. “Optimists” comprise 54 percent of the 3,000
respondents. “Uncertains” constitute the 46 percent who were either unsure or pessimistic about
the future of democracy after Mandela.
9
At least two challenges might be posed to this attempt to model optimism. One is cynical, the
other pragmatic. As a concept, “optimism” may be devalued in this alienated age. The word may
conjure up notions of a romantic sentimentalist, or a naïf unwilling to see the world as it is (it is
unhelpful to my case that the thesaurus suggests “pollyannaish” as a synonym for “optimist.”)
Perhaps optimism, like “perkiness,” is a concept unworthy of serious inquiry.
A pragmatist, on the other hand, might argue that this survey question has a right answer--
and a majority of South Africans got it wrong. The only sensible answer is, “Who knows?”
Democracy is too newly arrived in South Africa. Besides, nobody can know the future. Nothing
useful can result from attempting to learn why so many South Africans are so mistaken.
I argue that optimism is neither a naïve nor an unhelpful concept. Faith that democracy and
democratic institutions will survive to the next day, to the next year, and to the next is essential if
democracy or any other form of government is to survive. As historian Garry Wills has note
about democratic institutions, “When you take away predictability, you take away identity.”
Political scientist Joseph S. Nye, Jr. has suggested some areas of public life where political
faith may be crucial. “Voluntary compliance with the law, the public’s willingness to pay taxes,
and the eagerness of bright young people to enter government service are three ways in which
institutional confidence and faith in government may be vitally connected.”6
Nye was speaking of trust in government. He could just as well have been talking the role of
optimism and hope in politics. In fact, these data suggest that optimism is directly connected
to—and may be a consequence of--confidence in democratic institutions and faith in
government. These data further suggest a direct and strong relationship between optimism
about democracy’s future and such essential democratic acts as voting: Optimists, for example,
were significantly more likely than other South Africans to report voting in 1994 or say they
planned to vote in the June, 1999 election.
Notions of optimism and faith also are part of what Lucian Pye has called “the attitudes,
sentiments and congnitions that inform and govern political behavior in any society [that] are not
10
just random congeries but represent coherent patterns which fit together and are mutually
reinforcing.”7
Pye’s claim leads to a practical defense of optimism. If optimism about the future of
democracy is worth studying, a study of optimism will produce worthwhile results. Specifically, it
will reveal a coherent web of relationships between feelings of optimism with attitudes and life
experiences. But if the analysis detects no pattern—if the old are no more or less optimistic as
the young, the rich just as optimistic as the poor, blacks as optimistic as whites--then optimism
may be dismissed as another of Pye’s “random congeries.”
The search for patterns begins with theoretical concepts useful in modeling other aspects of
democracy. Four decades ago, Seymour Martin Lipset demonstrated the link between economic
performance and democracy. Other researchers such as Ronald Inglehart have broadened and
deepen this insight to show how political culture and economic development are correlated with
stable democracy.
This work has moved far beyond linking actual economic conditions with political attitudes.
Political scientists such as Donald Kinder have shown how people’s perceptions of economic
performance inform political attitudes and behaviors such as voting in presidential elections.
Simon Jackman has found that unfulfilled expectations about economic performance exert a
strong impact on presidential approval ratings. The act of voting thus becomes the instrument
whereby citizens punish or reward presidents or their parties for failing to meet expectations.8
Scholars have identified conditions that seem to foster stability in emerging democracies.
These factors should also be expected to enhance optimistic feelings about the durability of
democracy. Confidence in democratic institutions consistently has been showed to enhance the
stability and legitimacy of democracy. Belief that democracy matters, that real-world problems
can be solved by free and open elections and that, on a personal level, that voting—the single
essential act in any democracy--is not waste of time are attitudes that have been shown to
sustain and strengthen democracy.

11
Scholars also suggest that positive performance by a government deepens commitment to
democracy. Some even argue that the belief in the legitimacy of democracy is shaped more by
political than economic performance. In short, good works in the form of successful policies
may serve short-term as well as long-term political objectives in emerging democracies. “The
democratic regime must produce sufficiently positive policy outputs to build broad political
legitimacy or at least to avoid the crystallization of substantial pockets of resistance to the
regime’s legitimacy,” Diamond argues.9
Also critical to any democratic government is its ability to produce and broadly distribute
improvements in living standards and avoid creating the appearance—or the reality—that
benefits are inequitably distributed among citizens. For example, “people expect democracy to
reduce income inequality, and democracies are more likely to survive when they do,” writes
Adam Przworski.10
Other quality of life issues appear to bear directly on attitudes toward democracy. Robert
Putnam argues that civic engagement strengthens and deepens democracy and trust in
democratic institutions. Other theorists argue that crime is a particularly destabilizing and
politically corrosive force in politics, particularly in new and emerging democracies. South Africa
is on a short list of countries where crime currently undermines democratic authority. “In such
areas as Moscow and St Petersburg, the Cali region controlled by Columbia drug cartels, and
some of South Africa’s townships, violence and fear may be so endemic as to negative the
state’s monopoly control of force and even to construct a powerful parallel economy that the
state cannot tax and to which businessmen must pay tribute,” Diamond wrote in “Developing
Democracy.”11
Together, these theories suggests where we might look in the survey data to find sources of
optimism about the future of democracy in South Africa, and some hypotheses to test.
Positive perceptions of economic performance in the democratic era (since the 1994
election) should be associated with higher levels of optimism. Likewise, greater confidence in

12
the government and key democratic institutions should translate into more optimistic feelings.
How well the Mandela government has dealt with core issues such as housing, education and
health care also should be related to feelings of optimism or uncertainty about the nation’s
political future.
Higher levels of political efficacy as well as higher level of involvement in political and civil life
should be positively related to the belief that democracy would endure. Exposure to crime and
discrimination should diminish optimism. Racial tolerance should be associated with higher
levels of optimistic feelings.
We now test these hypotheses against the Reality Check data.
The Model
Stage 1: Demographics
Who we are affects how we think. Demographics are not destiny, but they do help shape
attitudes. Are men more or less optimistic about the future of democracy than women? Do
younger South Africans think differently than the old? Do the rich think differently than the poor?
Are whites more pessimistic than blacks? Do rural residents think differently than urban South
Africans?
One way to answer these questions is to see how each group directly answers the question
on the future of democracy after Mandela. TABLE II breaks down the results individually by
these standard demographic variables: race, ethnicity/tribal affiliation (as measured by language
spoken in the home), sex, age, education, children under 18 in the household, and by a variable
that measures relative economic deprivation.
Table II here

13
These simple two-way tables are useful, but limited. These breakdowns account for the
impact of a single variable, without controlling for the influence of other variables. To identify the
independent effects of each factor, the variables are entered into a logistic regression model.
This analysis produces a startling surprise: The South Africans least optimistic about the
future of democracy are black and not white. Xhosas consistently expressed the most
uncertainty--a finding made even more significant because Xhosas dominate the ANC, the party
of Mandela and his successor Thabo Mbeiki, and the party that handily swept the first two
national elections. Xhosa also fill top positions in the trade unions and the Communist Party, the
other two parties in the coalition that governs South Africa.
The Zulu, traditional enemies of the Xhosa and now their political rivals, were somewhat
more optimistic, but still more pessimistic than whites. It is among other tribes that optimism
flourishes. Among these South Africans, nearly three in four expressed optimism for the future
of democracy.
Material comfort also matters: Those rated as economically privileged were more likely than
economically deprived South Africans to feel confident that democracy would endure, other
factors in the model being equal.12 [A complete definition of the economic deprivation measure
is found in the appendix.]
Rural residents were more optimistic than those living in the suburbs or cities. Age, too, was
significant: Younger South Africans are more optimistic than older South Africans that
democracy will endure. It is a finding that is both expected and reassuring. Younger people
across cultures are significantly more optimistic about the future than their elders; a contrary
finding in South Africa would have raised immediate and serious questions about the future of
democracy.
Race, however, complicates the relationship between age and political optimism. Among
blacks, optimism about the future did not gradually fade with age. In fact, these data suggest
that optimism is largely confined to the youngest black South Africans. The two-way tables hint
14
at these differences: More than six in 10 blacks 35 years old or younger are optimistic about the
future of democracy. But this “rosy glow” quickly vanishes: The proportion of optimists
plummeted 10 percentage points to 52 percent among those 36 to 45, then remains at about
that level among those 46 to 60 (54 percent) and older than 60 (52 percent). And while it will
later be shown that other factors serve to dampen the magnitude of these differences, the
relationship between age and optimism remains robust.
The pattern is slightly different and perhaps more ominous among white South Africans.
Among whites, the relationship between relative youth and optimism disappears. Younger
whites are just about as optimistic (50 percent) as whites who were older than 60 (54 percent).
Embedded in this generational data is an even more troublesome finding. Barely a third of
all whites between the ages of 26 and 45 are optimistic, compared to half of younger and older
whites. The implications of this difference are enormous. Members of these middle generations
are well into their careers and on the cusp or in the midst of their prime earning years. It is true
these whites benefited enormously and unfairly from apartheid. It is also true their skills are
needed to support South Africa’s economic, social and political institutions. Their incomes helps
to fuel the private economy; their taxes help pay for needed services. These families are the
foundation of such institutions as schools, churches and civic organizations. As we will later see,
this “pessimistic generation” of whites will remain distinctly different from other whites through all
stages of the analysis.
This first step has been productive in three important ways. Most directly, it has culled from
the ranks a short list of demographic variables that appear to be significant predictors of
optimism. These results suggest that it matters if you are black, other demographic factors
being equal. Tribal affiliation also is strongly associated with optimism, other demographic
factors being equal. Residents living in rural areas are more optimistic than those in urban or
suburban regions. Economic disadvantage appears to reduce optimism; economic privilege is
associated with a more positive view.

15
The dogs that don’t bark also are important. Gender doesn’t seem to matter. Men and women
saw the future of democracy in much the same way, other factors being equal. Being white or
being an Afrikaaner also is not closely related to optimism, once other demographic factors are
taken into account.
Education also doesn’t matter, another surprising result. Education is strongly associated
with democratic consolidation in many emerging democracies, particularly those in Eastern
Europe. South Africa appears to be different. Other political surveys in South Africa also have
failed to detect a relationship between education levels and democratic consolidation, which
researchers have attributed to the country’s unique history, economic experiences and the
character of its new democratic institutions.13
But demographics do not work alone to shape attitudes. In the next stage of the analysis,
personal experiences are added to the emerging model.
Table III here
Stage 2: Experiences
Six variables measuring different types of life were added to the full list of demographic
variables. These new variables included:
• Civic engagement A survey question asked respondents whether they participated in 15 differenttypes of civic organizations, ranging from burial societies to environmental groups to youth andsports clubs. Each respondent was assigned to one of three categories, based on the number ofgroups to which they belonged. [A complete list of the groups and a full description of the scale isincluded in the appendix.]
• Party membership This dichotomous variable measured whether the respondent was a dues-paying member of a political party (coded 1), or not (coded 0).
• Political knowledge A scaled variable that roughly measured how much basic informationrespondents had about government. Questions in the survey asked respondents how thepresident was elected, which branch of government decided whether laws were constitutional andwhat the primary responsibility of Parliament was. Additionally, respondents were asked if theyhad “heard of” various government institutions and programs. Each correct answer and “heard of”mention was counted. The result was an eight-point scale.

16
• Experience with crime A dichotomous variable that measured whether the respondent hadreported being the victim of a crime in the past five years (coded 1), or not (coded 0).
• Experiences with racism This dichotomous variable measured whether the respondent hadreported being the victim of racism in the past five years (coded 1), or not (coded 0).
Three of these variables—party membership, political knowledge and crime--emerged as
clearly associated with attitudes toward South Africa’s future. One other—victim of racism--fell
just above the <.05 threshold of statistical significance.
Table IV here
South Africans who belonged to a political party were more optimistic than those who did
not, all other factors held constant (p=.0031). It is an entirely unremarkable finding. Paying dues
to a political party can be seen as an investment –or perhaps a calculated bet--on the future of
democracy. It would have been noteworthy had party membership not been significantly and
positively related to optimism.
The second finding is both statistically significant and substantively meaningful. Victims of
crime were far more pessimistic about the future of democracy than were those who had not
been crime victims, other factors being equal (p<.0001). A simple two-way table tells the basic
story: A clear majority of those who had been victimized by crime said they were uncertain
about the future of democracy. An equally large majority of those who were not crime victims
offered the optimistic view.
These data suggest that crime particularly sours perceptions of black South Africans toward
the future. Among those blacks who have not been the victims of crime in the past five years,
62 percent expressed optimism about the future of democracy. But among black crime victims,
not even a majority—48 percent—shared this optimistic view. The impact of crime on the
attitudes of whites also is negative: Optimism drops from 47 percent to 38 percent.
One fact and several important caveats complete this discussion of crime. Victimization is
closely tied to race and to economic status. More to the point: Whites are far more likely to
report having been the victim of crime. Similarly, more affluent South Africans also are more
likely to be victimized than less affluent residents.
The differences are unsettling. Nearly half of all whites—45 percent—report they had been
the victim of crime sometime in the last five years, compared to 19 percent of blacks, 28 percent
of Indians and 20 percent of coloured South Africans.
17
Wealthier South Africans also were more likely to be crime victims. Among those who
reported monthly household incomes of less that R200 (about $35), fewer than one in five--18
percent—were crime victims. But among those who earned more than R3,000 (about $500) a
month, about a third—35 percent—had been crime victims.
It’s tempting to conclude from these facts that whites are more likely to fall victim to crime
simply because whites are wealthier. Whites experience more crime not because they are
white, but because they have more to steal.
Other findings challenge this easy conclusion. Even for controlling for income or material
wealth, whites were significantly more likely to be crime victims. About 11 percent of all black
South Africans reported monthly incomes of R3,000 or more. Among these relatively affluent
blacks, slightly more than one in four--28 percent--reported they have been a crime victim in the
past five years. The proportion of crime victims among similarly affluent whites was 48 percent.
[In a more formal test of this relationship, a logistic regression model that included as
independent variables race, age, income/economic deprivation, area of residence
(urban/suburban/rural) and education found that whites were significantly more likely than
blacks to say they had been a crime victim in the past five years (p=<.0001.]
Several important warnings must be raised about these crime data. The survey simply
asked whether the respondent had been a victim of crime in the past five years. It did not
attempt to determine the severity of the crime, or measure how often a respondent had been a
crime victim.
More detailed information about reported victimization is critical to understanding the impact
of crime on political attitudes. Someone whose lawnmower is stolen from the garage is unlikely
to despair for the future of democracy. But someone who has been the victim of an armed
robbery, a car jacking, rape or a politically motivated assault may view the government and
political system with considerably more doubt. Additionally, this simple yes/no report of
victimization may be misleading if whites are more likely to be victims of minor property crimes
but blacks are disproportionately the victims of violent crimes. It may even understate the impact
of some types of crime on a range of political attitudes, while overstating the impact of others.
Similarly, if blacks are more likely to be victims of multiple crimes than whites, this analysis is
incomplete. The fact that in this survey, crime victimization has more of an impact on African
attitudes than on white views hints that a more complete set of questions might tell a clearer and
even more compelling story about the relationship between crime and attitudes toward
democracy.
18
The measure of political knowledge and awareness also was statistically significant
(p=.0017), suggesting a positive relationship between knowledge and optimism. One other
variable—victim of racism—should be briefly mentioned. Experience with racism, like crime
victimization, reduced the probability that an individual would be optimistic about the future of
democracy. But this variable came close (p<.0758) but did not meet the traditional .05
threshold.
All the demographic variables that were significant in Stage 1 remained significant, as Table
V indicates.
Table V here
Step 3: Political Attitudes
We now examine how political attitudes combine with experiences and demographic
characteristics to predict attitudes toward the future of democracy in South Africa.
Where to begin? More than 50 questions in the Independent Newspapers-Kaiser survey
would appear to tap some politically relevant attitude. Often, several questions addressed the
same critical issue, such as views on the economy or confidence in the government institutions.
Such repetition is neither wasteful nor unwise.
That’s because related questions that track a single underlying attitude can be combined to
yield a single summary measure more powerful than any individual question. For example, a
statistical technique called factor analysis revealed that those who expressed high levels of
confidence in the Parliament also were highly trusting of provincial and local governments and
the civil service. At the same time, those with little confidence in one institution consistently
expressed similarly equal mistrust in the others.
Those findings suggest these questions may tap into a broader underlying concept, which I
shall call confidence in political institutions, and the questions can be combined into a single
summary scale. This new summary variable then can be included in the model to see if
individuals with low levels of confidence in political institutions were more or less likely to be
optimistic about the future of democracy than those with higher levels of confidence.
The following summary scales were developed to measure other key concepts, attitudes
and beliefs that might be expected to predict attitudes toward the future of democracy in South
Africa: [The appendix lists the exact wording of question used to create each scale. Cornbach’s
Alpha statistic for each scale also is reported in the appendix. This statistic is useful in

19
evaluating whether the questions used to create a scale do measure the same underlying
attitude.]
• Perceptions of the Economy and Economic Performance A 7-point additive scale that measuresoverall perceptions of economic performance. It combines the responses to questions that askedwhether the respondent’s personal financial situation had gotten better, worse or stayed the same inthe past five years, and whether the respondent believed that the national and local economies hadgotten better, worse or stayed the same.
• Confidence in Major Institutions A scale that ranged from 0-11 measures overall confidence in 11major institutions, ranging from Parliament to the churches to the media.
• Confidence in Political Institutions A 17-point additive scale that measures how much confidencerespondents had in four political institutions: the Parliament, their provincial government, the civilservice and local government.
• Confidence in Legal Institutions A 13-point additive scale summarizes questions that askedrespondents how much confidence respondents had in the court system, the police and the Army.
• Direction of the Country in the Past Five Years A 9-point additive scale based on responses toquestions that asked whether conditions have gotten better, worse or stayed the same in these areasof South African life: education, health care, race relations and the overall quality of life.
• Direction of the Country in the Next Five Years An 11-point additive scale based on questions thatasked whether conditions in the next five years will get better, worse or remain about the same inthese areas: Crime, education, health care, race relations and the overall quality of life.
In addition to these additive scales, the following variables tapping other politically relevant attitudes
were included in the model:
• Confidence in the National Government Measures level of confidence in the national governmentto solve problems, measured on a three-point scale ranging from “none” to “a lot of confidence.”
• Confidence in Other Democratic Institutions Confidence in trade unions and the media wereentered into the model as a separate variables. Degree of confidence was measured on a five-pointscale that ranged from a “great deal” to “none at all.”
• Attitudes toward Voting Agreement with the statement, “Voting is a waste of time,” measured on afive-point scale that ranged from “strongly agree” to “strongly disagree.”
• Commitment to Democracy A dichotomous variable in which those who said they would prefer tohave “greater financial security” and “fewer political rights” were coded 1, all others 0.
• Concerns about Personal Finances Measures level of anxiety that respondent’s family will not haveenough money to live on in 10 years, measured on a four-point scale ranging from “not at all worried”to “very worried.”
• Income Inequality A dichotomous variable in which those who believed the gap between rich andpoor South Africans had increased in the past five years, and those who did not.
• Perceptions of Housing Measures whether respondent believes the housing situation “in their area”has gotten better, stayed the same, or gotten worse in the past five years.
20
• Perceptions of Education Measures whether respondent believes education “in your community”has gotten better, stayed the same, or gotten worse in the past five years.
• Racial Traditionalism/Intolerance Agreement with the statement, “It would bother me if my childrenmarried someone of a different race,” measured on a five-point scale that ranged from “stronglyagree” to “strongly disagree.”
In addition to these attitudinal variables, the demographic variables as well as those
measuring personal experiences were entered into the final model.
The Results
Our final model suggests that optimism about the future of democracy in South Africa springs
from many and sometimes surprising sources.
Perceptions of economic performance are clearly associated with optimistic feelings about
democracy (p<.0001). The sign on the coefficient is positive, suggesting those with more
positive views of the economy are significantly more optimistic about the durability of democracy
than those with negative evaluations.
But in South Africa as elsewhere, perceptions of economic performance alone don’t shape
political attitudes. Consistent with theory and our expectations, confidence in the future of
democracy is closely tied to confidence in democratic institutions (p<.0001). Those who
expressed high levels of confidence in the 10 institutions that comprised our scale also
expressed significantly more confidence in the ability of democracy to endure.
A deeper look at institutional trust suggests a more nuanced story. A factor analysis
suggests that overall confidence in insititutions is itself composed of two distinct underlying sets
of views. This finding argues against using a single variable to measure confidence in
institutions. The first factor identifies a set of similar attitudes toward Parliament, the civil service
and provincial and local governments, which can be broadly viewed to reflect confidence in
political institutions. The second factor suggests that attitudes towards the courts, police and the
army are based on a common, underlying concept measuring confidence in judicial and law
21
enforcement institutions.14 Additionally, we test whether attitudes toward the media
independently influence levels of optimism.
A logistic regression analysis found that confidence in the national government was closely
associated with optimistic views (p<.0001). So was confidence in parliament, the civil service
as well as provincial and local governments (p=.0007). Confidence in trade unions also was
significantly correlated with optimistic views (p=.0172). This association is expected. Trade
union leaders and their members were at the forefront of the struggle against apartheid. Today,
unions are deeply involved in South African politics. South Africa currently is governed by a
tripartite alliance between the ANC, the South African Communist Party and the Congress of
Trade Unions. Confidence in the media was not closely associated with feelings of optimism
(p=.9805).
Confidence in judicial/law enforcement institutions also was statistically significant
(p=.0181). But the sign was negative, suggesting that as confidence in these institutions
declines, optimism about the future of democracy increases. This might seem puzzling, except
to those familiar with the bleak history of the police, courts and the army under apartheid. Part
of the answer is that the black majority who suffered most at the hands of the police, army and
the courts under apartheid also now are among the most optimistic about the future of South
Africa. Indeed, one of the major challenges facing South Africa remains to instill public
confidence in the judiciary and police. It is a job made more difficult by recent public disclosures
of the worst sort of state-sanctioned brutality, as revealed in recent testimony before the Truth
and Reconciliation Commission.
Measures of democratic orientation and commitment to democracy also were highly
associated with optimism. Consistent with our expectations, those who strongly rejected the
statement that “voting is a waste of time” were more likely to be optimists than those with less
firmly held convictions (p=.0037). The relationship between commitment to democracy and
optimism was even stronger: Those who said they were willing to trade freedoms for increased
22
financial security were significantly more likely to doubt that democracy would endure than other
South Africans (p<.0001).
South Africans look to the future, not to the past, to assess whether democracy will survive.
Those who believed that things would get better in the areas of education, race relations, health
care and overall quality of live were significantly more likely to be optimistic that those who
expected things to stay the same or get worse (p=.0004). The parallel scale that asked
respondents whether things had gotten better, gotten worse or stayed about the same in the
past five years proved to be unrelated to their views on the prospects of democracy (p=.9919).
Because the two scales are moderately correlated, the model was run twice, alternately
dropping one or the other scales from the variable list. The substantive finding remained the
same: How people viewed the future was significantly related to optimism, the retrospective
view was not.
These demographic variables also emerged as significantly related to optimism in the final
model, all other factors being equal: Age (p=.0065), economic deprivation (p=.0152), race/black
(p<.0001), ethnicity (Zulu and Xhosa, both p<.0001), rural resident (p=.0314), as well as
whether the respondent had been a crime victim (p=.0240). The variable measuring political
knowledge came close, but did not meat the formal .05 test of significance (p=.059). Party
membership dropped out of the model (p=.3531), an unremarkable finding since the attitudes
closely associated with party membership were included as independent variables in the third
stage of the model.
Table VI here
Table VII here
Which of these factors matter most in shaping attitudes toward the future of democracy?
Statistical significance identifies relationships between variables. It is an unreliable measure of a
23
variable’s substantive impact. Do judgements about the economy matter more—or less—than
attitudes toward political institutions?
One way to answer these questions is to standardize the coefficients of all the statistically
significant variables in the model and then rank order them by size, as in Table V. While the
coefficients remain uninterpretable except to those acquainted with such mathematical arcania
as log notation and odds ratios, the ranking easily conveys two critical pieces of information.
The relative size of the coefficient suggests the overall predictive power of that variable,
relative to the other variables in the model. The sign (+ or -) indicates whether a change in that
variable is positively or negatively related to a change in the overall likelihood that a South
African was an optimist about the chances of democracy in the post-Mandela era.
Thus being the victim of a crime diminished optimistic feelings. An increase in confidence in
trade unions increased the probabilities that a South African would be an optimist. But the
impact of these variables paled in comparison to the negative impact of being a Xhosa, or the
positive impact of being an black South African who was not a Xhosa or Zulu.
Coefficients Table VIII here
Coefficients Bar Chart Table IX here
Respondent 1,173
The distinct advantage of logistic regression is that it reveals how multiple factors combine
together to predict an outcome. In this instance, our model computes the probability that a
person with a specific set of demographic characteristics, life experiences and political attitudes
is optimistic about democracy surviving in the post-Mandela era.
The distinct disadvantage of logistic regression is that the estimate of each variable’s impact
is incomprehensible, except to the statistically savvy. Thus table VIII, which ranks the variables
24
by their standardized coefficients, suggests the relative predictive power of each variable. But it
does little to help us understand what the impact is.
There is, however, a way to render these results more comprehensible, if not more
meaningful. We first select a single case and compute the probability that this individual is an
optimist using the variables in our model. Then we will change one of the variables in our model
but leave the others untouched. Then we re-compute the probability of being an optimist, and
compare this adjusted probability to the original. The difference is the impact of this single
variable in response to this single change, holding all others constant (unchanged). Doing
similar manipulations to the other variables allows us to show the relative impact of each
statistically significant variable in our model.
Case 1,173 was chosen at random to illustrate these effects; any of the 3,000 respondents in
the sample could have been selected and the results would have been the same.
Respondent 1,173 is a 33-yearold Xhosa woman who lives in the Eastern Cape Province.
She has little faith in the national government but somewhat more confidence in local and
provincial leaders. She believes the South African economy has declined in recent years, and
thinks the gap between the rich and poor in South Africa is widening. She’s not been a victim of
a crime in the past five years. She thinks that the quality of life in South Africa will improve, and
says she would not be bothered if her children married someone of a different race. She said
she’s uncertain about the future democracy in South Africa, and our model captures that
uncertainty. Overall, the model estimates there is a 46 percent probability that she is an optimist
and a 54 percent probability that she’s not, nearly a toss-up.
Table X illustrates the how this probability changes, often substantially, in response to
changes in the value of a single variable. For example, Respondent 1,173 said she was “very
worried” about whether her family would have enough money to survive over the next 10 years.
But what about a person similar to Respondent 1,173 in every way but one: Instead of being
concerned about her family’s finances, she said she was not worried? As the table shows, the

25
chances she was an optimist would increase from 46 percent to 62 percent—a 16-percentage
point increase and a clear illustration of the powerful relationship between pocketbook worries
and political optimism.
As Table X indicates, the corrosive impact of mistrust on optimism also is considerable.
Respondent 1,173 said she little or no confidence in the ability of the national government to
solve problems. Respondents who were like her in every way except that they expressed a “lot”
of confidence in the Pretoria government had a 59 percent probability of being an optimist, a 13-
point increase in positive feelings.
It should be no surprise that race and ethnicity matter. Zulus were 18 percentage points
less likely to be optimists than other Africans. The decline in optimism associated with being a
Xhosa was even more stunning: a net drop of 28 percentage points, all other factors held
constant. Expressed another way, our model suggests that the probability that an African who
was not a Xhosa or a Zulu and was identical to Respondent 1,173 in all other ways would be 74
percent, not 46 percent. Even more surprising, this model suggests that a white South African
who was identical to Respondent 1,173 in all other ways would be nearly 10 percentage points
more likely to believe that democracy will survive.
This last result suggests this question: Is this overall model generally applicable to whites
and to black South Africans? Or do very different factors shape attitudes of whites and blacks
as they look to the future? The next section addresses these questions.
Table X here
White and Black South Africans
Looking at black and white South Africans separately confirms much of what we already have
learned from the general model while adding important details.15 Perceptions of the national
government, the willingness to trade rights for financial security, their own economic situation
26
and concerns about their family’s economic future are associated with the views of both black
and white South Africans about the future of democracy in their country.
The small number of whites in the total sample--581 whites and 2,018 blacks were
interviewed—makes analysis difficult and comparisons incomplete. However, these analyses do
identify some telling differences. Perceptions of economic performance were a consistent and
strong predictor of optimism for blacks (p=.0030), but not for whites (p=.8810). Party
membership was of little use in directly predicting optimism among blacks (p=.7394), but
significant in the white sample (p=.0338). Conversely, confidence in trade unions was significant
for blacks (p=.0267) but not for whites (p=.9027).
As indicated earlier, the impact of age on optimism differed by race. For blacks, optimism
diminishes with age, with younger blacks significantly more hopeful than their elders. For whites,
the pattern is more complex. Optimistic feelings ran relatively high among older South Africans
(61+) and those younger than 26. But whites between the ages of 25 and 45—and particularly
those 36 to 45 years old—were significantly more pessimistic (p=.0059).
Some variables that tested as insignificant in the general model emerged as significant when
blacks and whites were analyzed separately. Whether a South African lived in the city, the
suburbs or in a rural area appeared to be largely unrelated to attitudes toward the future of
democracy. In fact, the race analysis suggests locale does matter--though in precisely opposite
ways for blacks and white South Africans. Whites living in cities are more optimistic about the
future than those in rural or suburban areas. The contrary is true for blacks: Those living in the
city are more pessimistic about the future than those living in the suburbs or country.
Likewise, political knowledge, which just failed to achieve statistical significance in the
general model, is clearly a predictor of optimism among blacks (p=.0088) but not among whites
(p=.2794). The signs also are reversed: Higher levels of political knowledge and awareness
among blacks were associated with higher levels of optimism. The sign of the coefficient among
whites was negative, albeit statistically insignificant.
27
Other findings were even more unexpected. These data suggest that personal experience
with crime directly and profoundly affects the attitudes of Africans toward the future of
democracy--but not of whites, who were more likely to report being crime victims. Among
blacks, the relationship between optimism and being the victim of a crime was statistically
significant (p=.0009) and substantively meaningful. The coefficient on the crime variable for
blacks was nearly twice as large as in our general model
(-.4306 versus -.2289) . Translated into a more intelligible form, this result suggests that an
African who had been the victim of a crime was about ten percentage points less likely to be an
optimist than other blacks. Among whites, the crime variable was statistically insignificant
(p=.9245) and the estimated coefficient was trivial: -.0214.
The race analysis revealed other surprises. Africans look to the future, with expectations
more than past performance shaping their views on whether democracy will survive, these data
suggest. The story among whites is not so straightforward, though the data hint that white South
Africans look to the past and not to the future to inform their judgements.
As described in detail earlier, two variables captured those contrasting perspectives. The
first variable measured whether respondents thought that education, health care, race relations
and overall “quality of life” had gotten better, worse or stayed the same in the past five years.
The second measure whether respondents believed that things would get better, get worse or
stay the same in the same four areas, plus crime, over the next five years.
The prospective view was highly significant for Africans (p<.0001), but not for whites
(p=.8889) . While the retrospective view failed neither to achieving statistical significance for
either blacks or whites, it came closest among whites (p=.1388) than blacks (p=.8016). While
such speculation is risky, these numbers suggest that if the white sample been as large as the
black sample, these numbers might tell a story that ran something like this: Whites judge the
stability of democracy by looking to the past while blacks look to the future.

28
One final note. Analyses suggest that economically disadvantaged Xhosa are significantly
more pessimistic than similarly poor South Africans. An interaction variable was created to
model this difference, and it proved to be statistically significant (p=.0292) and negatively
associated with optimism. At the same time, the overall economic disparity variable ceased to
be significant (p=.4598) when the interaction variable (poor and Xhosa) was included in the
black model.
This suggests that economic disadvantage is strongly and negatively associated with political
optimism among Xhosa. But among other black South Africans, the link is, at best, weak; in fact,
the poor of other tribes are generally optimistic about democracy, the survey found.
This finding is revealing. Xhosa are among the poorest of the poor in South Africa. In this
sample, 42 percent of all Xhosa languished in the bottom quartile in terms of economic
deprivation. In comparison, only 21 percent of all Zulus and 28 percent of all blacks were
similarly impoverished.
These numbers also help explain why Xhosa are so pessimistic about the future of
democracy in South Africa. Expectations for a better life surged among the Xhosa after
Mandela, himself a Xhosa, was elected president in 1994. Five years later, many Xhosa remain
desperately poor.
Discussion
Taken together, these three statistical models tell a complex and nuanced story underscoring
the challenges South Africans confront in the post-Mandela era.
More importantly, they suggest some of the ways that politicians and policymakers can attempt
to nurture and deepen democracy in South Africa.
Not surprisingly, these data strongly suggest a robust national economy and feelings of
financial wellbeing nourish optimism about the future of democracy.16 Unfortunately, some
scholars suggest that the South African economy is too fragile to sustain democracy. Adam
29
Przeworski and his colleagues studied the birth-and-death cycles of political regimes in 135
countries between 1950 and 1990. This remarkable study broadly quantified how rich a country
must be to support democracy. The numbers do not augur well for South Africa.
Przeworski estimated that a democracy could be estimated to last about 8.5 years in a
country with an annual per-capita income of less than $1,000. They predicted an average “life
span” of 16 years in a country with a per-capita income between $1,000 and $2,000; 33 years
between $2,000 and $4,000 and 100 years between $4,000 and $6,000.17
With a per-capita income of about $3,200—actually less than in 1985--democracy in South
Africa would seem to have less than four decades to live. Other data tell a similarly ominous
story. Przeworski found that democracy typically persists for little more three decades in
countries that shared South Africa’s current annual growth rate of about 2 percent.
Economic inequality clearly threatens the consolidation of democracy in South Africa, apart
from overall perceptions of the economy. Those who believed the gap between rich and poor
had increased were significantly more likely to be uncertain or pessimistic about the future of
democracy in South Africa, the Independent Newspapers-Kaiser survey results found.
South African survey researchers Robert Mattes and Hermann Thiel explain why this is so.
“In a poor and grossly unequal society, it is difficult to preach about the value of democracy for
realizing individual dignity and freedom. People struggling to meet basic needs have little time
or energy to spend worrying about the survival of democracy. They may see little value in the
formal political equality delivered by democracy if their lives continue to be dominated by
extreme inequality or grinding poverty.”18
South African economists report some progress closing the income gap, though not between
the rich and the poor—the gap that really matters--but between the rich and the middle class.
Julian May of the University of Natal told Reality Check reporter Karen MacGregor that income
redistribution “has been from the richest to middle-income households, not to the very poor.”
30
Overall, the poorest 40 percent of households still account for 11 percent of total income, while
the richest 10 percent earned more than 40 percent of the income.19
Thus pressures are predicted to build for some form of redistribution of wealth, a decidedly
risky move that could scare off international investment and a policy that Mandela and the ANC
abandoned in the mid-1990s. The survey found little support for taking money from the rich and
giving it to the poor, but great appetite for less biting and more popular forms of wealth transfer.
“The demands of the majority are of the population are far more modest,” wrote Reality
Check reporter Judith Soal. “Compensation for land taken under apartheid; subsidized services
for poor suburbs; free water for the very poor; a stretch of land for people who have worked on
farms all their lives.”20 Mbeki has charted an economically conservative economic course to
keep favor with the world’s investors. Yet the troubling persistence of great poverty grinding
against great wealth may renew demands for more overt kinds of redistributive schemes.
Democracy in South African faces other daunting challenges. The survey results suggest that
crime is killing democracy in South Africa, or at least it is dampening the expectations that
democracy will survive. A notable result of this analysis has been to quantify the direct impact of
crime on political attitudes. Experience with crime directly affects black attitudes. But that
doesn’t necessarily mean that whites are unaffected, though it does suggest that the impact of
crime on whites may be more indirect, perhaps working to erode confidence in government and
other institutions.
Complicating efforts to combat crime is the distinct lack of confidence that South Africans
have in their courts and police. Even more troublesome is the willingness of many South
Africans to believe that the law should be ignored if it does not “produce the desired outcome,”
report James L. Gibson and Amanda Gouws—a fact of political life that they note with academic
understatement “may be ominous for the future of South African democracy.”21 Indeed, they
claim on the basis of an analysis of recent survey data that “support for the rule of law among
South Africans is not particularly widespread.” Only half of all South Africans surveyed in 1996,

31
for example, disagreed with the statement, “Sometimes it might be better to ignore the law and
solve problems immediately rather than wait for a legal solution.” And only a third rejected the
belief that “It’s all right to get around the law as long as you don’t actually break it.” 22
Policymakers also should note that tough anti-crime measures, even if successful, would be
useless if they are not part of an overall package to strengthen the economy and boost
confidence in government and democratic institutions. This analysis suggests there is a clear
payoff to crime reduction. However the overall impact of crime on optimism pales when
compared to the potential benefits from economic and political reforms.
Other findings of this analysis raise cautionary notes. Zulus and Xhosas, the two largest and
politically influential tribes in South Africa, both remain deeply uncertain about the future of
democracy. Such pessimism may not surprise students of South African politics and culture.
The impact of this uncertainty is more unexpected. Our statistical model suggests that tribal
affiliations have a greater negative impact on optimism than any other single variable. This
suggests the future of democracy in South Africa may depend, at least in part, on bringing real
peace to these traditional rivals and generally avoiding a tailspin into tribalism that has plagued
other emerging African democracies. (Several South African journalists have suggested another
potent source of inter-tribal conflict. While the Xhosa and Zulu command the political stage, they
occupy parts of the country largely bereft of mineral resources. Tribes in the diamond, gold and
platinum producing regions may come to resent a government dominated by Xhosa and Zulu.)
Democracy also faces challenges from unexpected fronts. Expectations for the future run
high in the new South Africa, both among blacks and whites--perhaps too high. Among blacks,
these positive expectations are directly tied to their feelings about democracy. The danger is
that these high expectations are merely setting the stage for a backlash, if and when these
hopes are unfulfilled.
Patience, not rosy predictions of better future, may be key to deepening democracy. Richard
Rose, William Mishler and Christian Haerpfer have studied former communist regimes. They

32
found that countries where the people believed it would take years for government to deal with
the problems inherited from communist rule were twice as likely to reject all authoritarian options
than those who were “definitely” impatient. Significantly, they found that their “patience” variable
was about as strong as any economic variable in predicting a desire to abandon democracy.23
Other forces initially helpful to democracy may, in time, work against it. The ANC claimed
66.3 percent of the vote in the last election and came within a hair of winning the two-thirds
majority that would have allowed it to amend the constitution and, some feared, insert provisions
to solidify further—and perhaps forever—ANC’s hold on power. Even without a constitutional
rewrite, the continued success of the ANC could transform South Africa into just another one-
party African democracy that is a democracy in name only.
Political scientist Pippa Norris has reviewed survey data from dozens of countries and found
that one-party domination erodes democratic values. “Evaluations of the political regime reflect
our experiences of whether we are winners or losers over successive elections,” further noting
that “cynicism is highest in countries which produce many persistent losers over successive
elections, for example, systems governed by one-party predominant parties facing a fragmented
opposition.”24
Even before the June election, surveys of South Africans hint at the corrosive effect
described by Norris. In 1995 and 1997, national polls in conducted in South Africa by the
Institute for Democracy found that “[t]hose who support parties that are out of power not only
have especially negatives views of government performance, but also take a negative view of
the representativeness of government, according it less legitimacy and are less satisfied with
the way in which democracy works.”25
Thus signs of instability within the ANC perhaps may be a positive sign, if the result is the
birth of a loyal opposition party--and if that birth is not attended by the bloodshed that too often
has been a feature of South African partisan politics. Currently the ANC occupies the political
middle ground, facing a gaggle of small parties to its right, but no credible threat from the left.

33
Some observers speculate that the powerful trade unions, increasingly unhappy with ANC
economic policies that produced massive unemployment and layoffs but anemic economic
growth, may break away to fill the void on the left. Others, however, caution, that the ANC has
shown an historic willingness to reward its political allies while freezing out its enemies, a fact
that may keep unionists from straying from the fold.
Certainly, the lop-sided majorities of South Africans who express support for fundamental
democratic values are a persuasive argument to be optimistic about democracy’s future. These
promising findings, however, must be interpreted with great caution. That’s because what
researchers call “unconditional commitment” to these values is far from universal: When asked if
they would trade fewer freedoms for greater financial security, a majority of South Africans took
the money.
Similarly, when support for a range of democratic values were tested, only one—the principle
that voting must be a “secret and private matter— evoked “strong” support from a majority of
South Africans. Even here, only 57 percent indicated unconditional commitment to the secret
ballot. Smaller proportions said they strongly agreed that “the right to vote…is the essence of
democracy” (48 percent) or unequivocally supported the belief that a “strong opposition” was
“necessary for good government” (39 percent). Perhaps more troublesome, not even half—45
percent—strongly disagreed that “voting is a waste of time.”26
Other results also reveal a still-fragile commitment to democracy, particularly when idealized
values collide with realpolitik. Three in 10 agreed that "if a community supports one political
party, other parties should not be allowed to campaign in that area." It is a view likely born of
the chronic and extreme violence—most recently, between Xhosa and Zulus--that has
historically defined South African politics. Today, tensions between blacks and whites are not
the only tears in South Africa’s social and political fabric. Again, inter-tribal rivalries continue to
complicate the transition to democracy.
34
Other surveys have tested South Africans’ commitment to democracy norms, with somewhat
unsettling results. In 1995 and 1997, surveys conducted by the Institute for Democracy in South
Africa asked respondents this question to measure levels of “steadfast commitment to
democracy”: “Sometimes democracy does not work. When that happens, some people say we
need a strong leader that does not have to bother with elections. Others say that even when
things don’t work, democracy is always best. Which do you think?”
The results were at once encouraging and dismaying. The proportion of South Africans who
believed democracy was always best increased from 47 percent to 56 percent. Among blacks,
commitment soared, rising from 47 percent to 61 percent while among coloured South Africans,
the increase was more modest, from 46 percent to 53 percent.27
At the same time, unconditional support of democracy plummeted among the white and
Indian minorities, falling from 45 percent to 39 percent among whites and from 55 percent to 27
percent among Indians. While equal proportions of blacks and whites expressed commitment to
democracy in 1995, they appeared to have broken ranks and heading in opposite directions just
two years later.
It’s much too early to bury democracy--even though a casual reading of the scholarly
literature suggests that many academics already have dug the grave. Yale historian Leonard
Thompson noted in Foreign Affairs that Mbeki must overcome “stupendous odds” to navigate
South Africa to safe harbor. 28 South African researchers Mattes and Thiel agree: “South
African democrats may need to start working on a second miracle.”29
Perhaps. Despite those ominous pronouncements, South Africa remains the most successful
economy on the continent and is Africa's most industrialized nation (though the International
Monetary Fund still classes it as being in a stage somewhere between “developing” and
“developed”). It has in place a well-trained and functioning professional and managerial class.
Much wealth still remains locked deep in the dry earth of the Veldt; at the same time, new high-
tech industries are beginning to rise out of the old economic order.

35
In June, South Africa conducted its second free presidential election, the capstone to a
campaign season marked by far less violence than the first. Today, the “politics of charisma”
that characterized the Mandela era has given way to “the politics of management and
governance” under Mbeki.30 Already, Mbeki has taken steps to strengthen the criminal justice
system to combat crime, root out corruption and generally improve delivery of basic government
services to the people. Finally, South Africa still commands the attention and admiration of the
world. Western powers have invested too much in democracy in South Africa to stand by and
watch it fail.
It is demonstrably true that the Mandela government failed to deliver on many of its economic
promises, notably his pledge in 1994 to build a million new houses in five years for the country’s
seven million homeless. Still, as Roger Friedman of the Cape Times noted, nearly 800,000 new
houses will have been built by the end of 1999. Similarly, school doors now open to black
children as well as whites, the necessary first step in creating a multiracial pool of skilled
workers. Wells were dug. And electricity came to Buntingville.
“Well, today I can push a button to light my house,” Ethel Mzinjana, 80, told Reality Check
reporter Eric Ntabazalila. “To me, electricity was a dream. No one here ever thought of having
electricity in their houses. Today, children can go to the clinic free of change. There are more
schools being built . . . .”31
Mzinjana is not alone: Between 1994 and 1998, the government estimates that 2 million
South African households were linked to the power grid.32
The economy also has grown, albeit slowly. This year the government insists that growth will
reach 3.5 percent.33 Any growth might be remarkable, given the twin challenges Mandela and
his government faced. While leaders in Pretoria battled to control inflation (successfully) and
unemployment (unsuccessfully), the government also faced the potentially explosive challenge
of transforming the economy from one designed to funnel wealth to a select few into an engine
of prosperity for all.
36
Expectations do remain high, perhaps dangerously high. But there is evidence that the past
five years may have forced people to ratchet down their expectations. “I can see a lot of things
aren’t being delivered,” said Asha Sanparsad of KwaZulu-Natal’s Dolphin Coast. We were told
that after the last elections we would be in a bed of roses. We now realize this takes time,
nothing happens overnight.”34
There may be a consensus forming that real change will happen slowly. More than six in
10—63 percent—in the ING-Kaiser survey said “it will take a long time, but we will eventually
become a united nation” while one in five said “South Africans will always be divided.”
As South Africans look to the future, either with optimism or trepidation, they should
remember the recent past. “Looking back at the perils of 1994, there can be no doubt that we
are through the worst,” wrote South African journalist Allister Sparks. “And when you have
escaped Armageddon, it is no time to become a pessimist.”35
As for those who say it will take a second miracle to firmly root democracy in South Africa,
former President Nelson Mandela might only smile and say, just wait.
“We can and shall build the country of our dreams,” Mandela said in his last major address to
Parliament in February. ”As we confounded the prophets of doom, we shall defy today’s
merchants of cynicism and despair.”
I gratefully acknowledge the insights of professors Pippa Norris and Thomas Patterson of theShorenstein Center for Press, Politics and Public Policy at Harvard University; the analytic andtechnical assistance of research coordinator Tami Buhr of the Shorenstein Center, and thehelpful comments of South African journalists Dennis Cruywagen and Newton Kanhema. I alsoam indebted to Mollyann Brodie of the Henry J. Kaiser Family Foundation, who made thoughtfulsuggestions to an earlier version of this paper, and to Michael Sinclair of the Kaiser FamilyFoundation, who introduced me to South Africa.
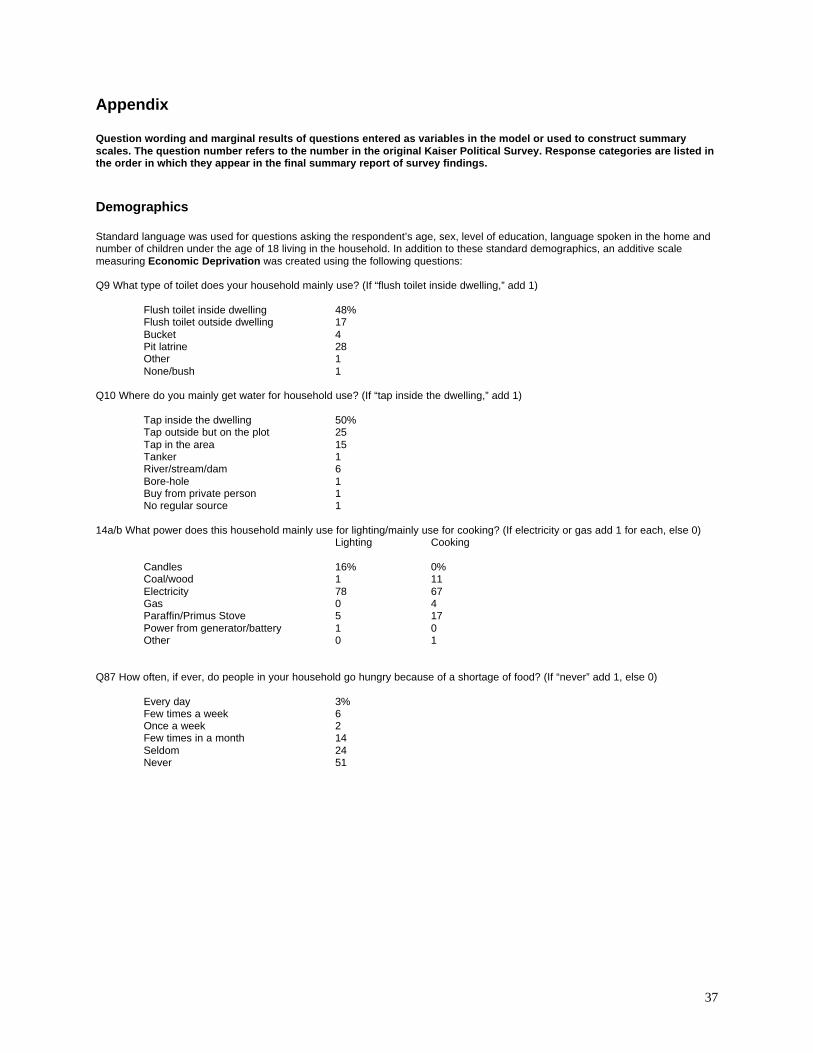
37
Appendix
Question wording and marginal results of questions entered as variables in the model or used to construct summaryscales. The question number refers to the number in the original Kaiser Political Survey. Response categories are listed inthe order in which they appear in the final summary report of survey findings.
Demographics
Standard language was used for questions asking the respondent’s age, sex, level of education, language spoken in the home andnumber of children under the age of 18 living in the household. In addition to these standard demographics, an additive scalemeasuring Economic Deprivation was created using the following questions:
Q9 What type of toilet does your household mainly use? (If “flush toilet inside dwelling,” add 1)
Flush toilet inside dwelling 48%Flush toilet outside dwelling 17Bucket 4Pit latrine 28Other 1None/bush 1
Q10 Where do you mainly get water for household use? (If “tap inside the dwelling,” add 1)
Tap inside the dwelling 50%Tap outside but on the plot 25Tap in the area 15Tanker 1River/stream/dam 6Bore-hole 1Buy from private person 1No regular source 1
14a/b What power does this household mainly use for lighting/mainly use for cooking? (If electricity or gas add 1 for each, else 0)Lighting Cooking
Candles 16% 0%Coal/wood 1 11Electricity 78 67Gas 0 4Paraffin/Primus Stove 5 17Power from generator/battery 1 0Other 0 1
Q87 How often, if ever, do people in your household go hungry because of a shortage of food? (If “never” add 1, else 0)
Every day 3%Few times a week 6Once a week 2Few times in a month 14Seldom 24Never 51

38
Q90 What is your current employment status? (If not “unemployed” add 1, else 0)
Working full-time 33%Working part-time 7Casual/piece jobs 5Self-employed 1Unemployed 26Disabled 2Housewife 7Student 10Pensioner 9
Q2 Area and type of dwelling (coded by interviewer): (If not “informal” or “housing on commercial farm” add 1, else 0)
Metropolitan: formal 39%Metropolitan: backyard 1Metropolitan: hostel 3Metropolitan:Informal/squatter 5Urban: formal 19Urban: Informal/squatter 4Rural: Farm homestead/kraal/hut 26Rural: Housing on a commercial farm 5
Each respondent was assigned a score based on their responses that ranged from zero (maximum disadvantage) to 7 (maxiumadvantage). The scale was then collapsed to four categories.
0-2 20%3-4 265-6 297 25
Life Experiences
Civic Engagement
Q32 Which of the following clubs, societies and organizations are you a member of, if any?
Burial Society 25%Civic 3Community Police Forum 1Community development committee 3Cultural organization 2Environmental organizations 1Political organizations 8Religious organizations/churches 32Sports clubs 11Stokvel/savings clubs 11Student organizations 3Trade Union 5Women’s groups 4Youth groups 5None 34
Individual mentions were tallied and collapsed into these categories:
Number of memberships Percentage
None 34%1-7 338 or more 33
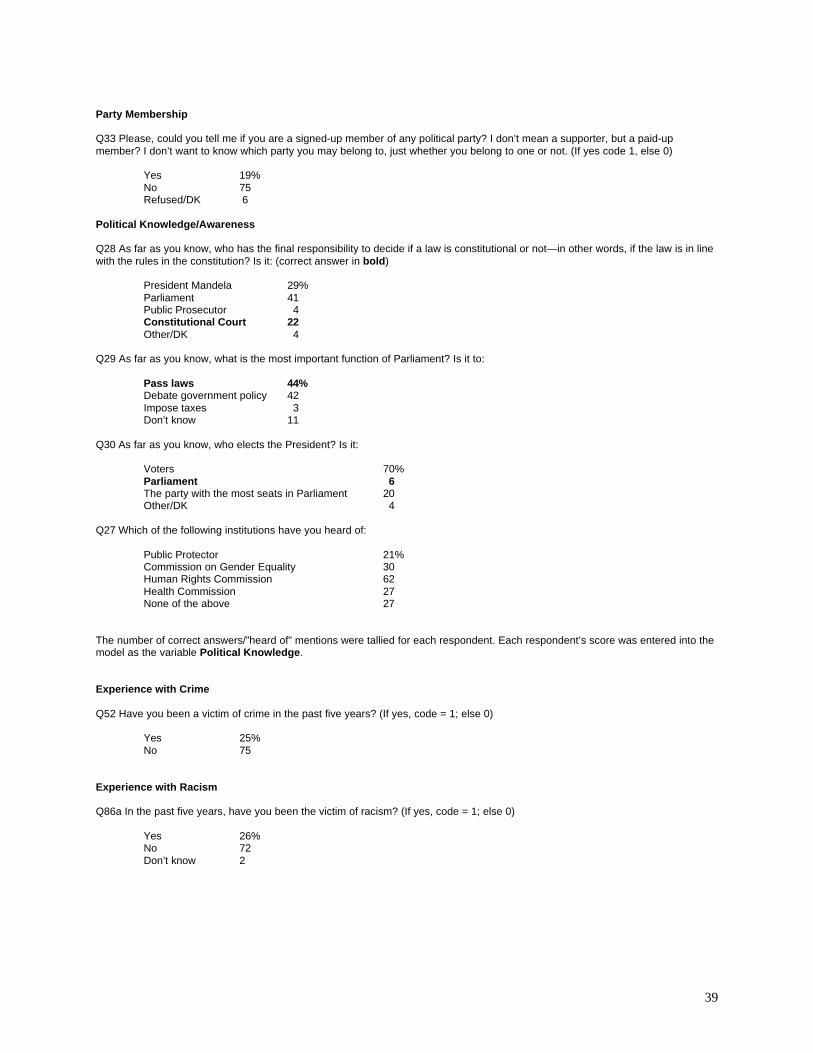
39
Party Membership
Q33 Please, could you tell me if you are a signed-up member of any political party? I don’t mean a supporter, but a paid-upmember? I don’t want to know which party you may belong to, just whether you belong to one or not. (If yes code 1, else 0)
Yes 19%No 75Refused/DK 6
Political Knowledge/Awareness
Q28 As far as you know, who has the final responsibility to decide if a law is constitutional or not—in other words, if the law is in linewith the rules in the constitution? Is it: (correct answer in bold)
President Mandela 29%Parliament 41Public Prosecutor 4Constitutional Court 22Other/DK 4
Q29 As far as you know, what is the most important function of Parliament? Is it to:
Pass laws 44%Debate government policy 42Impose taxes 3Don’t know 11
Q30 As far as you know, who elects the President? Is it:
Voters 70%Parliament 6The party with the most seats in Parliament 20Other/DK 4
Q27 Which of the following institutions have you heard of:
Public Protector 21%Commission on Gender Equality 30Human Rights Commission 62Health Commission 27None of the above 27
The number of correct answers/”heard of” mentions were tallied for each respondent. Each respondent’s score was entered into themodel as the variable Political Knowledge.
Experience with Crime
Q52 Have you been a victim of crime in the past five years? (If yes, code = 1; else 0)
Yes 25%No 75
Experience with Racism
Q86a In the past five years, have you been the victim of racism? (If yes, code = 1; else 0)
Yes 26%No 72Don’t know 2
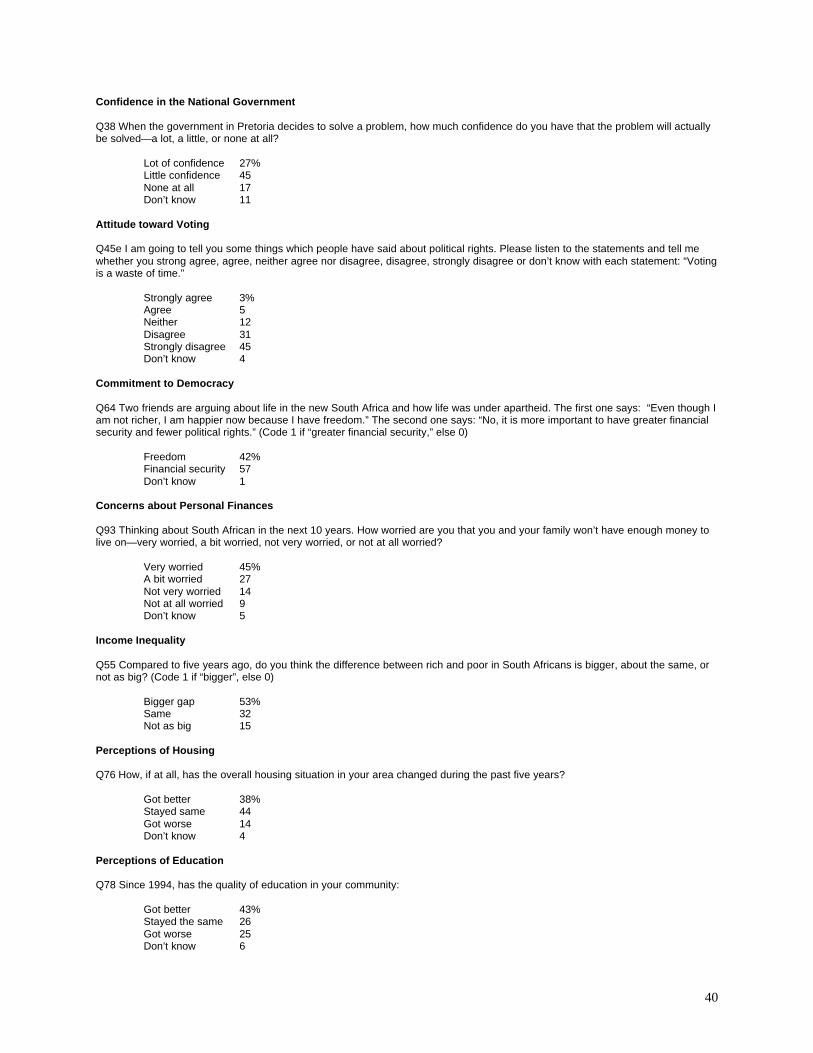
40
Confidence in the National Government
Q38 When the government in Pretoria decides to solve a problem, how much confidence do you have that the problem will actuallybe solved—a lot, a little, or none at all?
Lot of confidence 27%Little confidence 45None at all 17Don’t know 11
Attitude toward Voting
Q45e I am going to tell you some things which people have said about political rights. Please listen to the statements and tell mewhether you strong agree, agree, neither agree nor disagree, disagree, strongly disagree or don’t know with each statement: “Votingis a waste of time.”
Strongly agree 3%Agree 5Neither 12Disagree 31Strongly disagree 45Don’t know 4
Commitment to Democracy
Q64 Two friends are arguing about life in the new South Africa and how life was under apartheid. The first one says: “Even though Iam not richer, I am happier now because I have freedom.” The second one says: “No, it is more important to have greater financialsecurity and fewer political rights.” (Code 1 if “greater financial security,” else 0)
Freedom 42%Financial security 57Don’t know 1
Concerns about Personal Finances
Q93 Thinking about South African in the next 10 years. How worried are you that you and your family won’t have enough money tolive on—very worried, a bit worried, not very worried, or not at all worried?
Very worried 45%A bit worried 27Not very worried 14Not at all worried 9Don’t know 5
Income Inequality
Q55 Compared to five years ago, do you think the difference between rich and poor in South Africans is bigger, about the same, ornot as big? (Code 1 if “bigger”, else 0)
Bigger gap 53%Same 32Not as big 15
Perceptions of Housing
Q76 How, if at all, has the overall housing situation in your area changed during the past five years?
Got better 38%Stayed same 44Got worse 14Don’t know 4
Perceptions of Education
Q78 Since 1994, has the quality of education in your community:
Got better 43%Stayed the same 26Got worse 25Don’t know 6
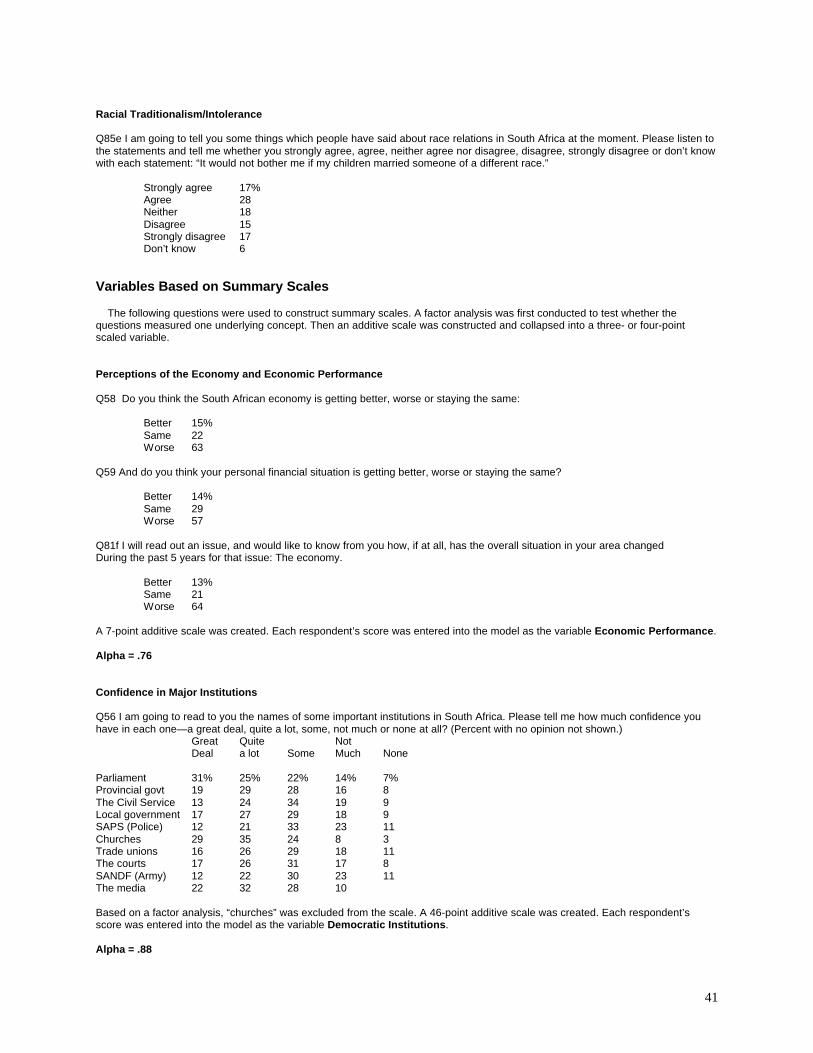
41
Racial Traditionalism/Intolerance
Q85e I am going to tell you some things which people have said about race relations in South Africa at the moment. Please listen tothe statements and tell me whether you strongly agree, agree, neither agree nor disagree, disagree, strongly disagree or don’t knowwith each statement: “It would not bother me if my children married someone of a different race.”
Strongly agree 17%Agree 28Neither 18Disagree 15Strongly disagree 17Don’t know 6
Variables Based on Summary Scales
The following questions were used to construct summary scales. A factor analysis was first conducted to test whether thequestions measured one underlying concept. Then an additive scale was constructed and collapsed into a three- or four-pointscaled variable.
Perceptions of the Economy and Economic Performance
Q58 Do you think the South African economy is getting better, worse or staying the same:
Better 15%Same 22Worse 63
Q59 And do you think your personal financial situation is getting better, worse or staying the same?
Better 14%Same 29Worse 57
Q81f I will read out an issue, and would like to know from you how, if at all, has the overall situation in your area changedDuring the past 5 years for that issue: The economy.
Better 13%Same 21Worse 64
A 7-point additive scale was created. Each respondent’s score was entered into the model as the variable Economic Performance.
Alpha = .76
Confidence in Major Institutions
Q56 I am going to read to you the names of some important institutions in South Africa. Please tell me how much confidence youhave in each one—a great deal, quite a lot, some, not much or none at all? (Percent with no opinion not shown.)
Great Quite NotDeal a lot Some Much None
Parliament 31% 25% 22% 14% 7%Provincial govt 19 29 28 16 8The Civil Service 13 24 34 19 9Local government 17 27 29 18 9SAPS (Police) 12 21 33 23 11Churches 29 35 24 8 3Trade unions 16 26 29 18 11The courts 17 26 31 17 8SANDF (Army) 12 22 30 23 11The media 22 32 28 10
Based on a factor analysis, “churches” was excluded from the scale. A 46-point additive scale was created. Each respondent’sscore was entered into the model as the variable Democratic Institutions.
Alpha = .88

42
Note: The variables Trust Media and Trust Trade Unions also were based on Q56.
Confidence in Political Institutions
Based on a factor analysis and using Q56, a 17-point scale was created that summarized attitudes toward Parliament, provincialgovernment, local government and the civil service. Each respondent’s score was entered into the model as the variable TrustPolitical Institutions.
Alpha = .88
Confidence in Legal Institutions
Based on a factor analysis and using q56, a separate 13-point additive scale was created that summarized attitudes toward thecourts, police and the army. Each respondent’s score was entered into the model as the variable Trust Legal Institutions.
Alpha = .74
Direction of Country in Past Five Years
Q81 I will read out an issue, and would like to know from you how, if at all, has the overall situation in your area changed during thepast five years for that issue? (Percent with no opinion not shown)
Got Better Stayed Same Got Worse
Education 48% 23% 29%Crime 4 11 85Health care 29 36 34Race relations 37 41 19Quality of life 30 36 33The economy 13 21 64
Based on a factor analysis, education, health care, race relations and quality of life were combined into a 9-point additive scale.Each respondent’s score was entered into the model as the variable Past Direction of Country.
Alpha = .75
Direction of Country in Next Five Years
Q82 I will read out the same list, and would like to know whether you think in the next five years things will improve, stay the sameor get worse? (Percent with no opinion not shown)
Get Better Stay Same Get Worse
Education 65% 13% 20%Crime 37 18 42Health care 55 21 22Race relations 58 25 15Quality of life 55 22 21The economy 49 17 3
Based on a factor analysis, crime, education, health care, race relations and quality of life were combined into an 11-point additivescale. Each respondent’s score was entered into the model as the variable Future Direction of Country
Alpha = .90
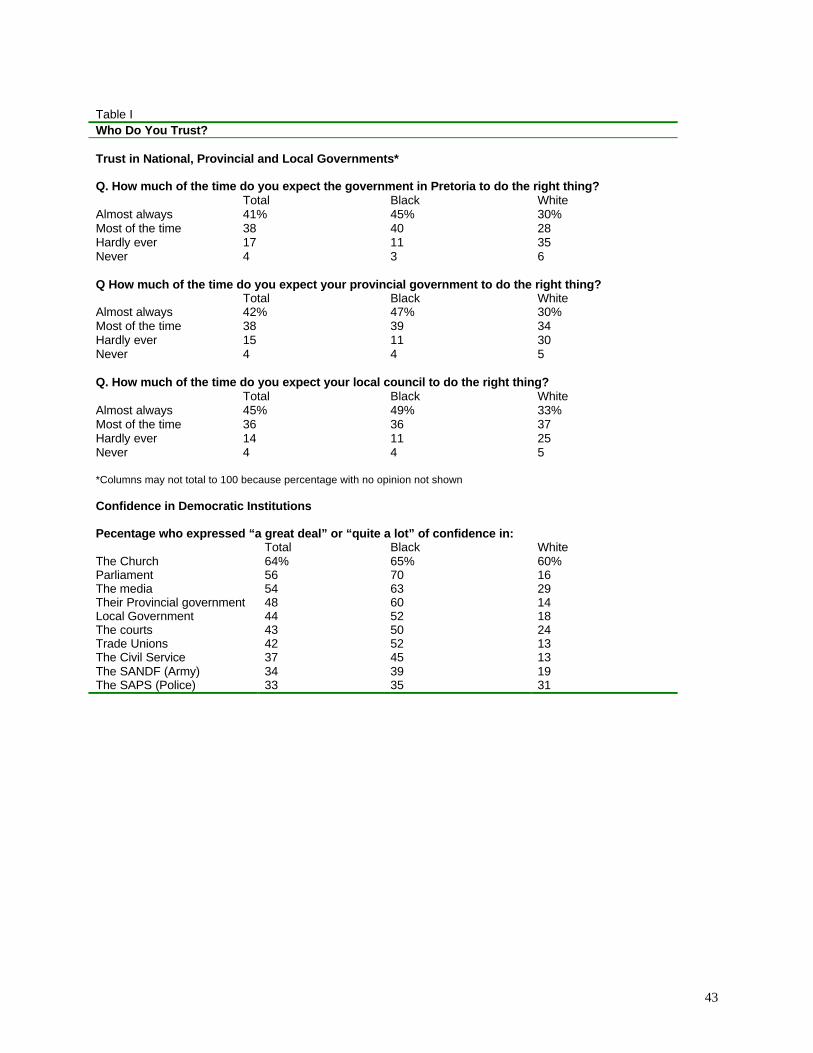
43
Table IWho Do You Trust?
Trust in National, Provincial and Local Governments*
Q. How much of the time do you expect the government in Pretoria to do the right thing?Total Black White
Almost always 41% 45% 30%Most of the time 38 40 28Hardly ever 17 11 35Never 4 3 6
Q How much of the time do you expect your provincial government to do the right thing?Total Black White
Almost always 42% 47% 30%Most of the time 38 39 34Hardly ever 15 11 30Never 4 4 5
Q. How much of the time do you expect your local council to do the right thing?Total Black White
Almost always 45% 49% 33%Most of the time 36 36 37Hardly ever 14 11 25Never 4 4 5
*Columns may not total to 100 because percentage with no opinion not shown
Confidence in Democratic Institutions
Pecentage who expressed “a great deal” or “quite a lot” of confidence in:Total Black White
The Church 64% 65% 60%Parliament 56 70 16The media 54 63 29Their Provincial government 48 60 14Local Government 44 52 18The courts 43 50 24Trade Unions 42 52 13The Civil Service 37 45 13The SANDF (Army) 34 39 19The SAPS (Police) 33 35 31

44
Table II
Demographics
Q. Thinking ahead to when President Mandela leaves office. Will South Africa remain a democraticcountry?
OptimistsUncertains
54% 46
*Those who answered “yes” to the question were classified as optimists. Those who answered “no” (8 percent) or “don’tknow” (38 percent) were classified as uncertains.
% ofSample
Demographic Group Optimists Uncertains
Sex
42% Men 54% 46%58 Women 53 47
Race
71% African 58% 42%18 White 43 57 8 Coloured 46 54 3 Indian 36 64
Language Spoken in Home
21% IsiZulu 50% 50%18 IsiXhosa 39 6118 Afrikaans 44 5612 English 42 5831 Other languages 74 26
Age
25% 18-25 61 3926 26-35 56 4422 36-45 48 5217 46-60 51 4910 61+ 48 52
Region
30% Rural 58% 42%19 Suburban 54 4641 Urban 50 5010 Informal Settlement 54 46
Education
32% 0-9 54% 46%32 10-12 54 4622 13 55 4514 14 or more 50 50
Children Under 18 in Home
28% Yes 55% 45%
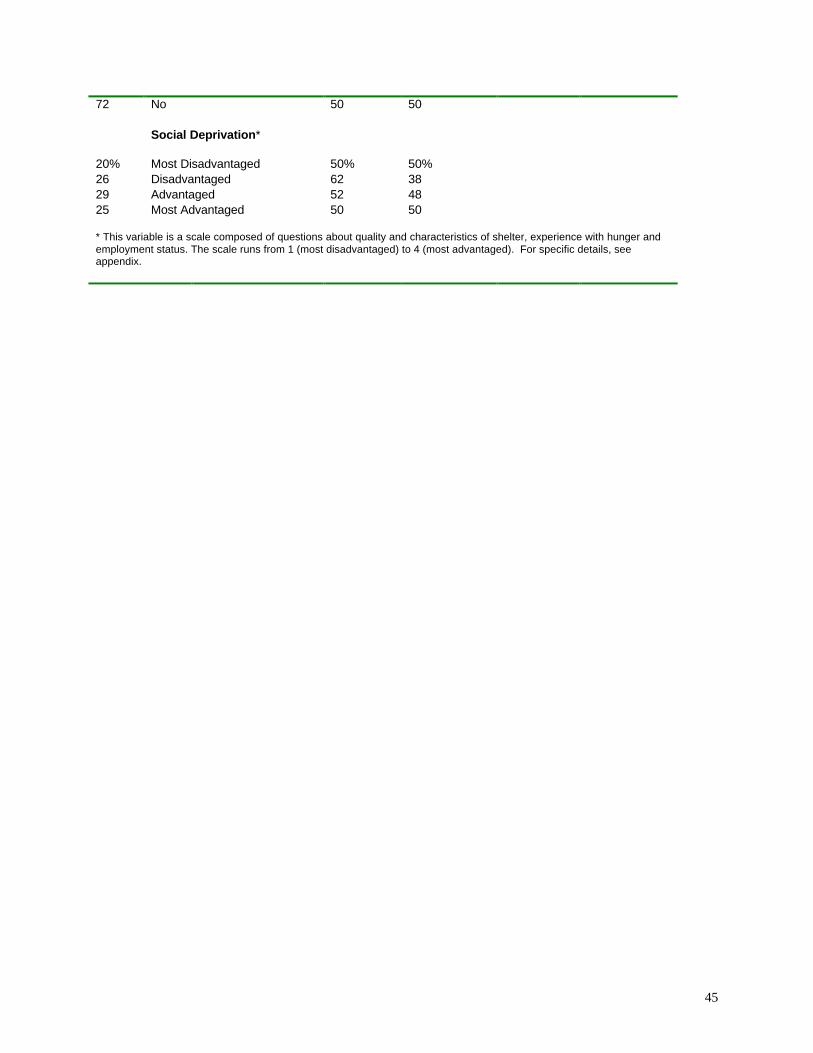
45
72 No 50 50
Social Deprivation*
20% Most Disadvantaged 50% 50%26 Disadvantaged 62 3829 Advantaged 52 4825 Most Advantaged 50 50
* This variable is a scale composed of questions about quality and characteristics of shelter, experience with hunger andemployment status. The scale runs from 1 (most disadvantaged) to 4 (most advantaged). For specific details, seeappendix.
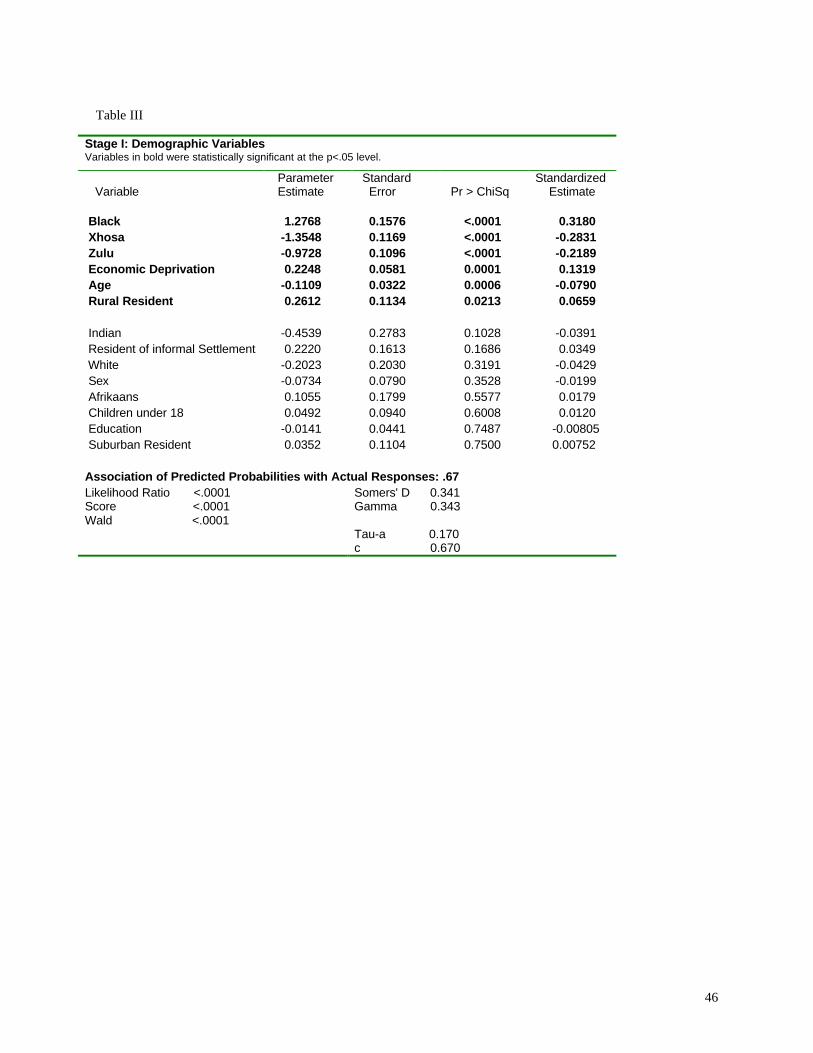
46
Table III
Stage I: Demographic VariablesVariables in bold were statistically significant at the p<.05 level.
Variable Parameter Estimate
Standard Error Pr > ChiSq
Standardized Estimate
Black 1.2768 0.1576 <.0001 0.3180 Xhosa -1.3548 0.1169 <.0001 -0.2831 Zulu -0.9728 0.1096 <.0001 -0.2189 Economic Deprivation 0.2248 0.0581 0.0001 0.1319 Age -0.1109 0.0322 0.0006 -0.0790 Rural Resident 0.2612 0.1134 0.0213 0.0659
Indian -0.4539 0.2783 0.1028 -0.0391 Resident of informal Settlement 0.2220 0.1613 0.1686 0.0349 White -0.2023 0.2030 0.3191 -0.0429 Sex -0.0734 0.0790 0.3528 -0.0199 Afrikaans 0.1055 0.1799 0.5577 0.0179 Children under 18 0.0492 0.0940 0.6008 0.0120 Education -0.0141 0.0441 0.7487 -0.00805 Suburban Resident 0.0352 0.1104 0.7500 0.00752
Association of Predicted Probabilities with Actual Responses: .67Likelihood Ratio <.0001Score <.0001Wald <.0001
Somers' D 0.341Gamma 0.343
Tau-a 0.170c 0.670

47
Table IVStage Two: Life Experiences
Total Value Optimist Uncertain
Crime25% Victim of crime past 5 years 44% 56%75 Not a crime victim 57 43
Party Membership
19% Dues-paying member of party 61% 39%81 Not a dues-paying member 52 48
Racism26% Victim of racism past 5 years 50% 50%74 Not victim of racism 55 45
Civic Engagement34% Low/few associations 49% 51%33 Medium 60 4032 High/many associations 53 47
Political Knowledge18% Two/Three Correct 52% 48%82 Not All Correct 54 46
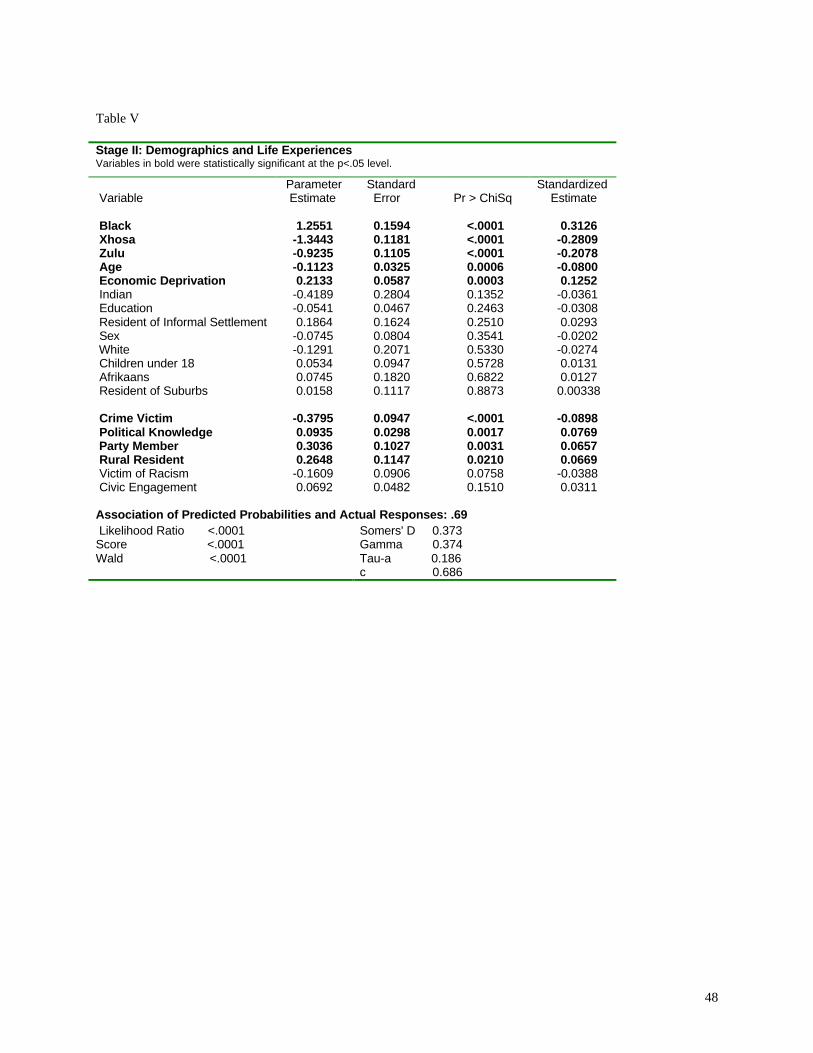
48
Table V
Stage II: Demographics and Life ExperiencesVariables in bold were statistically significant at the p<.05 level.
Variable Parameter Estimate
Standard Error Pr > ChiSq
Standardized Estimate
Black 1.2551 0.1594 <.0001 0.3126 Xhosa -1.3443 0.1181 <.0001 -0.2809 Zulu -0.9235 0.1105 <.0001 -0.2078 Age -0.1123 0.0325 0.0006 -0.0800 Economic Deprivation 0.2133 0.0587 0.0003 0.1252 Indian -0.4189 0.2804 0.1352 -0.0361 Education -0.0541 0.0467 0.2463 -0.0308 Resident of Informal Settlement 0.1864 0.1624 0.2510 0.0293 Sex -0.0745 0.0804 0.3541 -0.0202 White -0.1291 0.2071 0.5330 -0.0274 Children under 18 0.0534 0.0947 0.5728 0.0131 Afrikaans 0.0745 0.1820 0.6822 0.0127 Resident of Suburbs 0.0158 0.1117 0.8873 0.00338
Crime Victim -0.3795 0.0947 <.0001 -0.0898 Political Knowledge 0.0935 0.0298 0.0017 0.0769 Party Member 0.3036 0.1027 0.0031 0.0657 Rural Resident 0.2648 0.1147 0.0210 0.0669 Victim of Racism -0.1609 0.0906 0.0758 -0.0388 Civic Engagement 0.0692 0.0482 0.1510 0.0311
Association of Predicted Probabilities and Actual Responses: .69 Likelihood Ratio <.0001Score <.0001Wald <.0001
Somers' D 0.373Gamma 0.374Tau-a 0.186c 0.686

49
Table VI
Attitudes and Optimism
Total Optimist Uncertain Perceptions of Economic Performance
41% Low 43% 57%32 Medium 53 4727 High 70 30
Gap Between the Rich and Poor53% Got bigger in past five years 48% 52%32 Stayed the same 59 4115 Got Smaller 60 40
Worried Won’t Have Enough to Live on in 10 Years45% Very worried 46% 54%32 A Bit worried 54 4614 Not very worried 67 33 9 Not at all worried 73 27
Confidence in Political Institutions28% Low 39% 61539 Medium 52 4834 High 67 33
Confidence in Courts/Law Enforcement33% Low 48% 52%39 Medium 53 4728 High 62 38
Confidence in Trade Unions16% Great deal 70% 30%26 Quite a lot 61 3929 Some 48 5218 Not much 45 5511 None 42 58 1 Don’t know 61 39
Confidence in the Media22% Great deal 62% 38%32 Quite a lot 58 4230 Some 49 5110 Not much 45 556 None 39 61
Perceptions of Past Direction of Country36% Most negative 43% 57%31 Mixed 56 4433 Most positive 64 36
Perceptions of Future Direction of Country38% Most negative 40% 60%31 Mixed 56 4431 Most positive 68 3231 Disagree 55 45
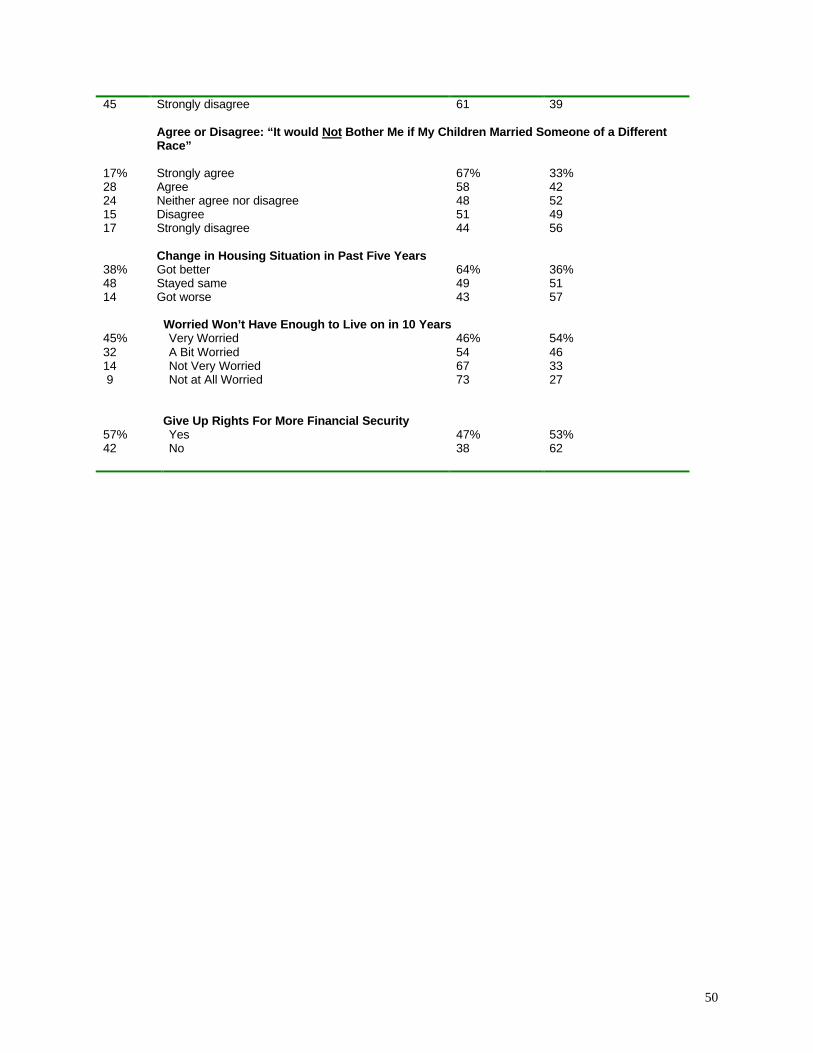
50
45 Strongly disagree 61 39
Agree or Disagree: “It would Not Bother Me if My Children Married Someone of a DifferentRace”
17% Strongly agree 67% 33%28 Agree 58 4224 Neither agree nor disagree 48 5215 Disagree 51 4917 Strongly disagree 44 56
Change in Housing Situation in Past Five Years38% Got better 64% 36%48 Stayed same 49 5114 Got worse 43 57
Worried Won’t Have Enough to Live on in 10 Years45% Very Worried 46% 54%32 A Bit Worried 54 4614 Not Very Worried 67 33 9 Not at All Worried 73 27
Give Up Rights For More Financial Security57% Yes 47% 53%42 No 38 62

51
Table VIIThe Final Model: Demographics, Life Experiences and Political AttitudesVariables in bold were statistically significant at the p<.05 level.
VariableParameter Estimate
Standard Error Pr > ChiSq
Standardized Estimate
Xhosa -1.2538 0.1251 <.0001 -0.2620Zulu -0.8297 0.1181 <.0001 -0.1867Black 0.7999 0.1739 <.0001 0.1992Age -0.0940 0.0345 0.0065 -0.0670Rural Resident 0.2643 0.1228 0.0314 0.0667White 0.4158 0.2292 0.0696 0.0881Afrikaans 0.3096 0.1918 0.1064 0.0526Education -0.0645 0.0493 0.1907 -0.0367Sex -0.0328 0.0849 0.6989 -0.00891Resident of Suburbs -0.0378 0.1185 0.7494 -0.00809Children under 18 0.0806 0.1000 0.4201 0.0197Indian 0.1875 0.2996 0.5313 0.0162Resident of Informal Settlement 0.0826 0.1723 0.6319 0.0130
Crime Victim -0.2289 0.1014 0.0240 -0.0542Political Knowledge 0.0597 0.0317 0.0594 0.0491Party Member 0.1013 0.1091 0.3531 0.0219Civic Engagement 0.0394 0.0508 0.4377 0.0177Victim of Racism 0.0261 0.0965 0.7870 0.00629
Trade Rights for EconomicSecurity
-0.3630 0.0858 <.0001 -0.0990
Economic Performance 0.1138 0.0292 <.0001 0.1119Money Worries 0.2232 0.0459 <.0001 0.1195Trust National Government 0.5174 0.1029 <.0001 0.1267Future Direction of Country 0.0625 0.0175 0.0004 0.1169Trust Political Institutions 0.0498 0.0147 0.0007 0.1105Income Inequality -0.2561 0.0852 0.0027 -0.0703Attitude toward Voting 0.1194 0.0411 0.0037 0.0689Economic Deprivation 0.1506 0.0621 0.0152 0.0884Trust Trade Unions 0.1017 0.0427 0.0172 0.0678Trust Legal Institutions -0.0478 0.0202 0.0181 -0.0738Racial Tolerance -0.0682 0.0363 0.0605 -0.0494Housing Problem -0.0270 0.0675 0.6895 -0.0102Trust Media 0.00114 0.0465 0.9805 0.000697Past Direction of County -0.00026 0.0251 0.9919 -0.00033
Association of Predicted Probabilities and Actual Responses: .75Likelihood Ratio <.0001Score <.0001Wald <.0001
Somers' D .507Gamma .508Tau-a .253c .753

52
Table VIII
Standardized Coefficients
VariableStandardized Estimate
Black 0.1992Trust National Government 0.1267Money Worries 0.1195Future Direction of Country 0.1169Economic Performance 0.1119Trust Political Institutions 0.1105Economic Deprivation 0.0884Attitude toward Voting 0.0689Trust Trade Unions 0.0678Rural Resident 0.0667Crime Victim -0.0542Age -0.0670Income Inequality -0.0703Trust Legal Institutions -0.0738Trade Rights for Economic Security -0.0990Zulu -0.1867Xhosa -0.2620

53
Predictors of Confidence in SA Democracy
-0.3 -0.2 -0.1 0 0.1 0.2 0.3
African
Trust Government
Money Worries
Future of SA
Economic Performance
Trust Political Institutions
Economic Deprivation
Attitude toward Voting
Trust Trade Unions
Rural Resident
Crime Victim
Age
Income Inequality
Trust Legal Institutions
Economic Security
Zulu
Xhosa

54
Table X
TABLE VI MAKING SENSE OF THE MODEL: RESPONDENT 1,173
One way to estimate the impact of each variable in our model contribute to feelings of optimism is to seewhat happens when a single independent variable is altered while the other independent variables are leftunchanged. The size of the resulting change, expressed as percentage points, is the contribution thatvariable makes to the overall probability that a person is optimistic about the future of democracy in SouthAfrica. Our starting point is Respondent 1,173, a 33-year old Xhosa woman living in the Eastern Cape Province.The model estimates there is a 46 percent chance—less than 50-50—that she is an optimist, based on herdemographic characteristics, her life experiences and her political attitudes. In fact, she answered that shewas “unsure” when asked if she expected democracy to continue after Mandela. This chart shows how theestimate of 46 percent changes in response to changes in a single independent variable, all other variablesheld constant. For example, Respondent 1,173 reported that she was “very worried” that her family would not haveenough to live on in 10 years. To estimate the effect of money worries on optimism, we compute what theprobability would have been had she responded that she was “not at all worried” about her family’s finances.The result: The probability that she is an optimist rises to 62 percent--a 16 percentage-point increase, whichis our estimate of the impact of this variable alone on optimism. This 16-point estimate is not specific to Respondent 1,173; we would have obtained the same estimate ifwe had picked any other respondent in our sample. Thus this result suggests that South Africans with nomoney worries were about 16 percentage points more likely to be optimistic about the future of democracyafter Mandela than those who were deeply concerned about their family’s financial future, controlling for allother variables in the model. (Note: To estimate the maximum effect of each variable, the probabilities estimated using the highest andthe lowest values of each variable are shown.)
Independent Variable Probability of Being an Optimist Change
XhosaYes 46% 28 percentage pointsNo 74
Confidence in Political InstitutionsMost 50% 19 percentage pointsLeast 31
ZuluYes 56% 18 percentage pointsNo 74%
Worried Won’t Have Enough to Live on in 10 YearsVery Worried 46% 16 percentage pointsNot Worried 62
Economic PerformanceMost Positive 51% 16 percentage pointsMost Negative 35
Perceptions of Future Direction of the CountryMost Positive 50% 15 percentage pointsMost Negative 35
Confidence in Legal InstitutionsMost 38% 14 percentage pointsLeast 52
Confidence in National GovernmentMost 59% 13 percentage points
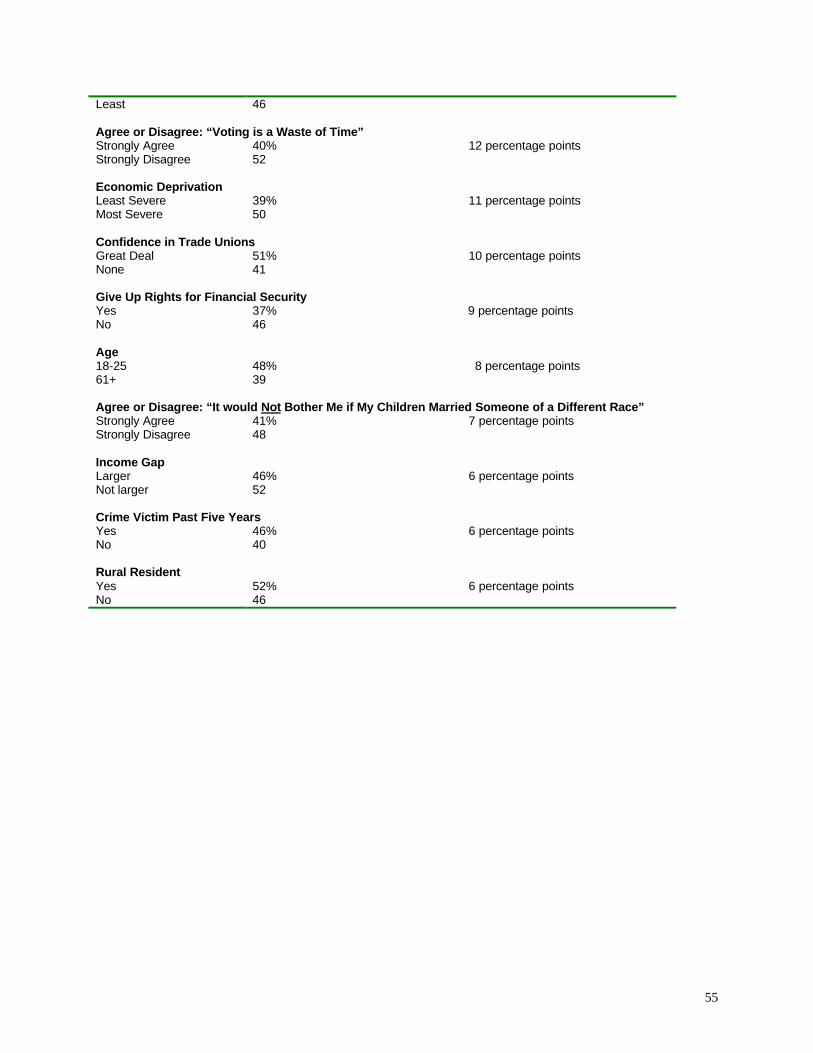
55
Least 46
Agree or Disagree: “Voting is a Waste of Time”Strongly Agree 40% 12 percentage pointsStrongly Disagree 52
Economic DeprivationLeast Severe 39% 11 percentage pointsMost Severe 50
Confidence in Trade UnionsGreat Deal 51% 10 percentage pointsNone 41
Give Up Rights for Financial SecurityYes 37% 9 percentage pointsNo 46
Age18-25 48% 8 percentage points61+ 39
Agree or Disagree: “It would Not Bother Me if My Children Married Someone of a Different Race”Strongly Agree 41% 7 percentage pointsStrongly Disagree 48
Income GapLarger 46% 6 percentage pointsNot larger 52
Crime Victim Past Five YearsYes 46% 6 percentage pointsNo 40
Rural ResidentYes 52% 6 percentage pointsNo 46

56
Endnotes
1 Brodie, Mollyann, Altman, Drew, Sinclair, Michael, Reality Check: South Africans’ Views of the NewSouth Africa,A report on a national survey of the South African People. The Henry J. Kaiser FamilyFoundation and Independent Newspapers. 1999 p. 1
2 “After Mandela—Will Our Democracy Survive?” Simon Zwane “ Reality Check (a reprint of news storiespublished by Independent Newspapers of South Africa) April 28, 1999. P. 5
3 This analysis largely focuses on blacks and whites because the subsamples of Indians and ColouredSouth Africans were too small to report findings with statistical confidence.
4 Brodie, Mollyann, Altman, Drew, Sinclair, Michael, op cit., p. 23
5 An analysis using an uncollapsed three-level dependent variable--optimists, uncertains, and pessimists--produced substantively identical results, with only marginal changes in the size of coefficients andassociated significance levels. Similarly, a model in which pessimists were excluded from the sample alsoproduced generally comparable findings, though fewer independent variables achieved statisticalsignificance. The model described in this paper, which used the collapsed dichotomous dependentvariable, correctly categorized a slightly larger percentage of the respondents than analyses using otherformulations of the dependent variable.
6 Nye, Joseph S., Jr. (1999) “Foreward” in Norris, Pippa (ed.), Critical Citizens, p. vi New York: OxfordUniversity Press
7 Pye, Lucian, quoted in Diamond, Larry (1999), Developing Democracy p. 163 Baltimore: The JohnsHopkins University Press
8 Haller, H. Brandon and Norpoth, Helmut, “Let the Good Times Roll: The Economic Expectations of U.S.Voters” American Journal of Political Science Vol. 38. No. 3 August, 1994, p. 648. Haller and Norpothconclude their article by cautioning policymakers not to take these expectations lightly. “The electoralweapon gives the public a good reason to hope, not just wish, for better times ahead when the economyis ailing. The electorate has reason to be hopeful since its ‘desire [is] accompanied by…belief infulfillment’ (Webster’s definition of hope.)”
9 Diamond, op cit p. 76
10 Przeworski, Adam, Alvarez, Michael, Cheibub, Jose Antonio and Limongi, Fernando “What MakesDemocracies Endure?” Journal of Democracy Vol. 7 No. 1 January, 1996. p. 43
11 Diamond, op cit. p. 90-91
12 Careful readers might question why income was not included as a variable in this analysis, or at leastincluded in the scale used to measure economic deprivation. Income was not used in this analysisbecause one in five respondents did not answer the income question. Eleven percent simply refused todisclose their incomes, while 9 percent said they did not know. Such a high refusal rate is, in fact, quitecommon: about one in six respondents typically refuse to give their income on Washington Post monthlysurveys. This high refusal rate poses problems, since the multivariate technique used to model theseresults excludes cases with missing data on any of the variables. That means including income wouldhave effectively eliminated 20 percent of the respondents from the analysis, or about 600 people. Acomparison of income and the economic deprivation scale found that the two were correlated.Significantly, the majority of people who refused to answer the income question rated as the most affluentin the economic deprivation scale. This suggests that wealthier South Africans were disproportionatelylikely to refuse to give their income.
57
13 Robert Mattes and Herman Thiel “Consolidation and Public Opinion in South Africa,” Journal ofDemocracy v. 9, no. 1 (1998) p. 101
14 The fact that a single underlying attitude seems to color thinking about the courts, police and the armyis not as unusual as it may seem. Other researchers use the label “Institutions of Control” to describe thisparticular grouping. The army also fought the ANC outside South Africa’s borders and inside the countryas well. In particular, army intelligence kept close watch on ANC activities within South Africa, working toidentify and target activists for harassment or death, according to testimony before the Truth andReconciliation Commission.
15 Because of the small sample sizes, the Indian (n=75) and Coloured subsamples (n=243) were notmodeled separately.
16 Together these findings suggest that the economy clearly helps to shape optimistic feelings about thefuture of democracy. But which matters more: perceptions of how the national economy is doing, or howthe individual has fared over the past five years? Perhaps counter-intuitively, Donald Kinder and RodKiewiet found that in the United States, perceptions of how the country is doing appear to trump our ownfinancial experience. People who see the national economy doing well are more likely to support anincumbent president or the incumbent’s party, even if their own economic situations have declined. Tocompare sociotropic versus egocentric perceptions of economic performance, the scale variable wasdropped from the model. It was replaced with the question asking whether the national economy hadgotten better, worse or stayed the same in the past five years. Then this variable was dropped, and in itsplace was entered the question asking how their “own personal financial situation” had changed since1994. By comparing the coefficients, we can make some generalizations about the relative strength of thetwo variables in predicting optimism. South Africa clearly is not the United States: Perceptions of an individual’s recent financial experiencewere as strongly related to optimism (beta=.2555, p<.0001) as were perceptions of the national economy(beta=.2581, p<.0001).
17 Przeworski, Adam, Alvarez, Michael, Cheibub, Jose Antonio and Limongi, Fernando op cit p. 41
18 Robert Mattes and Herman Thiel “Consolidation and Public Opinion in South Africa,” Journal ofDemocracy 9, no. 1 (1998) p. 100.
19 “Growing African middle-class is politically savvy and optimistic about the future of the country” KarenMacGregor Reality Check April 29, 1999 P. 4
20 Soal, Judith “Reconciliation, race relations and redistribution” Cape Times, April 22, 1999 p. 11.
21 Gibson, James L. and Gouws, Amanda “Support for the rule of law in the emerging South AfricanDemocracy” International Social Science Journal v. 49 n. 2 June, 1997 p. 188.
22 Ibid, p.185.
23 Diamond, op cit. p. 194
24 Norris, Pippa (1999), “Institutional Explanations for Political Support“ in Norris (ed.) Critical Citizens p.234.
25 Helen Taylor and Robert Mattes, “Political Parties, Supporters, and Democratic Citizenship,” (paperpresented at a workshop on Democracy and Social Capital in Segmented Societies,” Pretoria, October 9-12,1997.

58
26 It should be noted that even in the United States, polls show that large numbers of citizens expressdiscomfort with such quintessentially democratic ideas such as free speech and the right to assemble.
27 Robert Mattes and Herman Thiel “Consolidation and Public Opinion in South Africa,” Journal ofDemocracy 9, no. 1 (1998) p.100.
28 Thompson, Leonard, “Mbeki’s Uphill Challenge” Foreign Affairs November/December 1999 p.94
29 Robert Mattes and Herman Thiel, op cit. p.109
30 Van Zyl Slabbert, Frederik, (1999) “South Africa under Thabo Mbeki: The challenge of DemocraticStability” in Election ’99 South Africa Andrew Reynolds (ed.), New York: St. Martin’s Press p. 212
31 “Optimism survives in out-of-the-way places: Eric Ntabazalila “Reality Check” April 28, 1999. p. 6
32 “The Electric Blues” Roger Friedman Reality Check April 28, 1999 P. 6
33 Nevin, Tom “South Africa’s Second Industrial Revolution,” African Business; London; Nov 1999. P.15.
34 “It’s still a case of different strokes for different folks” Reality Check April 28, 1999. p. 3
35 Sparks, Allister, “The Status of the Dream” The Wilson Quarterly Spring 1999 p. 92.