the investment case for sdg 4 data -...
TRANSCRIPT

The Investment Case for SDG 4 Data
Concept Note
Technical Cooperation Group
on SDG 4–Education 2030 Indicators
Dubai, United Arab Emirates

2
The Investment Case for SDG 4 Data
Summary and purpose1
Imagine the scenario in which a newly appointed education minister arrives at the ministry, with a
modern approach and steadfast commitment to the spirit and reporting of the Sustainable
Development Goal on education (SDG 4). Yet the momentum fades quickly, as the minister realizes
that they are in many ways like an air traffic controller, who sees a deadly storm looming on the
horizon of a major airport when suddenly 80% of their navigation instruments begin to malfunction.
In many countries, education ministers simply don’t have the data to avoid or even mitigate a global
learning crisis, which is engulfing more than half of all children of primary and lower secondary school
age, according to estimates by the UNESCO Institute for Statistics. In short, the optimum management
of an education system is no less complex than managing a country’s air traffic control system.
Both the political agendas and monitoring frameworks of the SDGs and Education 2030 are extremely
ambitious. They demand an unprecedented increase in the collection, processing and dissemination
from and, most importantly, within countries. The main purpose of the SDG 4 monitoring framework
is to guide countries towards a comprehensive education agenda while minimising the burden on
them of monitoring these activities.
Knowing how much this monitoring will cost is therefore both important and complex but it can also
serve to identify the funding needs and add a “reality” check on the resources involved. It can thus
inform dialogue on how we, as a community, get organized to monitor SDG 4. But focusing only on
costs is to know the price of things and not the value of anything. The paper thus also starts trying to
estimate how much we would benefit from better monitoring. Thus, the paper sets out the case for
investing in SDG 4 data in all dimensions and is designed to raise the profile of the needs for
monitoring and to build the case for multi-year commitment.
The intended audience for the material in this document is countries (officials and civil society), the
international community and potential investors in education data. Resource mobilisation and
communication staff are likely to produce shorter/more focused versions to support specific
audiences and purposes. This longer document serves as reference.
The global governance mechanisms currently in place provide an excellent context to define a sound
strategy. To achieve the SDG 4 agenda, everybody (national statistics offices, international
organizations, donors and other stakeholders) needs to be aligned according to some sort of global
compact or strategic plan or agreement on what matters, how to fund it, and who does what. The
notion of a thorough, one-off planning re-set (without pretending one can have a one-off blueprint
for more than a whole decade, but with cost estimates in any case), implemented with more energy
and funding, is key.
The measurement challenges are complex and substantial. The investment case in education data
and sustainable information systems is required to:
a. Ensure that the SDG agenda has a well-funded monitoring framework;
1 This document was prepared by Silvia Montoya, Director of the UNESCO Institute for Statistics (UIS),
and Louis Crouch, Senior Economist of Research Triangle International (RTI). The costing simulation
has benefitted from insights by Manos Antoninis, Director of the Global Education Monitoring Report.

3
The Investment Case for SDG 4 Data
b. Guide investment with clear recommendations in terms of prioritisation according to
various criteria; and
c. Address multiple SDG indicators by focussing on coverage issues of different sources of
information.
The investment over the remaining period until 2030 is around US$2.8 billion. This would
comprehensively cover all the costs of a solid monitoring compact. Some two thirds of the cost is due
to the set of global set of indicators and the rest are due to the thematic indicators. The costs assumes
that all thematic indicators would be collected by all countries. The per-country cost over this long
period is only US$135 million on average, or US$1.35 million per country per year.
From the total cost of US$280 million per year, 45% are new funds (US$128 million) to add to the
US$152 million currently being spent either through aid to low-income and lower-middle-income
countries and self-funding for the SDG 4 agenda in the upper-middle-income and high-income
countries. 50% of the new funding should be aid for low-income and lower-middle-income countries.
The reminder is the self-funding investment of upper-middle-income and high-income countries.
To invest or not to invest in SDG 4 data? The answer is quite simple. Based on comparing the benefits
(or potential savings) with the resources allocated to gather the data, it is clear that the investment
will have a high return, especially for low-income countries. Data show that US$1.4 million per year
are needed to generate data, while this spending could liberate US$143 million for the average
country.
The idea is to build on already-existing methods and frameworks for producing education data. For
example, education management information systems (EMIS) and finance data are prevalent in most
countries, so the effort now should be on increasing efficiency and coverage in terms of
disaggregation. Thus, there is no need to develop new sources of data but to invest in improving and
expanding current methods.
Most of the funding needs are for new assessments focused on learning and skills outcomes from
early childhood development to higher-level skills acquired for various domains. But a lot of work
remains to be done regarding the use of data.
Other data sources, such as household or school random sample surveys, have proven to be useful
in other sectors but are often distrusted and/or misused by education planners. Very often planners
are not aware of the potential of these surveys, when they are properly undertaken. It is therefore
important to question what may be the best strategy: whether to address each new indicator by
adding an education module to existing surveys or to create a new, dedicated survey. It seems
impossible to add as many questions as needed to most existing surveys and it is better to think of a
combined household and school survey that could take care of ALL indicators that are not possible
through learning assessments or administrative data.
4
The Investment Case for SDG 4 Data
Although they represent a small share of the overall investment, methodological development and
resources needed for capacity development and technical assistance are incorporated into all
estimations.

5
The Investment Case for SDG 4 Data
Table of contents
Summary and purpose ...................................................................................................................................... 2
1. Motivation ....................................................................................................................................................... 6
2. Rationale for investing in education data ................................................................................................... 8
2.1 Simulating the efficiency gains ............................................................................................................ 11
3. What are data shortcomings and gaps? ................................................................................................... 12
3.1 Data gaps by sector .............................................................................................................................. 13
3.2 Data gaps by indicator ......................................................................................................................... 15
3.3 Data gaps by type of survey (and indicator)...................................................................................... 17
3.4 The geographies of data gaps ............................................................................................................. 18
3.5 Methodological gaps ............................................................................................................................ 20
4. What would a SDG 4 monitoring compact look like? .............................................................................. 21
5. What is the cost to fund the monitoring compact? ................................................................................. 22
5.1 Assumptions .......................................................................................................................................... 25
5.2 Unit costs ............................................................................................................................................... 25
5.3 Who pays................................................................................................................................................ 25
5.4 Results .................................................................................................................................................... 26
6. Key conclusions and messages .................................................................................................................. 29
Annex I. Issues by type of data source .......................................................................................................... 31
Annex II. Data production by country for Indicator 4.1.1 and household surveys ................................. 32
Annex III. Global and thematic indicators for the follow and review of the Education 2030 Agenda .. 34
Annex IV. Global and thematic indicators by source of information ........................................................ 39
Annex V. Coverage rate by indicator ............................................................................................................. 44
Annex VI. Assumptions and unit costs .......................................................................................................... 47
List of figures
Figure 1. Production possibility frontier ........................................................................................................ 10
Figure 2. Factors that can explain the lack and poor quality of education data...................................... 13
Figure 3. Coverage of SDG 4 indicators ......................................................................................................... 16
Figure 4. Coverage for indicators from learning assessments .................................................................. 17
Figure 5. Coverage for indicators from household surveys ....................................................................... 17
Figure 6. Coverage for indicators collected by the UIS from EMIS and other sources ........................... 18
Figure 7. Coverage of education finance data by source of expenditure and income level .................. 19
6
The Investment Case for SDG 4 Data
Figure 8. SDG 4 indicator coverage by income level.................................................................................... 20
Figure 9. Cost of data collection by source of funding in millions of US$ per year ................................. 27
Figure 10. Distribution of education data funding by source of funding ................................................. 27
Figure 11. Share of countries by level of income and funding needs for learning assessments .......... 28
Figure A-1. Data production for learning outcomes, Indicator 4.1.2, 2010-2016 .................................... 32
Figure A-2. Data production for household surveys, 2010-2016 ............................................................... 33
List of tables
Table 1. The SDG results framework ............................................................................................................... 7
Table 2. Indicators by source of information ................................................................................................. 8
Table 3. Public expenditure (in millions of current US$) ............................................................................. 12
Table 4. Simulation of savings per year per country ................................................................................... 12
Table 5. Availability of education data by sector .......................................................................................... 14
Table 6. Measuring equity with currently existing data sources ............................................................... 15
Table 7. Indicators by reporting status and their need for methodological development .................... 21
Table 8. Indicators by target and type of source ......................................................................................... 24
Table 9. How funding operates ...................................................................................................................... 26
Table 10. Estimate of SDG 4 data collection (in thousands of US$) over a 10-year period .................... 26
Table 11. Assessing benefits for investing in data per year ....................................................................... 28

7
The Investment Case for SDG 4 Data
1. Motivation
The Agenda for Sustainable Development combined with Education 2030 present an ambitious
commitment for the international education community. This vision places new demands on
countries, especially producers and users of education data. In contrast to the Millennium
Development Goals (MDGs) and Education for All (EFA), which emphasised universal completion of
basic education and reducing educational disparities linked to sex, the focus of Sustainable
Development Goal (SDG) 4 is “inclusive and equitable quality education and lifelong learning
opportunities for all.”
Monitoring SDG 4 requires reliable, high-quality and cross-nationally-comparable data from a variety
of data sources, compiled at regular intervals. The data must be collected, processed and
disseminated based on a common set of norms and standards. The data must also be made easily
accessible to policymakers and other stakeholders to ensure that education policy is guided by sound
data.
The production and dissemination of high-quality education statistics is essential for effective
planning, as well as for monitoring progress toward national and global education targets. Evidence-
based planning reduces system costs by allocating resources more effectively. The added cost of
improving data—as long as the data are actually used—is likely much lower than the implicit cost of
bad or no information. Planning with bad data inhibits optimal policy implementation, particularly
with respect to resource allocation and its equity and efficiency. For example, if input and enrolment
data are not clearly traceable to the school level, some schools are apt to have two or three times as
many resources per child as other schools. Sometimes this is associated with poverty (e.g. schools for
the poor get fewer and worse resources) and sometimes it is simply random. Studies have found, in
some countries, that some districts use up as much as 100 times more of specific resources
(e.g. paper) per pupil than others, without discernible impact on results. This is both inequitable and
inefficient.
The SDG monitoring framework has a set of 43 thematic indicators. Of the 43, the current set of 11
global and 32 thematic indicators for the follow-up and review of the SDG 4–Education 2030 Agenda
were developed during the period 2014 to 2015 and agreed in 2016 by the United Nations Statistical
Commission (UNSC) and the Technical Cooperation Group on SDG 4–Education 2030 Indicators (TCG)
respectively. Both sets of indicators (see Table 1) were subjected to several rounds of open consultations
before being finalised and agreed by countries.

8
The Investment Case for SDG 4 Data
Table 1. The SDG results framework
Target Number of
indicators Global Concepts
4.1 Quality in primary and secondary education 2 1 Learning
2 Completion
2 Participation
1 Provision
4.2 Access to quality early childhood development, care
and pre-primary education
2 1 Readiness to learn
2 1 Participation
1 Provision
4.3 Access to affordable and quality technical, vocational
and tertiary education
3 Participation
4.4 Relevant skills for employment, decent jobs and
entrepreneurship
2 1 Skills
4.5 Elimination of gender disparities in education and
ensuring equal access to all levels of education for the
vulnerable
Parity indices Equity across
targets
4 Policies
4.6 Adult literacy and numeracy 2 1 Skills
1 Participation
4.7 Knowledge and skills needed to promote
sustainable development
3 1 Provision
2 Knowledge
4.a Education facilities that provide safe, non-violent,
inclusive and effective learning environments for all
3 1 Resources
2 Environment
4.b Expand globally the number of scholarships
available to developing countries
2 1 Scholarships
4.c Increased supply of qualified teachers 2 1 Qualified teachers
2 Trained teachers
2 Motivation
1 Support
Total 43
Note: See Annex III for details.
Source: UNESCO Institute for Statistics.
Many countries are already challenged in collecting the most basic data on education systems, yet the
broader global monitoring efforts mandated by the SDGs will require a wider range of indicators.
Moreover, SDG 4 presents more complex demands than the MDGs, with its strong focus on quality
education leading to effective learning outcomes, and with the importance given to the development
of basic literacy and job-relevant skills of the population. Implementing the agenda on improving
learning and the population’s knowledge and skills in different domains is complex. This complexity
poses significant new challenges to producing data and indicators required for monitoring progress
towards SDG 4 targets linked to the quality of education (see Table 2).

9
The Investment Case for SDG 4 Data
For effective monitoring of the SDGs, a combination of data from a multiplicity of sources is essential.
This is especially true for SDG 4, where administrative data, which play a crucial role for national
planning purposes, provide only some of the information needed for monitoring progress towards
the goal of inclusive and equitable quality education and lifelong learning opportunities for all. Some
of the key data sources that constitute a comprehensive education data and information system
include administrative datasets, data collected through household surveys, learning assessments, and
finance and expenditure datasets. There are different challenges with each data source as described
in Annex I.
Table 2. Indicators by source of information
Data source Number of global
indicators
Number of thematic
indicators
UIS from EMIS and other sources 2 16
Household Surveys 3 3
Learning Assessments 2 2
School-based surveys 1 2
Other sources 3 20
Note: See Annex III for details.
Source: UNESCO Institute for Statistics.
2. Rationale for investing in education data
In the process of measuring the SDGs and assessing how much information to produce in pursuit of
the SDGs, various commentators have commented on the cost of information on the indicators. But
there seems to be little discussion about the value of information: a benefit that could potentially offset
the cost.
This section describes an approach to calculating the value of information, using basic education as
an example. We suggest that by basing policy on good data, education systems could get a certain
volume of output X out of their current expenditure.
Many examples suggest that some of the biggest problems are in data accessibility and actual data
usage for management and decision-making, especially for managerial use below the central ministry
level. The non-usage of data creates a chicken-and-egg problem: if systems do not have good
examples demonstrating that the use of data leads to improved resource allocation (and if
policymakers do not trust the data), then they will tend to under-invest in data, which will in turn make
it difficult to develop good management using data and increase trust.
Evidence from the health sector strongly suggests that interest in data preceded, and led to, the hugely
disproportionate investment made in data systems in that sector relative to the education sector
(e.g. DHS Program and the fact that MICS has so much more health data than education data, or the
existence of DHIS2 which has not been duplicated in the education sector).
How much can a system save or, better, how much more can a system do with current resources? We
proposed that the upper bound on the value of information is the difference between the “net

10
The Investment Case for SDG 4 Data
revenue” produced by an education system under “best practice” information and under “normal
practice” information.2 The approach focuses on the value of reducing uncertainty by providing
information. In other words, a “rational” actor should be willing to pay for information right up to the
point where the payment for the information eats up the extra “profit” (in a private or social setting)
generated by having the information.
This is the upper bound since political and economic considerations can stop the system from acting
on “best practice” information. There is no observable characteristic, though, that differentiates a
system that lacks data from one that does not act on it. Rational actors would not pay for information
if they know ahead of time that they cannot act on it.
This is a very simplified version of the problem that can be summarised in the following expression:
𝑉𝑎𝑙𝑢𝑒 𝑜𝑓 𝐼𝑛𝑓𝑜𝑟𝑚𝑎𝑡𝑖𝑜𝑛 = max((𝐵𝐵𝑃 − 𝐵𝑁𝑃) − (𝐶𝐷𝐶 𝐵𝑃 − 𝐶𝐷𝐶 𝑁𝑃))
where
Value of Information is the value of information,
BBP is the extra benefit generated by best practice,
BNP is the benefits generated by normal practice,
CDC is the cost of data collection for Best Practice BP and NP.
Graphically (see Figure 1) we could consider that a country is producing for a combination of inputs in
point E. The country could either move to point B to maximise production (by making better use of
resources and not reducing expenditure) or it could stay in point E saving money for the same level
of production. Thus, there is a scenario where a system could either produce more with the same
resources (from point E to point B) or save money for the same output (stay in point E) using less
resources3.
2 This is a standard definition or approach, similar to the “Expected Value of Perfect Information”
approach. 3 We are assuming that this saving could take various forms from quantity to the quality of the
resources. A feature of information, thus, might be the knowledge that, for example, it might be better
to have relatively large class sizes but with better teachers. Or, that by altering the mix of inputs
between teachers and the presence of high-quality coaches (or in-service training and support for the
teachers) one can improve the quality of teaching, which then gets reflected in the difference between
the outputs achievable under best practice and under normal practice.

11
The Investment Case for SDG 4 Data
Figure 1. Production possibility frontier
But is information enough? Is information the only input that would allow the system to move from
point D to point A? Not in our view. Data (i.e. information) are necessary but not the only factors to
produce an efficient education system. To improve efficiency, three inputs are needed to identify the
upper bound of how much could be gained and, in fact, achieved:
Information about what to do and how to do it, what works, and which is the best mix of inputs
or the good practices;
“Political will” to act on that information; and
Management information, unit by unit, to identify who is under-producing. In general, this
step is fairly straightforward.
All three elements are needed to generate improvement. If you have the information but no political
will or management capacity, then the results will not achieved. But WITHOUT information, efficiency
is lost due to unawareness.
What can be the gains in efficiency? In other words, how much less can a given country spend to
achieve the same outputs, liberating resources for other areas? Box 1 describes previous literature,
with estimated gains ranging from 10% to 30%4.
4 Di Gropello, E. (2006). “Meeting the Challenges of Secondary Education in Latin America and East
Asia”. Directions in Development . doi:10.1596/978-0-8213-6645-5.
Herrera, S. and G. Pang (2005).” Efficiency of Public Spending in Developing Countries: An Efficiency
Frontier Approach”. SSRN Electronic Journal. doi:10.2139/ssrn.2018832.

12
The Investment Case for SDG 4 Data
2.1 Simulating the efficiency gains
Let’s do an analysis using expenditure data from the UIS database. The upper bound that can be
attained in efficiency will be based on the empirical studies described in Box 1, with efficiency gains
ranging from 15% to 30% with current expenditure.
In the best case scenario, there would be an efficiency gain of 30% in the upper bound. If this 30% is
applied as “savings” or resources liberated to expand either the quantity or quality of public
expenditure of a given country X, then we have a concrete picture of the amount of resources
liberated.
Thus, as a first step, Table 3 presents the simple average expenditure for all countries (including the
high-income countries with high expenditures) and for countries classified according to the level of
income.
Box 1. Measuring efficiency: A review of literature
In their World Bank Policy Research Working Paper, “Efficiency of Public Spending in Developing Countries: An
Efficiency Frontier Approach”, Santiago Herrera and Gaobo Pang attempt to quantify the measurement of
efficiency. The authors present an application of non-parametric methods to analyse the efficiency of public
spending, and based on their sample of 140 countries, they estimate efficiency scores.
Their results show that on average developing countries could increase their educational attainment between
10% and 30%, with the same input level. Some institutional or economic factors cause some countries to be
more efficient than others. For example, the authors have found that countries which have low education
efficiency scores have larger expenditure levels, public financing which represents a large share of total
expenditure of services, inequality in the income distribution and de-urbanisation .
Another paper that takes an attempt at measuring efficiency is “Meeting the Challenges of Secondary Education
in Latin America and East Asia: Improving Efficiency and Resource Mobilisation”. In this paper, Emanuela di
Gropello measures the efficiency of education resources in her effort to evaluate how countries can address the
multiple challenges they face in secondary education, given their different development levels and technical and
financial capacities.
The paper employs a production frontier for this analysis, which is derived from observing the most efficient
operations of countries or schools, demonstrating relatively high output for input. The idea, of course, is to be
as close as possible to the efficiency frontier to be deemed efficient. The resulting efficiency score analysis shows
substantial margins for improvement in the two regions examined. On average, the author calculates a 15%
increase in academic achievement and grade attainment at equal cost if systems were to be efficient.

13
The Investment Case for SDG 4 Data
Table 3. Public expenditure (in millions of current US$)
Expenditure Low-income
countries
Lower-middle-
income countries World
Median expenditure 361 1,006 1,431
Notes: Average for the period 2007-2015. Public expenditure for influential countries (such as China
and Nigeria) with missing data was estimated using average regional percentage of spending on
education as percentage of GDP.
The second step is to estimate the upper bound of 30% as potential savings for low- and middle-
income countries, using the assumption that high-income countries implement better practices
already. The results of this exercise is presented in Table 4. The table described this upper bound
along with alternative scenarios for savings of 20% or 10%, respectively.
Table 4. Simulation of savings per year per country (in millions of current US$)
Savings Low-income
countries
Lower-middle-
income countries World
10% savings 36 101 143
1% savings 4 10 13
Source: UNESCO Institute for Statistics.
These alternatives scenarios are second- and third-best options if other constraints (e.g. political will,
technical or managerial issues) do not permit the achievement of the full maximisation point of 30%.
The table summarises savings per average country in millions of US dollars per year.
As we will see below, improving data in most countries would cost only a very small fraction of what
could, in principle, be saved or how much more could be done by using that information. Even if the
use of data could save only 10%, we are dealing with a negligible investment for such a big return to
investment.
3. What are data shortcoming and gaps?
The challenges and constraints that can hinder the production and use of education data at the
national and international levels can be grouped around five key factors that are linked and reinforce
each other:
1. The mandatory data collections may not be carried out, may be slow or may be inaccurate;
2. The institutional environment may be weak, including political will and managerial
shortcomings, to implement changes;
3. There may be a lack of methodologies and standards or a multiplicity of them;
4. Technical capacity, in particular to add value to and interpret data, may be insufficient; and
5. Data use and data literacy may be limited.
14
The Investment Case for SDG 4 Data
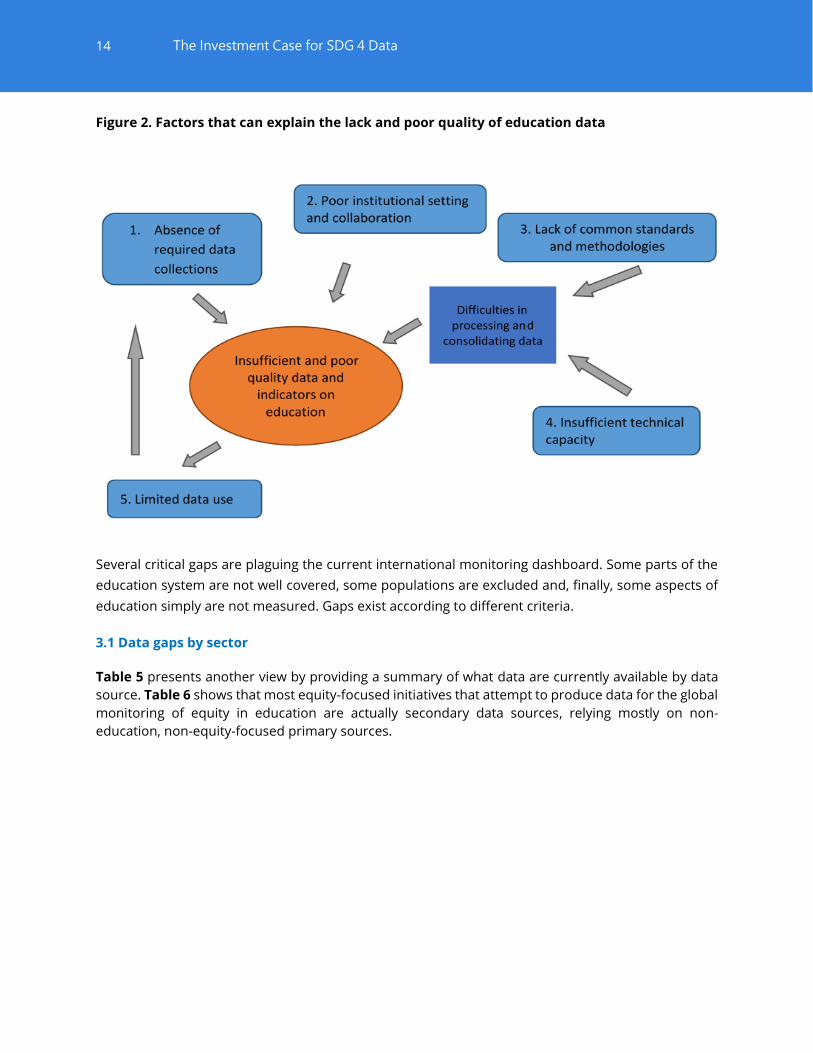
Figure 2. Factors that can explain the lack and poor quality of education data
Several critical gaps are plaguing the current international monitoring dashboard. Some parts of the
education system are not well covered, some populations are excluded and, finally, some aspects of
education simply are not measured. Gaps exist according to different criteria.
3.1 Data gaps by sector
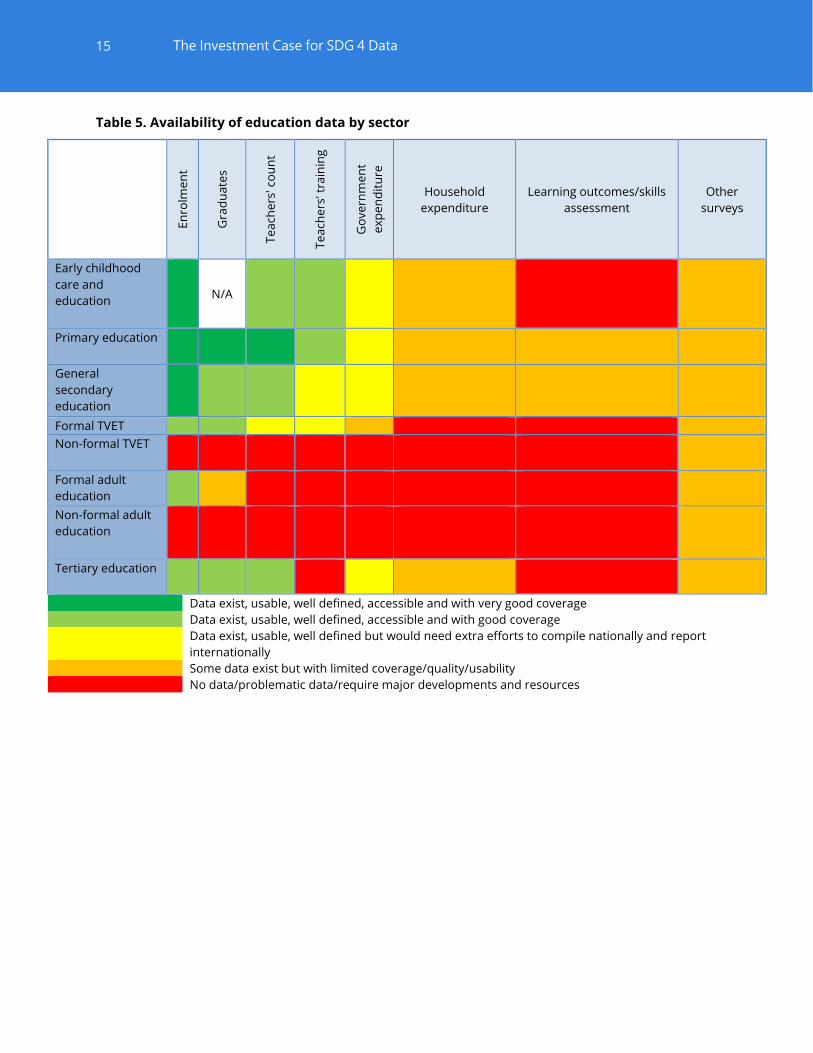
Table 5 presents another view by providing a summary of what data are currently available by data
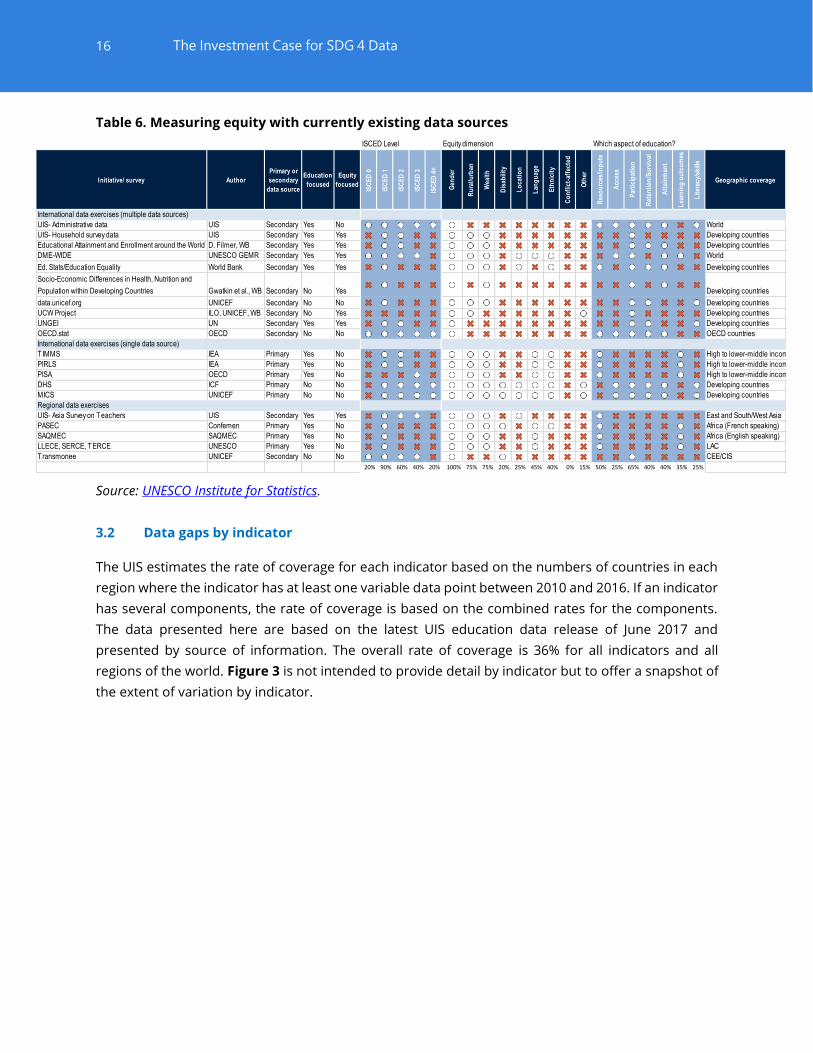
source. Table 6 shows that most equity-focused initiatives that attempt to produce data for the global
monitoring of equity in education are actually secondary data sources, relying mostly on non-
education, non-equity-focused primary sources.
15
The Investment Case for SDG 4 Data
Table 5. Availability of education data by sector
En
rolm
en
t
Gra
du
ate
s
Te
ach
ers
' co
un
t
Te
ach
ers
' tra
inin
g
Go
ve
rnm
en
t
exp
en
dit
ure
Household
expenditure
Learning outcomes/skills
assessment
Other
surveys
Early childhood
care and
education
N/A
Primary education
General
secondary
education
Formal TVET
Non-formal TVET
Formal adult
education
Non-formal adult
education
Tertiary education
Data exist, usable, well defined, accessible and with very good coverage
Data exist, usable, well defined, accessible and with good coverage
Data exist, usable, well defined but would need extra efforts to compile nationally and report
internationally
Some data exist but with limited coverage/quality/usability
No data/problematic data/require major developments and resources
16
The Investment Case for SDG 4 Data
Table 6. Measuring equity with currently existing data sources
Source: UNESCO Institute for Statistics.
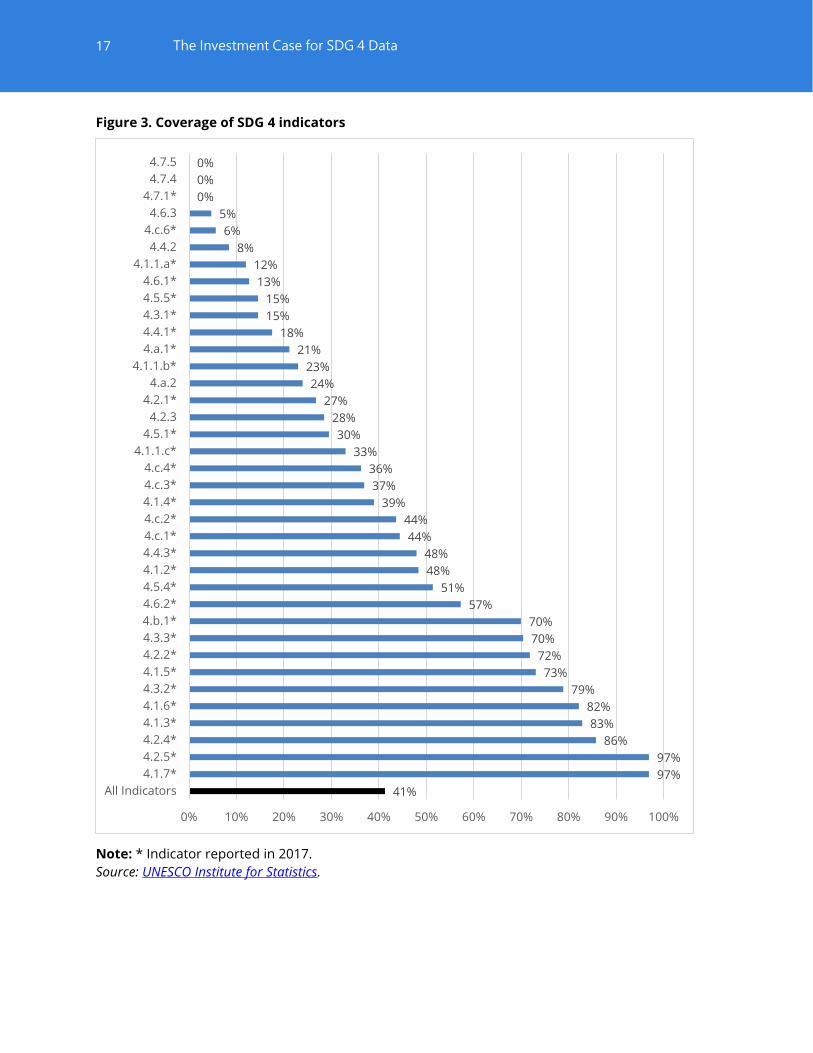
3.2 Data gaps by indicator
The UIS estimates the rate of coverage for each indicator based on the numbers of countries in each
region where the indicator has at least one variable data point between 2010 and 2016. If an indicator
has several components, the rate of coverage is based on the combined rates for the components.
The data presented here are based on the latest UIS education data release of June 2017 and
presented by source of information. The overall rate of coverage is 36% for all indicators and all
regions of the world. Figure 3 is not intended to provide detail by indicator but to offer a snapshot of
the extent of variation by indicator.
Initiative/ survey Author
Primary or
secondary
data source
Education
focused
Equity
focused
ISC
ED
0
ISC
ED
1
ISC
ED
2
ISC
ED
3
ISC
ED
4+
Gen
der
Ru
ral/u
rban
Wea
lth
Dis
abili
ty
Lo
cati
on
Lan
gu
age
Eth
nic
ity
Co
nfl
ict-
affe
cted
Oth
er
Res
ou
rces
/inp
uts
Acc
ess
Par
tici
pat
ion
Ret
enti
on
/Su
rviv
al
Att
ain
men
t
Lea
rnin
g o
utc
om
es
Lit
erac
y/sk
ills
Geographic coverage
International data exercises (multiple data sources)
UIS- Administrative data UIS Secondary Yes No World
UIS- Household survey data UIS Secondary Yes Yes Developing countries
Educational Attainment and Enrollment around the World D. Filmer, WB Secondary Yes Yes Developing countries
DME-WIDE UNESCO GEMR Secondary Yes Yes World
Ed. Stats/Education Equality World Bank Secondary Yes Yes Developing countries
Socio-Economic Differences in Health, Nutrition and
Population within Developing Countries Gwatkin et al., WB Secondary No Yes Developing countries
data.unicef.org UNICEF Secondary No No Developing countries
UCW Project ILO, UNICEF, WB Secondary No Yes Developing countries
UNGEI UN Secondary Yes Yes Developing countries
OECD.stat OECD Secondary No No OECD countries
International data exercises (single data source)
TIMMS IEA Primary Yes No High to lower-middle income
PIRLS IEA Primary Yes No High to lower-middle income
PISA OECD Primary Yes No High to lower-middle income
DHS ICF Primary No No Developing countries
MICS UNICEF Primary No No Developing countries
Regional data exercises
UIS- Asia Survey on Teachers UIS Secondary Yes Yes East and South/West Asia
PASEC Confemen Primary Yes No Africa (French speaking)
SAQMEC SAQMEC Primary Yes No Africa (English speaking)
LLECE, SERCE, TERCE UNESCO Primary Yes No LAC
Transmonee UNICEF Secondary No No CEE/CIS
20% 90% 60% 40% 20% 100% 75% 75% 20% 25% 45% 40% 0% 15% 50% 25% 65% 40% 40% 35% 25%
ISCED Level Equity dimension Which aspect of education?
17
The Investment Case for SDG 4 Data
Figure 3. Coverage of SDG 4 indicators
Note: * Indicator reported in 2017.
Source: UNESCO Institute for Statistics.
41%
97%
97%
86%
83%
82%
79%
73%
72%
70%
70%
57%
51%
48%
48%
44%
44%
39%
37%
36%
33%
30%
28%
27%
24%
23%
21%
18%
15%
15%
13%
12%
8%
6%
5%
0%
0%
0%
0% 10% 20% 30% 40% 50% 60% 70% 80% 90% 100%
All Indicators
4.1.7*
4.2.5*
4.2.4*
4.1.3*
4.1.6*
4.3.2*
4.1.5*
4.2.2*
4.3.3*
4.b.1*
4.6.2*
4.5.4*
4.1.2*
4.4.3*
4.c.1*
4.c.2*
4.1.4*
4.c.3*
4.c.4*
4.1.1.c*
4.5.1*
4.2.3
4.2.1*
4.a.2
4.1.1.b*
4.a.1*
4.4.1*
4.3.1*
4.5.5*
4.6.1*
4.1.1.a*
4.4.2
4.c.6*
4.6.3
4.7.1*
4.7.4
4.7.5
18
The Investment Case for SDG 4 Data
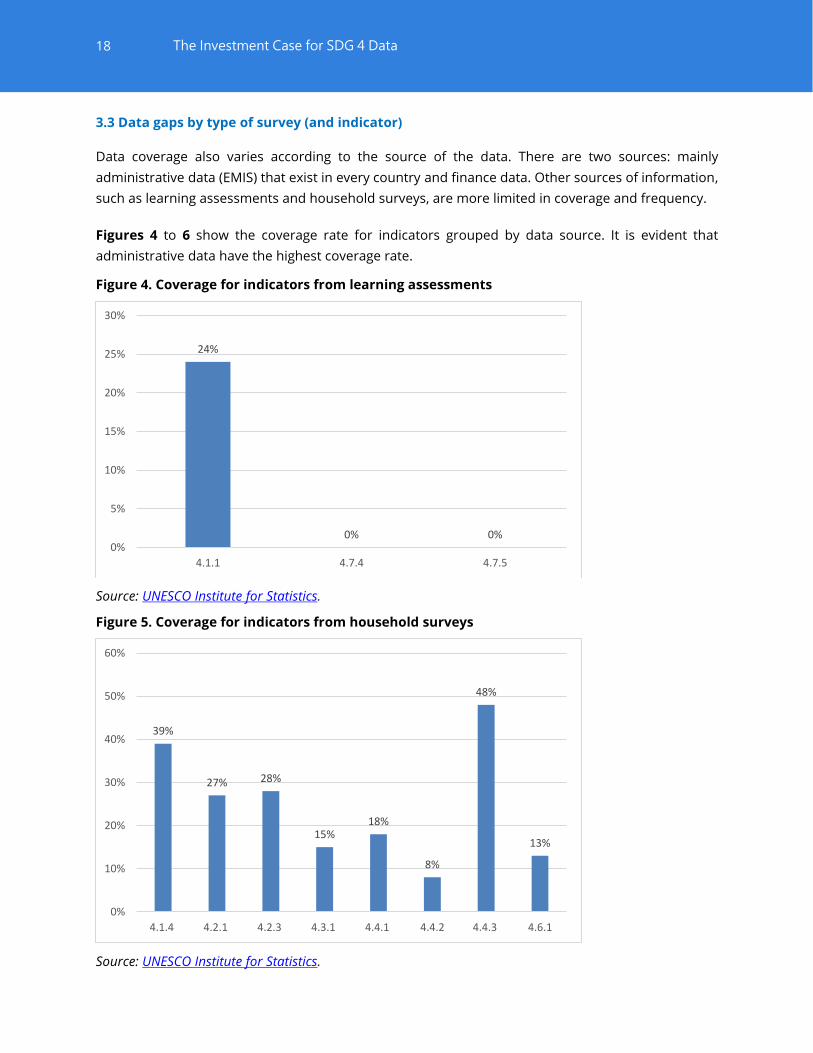
3.3 Data gaps by type of survey (and indicator)
Data coverage also varies according to the source of the data. There are two sources: mainly
administrative data (EMIS) that exist in every country and finance data. Other sources of information,
such as learning assessments and household surveys, are more limited in coverage and frequency.
Figures 4 to 6 show the coverage rate for indicators grouped by data source. It is evident that
administrative data have the highest coverage rate.
Figure 4. Coverage for indicators from learning assessments
Source: UNESCO Institute for Statistics.
Figure 5. Coverage for indicators from household surveys
Source: UNESCO Institute for Statistics.
24%
0% 0%0%
5%
10%
15%
20%
25%
30%
4.1.1 4.7.4 4.7.5
39%
27% 28%
15%18%
8%
48%
13%
0%
10%
20%
30%
40%
50%
60%
4.1.4 4.2.1 4.2.3 4.3.1 4.4.1 4.4.2 4.4.3 4.6.1

19
The Investment Case for SDG 4 Data
Figure 6. Coverage for indicators collected by the UIS from EMIS and other sources
Source: UNESCO Institute for Statistics.
Six targets where more than half of their indicators have coverage lower than 40%: 4.4, 4.5, 4.6, 4.7,
4.a and 4.c. Therefore, those areas are priority to assess possibilities for indicator dropping and adding
new ones to improve monitoring capacity of the indicator framework.
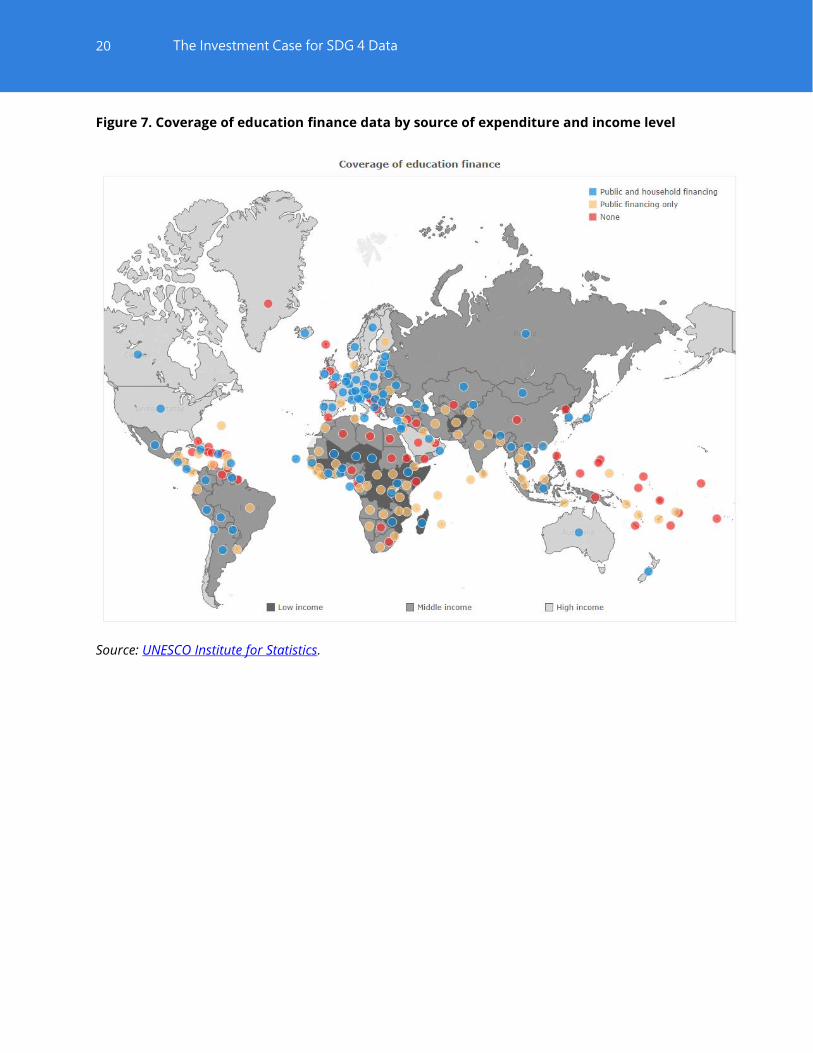
3.4 The geographies of data gaps
A different approach is to look at data gaps by region. Figure 7 shows the coverage of finance data,
while Figure 8 shows SDG 4 data availability by income level. In both cases, countries with the largest
data gaps are located in sub-Saharan Africa, Eastern Asia and the Small Islands States.
48%
83%
73%
82%
97%
72%
86%
97%
79%
70%
48%51%
57%
21%
44% 44%
37% 36%
6%
0%
10%
20%
30%
40%
50%
60%
70%
80%
90%
100%
4.1.2 4.1.3 4.1.5 4.1.6 4.1.7 4.2.2 4.2.4 4.2.5 4.3.2 4.3.3 4.4.3 4.5.4 4.6.2 4.a.1 4.c.1 4.c.2 4.c.3 4.c.4 4.c.6
20
The Investment Case for SDG 4 Data
Figure 7. Coverage of education finance data by source of expenditure and income level
Source: UNESCO Institute for Statistics.

21
The Investment Case for SDG 4 Data
Figure 8. SDG 4 indicator coverage by income level
Source: UNESCO Institute for Statistics.
3.5 Methodological gaps
Another challenge in the availability of SDG 4 data are the indicators that still need methodological
development. The Technical Cooperation Group (TCG) on SDG 4–Education 2030 Indicators is
responsible for leading the development of certain indicators through close cooperation with
Member States, civil society representatives and experts from international and regional
organizations.
Some indicators are already in the process of being developed. Other indicators with methodological
gaps fall into several different categories. For example, there are agreed methodologies for some
indicators that work in certain regions but would need to be tested in all regions. Thus, these
methodologies still need to be reviewed to ensure that they are applicable across the world. They will
be addressed by the TCG working group in its next phase of work.
The remaining f ive indicators will require more extensive work and may need to involve external
experts and possibly substantial revisions to the originally-proposed indicator. The TCG also identified
additional areas for further development, but this work will not begin until most of the existing
indicators have been addressed by the group.
22
The Investment Case for SDG 4 Data
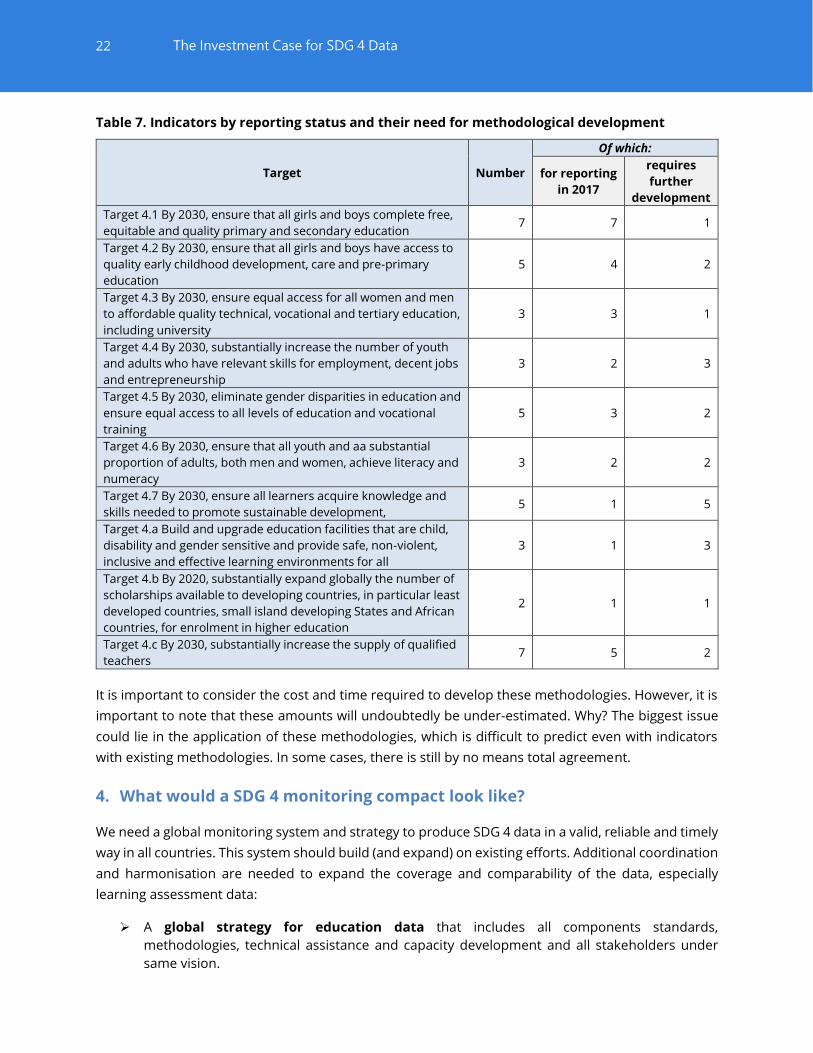
Table 7. Indicators by reporting status and their need for methodological development
Target Number
Of which:
for reporting
in 2017
requires
further
development
Target 4.1 By 2030, ensure that all girls and boys complete free,
equitable and quality primary and secondary education 7 7 1
Target 4.2 By 2030, ensure that all girls and boys have access to
quality early childhood development, care and pre-primary
education
5 4 2
Target 4.3 By 2030, ensure equal access for all women and men
to affordable quality technical, vocational and tertiary education,
including university
3 3 1
Target 4.4 By 2030, substantially increase the number of youth
and adults who have relevant skills for employment, decent jobs
and entrepreneurship
3 2 3
Target 4.5 By 2030, eliminate gender disparities in education and
ensure equal access to all levels of education and vocational
training
5 3 2
Target 4.6 By 2030, ensure that all youth and aa substantial
proportion of adults, both men and women, achieve literacy and
numeracy
3 2 2
Target 4.7 By 2030, ensure all learners acquire knowledge and
skills needed to promote sustainable development, 5 1 5
Target 4.a Build and upgrade education facilities that are child,
disability and gender sensitive and provide safe, non-violent,
inclusive and effective learning environments for all
3 1 3
Target 4.b By 2020, substantially expand globally the number of
scholarships available to developing countries, in particular least
developed countries, small island developing States and African
countries, for enrolment in higher education
2 1 1
Target 4.c By 2030, substantially increase the supply of qualified
teachers 7 5 2
It is important to consider the cost and time required to develop these methodologies. However, it is
important to note that these amounts will undoubtedly be under-estimated. Why? The biggest issue
could lie in the application of these methodologies, which is difficult to predict even with indicators
with existing methodologies. In some cases, there is still by no means total agreement.
4. What would a SDG 4 monitoring compact look like?
We need a global monitoring system and strategy to produce SDG 4 data in a valid, reliable and timely
way in all countries. This system should build (and expand) on existing efforts. Additional coordination
and harmonisation are needed to expand the coverage and comparability of the data, especially
learning assessment data:
A global strategy for education data that includes all components standards,
methodologies, technical assistance and capacity development and all stakeholders under
same vision.
23
The Investment Case for SDG 4 Data
Funding strategy that includes
o Technical responses through a set of tools
A set of tools and standards to compare and define benchmarks
A set of standards and guidelines of good practices including a data quality
assessment framework for each type of information.
o Data collection: with reference to all sources of information related to a global data
strategy.
o Capacity development at the country and regional level that contemplates all
stakeholders and actors in all levels of government and all phases of data production,
collection and use.
Global Coordination and reduction in transaction costs:
o For effective monitoring of the SDGs and better decision-making, close collaboration
of all national and international stakeholders in the field of education is required. Data
embedded in a national strategy for development of the educational statistics and the
work of education data clusters that all allow all stakeholders to work under the same
focus and action plan.
5. What is the cost to fund the monitoring compact?
The SDG 4-Education 2030 Agenda is very ambitious in terms of monitoring and will require a
significant amount of data collection, processing and dissemination from and, most importantly,
within countries. It is therefore critical but complex to know how much this monitoring will cost. Many
decisions must be made in terms of what data collections are needed and how their costs can be
estimated, which are affected by several factors and underlying assumptions. The estimated total
global cost will therefore inevitably be a very rough estimation but should nonetheless give us an idea
of the scale of the effort needed.
The proposed framework estimates the annual and total costs of monitoring the 43 indicators of the
Education 2030 Agenda over the next 10 years, covering all low-, lower-middle- and upper-middle-
income countries. The total cost is estimated based on an average cost in each of the three groups
and then multiplied by the number of countries in these three groups.
Not everything can be costed. The realm of what is needed to produce the breadth of data implied by
the SDG 4-Education 2030 Agenda is large and includes several statistical prerequisites that are not
specific to the education sector, such as an efficient and transparent Public Financial Management
System from which government expenditure on education can be extracted, or good general census
data, essential as a basis for all population-based statistics. These types of data collections are not
included here, as it is very difficult to estimate how much from them can be imputed to education,
and in any case if they are not being produced, there is little that the education sector could, or
probably should, do about it. In addition, the costs of collecting information on laws and regulations
are not included even though several indicators require this sort of information.
24
The Investment Case for SDG 4 Data
The approach used here is to move forward based on needs by defining the data source for each
indicator, grouping indicators according to data sources, and then defining the needed activities,
inputs and costs. As such, it is a programme-driven or goals-driven budget.
The simplification that is necessary and makes it possible to do this is to define a limited set of
activities and inputs that can serve most of the goals and give each one a standardised unit cost (which
can be flexible). This makes it possible to model the costs fairly efficiently and fully at least for initial
discussion purposes.
The initial analysis looks at which indicators are currently being reported and which are new and might
require initial methodological refinement or capacity building in the country. As such, the costs are
built “up” from the indicators to a set of standardised activities needed to improve them, each with a
standardised price. Therefore, each single indicator does not have a standard unit price, unless the
indicator requires a special effort, on its own, to be gathered.
Three necessary inputs to estimate full costing. First input is the identification of the sources of
information needed to monitor as well as the indicators to estimate including methodological
developments and related needs to implement the measurement. Table 2 in Section 2 summarises
the information by sources with reference to the number of indicators needed but did not specify the
indicators and did not clarify that in some cases some indicators, now reported using administrative
data, could be reported either using Household surveys.
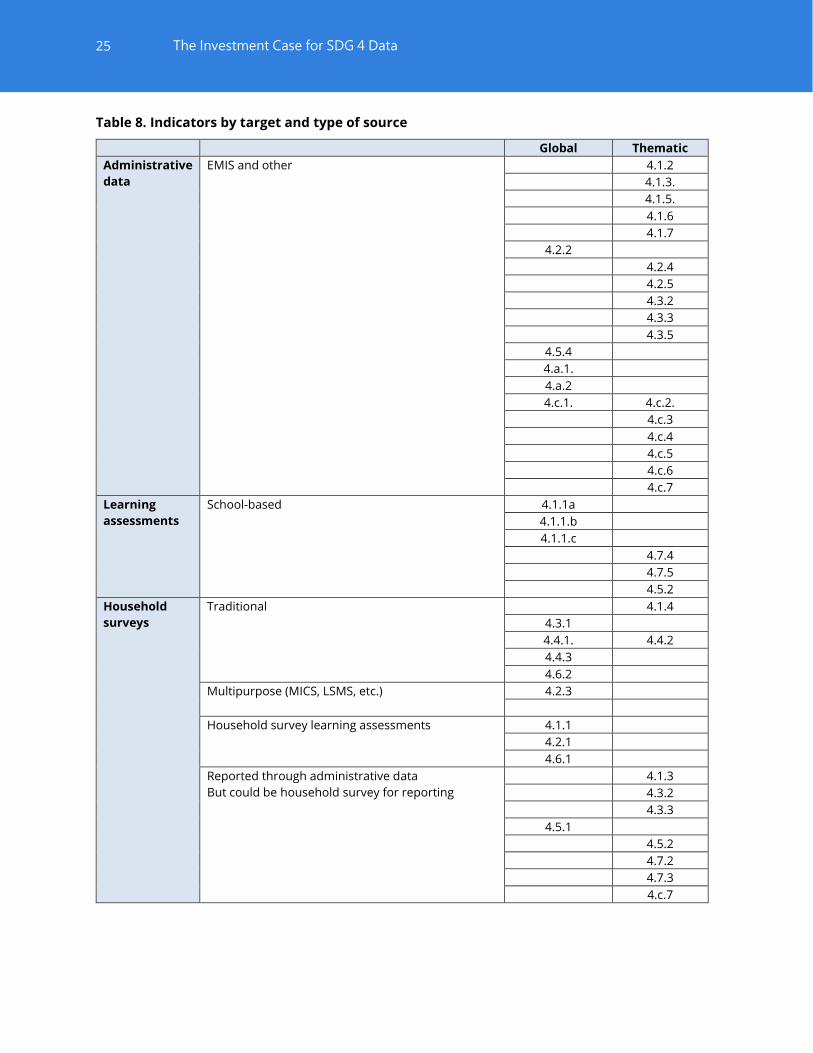
Table 8 does this exercise for indicators classified both by Thematic and Global status and by source
of information. There is the list of indicators but we have added a list of indicators currently collected
through a specific source of information it could collected through other source of information. The
clear examples are indicators today gathered through administrative data that could be collected
through Household Surveys. How this is going to be implemented is not the objective of this document
and it does not assume that could be done yes or yes.
25
The Investment Case for SDG 4 Data
Table 8. Indicators by target and type of source
Global Thematic
Administrative
data
EMIS and other 4.1.2
4.1.3.
4.1.5.
4.1.6
4.1.7
4.2.2
4.2.4
4.2.5
4.3.2
4.3.3
4.3.5
4.5.4
4.a.1.
4.a.2
4.c.1. 4.c.2.
4.c.3
4.c.4
4.c.5
4.c.6
4.c.7
Learning
assessments
School-based 4.1.1a
4.1.1.b
4.1.1.c
4.7.4
4.7.5
4.5.2
Household
surveys
Traditional 4.1.4
4.3.1
4.4.1. 4.4.2
4.4.3
4.6.2
Multipurpose (MICS, LSMS, etc.) 4.2.3
Household survey learning assessments 4.1.1
4.2.1
4.6.1
Reported through administrative data
But could be household survey for reporting
4.1.3
4.3.2
4.3.3
4.5.1
4.5.2
4.7.2
4.7.3
4.c.7
26
The Investment Case for SDG 4 Data
5.1 Assumptions
The second step is to estimate the unit cost along with the assumptions for each type of information
and all related activities t is estimated using unit cost of the administration of the survey as indicative
as there are other costs that are as relevant as the implementation itself. Information about the costs
of different activities has been provided by key informants detailed in Annex VI. Assumptions are
described in here and in Annex VI.
Indicators can be gathered by adding questions to existing questionnaires, for which the
marginal cost is essentially zero. It does not seem logical for the international community to
start paying, on a recurrent basis, the ongoing cost of EMIS operations to which a few tasks
have been added, except for the once-off cost of capacity building.
For indicators that require field data effort, such as data on learning assessments, the cost is
indeed calculated indicator by indicator.
For some data we have assumed an “omnibus survey” (not a survey for each indicator) would
be useful for the cases (xx% of countries or xx% of indicators) where relying only on
administrative data might be deemed insufficient or unproductive. It is assumed that a new
survey may be needed in a large share of countries to gather data which cannot be collected
by administrative systems or learning assessments. We have assumed for simulation’s sake
that we would have a sort of “omnibus survey” for these cases in which a household survey
would be considered a good idea.
5.2 Unit costs
Learning assessments US$0.5 million, but some are a little lower, and we have added the cost of
initial discussions, piloting, etc. US$0.5 million is more accurate than US$1 million.
Household surveys, US$0 .5 million. Plus added the costs of initial refinements, capacity building,
etc. But note that not all countries apply them, and we can choose whether to apply them every
year or three times in the 10 years, for example.
Administrative data, US$0.5 million. Is not priced with a unit cost. But the assumption here is that
EMIS offices are already sending out forms and that adding to the form is not a “cash cost” that
we can easily model.
Module costs for multi-purpose household surveys are priced at US$0.2-0.25 million dollars.
Other costs are detailed in Annex VI.
5.3. Who pays
Crucial information for funding purposes is to ascertain who is paying what and if the funds currently
available are enough or if new efforts are needed.
27
The Investment Case for SDG 4 Data
Who foots the bill? We have assumed that that the low- and middle-income countries receive aid in
different forms and by various donors, while upper-middle and high-income countries invest their
own funding.
Is it new funding or existing funding? We have estimated that the expansion of coverage is new
funding to be added to the current pool of funding.
Table 9. How funding operates
Countries by income Aid Self-funding
Existing New Existing New
Low X X
Lower-middle X X
Upper-middle X X
High X X
5.4. Results
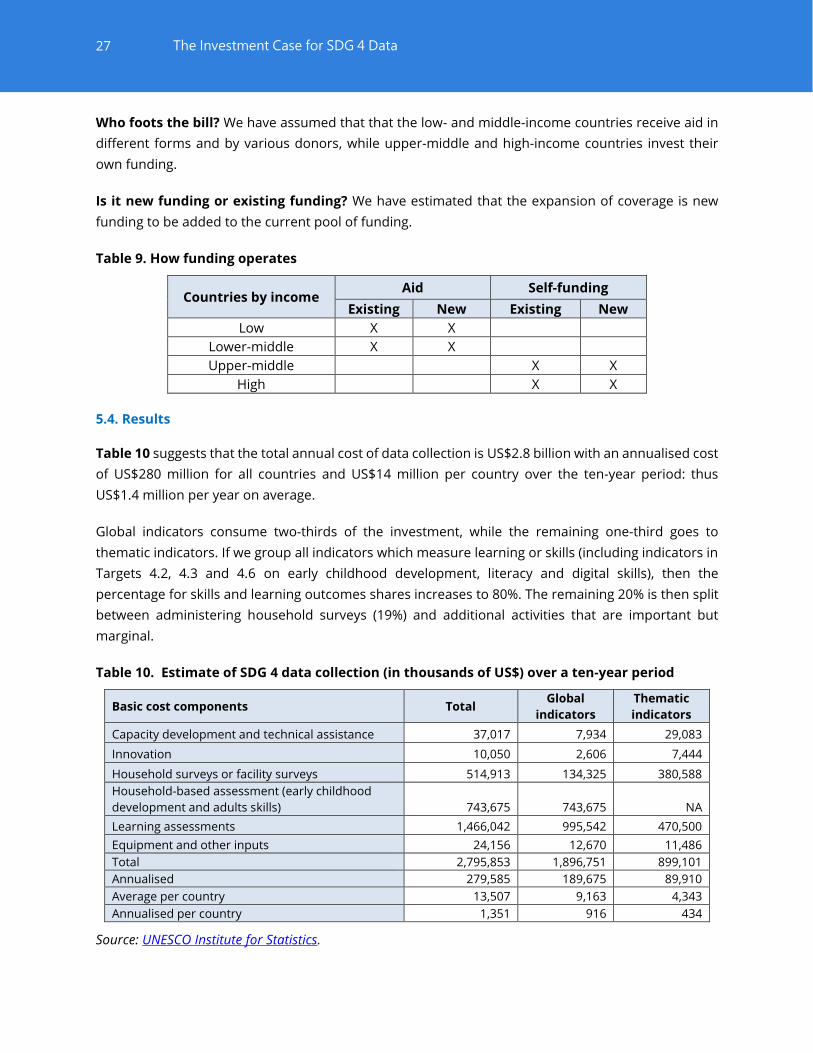
Table 10 suggests that the total annual cost of data collection is US$2.8 billion with an annualised cost
of US$280 million for all countries and US$14 million per country over the ten-year period: thus
US$1.4 million per year on average.
Global indicators consume two-thirds of the investment, while the remaining one-third goes to
thematic indicators. If we group all indicators which measure learning or skills (including indicators in
Targets 4.2, 4.3 and 4.6 on early childhood development, literacy and digital skills), then the
percentage for skills and learning outcomes shares increases to 80%. The remaining 20% is then split
between administering household surveys (19%) and additional activities that are important but
marginal.
Table 10. Estimate of SDG 4 data collection (in thousands of US$) over a ten-year period
Basic cost components Total Global
indicators
Thematic
indicators
Capacity development and technical assistance 37,017 7,934 29,083
Innovation 10,050 2,606 7,444
Household surveys or facility surveys 514,913 134,325 380,588
Household-based assessment (early childhood
development and adults skills) 743,675 743,675 NA
Learning assessments 1,466,042 995,542 470,500
Equipment and other inputs 24,156 12,670 11,486
Total 2,795,853 1,896,751 899,101
Annualised 279,585 189,675 89,910
Average per country 13,507 9,163 4,343
Annualised per country 1,351 916 434
Source: UNESCO Institute for Statistics.
28
The Investment Case for SDG 4 Data
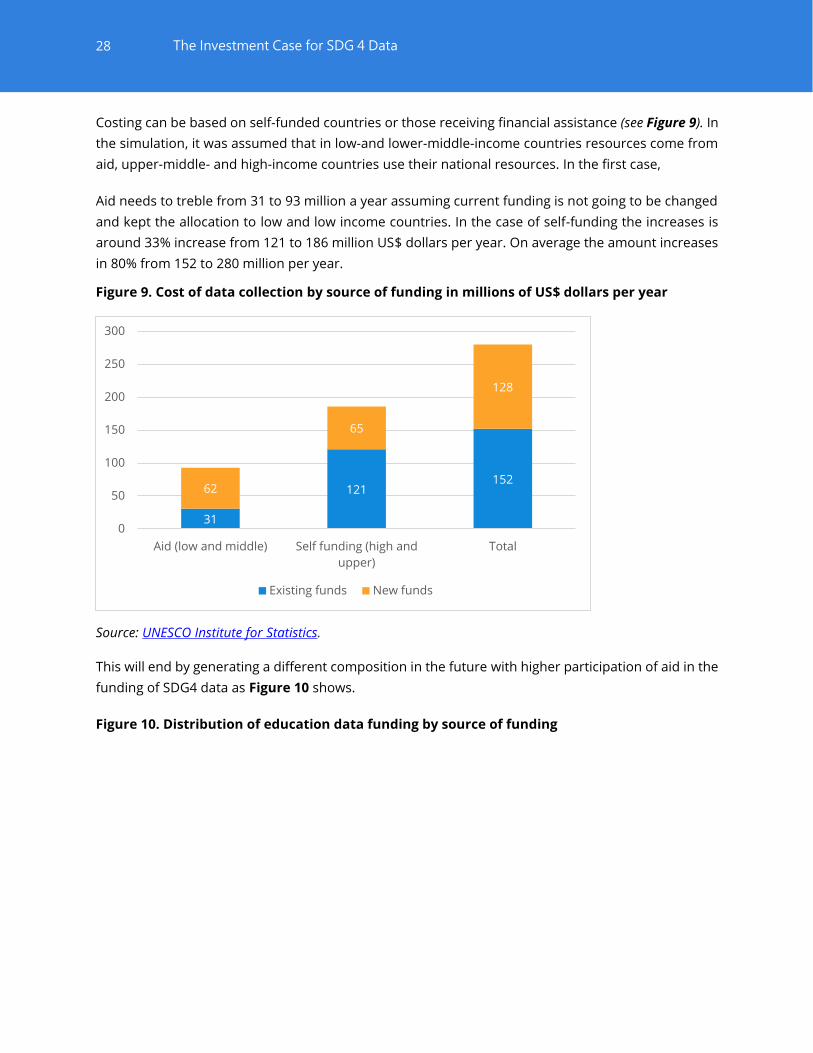
Costing can be based on self-funded countries or those receiving financial assistance (see Figure 9). In
the simulation, it was assumed that in low-and lower-middle-income countries resources come from
aid, upper-middle- and high-income countries use their national resources. In the first case,
Aid needs to treble from 31 to 93 million a year assuming current funding is not going to be changed
and kept the allocation to low and low income countries. In the case of self-funding the increases is
around 33% increase from 121 to 186 million US$ dollars per year. On average the amount increases
in 80% from 152 to 280 million per year.
Figure 9. Cost of data collection by source of funding in millions of US$ dollars per year
Source: UNESCO Institute for Statistics.
This will end by generating a different composition in the future with higher participation of aid in the
funding of SDG4 data as Figure 10 shows.
Figure 10. Distribution of education data funding by source of funding
31
121152
62
65
128
0
50
100
150
200
250
300
Aid (low and middle) Self funding (high and
upper)
Total
Existing funds New funds

29
The Investment Case for SDG 4 Data
Source: UNESCO Institute for Statistics.
Figure 11 informs about the share of countries by income level that need aid for gathering data on
learning assessments by income level. It clearly shows the greater need for funding by low-income
countries, which, as previously explained, will rely on aid.
Figure 11. Share of countries by level of income and funding needs for learning assessments
Source: UNESCO Institute for Statistics.
5.2 Comparing costs and benefits
When considering these estimates, it is essential to focus on the costs per country compared to the
potential savings. This is particularly important for low- and middle-income countries, which it is
assumed have less developed systems of information.
30
61
91
121
65
186
0%
10%
20%
30%
40%
50%
60%
70%
80%
90%
100%
Existing funds New funds Total funds
Aid (low and middle) Self funding (high and upper)
16%
45%
21%18%
15%
25% 27%
33%
0%
5%
10%
15%
20%
25%
30%
35%
40%
45%
50%
Low income middle Low middle income Upper middleincome
High income
Share in LA Funding Needs Share of Group in Countries Total

30
The Investment Case for SDG 4 Data
Table 11 presents the costs and benefits by income level of countries. In a conservative scenario, the
annual per country cost is US$1.35 million on average, while the benefits of data investment range
from about US$36 to 101 million on average for low- and low-middle-income countries. Once again,
we want to stress that this is under the most conservative scenario of 10% savings. We assume that
the upper-middle- and high-income countries are already experiencing gains.
Table 11. Assessing benefits for investing in data per year (in millions of US$ dollars)
Country by type Cost in US$
10%
efficiency
gains in US$
current
1% efficiency
gains in US$
current
Low income 2.6 36 3.6
Low middle income 6.3 101 10
Average country 1.4 143 14
Source: UNESCO Institute for Statistics.
6. Key conclusions and messages
1. To invest or not to invest in data to monitor progress towards SDG 4? The answer is quite simple.
We need to compare the benefits (or potential savings) with the resources allocated to gather
data. It is clear that the investment has a high return, especially for low- and lower-middle-income
countries.
2. Where do countries start and where should they invest? Global or thematic indicators? The global
indicators have been endorsed by the highest political levels in each country and, though not
compulsory, represent a priority for countries. An assessment of needs and priorities by country
will set the priorities at a national level.
3. Funding for a monitoring system should be increased by about 50%. For low- and lower-middle-
income countries, the funding should come from aid, while upper-middle- and high-income
countries should self-fund.
4. The first step in defining data sources are analysing what currently exists regardless of quality and
where new sources need to be developed to collect the required data. EMIS and finance data are
prevalent in most countries and the data are already being collected; most of the effort needs to
go into increasing efficiency and coverage in terms of disaggregation. So there is a small
investment to be made but it is not a new data source for countries
5. Gathering data on learning assessments is more challenging than collecting data from EMIS or on
financial expenditure on education. And most of the funding needs are due to implementing
learning and skills outcomes from early childhood development to youth and adults skills in
various domains.
31
The Investment Case for SDG 4 Data
6. Other sources, such as household surveys, have been useful in other sectors but are often still
distrusted and/or misused by education planners, often due to a lack of knowledge on their
potential when implemented well.
o Questions remain as to how to collect all of the data needed to produce all of the indicators.
Should more modules be added to existing surveys or does the answer lie in creating a
dedicated survey per indicator?
o Most existing surveys will not accept the addition of so many additional questions. Thus, if
one is to be complete and include many of the thematic indicators, it is likely that new
surveys will be needed. It will be much less expensive to create omnibus surveys to take care
of many of these issues at once, rather than to prepare special-purpose surveys for each
issue.
7. Finally, regarding methodological developments and the resources related to capacity
development and technical assistance, they were incorporated in the costing although they
represent a small percentage of the overall investment.
Annex I. Issues by type of data source
Administrative data are based on information collected in the management of the education
system. These are usually used by ministries of education for management and planning
purposes, and are typically updated on a regular basis. Most of the international monitoring
for the previous global development agenda (EFA and MDGs) was based on administrative
data produced by countries and compiled by international organizations. However, even these
data were quite incomplete for the MDGs, not to mention the SDGs.
Household surveys are an important source of data on access, participation and educational
attainment. Surveys differ in terms of coverage, frequency, and objective and questionnaire
design. In contrast to administrative data, they are collected less frequently, and by a variety
of organizations and countries. In some cases, the surveys are nationally implemented and in
others, administered under the auspices of an international organization. In the health sector,
they are relied upon almost as much as administrative data. The education sector tends to
under-utilise surveys, in spite of their huge potential, partly due to lack of statistical literacy.
Learning assessments include national school-based assessments designed to measure
specific learning outcomes at a particular age or grade that are considered relevant for
national policymakers. They also include cross-national initiatives (either regional or global)
that are based on a common, agreed-upon framework and follow similar procedures to yield
comparable data on learning outcomes. Assessment data can also be collected from
households.
Financial and expenditure data include information on government spending on education.
Examples include construction and maintenance of schools, teacher salaries, and household
spending on education, including supplies, transport and other costs. These data are very
incomplete, in general, which makes it almost impossible to calculate allocative efficiency and
equity.
32
The Investment Case for SDG 4 Data
Several critical gaps are plaguing the current international monitoring dashboard. Some parts
of the education system are not well covered. Some populations are excluded and, finally,
some aspects of education simply do not have a source of data.
33
The Investment Case for SDG 4 Data
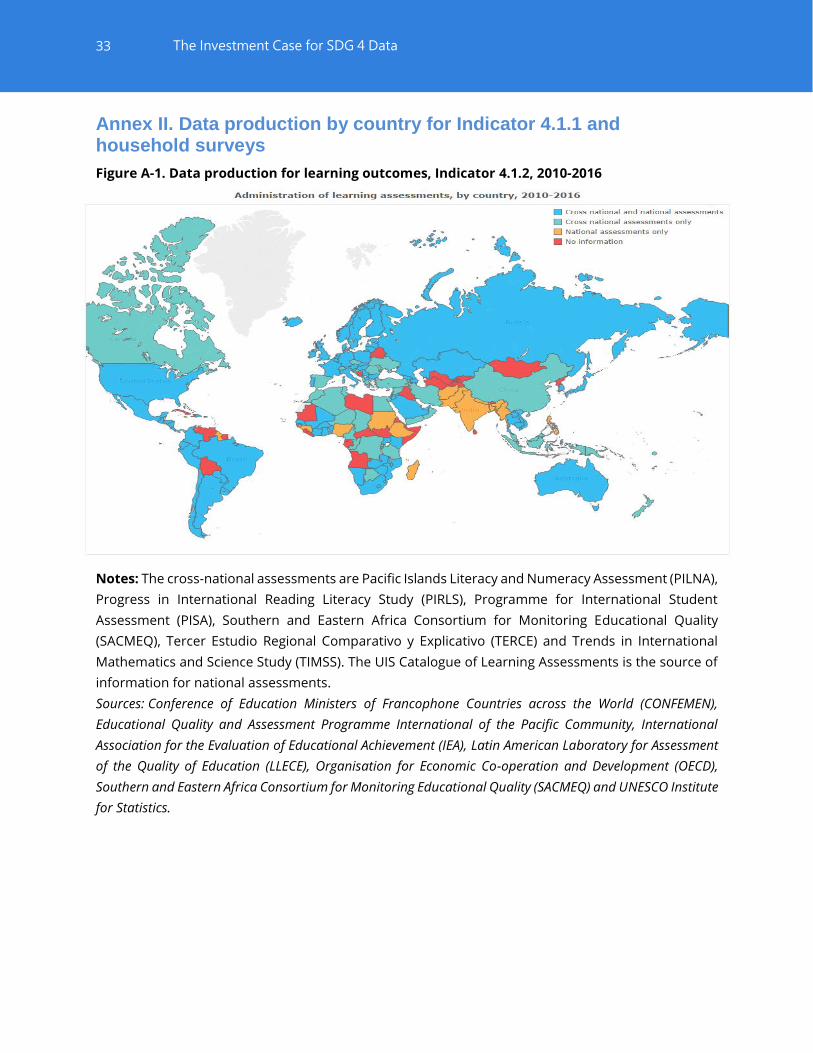
Annex II. Data production by country for Indicator 4.1.1 and household surveys
Figure A-1. Data production for learning outcomes, Indicator 4.1.2, 2010-2016
Notes: The cross-national assessments are Pacific Islands Literacy and Numeracy Assessment (PILNA),
Progress in International Reading Literacy Study (PIRLS), Programme for International Student
Assessment (PISA), Southern and Eastern Africa Consortium for Monitoring Educational Quality
(SACMEQ), Tercer Estudio Regional Comparativo y Explicativo (TERCE) and Trends in International
Mathematics and Science Study (TIMSS). The UIS Catalogue of Learning Assessments is the source of
information for national assessments.
Sources: Conference of Education Ministers of Francophone Countries across the World (CONFEMEN),
Educational Quality and Assessment Programme International of the Pacific Community, International
Association for the Evaluation of Educational Achievement (IEA), Latin American Laboratory for Assessment
of the Quality of Education (LLECE), Organisation for Economic Co-operation and Development (OECD),
Southern and Eastern Africa Consortium for Monitoring Educational Quality (SACMEQ) and UNESCO Institute
for Statistics.

34
The Investment Case for SDG 4 Data
Figure A-2. Data production for household surveys, 2010-2016
Source: Data on household surveys come from the International Household Survey Network
(http://www.ihsn.org/), November 2017.
35
The Investment Case for SDG 4 Data
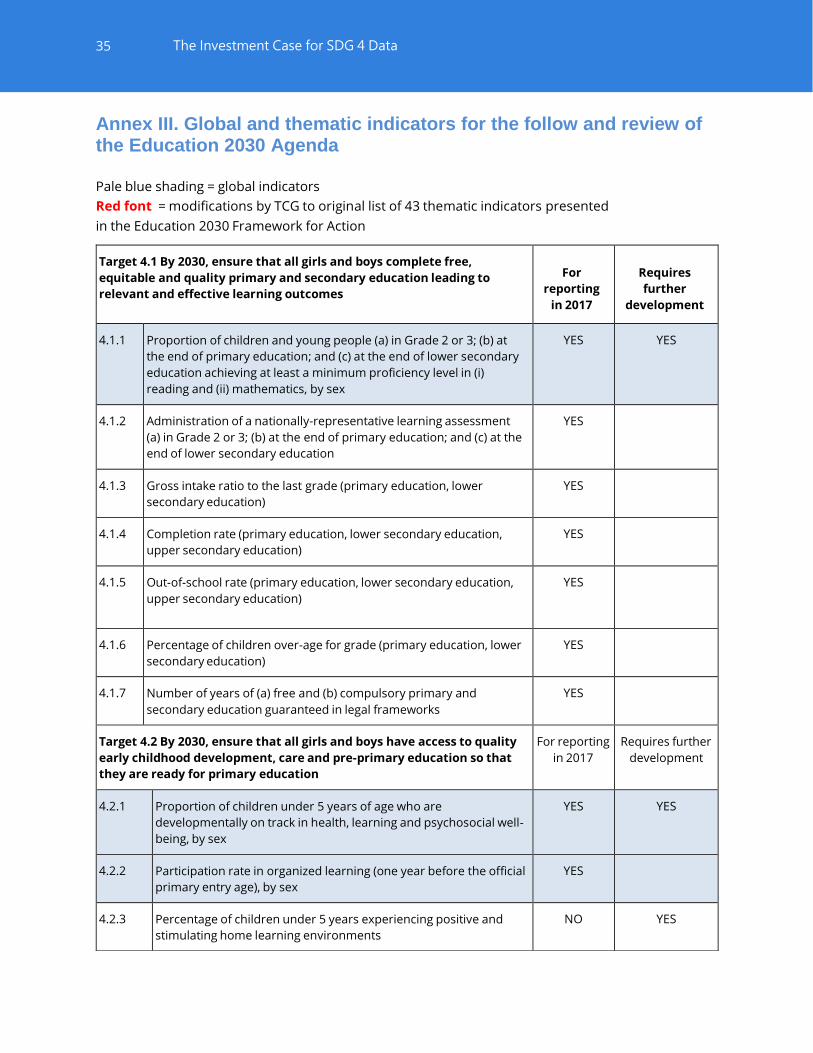
Annex III. Global and thematic indicators for the follow and review of the Education 2030 Agenda
Pale blue shading = global indicators
Red font = modifications by TCG to original list of 43 thematic indicators presented
in the Education 2030 Framework for Action
Target 4.1 By 2030, ensure that all girls and boys complete free,
equitable and quality primary and secondary education leading to
relevant and effective learning outcomes
For
reporting
in 2017
Requires
further
development
4.1.1
Proportion of children and young people (a) in Grade 2 or 3; (b) at
the end of primary education; and (c) at the end of lower secondary
education achieving at least a minimum proficiency level in (i)
reading and (ii) mathematics, by sex
YES
YES
4.1.2
Administration of a nationally-representative learning assessment
(a) in Grade 2 or 3; (b) at the end of primary education; and (c) at the
end of lower secondary education
YES
4.1.3
Gross intake ratio to the last grade (primary education, lower
secondary education)
YES
4.1.4
Completion rate (primary education, lower secondary education,
upper secondary education)
YES
4.1.5
Out-of-school rate (primary education, lower secondary education,
upper secondary education)
YES
4.1.6
Percentage of children over-age for grade (primary education, lower
secondary education)
YES
4.1.7
Number of years of (a) free and (b) compulsory primary and
secondary education guaranteed in legal frameworks
YES
Target 4.2 By 2030, ensure that all girls and boys have access to quality
early childhood development, care and pre-primary education so that
they are ready for primary education
For reporting
in 2017
Requires further
development
4.2.1
Proportion of children under 5 years of age who are
developmentally on track in health, learning and psychosocial well-
being, by sex
YES
YES
4.2.2
Participation rate in organized learning (one year before the official
primary entry age), by sex
YES
4.2.3
Percentage of children under 5 years experiencing positive and
stimulating home learning environments
NO
YES

36
The Investment Case for SDG 4 Data
4.2.4
Gross early childhood education enrolment ratio in (a) pre-primary
education and (b) and early childhood educational development
YES
4.2.5
Number of years of (a) free and (b) compulsory pre-primary
education guaranteed in legal frameworks
YES
Target 4.3 By 2030, ensure equal access for all women and men to
affordable quality technical, vocational and tertiary education,
including university
For reporting
in 2017
Requires further
development
4.3.1
Participation rate of youth and adults in formal and non-formal
education and training in the previous 12 months, by sex
YES
YES
4.3.2
Gross enrolment ratio for tertiary education by sex
YES
4.3.3
Participation rate in technical-vocational programmes (15- to 24-
year-olds) by sex
YES
Additional areas for development: affordability, quality
Not
applicable
YES
Target 4.4 By 2030, substantially increase the number of youth and
adults who have relevant skills, including technical and vocational
skills, for employment, decent jobs and entrepreneurship
For reporting
in 2017
Requires further
development
4.4.1
Proportion of youth and adults with information and
communications technology (ICT) skills, by type of skill
YES
YES
4.4.2
Percentage of youth/adults who have achieved at least a minimum
level of proficiency in digital literacy skills
NO
YES
4.4.3
Youth/adult educational attainment rates by age group, economic
activity status, levels of education and programme orientation
YES
YES to simplify
Additional areas for development: measures of a broader range of work-
related skills than ICTs, other employment-related indicators
Not
applicable
YES
Target 4.5 By 2030, eliminate gender disparities in education and ensure
equal access to all levels of education and vocational training for the
vulnerable, including persons with disabilities, indigenous peoples and
children in vulnerable situations
For reporting
in 2017
Requires further
development
4.5.1
Parity indices (female/male, rural/urban, bottom/top wealth
quintile and others such as disability status, indigenous peoples
and conflict-affected, as data become available) for all education
indicators on this list that can be disaggregated
YES
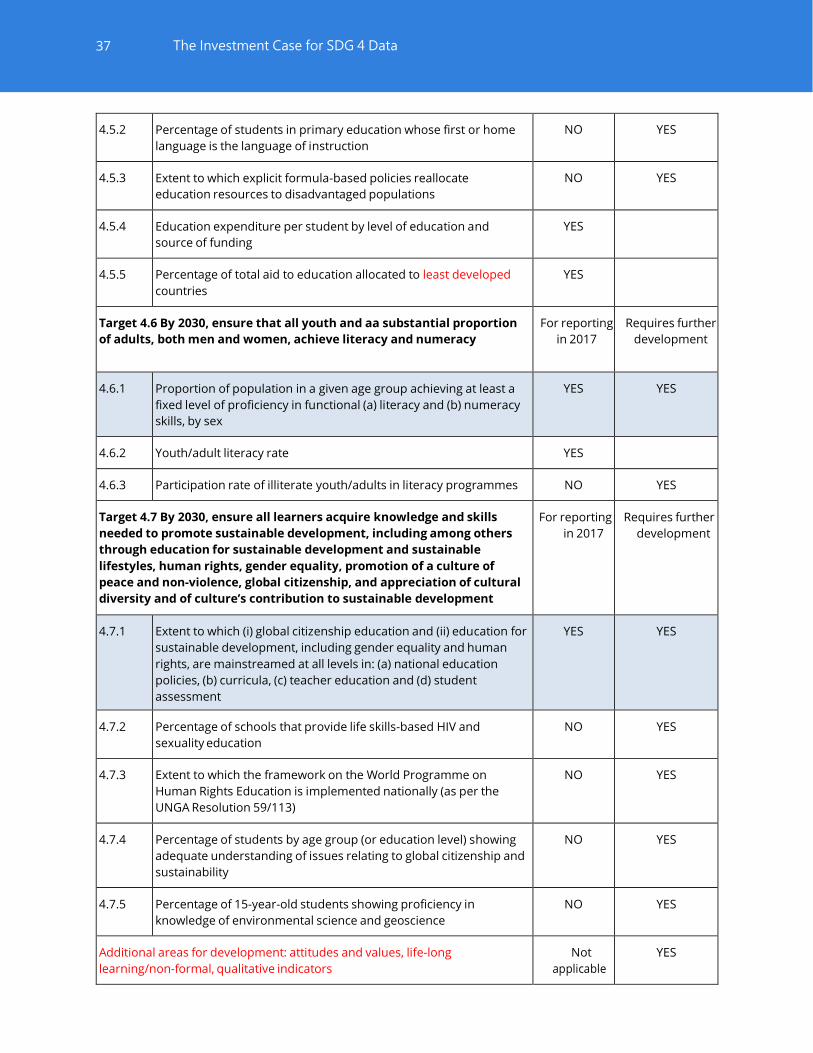
37
The Investment Case for SDG 4 Data
4.5.2
Percentage of students in primary education whose first or home
language is the language of instruction
NO
YES
4.5.3
Extent to which explicit formula-based policies reallocate
education resources to disadvantaged populations
NO
YES
4.5.4
Education expenditure per student by level of education and
source of funding
YES
4.5.5
Percentage of total aid to education allocated to least developed
countries
YES
Target 4.6 By 2030, ensure that all youth and aa substantial proportion
of adults, both men and women, achieve literacy and numeracy
For reporting
in 2017
Requires further
development
4.6.1
Proportion of population in a given age group achieving at least a
fixed level of proficiency in functional (a) literacy and (b) numeracy
skills, by sex
YES
YES
4.6.2
Youth/adult literacy rate
YES
4.6.3
Participation rate of illiterate youth/adults in literacy programmes
NO
YES
Target 4.7 By 2030, ensure all learners acquire knowledge and skills
needed to promote sustainable development, including among others
through education for sustainable development and sustainable
lifestyles, human rights, gender equality, promotion of a culture of
peace and non-violence, global citizenship, and appreciation of cultural
diversity and of culture’s contribution to sustainable development
For reporting
in 2017
Requires further
development
4.7.1
Extent to which (i) global citizenship education and (ii) education for
sustainable development, including gender equality and human
rights, are mainstreamed at all levels in: (a) national education
policies, (b) curricula, (c) teacher education and (d) student
assessment
YES
YES
4.7.2
Percentage of schools that provide life skills-based HIV and
sexuality education
NO
YES
4.7.3
Extent to which the framework on the World Programme on
Human Rights Education is implemented nationally (as per the
UNGA Resolution 59/113)
NO
YES
4.7.4
Percentage of students by age group (or education level) showing
adequate understanding of issues relating to global citizenship and
sustainability
NO
YES
4.7.5
Percentage of 15-year-old students showing proficiency in
knowledge of environmental science and geoscience
NO
YES
Additional areas for development: attitudes and values, life-long
learning/non-formal, qualitative indicators
Not
applicable
YES
38
The Investment Case for SDG 4 Data
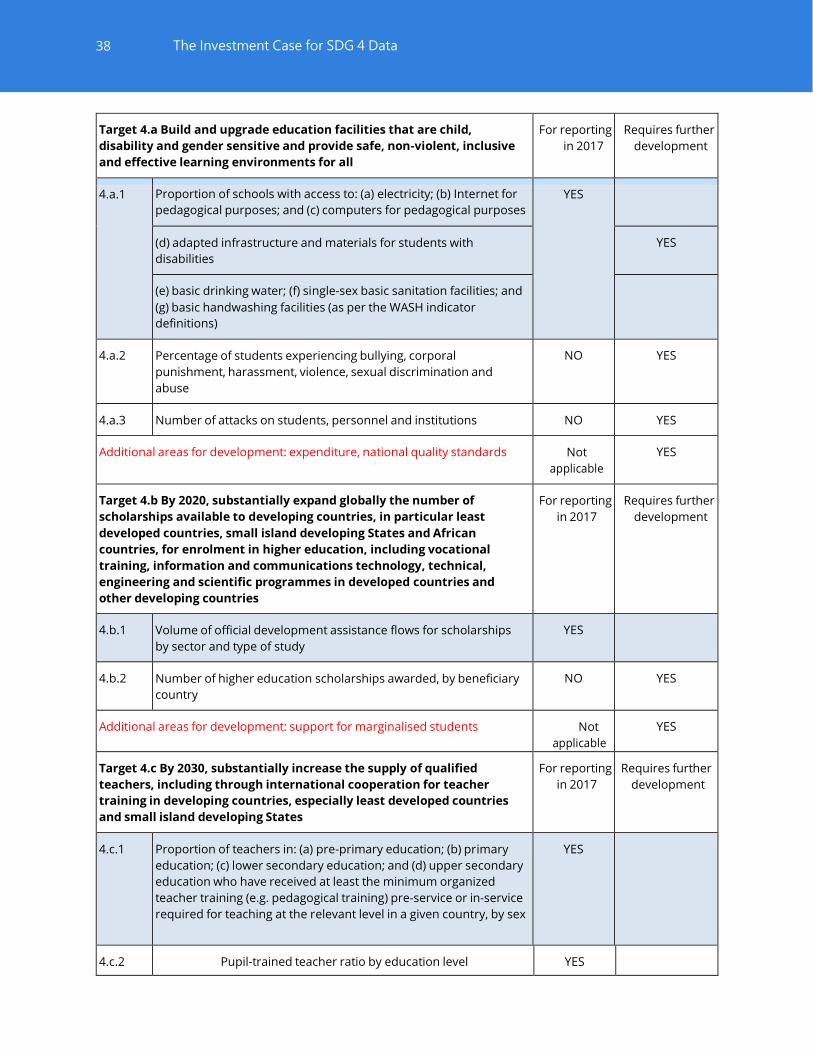
Target 4.a Build and upgrade education facilities that are child,
disability and gender sensitive and provide safe, non-violent, inclusive
and effective learning environments for all
For reporting
in 2017
Requires further
development
4.a.1 Proportion of schools with access to: (a) electricity; (b) Internet for
pedagogical purposes; and (c) computers for pedagogical purposes
YES
(d) adapted infrastructure and materials for students with
disabilities
YES
(e) basic drinking water; (f) single-sex basic sanitation facilities; and
(g) basic handwashing facilities (as per the WASH indicator
definitions)
4.a.2
Percentage of students experiencing bullying, corporal
punishment, harassment, violence, sexual discrimination and
abuse
NO
YES
4.a.3
Number of attacks on students, personnel and institutions
NO
YES
Additional areas for development: expenditure, national quality standards
Not
applicable
YES
Target 4.b By 2020, substantially expand globally the number of
scholarships available to developing countries, in particular least
developed countries, small island developing States and African
countries, for enrolment in higher education, including vocational
training, information and communications technology, technical,
engineering and scientific programmes in developed countries and
other developing countries
For reporting
in 2017
Requires further
development
4.b.1
Volume of official development assistance flows for scholarships
by sector and type of study
YES
4.b.2
Number of higher education scholarships awarded, by beneficiary
country
NO
YES
Additional areas for development: support for marginalised students
Not
applicable
YES
Target 4.c By 2030, substantially increase the supply of qualified
teachers, including through international cooperation for teacher
training in developing countries, especially least developed countries
and small island developing States
For reporting
in 2017
Requires further
development
4.c.1
Proportion of teachers in: (a) pre-primary education; (b) primary
education; (c) lower secondary education; and (d) upper secondary
education who have received at least the minimum organized
teacher training (e.g. pedagogical training) pre-service or in-service
required for teaching at the relevant level in a given country, by sex
YES
4.c.2
Pupil-trained teacher ratio by education level
YES
39
The Investment Case for SDG 4 Data
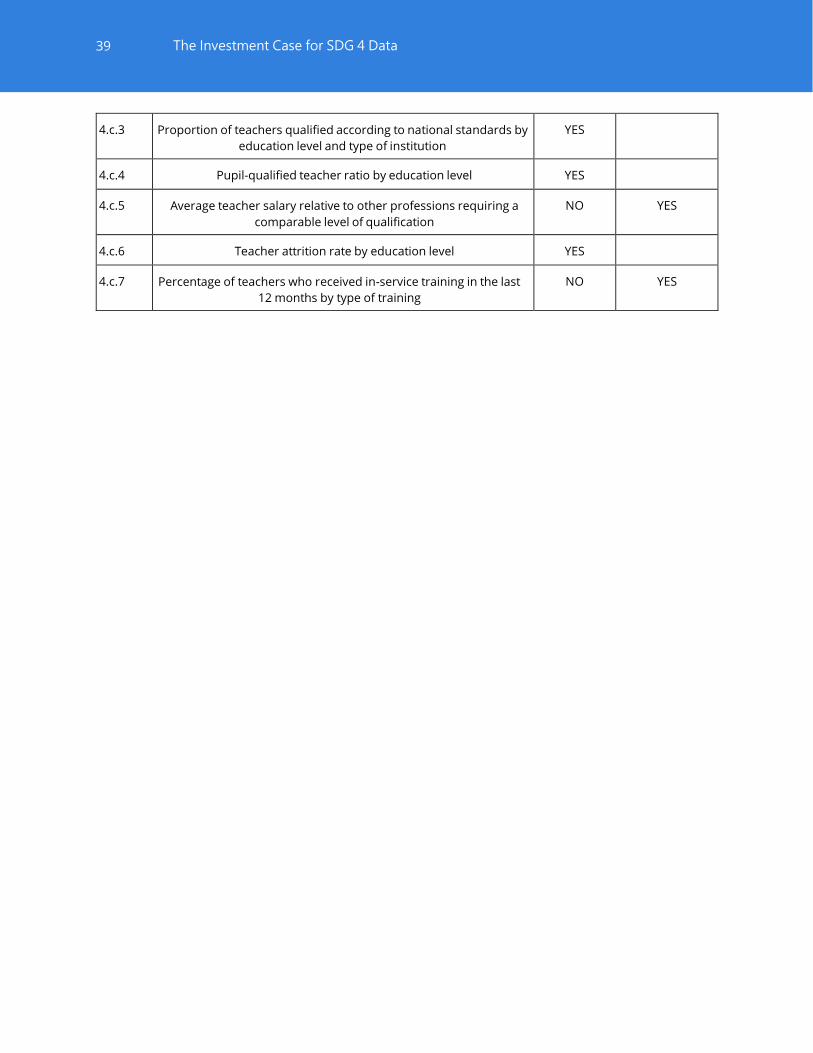
4.c.3
Proportion of teachers qualified according to national standards by
education level and type of institution
YES
4.c.4
Pupil-qualified teacher ratio by education level
YES
4.c.5
Average teacher salary relative to other professions requiring a
comparable level of qualification
NO
YES
4.c.6
Teacher attrition rate by education level
YES
4.c.7
Percentage of teachers who received in-service training in the last
12 months by type of training
NO
YES
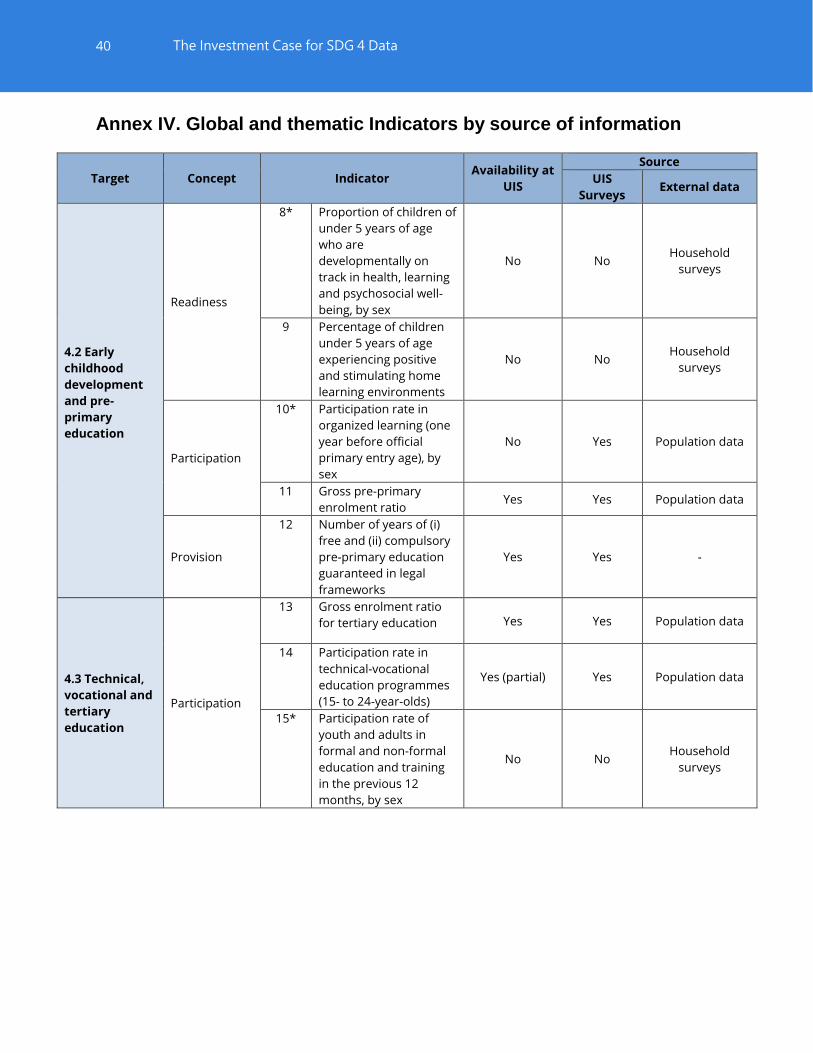
40
The Investment Case for SDG 4 Data
Annex IV. Global and thematic Indicators by source of information
Target Concept Indicator Availability at
UIS
Source
UIS
Surveys External data
4.2 Early
childhood
development
and pre-
primary
education
Readiness
8* Proportion of children of
under 5 years of age
who are
developmentally on
track in health, learning
and psychosocial well-
being, by sex
No No Household
surveys
9 Percentage of children
under 5 years of age
experiencing positive
and stimulating home
learning environments
No No Household
surveys
Participation
10* Participation rate in
organized learning (one
year before official
primary entry age), by
sex
No Yes Population data
11 Gross pre-primary
enrolment ratio Yes Yes Population data
Provision
12 Number of years of (i)
free and (ii) compulsory
pre-primary education
guaranteed in legal
frameworks
Yes Yes -
4.3 Technical,
vocational and
tertiary
education
Participation
13 Gross enrolment ratio
for tertiary education Yes Yes Population data
14 Participation rate in
technical-vocational
education programmes
(15- to 24-year-olds)
Yes (partial) Yes Population data
15* Participation rate of
youth and adults in
formal and non-formal
education and training
in the previous 12
months, by sex
No No Household
surveys

41
The Investment Case for SDG 4 Data
Target Concept Indicator Availability
at UIS
Source
UIS
Surveys External data
4.4 Skills for
employment,
decent jobs and
entrepreneurship
Skills
16.1 Percentage of youth/adults who
have achieved at least a minimum
level of proficiency in digital literacy
skills
No No
Learning
assessments
/other surveys
16.2* Proportion of youth and adults with
information and communications
technology (ICT) skills, by type of skill
No No Household
surveys (HHS)
17 Youth/adult educational attainment
rates by age group, economic
activity status, levels of education
and programme orientation
Yes (partial) Yes -
4.6 Equity
… * Parity indices (female/male,
rural/urban, bottom/top wealth
quintile and others such as disability
status and conflict-affected, as data
become available) for all education
indicators on this list that can be
disaggregated
Yes (only by
sex)
Depends
on the
indicator
Depends on the
indicator
Policy
18 Percentage of students in primary
education whose first or home
language is the language of
instruction
No
Could be
adapted
to
include
Learning
assessment/HHS
19 Extent to which explicit formula-
based policies reallocate education
resources to disadvantaged
populations
No No -
20 Education expenditure per student
by level of education and source of
funding
Yes Yes
21 Percentage of total aid to education
allocated to low-income countries
primary cycle, expressed as a
percentage of the actual number of
pupil-years).
No No OECD
4.6 Literacy
Skills
22* Percentage of population in a given
age group achieving at least a fixed
level of proficiency in functional (a)
literacy and (b) numeracy skills, by
sex
No No
Learning
assessments
/other surveys
23 Youth/adult literacy rate Yes Yes -
Provision
24 Participation rate of youth/adults in
literacy programmes No
Could be
adapted
to
include
Ideally HHS

42
The Investment Case for SDG 4 Data
Target Concept Indicator Availability at
UIS
Source
UIS
Surveys External data
4.7 Education
and
sustainable
development
Knowledge
25* Extent to which (i) global
citizenship education and (ii)
education for sustainable
development, including
gender equality and human
rights, are mainstreamed at
all levels in: (a) national
education policies, (b)
curricula, (c) teacher
education and (d) student
assessment
No No UNESCO survey
26 Percentage of students by age
group (or education level)
showing adequate
understanding of issues
relating to global citizenship
and sustainability
No No
Learning
assessments
/other surveys
27 Percentage of 15-year-old
students showing proficiency
in knowledge of
environmental science and
geoscience
No No
Learning
assessments
/other surveys
Provision
28 Percentage of schools that
provide life skills-based HIV
and sexuality education
No No, could
possibly be
adapted to
include
School-based
surveys
29 Extent to which the
framework on the World
Programme on Human Rights
Education is implemented
nationally (as per UNGA
Resolution 59/113)
No No OHCHR
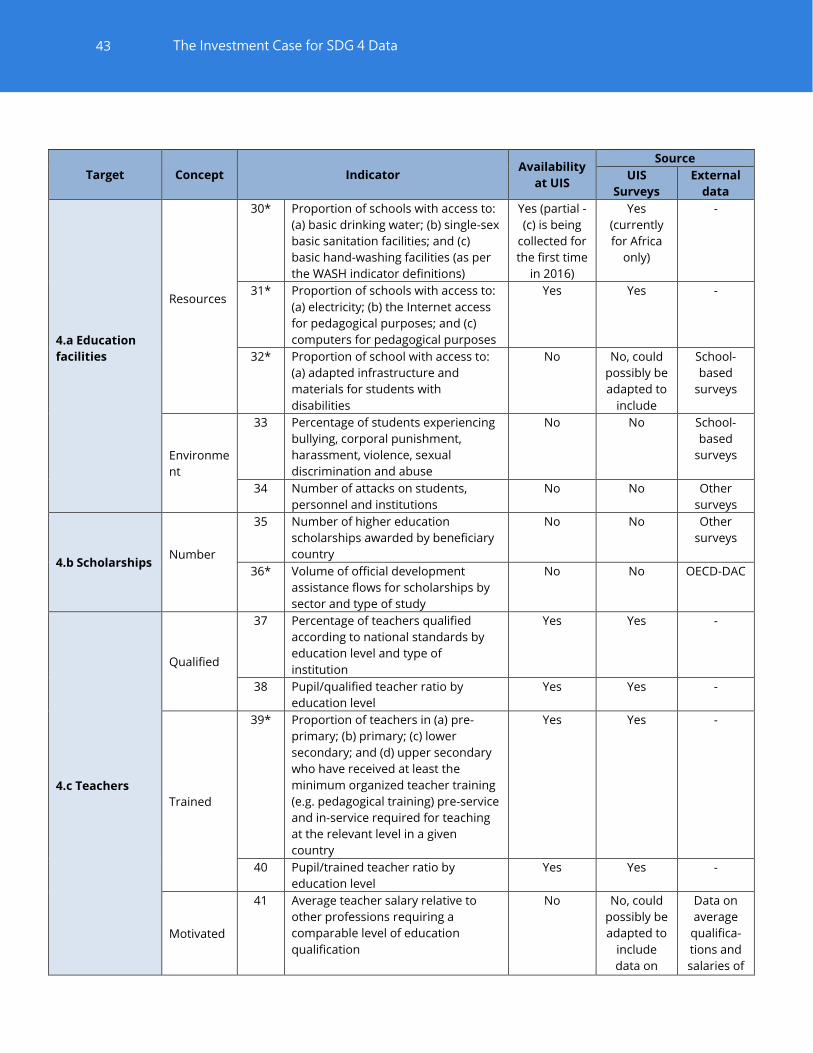
43
The Investment Case for SDG 4 Data
Target Concept Indicator Availability
at UIS
Source
UIS
Surveys
External
data
4.a Education
facilities
Resources
30* Proportion of schools with access to:
(a) basic drinking water; (b) single-sex
basic sanitation facilities; and (c)
basic hand-washing facilities (as per
the WASH indicator definitions)
Yes (partial -
(c) is being
collected for
the first time
in 2016)
Yes
(currently
for Africa
only)
-
31* Proportion of schools with access to:
(a) electricity; (b) the Internet access
for pedagogical purposes; and (c)
computers for pedagogical purposes
Yes Yes -
32* Proportion of school with access to:
(a) adapted infrastructure and
materials for students with
disabilities
No No, could
possibly be
adapted to
include
School-
based
surveys
Environme
nt
33 Percentage of students experiencing
bullying, corporal punishment,
harassment, violence, sexual
discrimination and abuse
No No School-
based
surveys
34 Number of attacks on students,
personnel and institutions
No No Other
surveys
4.b Scholarships Number
35 Number of higher education
scholarships awarded by beneficiary
country
No No Other
surveys
36* Volume of official development
assistance flows for scholarships by
sector and type of study
No No OECD-DAC
4.c Teachers
Qualified
37 Percentage of teachers qualified
according to national standards by
education level and type of
institution
Yes Yes -
38 Pupil/qualified teacher ratio by
education level
Yes Yes -
Trained
39* Proportion of teachers in (a) pre-
primary; (b) primary; (c) lower
secondary; and (d) upper secondary
who have received at least the
minimum organized teacher training
(e.g. pedagogical training) pre-service
and in-service required for teaching
at the relevant level in a given
country
Yes Yes -
40 Pupil/trained teacher ratio by
education level
Yes Yes -
Motivated
41 Average teacher salary relative to
other professions requiring a
comparable level of education
qualification
No No, could
possibly be
adapted to
include
data on
Data on
average
qualifica-
tions and
salaries of
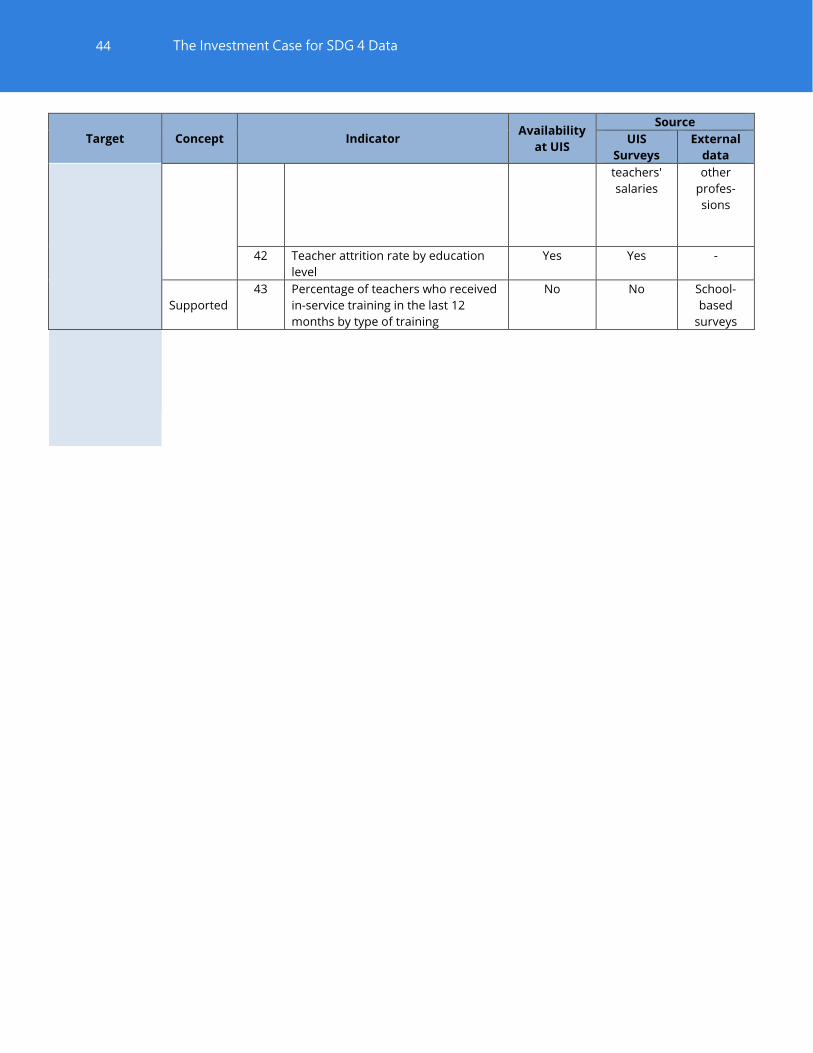
44
The Investment Case for SDG 4 Data
Target Concept Indicator Availability
at UIS
Source
UIS
Surveys
External
data
teachers'
salaries
other
profes-
sions
42 Teacher attrition rate by education
level
Yes Yes -
Supported
43 Percentage of teachers who received
in-service training in the last 12
months by type of training
No No School-
based
surveys
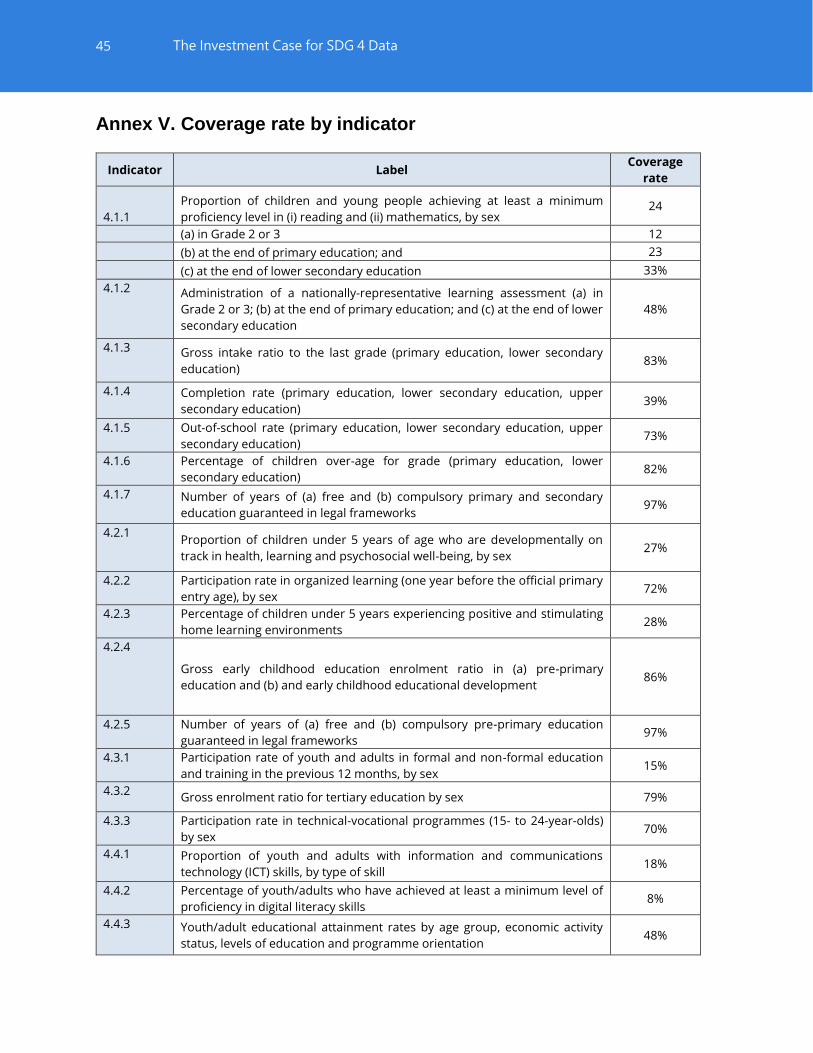
45
The Investment Case for SDG 4 Data
Annex V. Coverage rate by indicator
Indicator Label Coverage
rate
4.1.1
Proportion of children and young people achieving at least a minimum
proficiency level in (i) reading and (ii) mathematics, by sex 24
(a) in Grade 2 or 3 12
(b) at the end of primary education; and 23
(c) at the end of lower secondary education 33%
4.1.2 Administration of a nationally-representative learning assessment (a) in
Grade 2 or 3; (b) at the end of primary education; and (c) at the end of lower
secondary education
48%
4.1.3 Gross intake ratio to the last grade (primary education, lower secondary
education) 83%
4.1.4 Completion rate (primary education, lower secondary education, upper
secondary education) 39%
4.1.5 Out-of-school rate (primary education, lower secondary education, upper
secondary education) 73%
4.1.6 Percentage of children over-age for grade (primary education, lower
secondary education) 82%
4.1.7 Number of years of (a) free and (b) compulsory primary and secondary
education guaranteed in legal frameworks 97%
4.2.1 Proportion of children under 5 years of age who are developmentally on
track in health, learning and psychosocial well-being, by sex 27%
4.2.2 Participation rate in organized learning (one year before the official primary
entry age), by sex 72%
4.2.3 Percentage of children under 5 years experiencing positive and stimulating
home learning environments 28%
4.2.4
Gross early childhood education enrolment ratio in (a) pre-primary
education and (b) and early childhood educational development 86%
4.2.5 Number of years of (a) free and (b) compulsory pre-primary education
guaranteed in legal frameworks 97%
4.3.1 Participation rate of youth and adults in formal and non-formal education
and training in the previous 12 months, by sex 15%
4.3.2 Gross enrolment ratio for tertiary education by sex 79%
4.3.3 Participation rate in technical-vocational programmes (15- to 24-year-olds)
by sex 70%
4.4.1 Proportion of youth and adults with information and communications
technology (ICT) skills, by type of skill 18%
4.4.2 Percentage of youth/adults who have achieved at least a minimum level of
proficiency in digital literacy skills 8%
4.4.3 Youth/adult educational attainment rates by age group, economic activity
status, levels of education and programme orientation 48%

46
The Investment Case for SDG 4 Data
Indicator Label Coverage
rate
4.5.1 Parity indices (female/male, rural/urban, bottom/top wealth quintile and
others such as disability status, indigenous peoples and conflict-affected, as
data become available) for all education indicators on this list that can be
disaggregated
30%
4.5.2 Percentage of students in primary education whose first or home language
is the language of instruction 0%
4.5.3 Extent to which explicit formula-based policies reallocate education
resources to disadvantaged populations 0%
4.5.4 Education expenditure per student by level of education and source of
funding 51%
4.5.5 Percentage of total aid to education allocated to least developed countries
4.6.1 Percentage of population in a given age group achieving at least a fixed level
of proficiency in functional (a) literacy and (b) numeracy skills, by sex 13%
4.6.2 Youth/adult literacy rate 57%
4.6.3 Participation rate of illiterate youth/adults in literacy programmes 5%
4.7.1 Extent to which (i) global citizenship education and (ii) education for
sustainable development, including gender equality and human rights, are
mainstreamed at all levels in: (a) national education policies, (b) curricula, (c)
teacher education and (d) student assessment
0%
4.7.2 Percentage of schools that provide life skills-based HIV and sexuality
education 0%
4.7.3 Extent to which the framework on the World Programme on Human Rights
Education is implemented nationally (as per the UNGA Resolution 59/113) 0%
4.7.4 Percentage of students by age group (or education level) showing adequate
understanding of issues relating to global citizenship and sustainability 0%
4.7.5 Percentage of 15-year-old students showing proficiency in knowledge of
environmental science and geoscience 0%
4.a.1 Proportion of schools with access to: (a) electricity; (b) Internet for
pedagogical purposes; and (c) computers for pedagogical purposes;
Proportion of schools with access to: (d) adapted infrastructure and
materials for students with disabilities; Proportion of schools with access to:
(e) basic drinking water; (f) single-sex basic sanitation facilities; and (g) basic
handwashing facilities (as per the WASH indicator definitions)
21%
4.a.2 Percentage of students experiencing bullying, corporal punishment,
harassment, violence, sexual discrimination and abuse 24%
4.a.3 Number of attacks on students, personnel and institutions 0%
4.b.1 Volume of official development assistance flows for scholarships by sector
and type of study 70%
4.b.2 Number of higher education scholarships awarded by beneficiary country 0%
4.c.1 Proportion of teachers in: (a) pre-primary education; (b) primary education;
(c) lower secondary education; and (d) upper secondary education who
have received at least the minimum organized teacher training
(e.g. pedagogical training) pre-service or in-service required for teaching at
the relevant level in a given country, by sex
44%
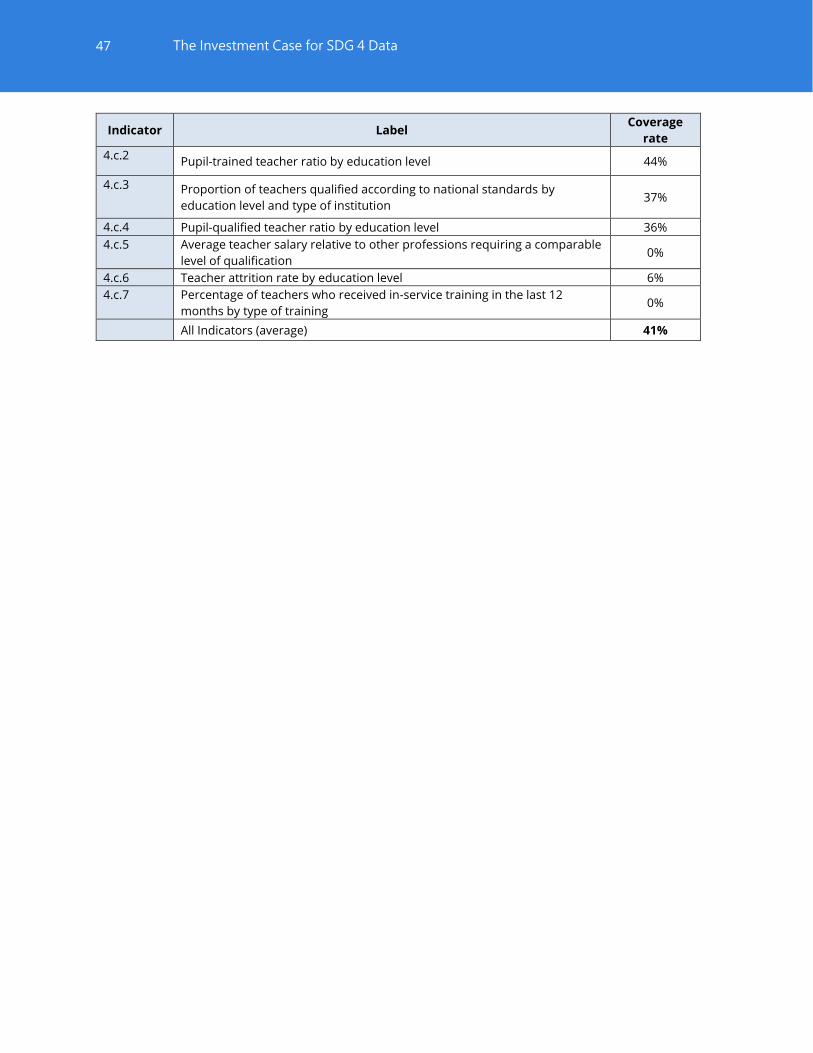
47
The Investment Case for SDG 4 Data
Indicator Label Coverage
rate
4.c.2 Pupil-trained teacher ratio by education level 44%
4.c.3 Proportion of teachers qualified according to national standards by
education level and type of institution 37%
4.c.4 Pupil-qualified teacher ratio by education level 36%
4.c.5 Average teacher salary relative to other professions requiring a comparable
level of qualification 0%
4.c.6 Teacher attrition rate by education level 6%
4.c.7 Percentage of teachers who received in-service training in the last 12
months by type of training 0%
All Indicators (average) 41%

48
The Investment Case for SDG 4 Data
Annex VI. Assumption and unit costs
The costs include economic and non-economic costs the economic costs run from methodological
developments to non-economic costs. Data collection, etc.). Costs are presented by indicator, by target
and by type of source of information. The following assumptions were made:
1. Only costs that are not the ongoing costs of institutions with budgets for already-performed key
tasks are considered. Tasks that add to the work of such institutions are counted. And any
completely new tasks are counted. Thus, for example, ongoing cost of EMIS offices in
countries, or cost of UIS in compiling, indicators that are already compiled (such as the
"completion rate"), are not included.
2. Innovations and improvements, in measurement of existing indicators, and one-off costs of adding
new indicators, are included, according to level of income of the country. "Cash" costs, even if for
repeat applications of ongoing efforts (e.g. repeat applications of an international assessment)
are counted and not considered as routine. The idea is to leave out the routine, ongoing
budgets of both local and global organizations that are already producing known goods.
3. It is assumed that the education sector is not budgeting for the cost of data that are needed but are
normally supplied by other sectors. This includes demographic data and "raw" financial data. It
is a major assumption, as the unavailability of some key data may hamper some indicator
production. However, there is little that the education sector can do about it, even if the
budget could be made available, due to authorization or mandate issues.
4. Core support of institutions for new tasks is assumed to be built up as driven by the need for new
indicators, and new capacities; they are not "plug" numbers for general support. The main
categories of cost are assumed to be "self-funded" (for example, ongoing EMIS-type activities
in all countries, new activities of all types in high- and upper-middle-income countries) and
"aid-funded."
5. Other categories seem more confusing than beneficial. In particular, whether costs are paid
out to international organizations can get confusing, as many of those costs, might get spent
or stay within country. The issue is whether countries can self-finance. We could try to include,
but it seems like a potentially misleading issue, and it does not help drive the ultimate estimate
of cost that international agencies ought to be prepared for.
6. Costs are not further disaggregated into constituent inputs of labour, transport, per diems, etc. It is
assumed that, for instance, certain workshops will, of course, require labour, transport, and
per diem, but the global cost of the workshop is listed. In that case, the lowest-level accounting
unit is "a workshop." In the case of support for institutions that underpin methodological
development or add value to data, it may be assumed that most of the cost is labour; and so
on.
49
The Investment Case for SDG 4 Data
7. The SDG are a massive effort from countries, therefore to provide a somewhat realistic
picture, it is assumed that not all countries will immediately test the full scope. The main
scenario assumes that country participation will "ramp up."
o For some indicators or activities, at first, there may be countries not participating. It is
assumed that by 2030 all countries participate. This will vary by indicator. It would be
too difficult to make calculations year by year.
o Thus, to keep matters simple, we have made it possible to offer a calculations for the
number of countries likely to be participating "on average" over the period 2020 to
2030. This is not simply the midpoint of a ramp-up from 0 to 100%, as in some cases
much more than 0% currently participate, and in most cases the ramp-up should be
expected to be non-linear.
o The default or baseline assumption is that all countries will “instantaneously” take up
any funding offer for learning assessments or EMIS improvements, but this may not
be realistic. The costing exercise could simulate a more gradual ramp-up that speeds
up as the years go by.
o All countries would carry out assessments in literacy and numeracy during primary, at
the end of primary, and at the end of lower secondary, as well as for youth and adults.
In addition, skills in ICT, global citizenship, and environmental issues.
o However, not all countries are assumed to self-fund these assessments. It would also
be possible to simulate a gradual ramp-up, assuming not all countries can start up all
these assessments at the same time. For now it is assumed that they can start at the
same time.
8. In the cost categorization (basic cost components) it is assumed that field applications of key
instruments already carry the workshops and training costs. Workshop and other such costs
are thus accounted for separately only when they are the only input in an activity, or are a key
methodological precursor to field applications.
9. It is assumed that global or regional agreement and methodological workshops need to be
explicitly budgeted only as a one-off cost in the initial period lasting one or two years (and in
some cases occasionally, again, after a few years), and that organizations will typically learn to
pay for their participation in such workshops out of the budget or revenue they derive from
implementation, once implementation starts. This assumption could be altered.
10. In learning assessments, it is assumed that the cost of capacity building is built into the cost
of participation.
11. It is assumed that most if not all of important data such as completion rates, that could be
derived from administrative data plus population data, will also be asked in household
surveys.

50
The Investment Case for SDG 4 Data
12. It is assumed that all indicators that require disaggregation will be gathered with the necessary
background information, to the extent possible, in household surveys and administrative
data. Thus the data-gathering cost is already included. Disaggregation, calculation of parity
indices, reporting will be, however, an, added-value feature that will increase the cost of global
agencies and will be modelled as such.
13. If one pays attention to the thematic indicators (or even some global ones), it is clear that most
existing surveys will not accept the addition of so many questions.
o Thus, if one is to be complete and include many of the thematic indicators, it is likely
that new surveys will be needed.
o And it should be clear that it will be much less expensive to create omnibus surveys to
take care of many of these issues at once, rather than to prepare special-purpose
surveys for each issue.
o This is the assumption that will be made for the % of indicators that need to be
gathered via surveys, or that one wishes to confirm with surveys.
14. However, the important assumption will be made that to draft the methodological aspects of certain
aspects of these surveys, separate expert meetings will be needed, per theme, even if the data
are actually gathered via "omnibus" surveys. Thus, there would be some up-front costs in
finalising methodology.
15. It is assumed that certain indicators that are a matter of policy (such as whether the
framework on the World Programme on Human Rights Education is implemented) are derived
by a combination of key informants and spot-checks, not through HH or facilities surveys.
o The "key informant" cost category will therefore budget for some spot checks. This
could be changed either to use key informants and reporters only (least
expensive), or to include in facilities surveys (more expensive).
16. For important indicators, those that are gathered via key informant and spot checks may be
duplicated with household or facilities surveys.
17. Costs were disaggregated between aid-funded and self-funded and by level of income of
countries.

51
The Investment Case for SDG 4 Data
50 (Approximate cash cost of a 1-week workshop in per diems, transport, and venue.)
25 (Approximate cash cost of 1 person month of technical assistance, including fringe benefits,
relevant overheads, etc., including non-labor costs.)
150 (Approximate cash cost of a 1-week workshop in per diems, transport, and venue.)
100 (Approximate 2-day global or regional workshop requring cash costs for countries and/or
less well-financed NGOs)
50 (Per survey, not per issue or theme)
5 (Per survey, not per issue or theme)
500 (Per survey, not per issue or theme, it is assumed that training costs are part of the cost of
participation.)
500 Many assessments do not use this default. It is assumed that training costs are part of the
cost of participation
200 (Yearly salary for mid-senior level, including fringe benefits, overheads, etc.)
15
(Assumed cost per country per year of application for accessing 20 days of key informant
time per year, plus a 10-school spot-check for all key issues, not per issue. Cost is average
across all countries but assuming labor of international caliber.)
20 (One-off equipment and other support for an EMIS office, repeatable every 5 years only in
selected LI settings.)