the intersection of hedonic and utilitarian values in … · . wang and scheepers (2003) studied...
TRANSCRIPT

THE INTERSECTION OF HEDONIC AND UTILITARIAN VALUES IN THE SUCCESS MODEL OF INFORMATION SYSTEM:
A STUDY ON SOCIAL MEDIA
GAFFAR HAFIZ SAGALA, AND SUMIYANA
Universitas Gadjah Mada
Abstract This study investigated the success of e-commerce using a new model that integrates the hedonic and utilitarian value in information systems. The new model was constructed based on the models created by Wang and Scheepers (2007) and Wang (2008). In other words, we modified and integrated both models into a new model. The results of the study suggest that the hedonic and utilitarian values could explain the behaviour of the user satisfaction and intention to repurchase. It means that the hedonic and utilitarian concepts improve the success model. Eventhough, the comparison shows that the utilitarian value-based model has a better goodness fit than that of the hedonic model, this study infers that both hedonic and utilitarian characteristic are actually not separated. We implies that all system developers should induce both hedonic and utilitarian contents into the systems they built. Keywords: hedonic value, utilitarian value, IS-success, user satisfaction,
user repurchase intentions, preposterous
SNA 17 Mataram, Lombok
Universitas Mataram
24-27 Sept 2014
1 File ini diunduh dari:
www.multiparadigma.lecture.ub.ac.id

Introduction
Most research in information technology (IT) focus on productivity-oriented (task-
oriented) IT, such as processing and distribution. And so, only a few study investigate
entertainment-oriented IT, such as virtual world and social network (Holsapple and Wu,
2007). Heijden (2004) classifies the type of entertainment-oriented system as the
hedonic information systems (HIS). The research of HIS is still relatively new and is a
domain that has not been widely explored (Wang and Scheepers, 2012). Hedonic
information systems researchers are still discussing the acceptability (Gu et al., 2010;
Heijden, 2004; Holsapple and Wu, 2007; Wang and Scheepers, 2012). Heijden (2004)
published a research about hedonic conditions in information systems under limited
conditions which is important to be validated.
IT user is not a simple user, in many conditions they are also customers
(Holsapple and Wu, 2007). Wang (2007) found that the success of information system
related to behavioural intention is determined by the customer satisfaction and
perceived value. The customer satisfaction and perceived value are formed by the
information quality, system quality, service quality (DeLone and McLean, 1993; 2003;
Seddon, 1997), perceived ease of use, perceived usefulness (Davis, 1989; Davis et al.,
1989; Roca et al., 2006), confirmation (Roca et al., 2006), cognitive absorption,
personal innovativeness, and playfulness (Agarwal and Karahana, 2000).
Several studies have examined the integration of utilitarian and hedonic
characteristics in information systems. The studies were conducted to determine the
acceptability of electronic commerce (Childers , 1991), and to predict the behavioural
intention to continue the use (Gu et al., 2010; Venkatesh et al., 2012; Zhou et al., 2012).
However, these studies have not been able to provide a comprehensive understanding
regarding the success of information system.
Electronic trading is fully mediated by IT, including the use of social media and
virtual world (Wells et al., 2011). Many companies begin to use social media platforms
such as twitter, facebook, blogs, and forums-host client to communicate with their
customers (Culnan et al., 2010). In Indonesia some private enterprises (retailers) begin
to use social media to do their business. Some online companies also use social media
for advertising purposes (for example tokobagus.com and berniaga.com). The three-
dimensional virtual worlds (3DVWs), such as second-life, have allowed many
companies to perform their business and marketing activities under more complex
environments. Culnan et al. (2010) found that of social media users, 64% of them use
SNA 17 Mataram, Lombok
Universitas Mataram
24-27 Sept 2014
2 File ini diunduh dari:
www.multiparadigma.lecture.ub.ac.id

social media for internal needs, 56% to communicate with customers, and 40% for
working with external partners or suppliers.
Holbrook and Hirschman (1982) explain the consumer behaviour from the
information processing and experiential perspective. In this case, the utilitarian value is
classified as processing of information while the hedonic value as experiential
perspective. The processing of information involves the left brain and the experiential
involves the right brain. This study sought to integrate the utilitarian and hedonic
characteristics in a framework of information system model, under assumption that the
individual needs are responded by the left and right brain. Therefore, each individual
has the utilitarian and hedonic needs. The integration of utilitarian and hedonic
characteristics in information system will encourage the efforts of extensive use of
information systems and the achievement of large market share for electronic trading
system.
Basically, information system has the hedonic and utilitarian characteristics that
are already attached. This study aimed to investigate the integration of hedonic and
utilitarian values into single success model of information system. This study
formulated six research questions, namely: 1) Does the hedonic value have a positive
effect on the flow experience? 2) Does the flow experience have a positive effect on the
user satisfaction? 3) Does the utilitarian value have a positive effect on the perceived
value? 4) Does the perceived value have a positive effect on the user satisfaction? 5)
Does the user satisfaction have a positive effect on the user repurchase intention? 6) Are
there any differences between the hedonic value and utilitarian values in explaining the
behaviour of user satisfaction and user repurchase intention?
Hedonic and Utilitarian Values
Hedonic consumption refers to the evocation of multisensory image, fantasy, and
emotion when using a product. The configuration of this effect is named the hedonic
response (Hirschman and Holbrook, 1982). The multisensory refers to the acceptance of
experience involving multiple sensory modalities including taste, sound, scent, tactile
and visual images (Hirschman and Holbrook, 1982). Consumers researchers typically
consider this experience as afferent (e.g., a product taste test). Hedonic perspective
argues that afferent receiving multisensory impulses is an important form of consumer
response (Berlyne, 1971, in Hirschman and Holbrook, 1982). Individuals not only
respond to the multisensory external stimuli (e.g.: perfume) by encoding the sensory
SNA 17 Mataram, Lombok
Universitas Mataram
24-27 Sept 2014
3 File ini diunduh dari:
www.multiparadigma.lecture.ub.ac.id

input, but also by producing multisensory images. For instance, smelling a perfume can
cause consumers just to not sense and encodes a scent, but also to produce internal
images featuring the sight, sound and tactile sensations, all of them are “experience“
(Hirschman and Holbrook, 1982).
The dominant goal of a system design is to encourage a long-term use of the
system (Heijden, 2004).The nature of the system, hedonic and utilitarian, can be viewed
as a tactic employed by the system developers to encourage the system use. The tactic
consists of the inclusion of hedonic content, such as animation, colour focus, sound,
interesting and aesthetical visual layout. The hedonic value of the system will generate
pleasant experience recieved by a user when using the system.
Hedonic perspective does not intend to replace the traditional consumption
theory, but rather to expand and improve its application (Hirschman and Holbrook,
1982). A product offers hedonic and utilitarian benefits to its consumers in the forms of
enjoyment experience or practical functions. Similarly, consumers have hedonic and
utilitarian purpose in their consumption activities (Hirschman and Holbrook, 1982;
Chitturi, 2008; Botti and McGill, 2010; Gu et al., 2010; Sindhav and Adidam, 2012;
Alex and Joseph, 2012; Ozen and Kodaz, 2012). Wu and Lu (2013) describes that the
hedonic value refers to the intrinsic motivations, while the utilitarian value to the
external motivations, that drive users to use the information systems. Intrinsic
motivation emphasizes on reasons that are controlled by experience, inherent in the
activity, and closely related to the individual’s interests (Wu and Lu, 2013).
The integration of hedonic and utilitarian characteristics in explaining the
consumers’ behaviour to purchase in electronic commerce has been conducted by
Childers (2001). Childers (2001) described the hedonic characteristics using the
perceived enjoyment and perceived ease of use, and described the utilitarian
characteristics using the perceived usefulness. Other information systems literature
explain that the perceived usefulness (utilitarian characteristics) and perceived
enjoyment (hedonic characteristics) are important antecedents for technology
acceptance (Wu and Lu, 2013). Social virtual service research also explained that the
hedonic and utilitarian values generate the affective commitment. In the end, the
affective commitment produces the intention to continue the use of social virtual service
(Zhou et al., 2012). Venkatesh et al. (2012) also stated that hedonic motivation
contributes to the behavioural intentions. Based on previous theory and research,
integrated hedonic and utilitarian values can function to stimulate a pleasant response.
SNA 17 Mataram, Lombok
Universitas Mataram
24-27 Sept 2014
4 File ini diunduh dari:
www.multiparadigma.lecture.ub.ac.id

Wang and Scheepers (2003) studied the emotional response and imaginal
response as the main predictor of intention to use HIS that is mediated by flow
experience. Emotional response refers to the individuals’ various feelings in experience
when interact with hedonic information systems. While the imaginal response was
refers to a psychological state. Hedonic information system users can escape or distract
themselves from unpleasant event or self projection into a certain role and character.
Imaginal response and emotional responses that adopted by hedonic theory is used to
reflect the hedonic information systems users that also acts as a hedonic consumers
(Wang and Scheepers, 2012).
Wang and Scheepers (2012) used PAD (pleasure, arousal, and dominance)
theory (Mehrabian and Russell, 1974) to explain emotional response, since they argued
that PAD theory can explain emotional responses more comprehensively. Several
previous studies that examined the impact of emotional responses on information
system acceptance used only one dimension of emotional response, such as enjoyment
(Heidjen, 2004), playfulness (Chung and Tang, 2004), or fun (Okazaki, 2007).
Therefore, it is necessary to investigate the emotional response using all dimensions
(Wang and Scheepers, 2012).
According to Wang and Scheepers (2012), using PAD emotional model
constructed by Mehrabian and Russell (1974), argued that affective responses to the
environment can be explained by three variables, namely the pleasure, aurosal, and
dominance. The pleasure is verbal expression when respondents reported feeling happy
as opposed to unhappy, pleased as opposed to annoyed, satisfied as opposed to not
satisfied, pleased as opposed to melancholy, hope as opposed to despair, and relaxed as
opposed to bored. The arousal is measured by verbal reaction to environment (e.g.,
excited as opposed to relaxed, eager as opposed to calm, frenzied as opposed to calm,
restless as opposed to dull, awake as opposed to drowsy and provoked as opposed to not
feel anything). Mehrabian and Russell (1974) stated that the quality to arise an
environment is to improve the novelty, complexity, intensity, understanding,
impossibility, change, mobility or uncertainty of regulation (Foxall and Greenley, 1998;
Foxall and Yani-de-Soriano, 2005; Wang and Scheeprs, 2012). The dominance is
shown by the users reported feelings of control as opposed to being controlled,
influential as opposed to being influenced, in control as opposed to being treated,
important as opposed to fascinated , dominant as opposed to defeated, and autonomous
as opposed to guided.
SNA 17 Mataram, Lombok
Universitas Mataram
24-27 Sept 2014
5 File ini diunduh dari:
www.multiparadigma.lecture.ub.ac.id

Extrinsic motivation is related to a variety of behaviours that made for reasons
beyond those inherent in the activity itself (Wu and Lu, 2013). In a job, this can be
illustrated by working for a salary. Work is an activity carried out by individual, while
salary is something beyong the job, but the salary is used as a reward to motivate
individual work quality. Within the context of interaction with HIS, though the use of
HIS is initiated by intrinsic motivation, yet the achievement of external objectives
depends on the interaction with the system itself (Childers et al., 2001, Heidjen, 2004;
Wang and Scheepers, 2012). The quality of individual interaction with the system
would be closely related to system quality itself. Referring to above questions, the
information systems success model of DeLone and McLean (1992, 2003) are suited to
explain the utilitarian characteristics in information system.
Perceived Quality
The purpose of utilitarian information system is to improve the performance and
efficiency of users’ job. Therefore, the developers align the functions of system with the
job requirements, and give as little as possible disruption to help users perform their
duties. The dominant goal of the design is productive use (Heijden, 2004). In utilitarian
perspective, the consumers concerned to buy the product in efficient way and timely to
achieve their objectives with minimal irritation levels (Childers, 200). That of course
requires good quality of information systems.
Internet is a phenomenon of communication and information system that is
suitable for DeLone & McLean Information System Success Model measurement
framework that built on communication theory (e.g., Shannon and Weaver, 1949)
(DeLone & McLean, 2003). In e-commerce, the main users are customers or suppliers
of the internet users. The customers and suppliers use the system to buy or to sell and to
conduct business transactions. Electronic trading decisions will have an impact on
individuals users, organizations, industries, economy and even national. This process of
communication and trade is match with updated DeLone & McLean Information
System Success Model with its six dimensions of success (DeLone & McLean, 2003).
Several studies have developed and validated information system success model
of DeLone & McLean (1997; 2003) which refers to users’ perception on the information
quality, system quality, and service quality as the antecedents of information systems
success (DeLone & McLean, 1992; Seddon, 1997; DeLone & McLean, 2003; Wang,
2008). The system quality is described as the presence or absence of errors in the
SNA 17 Mataram, Lombok
Universitas Mataram
24-27 Sept 2014
6 File ini diunduh dari:
www.multiparadigma.lecture.ub.ac.id

system, the consistency of user interface, the ease of use, the quality of documentation,
and sometimes the quality of program code maintenance (Seddon, 1997).
The information quality is related to issues such as the relevance, timeliness, and
accuracy of information generated by information system. However, not all IT
applications involve the production of information for decision making. For example,
word processing does not actually produce the information, so that the information
quality does not measure all things that can be applied to systems (Seddon, 1997).
Meanwhile, the service quality is an overall support delivered by the service provider,
regardless of whether the support is delivered by information systems department, new
organizational unit, or outsourced to an internet service provider (ISP). The importance
of service in this case is greater than ever. This is caused by the fact that the current
users are also the customers, so that the poor user support will mean the lost of
customers and sales (DeLone & McLean, 2003). In the e-commerce environment, the
impact of the web site design on customer purchases can not be understood without
evaluating the usability of web sites and relevance of information provided to
prospective buyers for a purchase decision (DeLone & McLean, 2003).
Flow Theory
Flow metaphor is one way to describe the actions in the moments that stand out as the
best part of life. Athletes describe it as “in the zone," a religious mystics describe it as
"ecstasy", artists and musicians describe it as "aesthetic" (Csikszentmihalyi, 1997).
Csikszentmihalyi (1975) describes this flow as the holistic sensation that people feel
when they act with total involvement. Meanwhile, Nah et al. (2011) defines flow as an
optimal state of experience, in which individuals are actually absorbed and involved in
activities that no other problems appear.
Siekpe (2005) explained when consumers shop at brick and mortar store, they
have opportunity to explore the aisles and check the product carefully and meticulously.
This experience may be enhanced by sensory stimulation with colourful displays,
ambient music, tempting aroma, products physical examination, and interaction with the
sellers or other customers. However, online shopping does not have such real
experiences, but rather produce convenience, cost and time savings.
Online consumers not only act as an ordinary buyer, but also as a computer user
(Siekpe, 2005). According Siekpe (2005), several retailers have created a world wide
website (www) which provides information to the user, ranging from store sites to sales
SNA 17 Mataram, Lombok
Universitas Mataram
24-27 Sept 2014
7 File ini diunduh dari:
www.multiparadigma.lecture.ub.ac.id
promotions, either to employment opportunities and product catalogue. The main
problem is not easy to build a website that is entertaining and interesting for visitors and
enabling them to interact, so visitors can complete a shopping transaction without
frustration. In an effort to build a website that attracts visitors to do electronic shopping,
flow merging has been proposed as one of the concepts to improve the quality of the
visitor experience when doing electronic shopping transactions. So that, flow
experience can cause repurchase intention, or back to the same site in the future
(Siepke, 2005).
Individual's involvement in a forum can give the sensation of flow, when the
forum is in accordance with the individual’s desire and ability. Thus, the individuals
will get the value they want in the engagement. Nah et al. (2011) explain that the
individuals’ involvement in virtual world will make them feel as being a part of the
virtual world, which makes them feel to have a role. And this can cause the flow
experience to them. Wang and Scheepers (2012) stated that the flow is very suitable to
describe the emotional involvement and experience absorption in playing activities.
Wang and Scheepers (2012) use the enjoyment, concentration, and time distortion as the
dimensions of the flow. The enjoyment reflects the user’s happiness and pleasure when
they interact with HIS. The concentration refers to the experience of total involvement
in the interaction that demands the other important attentions are overlooked. The time
distortion refers to the inability to realize the passage of time while interact with HIS.
Flow experience can be achieved when user skills match the challenges
presented by the system (Ghani and Deshpande, 1994; Wang and Scheepers, 2012).
Online flow may have consequences on improving learning, perceived behavioural
control, exploratory behaviour, positive subjective experiences, and distortions in time
perception (Novak and Hoffman, 1996). Overall, flow can affect the patterns of
navigation and repeated visits to a commercial sites (Siekpe, 2005).
Electronic Commerce and Social Media
IT-mediated e-commerce offers numerous organizational advantages (e.g., access to
more consumers, increased availability and accessibility information), but also comes
with some inherent challenges (Wells et al., 2011). The application of social media such
as twitter and facebook creates new opportunities for companies to improve their
internal operations and help the companies to collaborate in new ways with customers,
business partners, and suppliers (Culnan et al. 2010). IT does generally have a dramatic
SNA 17 Mataram, Lombok
Universitas Mataram
24-27 Sept 2014
8 File ini diunduh dari:
www.multiparadigma.lecture.ub.ac.id

impact on business operations (DeLone & McLean, 2003). The press gave a lot of
anecdotal evidence of the adoption of social media by a variety of companies ranging
from Fortune 500 to small businesses greatly. Achieving and measuring the business
value of social media continues to be a challenge for many organizations. However,
despite the wide spread use of social media, many respondents still report that the
applications have not provided measurable benefits when used either internally or by
customers and business partners (Culnan et al. 2010). DeLone & McLean (2003)
explains that the company made a large investment in e-commerce applications but are
sometimes difficult to assess the success of their e-commerce systems (DeLone &
McLean).
According to Culnan et al. study (2010), which is based on the analysis of the
use of four most popular social media platforms to interact with customers, i.e.: twitter,
facebook, blogs, and client-hosted forum, how people use these platforms varies
according to industry. He argues that in order to get the value of social media, the
companies need to develop an implementation strategy based on three elements:
voluntary adoption, community building, and absorptive capacity.
Holsapple and Wu (2007) indicate that the users of virtual world or social media
are hedonic individuals. Meanwhile, Gu et al. (2010) classify students as users of IT for
hedonic purpose and business workers as users of IT for utilitarian purpose. Instant
Messaging (IM) is used by teenagers for social entertainment, especially informal
conversation and socialization, such as the daily chat and event planning (Grinter &
Paylen, 2002; Lenhart et al., 2001; in Gu et al., 2010). While for the adults, IM is used
for work-related communication, because IM is a tool that supports the spontaneous and
opportunistic communication among colleagues and real-time communication with
customers for work-related projects (Huang & Yen, 2003; Gu et al., 2010).
This becomes a very interesting to be studied since the development of e-
commerce are no longer just based on HIS company website, but also began to extend
toward social media-based e-commerce. The achievement of voluntary adoption,
community development, and absorptive capacity make the companies’ competitive
advantage must meet the needs of user perception. Therefore, a comprehensive study is
needed to determine the indicators of the users’ needs fulfilment of e-commerce
information systems. On social media platforms, there are two characteristics of user;
the ones that using IT for entertainment purposes (hedonic) and productive purposes
(utilitarian) for the others.
SNA 17 Mataram, Lombok
Universitas Mataram
24-27 Sept 2014
9 File ini diunduh dari:
www.multiparadigma.lecture.ub.ac.id
Framework
This study considers the hedonic and utilitarian needs as the antecedents of information
systems success. This study used the emotional and imaginal response to describe the
hedonic value in information systems. The information quality, service quality, and
system quality are variables to describe the utilitarian value. Wang and Scheepers
(2012) using the flow experience as mediating variables between the hedonic value and
usage behaviour. Meanwhile, the user satisfaction is an important variable to measure
IS-success (DeLone and Mclean, 2003; Seddon, 1997; Wang, 2007). Accordingly, this
study uses the flow experience as variables to mediate the causal relationship between
the hedonic value and user satisfaction.
Customers who have first hand experience with electronic trading systems may
create values and satisfaction when using the system, but not in the pre-use situations
(Wang, 2007). Accordingly, the intention to re-use in the future is more appropriate to
measure the information system success (Wang, 2007). Therefore, this study uses the
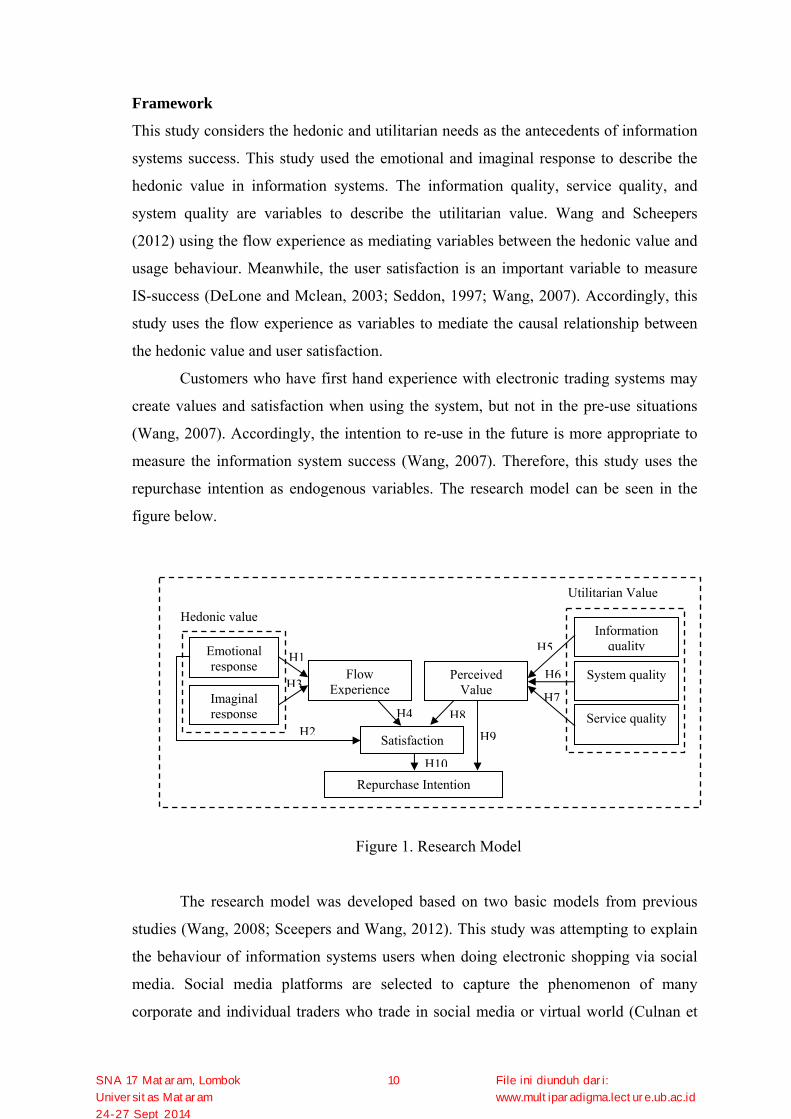
repurchase intention as endogenous variables. The research model can be seen in the
figure below.
Figure 1. Research Model
The research model was developed based on two basic models from previous
studies (Wang, 2008; Sceepers and Wang, 2012). This study was attempting to explain
the behaviour of information systems users when doing electronic shopping via social
media. Social media platforms are selected to capture the phenomenon of many
corporate and individual traders who trade in social media or virtual world (Culnan et
H1
H2
H3H6
H5
H4H7
H8
H10
H9
Emotional response
Imaginal response
Repurchase Intention
Satisfaction
Flow Experience
Perceived Value
Information quality
System quality
Hedonic value
Utilitarian Value
Service quality
SNA 17 Mataram, Lombok
Universitas Mataram
24-27 Sept 2014
10 File ini diunduh dari:
www.multiparadigma.lecture.ub.ac.id

al., 2010). The comparisons of both basic models were aimed to gain a deeper
understanding about those basic models. The results of the comparisons can be used in
the formulation consequential model best suited for information systems users in the
context of social media-based e-commerce. Furthermore, consequences and
appropriateness of the model can be useful to get the right composition in the system
design and decision-making for electronics-store owner to utilize the users’ behaviour
on doing deals and sales to achieve business goals. Both models are depicted as follows.
Figure 2 Hedonic value-based model
Adapted from Wang and Scheepers (2012)
Gamb
2.3.
Figure 3 Utilitarian value-based model
Adapted from DeLone and McLean (2003)
Hypothesis Formulation
Emotional response is reflected in hedonic customer consumption and behavioural
intention (Wang and Scheepers, 2012). On the other hand, satisfaction is an important
factor that affect the use of system. The user satisfaction also has the most powerful
individual direct effect (Igbaria and Tan, 1997). However, Wang and Scheepers (2012)
have not been able to deduce the effect of emotional responses to the satisfaction.
Repurchase
Satisfaction Perceived Value
Information quality
System quality
Service quality
Emotional response
Imaginal response
Repurchase Intention
Satisfaction
Flow Experience
SNA 17 Mataram, Lombok
Universitas Mataram
24-27 Sept 2014
11 File ini diunduh dari:
www.multiparadigma.lecture.ub.ac.id

Emotional response causes the feeling of pleasure that stimulates the individual to
preserve in the happy situation, it refers to the flow experience proposed by
Csikszentmihalyi (1975). Various feelings of pleasure experienced by user when using
the information system will build the satisfaction in him, and so the hypothesis is
formulated as follows.
H1: The emotional response has a positive effect on the flow experience.
H2: The emotional response has a positive effect on the satisfaction.
Flow is strongly associated with imaginal responses (projection of roles and
escapism). When individuals think that when the hedonic information systems allowed
them to escape from the real world or to project themselves into certain roles, they are
more likely undergo the flow experience and absorption or being lost in the system
(drift) (Holsapple and Wu, 2007; Wang and Scheepers, 2012). That feeling would build
perceived benefits on the users’ hedonic value (Zhou et al., 2012) as the users’ hedonic
needs fulfilment. It also has implications to the satisfaction, since the users get in the
situation that is in accordance with their expectations (projection of role and escapism).
This study formulates hypotheses as follows.
H3: The imaginal response has a positive effect on the flow experience.
H4: The flow experience has a positive effect on the user satisfaction.
In this case, the users will feel that the information system is valuable if they
could find the information they need easily and without excessive cost. The cost refers
to money, time, or other sacrifices. Information system service can quickly resolve the
problems that occur in the system. However, in service quality context, the devices that
are used must support the service that being used by individuals. Complete information,
easy and quick access, and other supportive information will meet the users’ productive
needs. When the users’ needs were accommodated just as they expected and the related
costs (monetary/non-monetary) were deemed appropriate, the users feel happy and
satisfied. This study formulated the following hypotheses:
H5: The information quality has a positive effect on the perceived value.
H6: The system quality has a positive effect on the perceived value.
SNA 17 Mataram, Lombok
Universitas Mataram
24-27 Sept 2014
12 File ini diunduh dari:
www.multiparadigma.lecture.ub.ac.id

H7: The service quality has a positive effect on the perceived value.
H8: The perceived value has a positive effect on the users satisfaction.
A higher level than the acceptability of use is the intention to reuse. Several
studies have examined the association of the perceived value and satisfaction with the
intention to use, intention to repurchase, or intention of sustainable use (DeLone &
McLean, 1992; Seddon, 1997; DeLone & McLean, 2003; Wang, 2007; Wells et al.
2011; Roca et al., 2006; Zhou, 2012). The perceived value refers to the costs and
benefits incurred by users of e-commerce information systems (Wang, 2007), that will
stimulate the feeling of appropriate or lucky for electronic commerce information
systems user. The satisfaction refers to the consumers’ feeling of benefit from certain
services (Kim and Son, 2009; Zhou, 2012). Furthermore, the feeling of appropriate
stimulates the consumers to buy again. Consistent with previous studies, this study
formulated hypotheses as follows.
H9: Perceived value has a positive effect on the repurchase intention.
H10: User satisfaction has a positive effect on the repurchase intention.
Population and Sample
This study population is the users of popular social media in Indonesia, i.e. Facebook,
Twitter, Kaskus, and BlackBerry Messenger (BBM), as those platforms are most
demanded by social media users in Indonesia. From the social media users, the users
who have ever did the online shopping with one of the existing electronic traders in
social media. The sample was taken using a snowball technique.
Data Collection Method
Data for all variables of this study were collected using a questionnaire in survey
method. The survey is a measurement process that is used to collect information in a
structured interview, with or without the interviewer (Cooper and Schindler, 2011). The
survey was conducted by issuing an electronic questionnaire on online store social
media page. The users have the freedom to choose to be respondents or not. The data
collection was also conducted using paper questionnaires. The questionnaires were put
in the place where the goods from online store are taken by the costumers who choose
cash on delivery shopping methods. The customers also have the freedom of choosing
SNA 17 Mataram, Lombok
Universitas Mataram
24-27 Sept 2014
13 File ini diunduh dari:
www.multiparadigma.lecture.ub.ac.id

to be respondents or not. The consistency of the results of electronic and paper
questionnaires will be tested by the sensitivity test.
This research instruments were adapted from Wang and Scheepers (2012) and
Wang (2007). The instruments adapted from Wang and Scheepers (2012) are used to
assess the variables of emotional response, response imaginal, and flow experience. The
instruments adapted from Wang (2007) are used to assess the variable of information
quality, system quality, service quality, perceived value, user satisfaction, and
repurchase intention. These instruments were used with hopes that the questionnaires
have the data reliability and are able to translate the phenomena as the researcher’s
expectations. These instruments were used becuase their validity and reliability had
been verified in previous studies. The instruments were established in Likert scale (7
scales) like the previous studies.
Research Variables and Operational Definition of Variables
Operational definition is the attachment of a meaning into a construct or variable by
specifying the activities or actions to measure the variable (Kerlinger, 2006). Research
variables and operational definitions of the variables of this study can be reviewed in
Table 1.
Table 1. Research Variables and Operational Definitions
No Variable Operational Definition 1. Emosional
Response Various feelings in the experience when interacting with social media while doing electronic shopping (Wang and Scheepers, 2012)
2. Imaginal Response
Psychological state in which social media user distract himself from unpleasant events into a particular role or character when doing electronic shopping (Wang and Scheepers, 2012)
3. System Quality
User perception of the consistency of user interface, ease of use, and quality of documentation when doing electronic shopping in social media (Seddon, 1997)
4. Information Quality
User perception about relevance, timeliness, and accuracy of information generated by electronic commerce information systems in social media (Seddon, 1997)
5. Service Quality
User perception of the overall support delivered by service provider when doing electronic shopping in social media. Regardless of whether this support is delivered by the department of information systems and electronic traders on social media pages (Seddon, 1997)
6. Flow Experience
Holistic sensation felt by user when subjected to total involved in the use of social media when shopping online (Csikszentmihalyi, 1975)
7. Perceived Value
User perceptions of information systems in assessing effort to do compared to the benefits derived from the use of information systems when doing electronic shopping in social media (Wang, 2008)
8. User Favorable feelings towards consumer services obtained from the use of
SNA 17 Mataram, Lombok
Universitas Mataram
24-27 Sept 2014
14 File ini diunduh dari:
www.multiparadigma.lecture.ub.ac.id

Satisfaction social media when doing electronic shopping (Wang, 2008) 9. Repurchase
Intention Encouragement of individuals to re-do the electronic shopping via social media (Wang, 2008)
Convergent Validity Test
The convergent validity tests employed in this study comprise of the analysis factor and
average variance extracted (AVE). Factors loadings indicate a convergence for all latent
constructs. All factor loading should be 0.5 or higher, 0.7 or higher is preferable
(Fornell and Larcker, 1981; Hair, 2010; Hartono, 2012). The results shows that the
entire values of factor loading (see Appendix 2 for detail) are more than 0.50, except
RESIM3 (0.00) and RESEM3 (-0.05). Consequently, both variables were excluded for
the further analysis.
AVE measurement of each construct was made to increase the confidence of
convergent validity of the constructs in this study. Hair et al. (2010) claim that if the
AVE values were above 0.5 then the construct has good convergent validity. The AVE
measurement results (Appendix 2) show that the validity of this study has good
convergence, since the overall value AVE constructs was above 0.5.
Reliability Test
This study examined the consistency of internal reliability using cronbach’s alpha
measure. The consistency of internal reliability has a maximum value of 0.6 (Malhotra
& Galleta, 2005; Malhotra, Kim and Agarwal, 2004; Sumiyana, 2007). The lowest
value of Cronbach’s Alpha for each variable is this study is still more than 0.6, as
presented in appendix 2. The results show that two items from the questionaire need to
be excluded before the subsequent data analysis. The excluded items consist of the
imaginal response item number 3 with a Cronbach 's Alpha value of 0.864 (above
0,787) and emotional response item number 3 with the value of Cronbach 's Alpha of
0.942 (above 0.910). These results are consistent with the previous convergent validity
results, which shows that the both items do not correspond to their latent constructs.
Discriminant Validity Test
Discriminant validity indicates the extent to which a construct is trully distinctive from
other constructs (Hair et al., 2010). High discriminant validity provides evidence that a
construct is unique and is able to capture some phenomena other measure are not (Hair
et al., 2010). The test consists of the confirmatory factor analysis (CFA) and average
SNA 17 Mataram, Lombok
Universitas Mataram
24-27 Sept 2014
15 File ini diunduh dari:
www.multiparadigma.lecture.ub.ac.id

variance extracted (AVE). Confirmatory factor analysis (CFA) was used to confirm that
the constituent items are communed into the appropriate construct. The results showed
that the communality factor numbers are above 0.7. It can be concluded that the
discriminant validity was proven (Malhotra & Gulleta, 2005; Malhotra, Kim and
Agarwal, 2004; in Sumiyana, 2007). The CFA test results showed that all question
items were communed into nine factors and the variables were consistently valid.
Appendix 3 shows in detail that items question were communed into one construct with
the lowest value of 0.61 and the highest value of 0,94.
The second way to assess the discriminant validity is comparing the average
variance extracted (AVE) of a construct with the square of correlations of the construct
with other constructs in the model. According to Hair et al. (2010), an AVE value of a
construct that was higher than the square of correlations of the construct with other
constructs in the models shows good discriminant validity. Appendix 4 shows the AVE
values in the diagonal position of the table, and the square of correlation of a construct
with the others were shown below the each AVE values. The results show that each
construct has the AVE value which is higher than the square of correlation value of the
construct with the others. Thus, we can conclude that the indicator items used in this
study met the criteria of discriminant validity. The results of discriminant validity test
were summarized in Table 2 as follows.
Table 2. Discriminant Validity Test
Methods Results Conclusions
CFA CF value > 0.7 Valid
AVE r2 values < AVE
values
Valid
Results of Data Collection
From the electronic questionnaire which were published in social media, 128 responses
were obtained, although 6 response of them contained errors due to lack of response or
double responses from single respondent. Meanwhile, from 200 non-electronic
questionnaires, 155 responses were filled, and the all responses can be used, so we get a
total of 277 responses. The demographics characteristics describe the sample by age and
sex. The demographics characteristics of the obtained sample are as follows. Male
respondents number 99 people (35.74 percent) and female participants number 178
SNA 17 Mataram, Lombok
Universitas Mataram
24-27 Sept 2014
16 File ini diunduh dari:
www.multiparadigma.lecture.ub.ac.id

people (64.26 percent). Most respondents are 21-25 years old, while the least are older
than 40 years old. The demographics characteristics are displayed in detail in Table 3 as
follows.
Table 3. Demographic Characteristics of Respondents
Indicators Sum Percentage Age
15-20 years 71 25,70% 21-25 years 105 37,90% 26-30 years 53 19,10% 31-35 years 31 11,20% 36-40 years 9 3,20% > 40 years 8 2,90%
Total 277 100% Sex
Male 99 35,74% Female 178 64,26%
Total 277 100% Data collection
Electronic questionaire 122 44,04% Non-electronic questionaire 155 55,96%
Total 277 100%
Descriptive Statistics
The value of each variable were obtained from the average value of its constituent
items. These average values were then used for further analysis. Table 4 below presents
the results of descriptive statistics including mean, median, minimum, maximum, and
standard deviation values for each variable. The results show that all variables have
good distribution since all their values of standard deviation are less than their mean
values.
Table 4. Descriptive Statistics
No. Variable
Mean Median Min. Max. Std.
Deviation1. RESEM 4.64 4.66 1.83 6.66 0.99 2. RESIM 4.89 5.00 2.44 6.88 1.01 3. FLOWEX 4.49 4.77 2.33 7.00 1.03 4. INFQU 4.74 5.00 2.25 7.00 1.13 5. SYSQU 4.65 4.80 1.20 7.00 1.22 6. SERQU 4.44 4.33 1.00 7.00 1.32 7. PERVAL 4.68 5.00 1.00 7.00 1.33 8. SATIS 4.86 5.00 2.00 7.00 1.15 9. INREUSE 4.93 5.00 1.66 7.00 1.08 Valid N (listwise) 277
SNA 17 Mataram, Lombok
Universitas Mataram
24-27 Sept 2014
17 File ini diunduh dari:
www.multiparadigma.lecture.ub.ac.id

Hypothesis Testing
This study used the Structural Equation Modelling (SEM) for hypothesis testing. The
SEM is built on the foundation of two familiar multivariate techniques that are
multivariate regression and factor analysis (Hair, et al., 2010; Gudono, 2010). The SEM
is relatively more dynamic and sophisticated analysis for suitability models than
regression (Animesh, et al., 2011). The estimation technique of the structural equation
model used in this study is the Maximum Likelihood Estimation (MLE). The MLE is a
flexible approach for parameter estimation in terms of the parameter value with the best
possibilities to get the best suitability model (Hair, et al., 2010). The estimation used the
help of a statistical analysis software called LISREL 8.8. It is a flexible program and
can be used in some situations (cross-sectional, experiment, quasi-experimental, and
longitudinal studies). The model have both positive and negative determination
relationships (Sumiyana, 2007). This is shown by the coefficients of relationship path of
each variable and its t value. The path coefficients values and their t values can be seen
in the following table.
Table 5. Hypothesis testing
No. Hypothesis Coef t-stat Status
1. Hypothesis 1 (+) E. Response Flowex (ρx6x1) 0.76 9.29 Supported 2. Hypothesis 2 (+) E. Response Satis (ρx8x1) 0.003 0.03 Not supported 3. Hypothesis 3 (+) I. Response Flowex (ρx6x2) 0.07 1.02 Not supported 4. Hypothesis 4 (+) Flowex Satis (ρx8x6) 0.45 5.78 Supported 5. Hypothesis 5 (+) Infqu Perval (ρx7x3) 1.04 9.19 Supported 6. Hypothesis 6 (+) Sysqu Perval (ρx7x4) 0.73 5.18 Supported 7. Hypothesis 7 (+) Serqu Perval (ρx7x5) -0.87 -6.14 Not supported 8. Hypothesis 8 (+) Perval Satis (ρx8x7) 0.75 9.62 Supported 9. Hypothesis 9 (+) Perval Reint (ρyx7) -0.31 -3.47 Not supported
10. Hypothesis 10 (+) Satis Reint (ρyx8) 1.06 8.82 Supported
The results of SEM mesurement show that the influence of emotional response
to the flow experience has a coefficient of 0.76 and t value of 9.29 that is statistically
significant, and so the hypothesis H1 is supported. It can be concluded that the
emotional responses have a role in the achievement of the flow experience for the
individuals who perform electronic shopping via social media. On the other hands, the
influence of emotional responses to the user satisfaction is positive insignificant, since it
has the coefficient of 0.003 and the t value of 0.03 that is not statistically significant.
Accordingly, the hypothesis H2 is not supported. Higher emotional responses do not
increase the user satisfaction.
SNA 17 Mataram, Lombok
Universitas Mataram
24-27 Sept 2014
18 File ini diunduh dari:
www.multiparadigma.lecture.ub.ac.id

The imaginal response does not show significant effect to the flow experience
with path coefficients value of 0.07 and t value of 1.02 that is not statistically
significant, and so the hypothesis H3 is not supported. The imaginal response has not
been able to make the users reluctant when doing electronic shopping via social media
to quickly move from the online store. The flow experience affect significantly the user
satisfaction, with the path coefficient value of 0.45 and a t value of 5.78 that is
statistically significant, and consequently, the hypothesis H4 is supported. It means that
higher flow experience when doing online shopping via social media will result in
higher level of users satisfaction.
The information quality has a significant effect on the perceived value. The path
coefficient of information quality is the biggest compared to that of the system quality
and service quality. The information quality to the perceived value has a path
coefficient value of 1.04 and a t value of 9.19 that is statistically significant, therefore
the hypothesis H5 is supported. This suggests that the information quality has an
important role in the formation of perceived value of online store information systems.
The path of system quality to the perceived value has a coefficient value of 0.73 and a t
value of 5.18 that is statistically significant, so the hypothesis H6 is supported. The
system quality significantly affects the perceived value. Therefore, the system quality
has a role in the formation of perceived value when the customers did online shopping
in social media. The path of service quality to the perceived value is known to have a
coefficient of -0.87 and a t value value of -6.14 that is not statistically significant, so the
hypothesis H7 is not supported. This suggests that the service quality does not affect the
perceived value. The path of perceived value to the user satisfaction showed a
significant effect of coefficient value of 0.75 and a t- statistic of 9.62 that is statistically
significant, and accordingly, the hypothesis H8 is supported. This suggests that the
higher perceived value of the individual will yield in a greater satisfaction to the users.
The path of perceived value to the repurchase intention have a coefficient of -
0.31 and a t value of -3.47 that is not statistically significant, then hypothesis H9 is not
supported. Meanwhile, the user satisfaction showed a positive and significant effect to
the repurchase intention. It is shown by the value of path coefficient that is 1.06 and a t
value that is 8.82 that is statistically significant, so the hypothesis H10 is supported.
This suggests that higher user satisfaction will be achieve higher repurchase intention in
the online shopping via social media. The not supported hypothesis H9 and supported
H10 suggests that the user satisfaction becomes an important pathway in the
SNA 17 Mataram, Lombok
Universitas Mataram
24-27 Sept 2014
19 File ini diunduh dari:
www.multiparadigma.lecture.ub.ac.id

development of repurchase intention. The overall results of the hypotheses examination
can be illustrated by the following figure.
Figure 1. Result Model
Goodness-of-Fit Model
After the calculation of model estimation, the validity and reliability of the
model is tested. The model’s validity depends on the acceptance level of the model’s
goodness-of-fit (GOF) and the validity of the constructs used. The GOF indicates how
well the model and is evaluated by the covariance matrix among the indicator items
(Hair et al., 2010). The results of GOF analysis are presented in Table 6 as follows.
Table 6. Goodness-of-Fit Measurement
GOF Index Indicators Estimation Status Chi-Square Small score (p>0.05) 1868,27 (p=0.00) Low Fit NCP, Interval Small score, narrow
interval 942,62, (825,01; 1067,95)
Medium Fit
RMSEA, p(close-fit)
RMSEA ≤ 0,08 (p≥0.50) 0.064 (p=0.00) Good Fit
ECVI Small score, close with ECVI saturated
M*=7,23, S*=6,86, I*=136,51
Good Fit
AIC Small score, close with AIC saturated
M*=1994,62, S*=1892.00, I*=37675.42
Good Fit
CAIC Small score, close with CAIC saturated
M*=2484,76 S*=6266,32, I*=37874,25
Low Fit
NFI Above 0.90 0.95 Good Fit NNFI Above 0.90 0.97 Good Fit
0,07
0,76
0,45
0,75
1,04
0,003
0,73
-0,87
1,06
-0,31
Emotional response
Imaginal response
Information quality
System quality
Service quality
Flow Experience
Perceived Value
Satisfaction Repurchase Intention
1,00
1,00
1,00
1,00
1,00
1,00
1,00
1,00
1,00
SNA 17 Mataram, Lombok
Universitas Mataram
24-27 Sept 2014
20 File ini diunduh dari:
www.multiparadigma.lecture.ub.ac.id

CFI Above 0.90 0.97 Good Fit IFI Above 0.90 0.97 Good Fit RFI Above 0.90 0.95 Good Fit CN Above 200 139.61 Medium Fit RMR Standardized RMR ≤ 0,05 0.14 Low Fit GFI Above 0.90 0.77 Low Fit AGFI Above 0.90 0.74 Low Fit
*M = Model ; S = Saturated ; I = Independence
Absolute index of the goodness of fit of the models are shown by the RMSEA
index (0.064) with p-value (0.00), ECVI index (M*= 7.23, S*= 6.86, I*= 136.51), and
AIC index (M*= 1994.62, S*= 1892.00, I*= 37675.42). The index of RSMEA falls
below the critical value (≤ 0.08) and p ≤ 0.05 and therefore, it shows good fit. The value
of ECVI model shows minor difference with ECVI-saturated value than that with
ECVI-independence. Similarly, the index of AIC model shows minor differences with
AIC-saturated than that with AIC-independence. Thus, the indexes of ECVI and AIC
show that the model has a good fit. Meanwhile, the indexes of χ2 (1838.64), SRMR
(0.13), CAIC (M*= 2484.76, S*=6266.32, I*= 37874.25), GFI (0.77), and AGFI (0.74)
do not show a support to a good fit. These indexes indicate low model fit.
Incremental indexes of the goodnes of fit of the model that consist of NFI (0.95),
NNFI (0.97), CFI (0.97), IFI (0.97), and RFI (0.95) show that the model has good fit.
Other indicator, namely CN (141.85) indicates that the model has close fit. Overall
indexes show that most indexes indicate the good fit. It can be concluded that the new
model which integrates hedonic and utilitarian value has a good fit.
Model Comparison Tests
The comparison between hedonic and utilitarian values in their role to explain the user
satisfaction and intention repurchase were reviewed in terms of the fitness of both
model. The better fit suggests which model that has a better frame to explain the
dependent variable empirically. The comparison can be seen in detail in Appendix 5.
The absolute goodness-of-fit index of χ2 (Ut: 430.80; Hd: 852.42) indicates the
utilitarian value-based model has a higher goodness-of-fitm since it has the χ2 value that
is smaller than that of the hedonic value-based model. The RMSEA (Ut: 0,072; Hd:
0.075) and GFI (Ut: 0.87; Hd: 0.81) of both model do not have differences. The
RMSEA values fall below the critical value (0.08). The GFI values of both models are
close the critical value, above 0.90. Meanwhile, the SRMR value (Ut: 0.08; Hd: 0.07) of
SNA 17 Mataram, Lombok
Universitas Mataram
24-27 Sept 2014
21 File ini diunduh dari:
www.multiparadigma.lecture.ub.ac.id

hedonic value-based model has better fitness because it is closer to the critical value (≤
0.05).
The incremental goodness-of-fit indexes yield the values of NFI (Ut: 0.96; Hd:
0.96), NNFI (Ut: 0.98; Hd: 0.97), CFI (Ut: 0.98; Hd: 0.98), IFI (Ut: 0.98; Hd: 0.98), and
RFI (Ut: 0.96; Hd: 0.95). Therefore, both models have no difference. Accordingly, it as
been proven that the hedonic and utilitarian value-based models have a comparable
level of model fit, which are a good fit. The indexes of NCP (Ut: 257.51; Hd: 533.45),
ECVI (Ut: 1.95; Hd: 3.63), AIC (Ut: 539.51; Hd: 1001.45), and CAIC (Ut: 775.34; Hd:
1288.14) indicate that the utilitarian value-based model has better fitness than the
hedonic value-based model, since the former one has the indexes values that are smaller
than the later one.
The measurement of goodness-of-fit shows that the utilitarian value-based
model has higher values of absolute goodness-of-fit indexes of χ2, NCP, ECVI, AIC,
and CAIC. Meanwhile, the hedonic value-based model is superior in the SRMR index.
Both models have good fit according to absolute goodness-of-fit indexes, such as
RMSEA and GFI, and incremental goodness-of-fit indexes, such as NNFI, CFI, IFI, and
RFI. In general, the two basic models have good fit. More specifically, the utilitarian
value-based model is better in its goodness-of-fit than the hedonic value-based model.
Sensitivity Test
The sensitivity test is carried out to determine the consistency of the results of this
study. In this research, the data are collected by means of electronic questionnaire and
paper questionnaire (manual). The differences in the result of this study may occur due
to the differences of the sampling technique. This study examined the research model
using 2 groups of the questionnaire data for the purpose of sensitivity test. Hypotheses
examinations are used to determine the consistency of the results of the study. The
results of the two samples analysis shows a consistency with the analysis of the overall
sample. The results of hypothesis testing using the two samples and overall sample are
presented in Table 7. The results of the analysis showed that from all hypotheses, only
the hypothesis H6 that show inconsistent result. Accordingly, the models used in this
study have consistent result.
SNA 17 Mataram, Lombok
Universitas Mataram
24-27 Sept 2014
22 File ini diunduh dari:
www.multiparadigma.lecture.ub.ac.id

Table 7. Sensitivity Test
No. Hypothesis Coef t-stat
Status Online
Paper
Overall
Online
Paper
Overall
1. H1 Resem Flowex (ρx6x1)
0.80 0.61
0.76 6.36 5.96
9.29 Consistent
2 H2 Resem Satis (ρx8x1)
-0.04 0.05
0.003 -0.24 0.38
0.03 Consistent
3 H3 Resim Flowex (ρx6x2)
0.15 0.02
0.07 1.50 0.18
1.02 Consistent
4. H4 Flowex Satis (ρx8x6)
0.43 0.50
0.45 3.78 4.59
5.78 Consistent
5. H5 Infqu Perval (ρx7x3)
1.60 0.71
1.04 7.02 5.51
9.19 Consistent
6. H6 Sysqu Perval (ρx7x4)
0.34 0.77
0.73 0.90 4.78
5.18 Not
Consistent
7. H7 Servqu Perval (ρx7x5)
-0.60 -0.87
-0.87 -1.52 -5.32
-6.14 Consistent
8. H8 Perval Satis (ρx8x7) 0.59 0.84 0.75 6.04 7.36 9.62 Consistent
9. H9 Perval Inruse (ρyx7)
-0.07 -0.48
-0.31 -0.67 -3.51
-3.47 Consistent
10. H10
Satis Inruse (ρyx8) 1.16 1.05
1.06 5.89 6.52
8.82 Consistent
Discussion
The emotional responses were found to have significant positive effect on the flow
experience but insignificant positive effect on the user satisfaction. This can happen
because of the pleasant feeling experienced by the users when using online stores at
social media causes people is caused by affective response. Affective response that
experienced from social media environment makes people feel happy, excited, and
dominance in that environment. These feelings make people tend to perceive that they
get what they want, so it becomes exciting experience for him (flow experience). In the
end, this process will result in the sense of satisfaction. These facts are brand new
findings, and may complete previous research that has not considered the behavior of
the user satisfaction. Thus, this research provides a more comprehensive observations.
The imaginal responses are proved to have insignificant positive effect on the
flow experience. When people browse the online stores in social media, they are free to
be anybody, and to imagine anything about them and the products which are displayed
on the screen. This freedom does not lead the social media users in Indonesia to linger
in social media. This finding is inconsistent with previous study (Wang and Scheepers,
2012) which states that the imaginal response is an important antecedent of flow
experience. This can happen because, first, the search process in social media for
electronic shopping do not require the users to play special role. The users simply
SNA 17 Mataram, Lombok
Universitas Mataram
24-27 Sept 2014
23 File ini diunduh dari:
www.multiparadigma.lecture.ub.ac.id

become themselves and look for the goods or services they want. Second, the users have
strong personality, so the experience with online store in the social media does not
trigger escapism and so does not help flow experience in using social media. Third, the
users are expected to have a good financial foundation and does not have any heavy
problems in real life. Thus, their tend to be reluctant to do escapism from daily life.
The flow experience has significant positive impact on the user satisfaction. This
result is consistent with Wu and Lu (2013), which reveals that perceived enjoyment as
hedonic characteristics is an important antecedent of the technology acceptance.
Pleasant experience when the users think that what they get is in accordance with his
wishes and lost in the imagination, will trigger a sense of satisfaction. The information
quality and system quality have significant positive effect on the perceived value. This
finding strengthens the study by DeLone’s & McLean’s (2003), Seddon’s (1997),
Wang’s (2007), and Wells’s et al. (2011). Sufficient information with easy accesses will
help online store to meet the productive needs of the users. When users get the
appropriate information with their desire, their hopes are fulfilled. This may also be
explained by the expectation disconfirmatory theory (Oliver, 1980). When user
expectations are confirmed in a certain online store, the users will feel that this online
store is more valuable than the others.
The service quality has a significant negative effect on the perceived value. The
examination on the different path produced unexpected finding, which is the path of the
service quality to the repurchase intention. The service quality has a significant positive
effect on the repurchase intention. It can be caused by several things. First, the
providers of social media-based online store have not established a good information
systems management. The research object in this study is retail stores in social media.
Second, problem of network or devices that are used by the users causes the users to
ignore the service. Third, the users focus more on the content, traceability, and ease of
purchase from the online store information systems. Fourth, the process of service
focuses on the time of interaction with service provider. Currently, service is seen as a
dynamic process between users and IT employees with participate each other (Shostack,
1987). Service is a type of interaction between user and IT employee in serving
functions, particularly in the form of interaction or transaction that involving the
exchange of core benefits, such as physical goods, valuable information, and other
valuable interactions.
SNA 17 Mataram, Lombok
Universitas Mataram
24-27 Sept 2014
24 File ini diunduh dari:
www.multiparadigma.lecture.ub.ac.id

The perceived values are shown to have a significant positive impact on the user
satisfaction and a significant negative effect on the repurchase intention. Meanwhile, the
user satisfaction has a significant positive impact on the repurchase intention. This
finding is consistent with Wang’s (2007) research. The users perceived value is due to
the benefit from supply and monetary and non-monetary cost to gain the benefits
(Parasuraman and Grewal, 2000; Wang, 2007). The balance of both benefits will attract
the enthusiasm of individuals. Enthusiastic of interaction with information system
would lead to satisfaction.
The perceived values have a significant negative effect on the repurchase
intention. This suggests that satisfaction is the key to the business continuity.
Satisfaction is attached to the human cognitive. When a user wants to buy a product, he
will automatically remember the satisfaction level of his last experience with the
product, and remember where he bought it. The userswill return to that store. Thus, the
users satisfaction is a key mediator in the causal relationship between the perceived
values and repurchases intention.
In conclusion, on effort of online store going concern, the user satisfaction is the
primary antecedent. However, the user satisfaction will not stand without causes. On the
side of hedonic value, flow experience and emotional response have important role in to
create the users satisfaction. Moreover, the perceived values also have important role in
building the users satisfaction. The perceived values depend on the information quality
and systems quality. Whereas the flow experience depends on the imaginal responses.
However, unexpected results of these analysis have extended the findings of this study.
The service quality plays an important role in the repuchase intention.
Implications
A new model integrating hedonic and utilitarian values to explain the information
systems success in electronic commerce implies to the behavioral alignment in the
system analysis and design. The capability to supply the needs of hedonic and utilitarian
value on electronic trading system is an important thing to shapes the behavior of user
satisfaction and repurchase intention. The consequence is to include a balance of
hedonic and utilitarian composition within an electronic commerce information systems
will be maximize the reach of electronic commerce information systems adoption.
Online store design that sparked the imagination of users can be effective
strategic formulation for traders, such as demonstration of the use of clothing,
SNA 17 Mataram, Lombok
Universitas Mataram
24-27 Sept 2014
25 File ini diunduh dari:
www.multiparadigma.lecture.ub.ac.id

testimonials, descriptions of comfort and quality of products/services, and so on. Thus,
the contents can trigger the imagination and sense of fun to the users. Imagination in
this context is required for electronic traders to minimize the expectated
disconfirmation. Furthermore, easy and friendly interaction with the online store page
can stimulate the users’ emotional responses. Several techniques like harmonious
colouring, good drawing arrangement, continuous update of the product in a balanced
rhythm, and words arrangement that can trigger fun tracking and shopping to the users.
Comfortable and pleasant interaction will generate user solubility. Then the solubility
will trigger the users satisfaction and puchase intention.
The information quality and system quality are the keys to perceived value. As a
result, online store owners should concentrate on brief and complete information
presentation. A simple website design with interesting colour composition can maintain
the stability of system information performance. The service quality has an important
role on the repurchase intention, so the online store owner must maintain the
comfortable interaction of the user with online store information system. The
comfortable interaction will generate the perceived good service in the users cognitive.
Satisfaction is a key to connect the perceived value and flow experience to the
repurchase intention. This requires the online store owners to maintain user satisfaction
as the spearhead to achieve business sustainability (going concern). The users
satisfaction can be monitored by conducting a survey shortly after the customers do
online shopping. In fact, the testimony could be used as input for continous information
system improvement. Finally, the integration of the hedonic and utilitarian values in
accordance with the users’ needs can widen the coverage of electronic commerce
information systems. Emphasis on certain indicators of hedonic and utilitarian should be
considered according to the research results and the performed business model.
Conclusion
This study aims to build a new model that integrates hedonic and utilitarian values in
explaining the behaviour of the users satisfaction and repurchase intentions in electronic
trading on social media. A survey method is employed to obtain primary data using
questionnaires. Measurement scale in the questionnaire was adopted from the study by
Wang (2007) and Wang and Scheepers (2012). The unit of analysis in this study is the
individual. Such individuals are customers who shop online via social media. The
respondents of this study comprise of the online shop consumers on Yogyakarta and
SNA 17 Mataram, Lombok
Universitas Mataram
24-27 Sept 2014
26 File ini diunduh dari:
www.multiparadigma.lecture.ub.ac.id
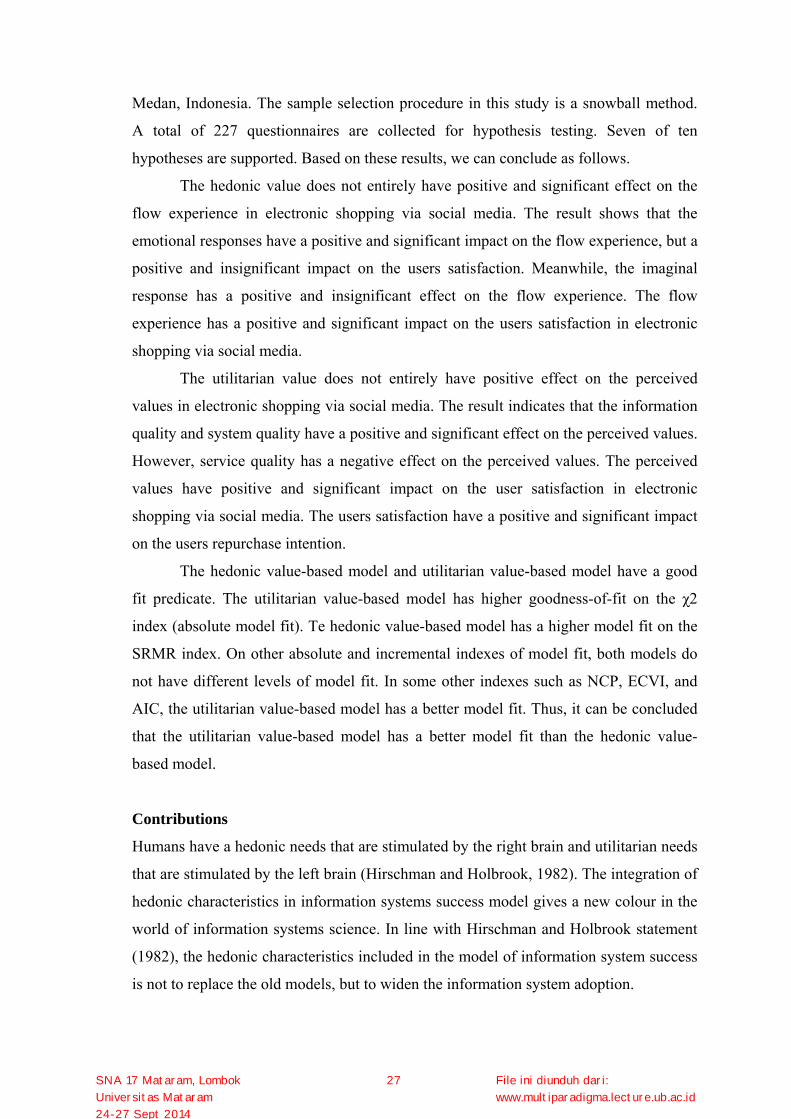
Medan, Indonesia. The sample selection procedure in this study is a snowball method.
A total of 227 questionnaires are collected for hypothesis testing. Seven of ten
hypotheses are supported. Based on these results, we can conclude as follows.
The hedonic value does not entirely have positive and significant effect on the
flow experience in electronic shopping via social media. The result shows that the
emotional responses have a positive and significant impact on the flow experience, but a
positive and insignificant impact on the users satisfaction. Meanwhile, the imaginal
response has a positive and insignificant effect on the flow experience. The flow
experience has a positive and significant impact on the users satisfaction in electronic
shopping via social media.
The utilitarian value does not entirely have positive effect on the perceived
values in electronic shopping via social media. The result indicates that the information
quality and system quality have a positive and significant effect on the perceived values.
However, service quality has a negative effect on the perceived values. The perceived
values have positive and significant impact on the user satisfaction in electronic
shopping via social media. The users satisfaction have a positive and significant impact
on the users repurchase intention.
The hedonic value-based model and utilitarian value-based model have a good
fit predicate. The utilitarian value-based model has higher goodness-of-fit on the χ2
index (absolute model fit). Te hedonic value-based model has a higher model fit on the
SRMR index. On other absolute and incremental indexes of model fit, both models do
not have different levels of model fit. In some other indexes such as NCP, ECVI, and
AIC, the utilitarian value-based model has a better model fit. Thus, it can be concluded
that the utilitarian value-based model has a better model fit than the hedonic value-
based model.
Contributions
Humans have a hedonic needs that are stimulated by the right brain and utilitarian needs
that are stimulated by the left brain (Hirschman and Holbrook, 1982). The integration of
hedonic characteristics in information systems success model gives a new colour in the
world of information systems science. In line with Hirschman and Holbrook statement
(1982), the hedonic characteristics included in the model of information system success
is not to replace the old models, but to widen the information system adoption.
SNA 17 Mataram, Lombok
Universitas Mataram
24-27 Sept 2014
27 File ini diunduh dari:
www.multiparadigma.lecture.ub.ac.id

Harmonization in the values of art and functionality of information system will
wake up the balance of information system. The balance refers to the availability of
both benefit and enjoyment values in information system. This study contributes to the
e-commerce website designers and electronic traders to planned their online store
website. Electronic commerce information system manager can insert the content of
hedonic and utilitarian in their design of online store page. It is an effort to reach a
wider market adoption and achieve business sustainability (going concern). The
emphasis on specific content should be determined by the business model, experience
and ongoing research by electronic commerce information systems manager.
Results of this study can be taken as consideration in order to achieve efficacy
and efficiency in the use of social media. Social media can be used as an electronic
trading platform. Creative and productive users can design a website and social media
pages as an effort to get consumers from other users. Thus, this study can stimulate
social media users to be able to take productive action. As we know, entrepreneurship is
an important discourse of Indonesian government in an effort to curb unemployment
and poverty.
Limitations
New model that integrates the hedonic and utilitarian values in this study have several
limitations. That limitations may reduce the meaning of the results (Sumiyana, 2007).
First, the samples were selected from social media users in Yogyakarta and Medan. The
users of information technology system in these regions have already familiar with
social media and online shopping activities. This condition causes the dimensions of
imaginal response, emotional response, information quality, system quality, service
quality, has been embedded into the individual cognitive long enough.
Second, the individual values associated with behavioral intention is
dynamically evolving over time. Research with construct model like this is not capable
to cacth a dynamic behavioral development of individuals, because individuals always
move to the creation, sharing of resources and system update (Sumiyana, 2007e;
2007b).
Third, this study uses the online store at social media as a research object.
Therefore, the generalization of this study is limited to the retail traders in social media.
Fourth, this study uses a number of measurement items based on the respondents’
perception that could bring potential bias because it only measures the constructs based
SNA 17 Mataram, Lombok
Universitas Mataram
24-27 Sept 2014
28 File ini diunduh dari:
www.multiparadigma.lecture.ub.ac.id

on respondents viewpoint. Fifth, the model developed in this study is relatively new;
therefore we need further validation for external and internal validity.
Suggestions for Further Research
Previous research or similar research with this study use the survey method. Internal
validation needs to be done to strengthen the existing research results. Therefore,
similar studies using experimental method will increase the internal validity of the
model. Additionally, further research with different research objects, especially on good
business platform, will help generalize the model.
The further study is also expected to identify the characteristics of different
samples. For example, the numbers of a consumer conducting electronic shopping are
identified, or the users may also be distinguished as ever performing online shopping
that have no and have never did. It is useful for robustness test, in order to know the
power of model when the assumptions are revoked. The development of models with
new variables and more sophisticated research design will add to the wealth of existing
knowledge and to answer the actual problem.
SNA 17 Mataram, Lombok
Universitas Mataram
24-27 Sept 2014
29 File ini diunduh dari:
www.multiparadigma.lecture.ub.ac.id

References
Agarwal, R. & Karahana, E. (2000) Time Flies When You're Having Fun: Cognitive Absorption And Beliefs About Information Technology Usage. MIS Quarterly Vol (24) 4, pp 665-694
Alex N., Joji and Ashwin Joseph (2012). Hedonic Versus Utilitarian Values: The RelativeImportance of Real and Ideal Self to BrandPersonality and Its Influence on Emotional Brand Attachment. Vilakshan, XIMB Journal of Management pp. 77-90
Aminesh, Aminesh; Alain Pinsonneault; Sung-Byung Yang; and Wonseok Oh (2011) An Odissey Into Virtual Worlds: Exploring the Impacts of Technological and Spatial Environments on Intention to Purchase Virtual Products. MIS Quarterly (35) 3 pp.789-810
Arikunto, Suharsimi. 2010. Prosedur Penelitian, Suatu Pendekatan Praktik. Jakarta:Rineka Cipta
Botti, Simonadan Ann L. Mcgill (2011) The Locus Of Choice: Personal Causality and Satisfaction With Hedonic andUtilitarian Decisions. Journal Of Consumer Research, Inc. Vol. 37 Pp. 1065-1078
Brown, S. A. dan Venkatesh, V. (2005) Model of Adoption of Technology in the Household: A Baseline Model Test and Extention Incorporating Household Life Cycle. MIS Quarterly. (29) 4, pp 399-426.
Childers, Terry L.; Christopher L. Carr; Joann Peck; Stephen Carson (2001) Hedonic and Utilitarian Motivations for Online Retail Shopping Motivation. Journal of Retailing 77, pp 511-535
Chitturi, Ravindra; Rajagopal Raghunathan; dan Vijay Mahajan. (2008) Delight by Design:The Role ofHedonic Versus Utilitarian Benefits.Journal of MarketingVol. 72, 48–63
Cooper, Donald R. dan Pamela S. Schindler (2011) Business Research Method. McGraw-Hill: Singapore
Csikszentmihalyi, Mihaly (1975) Beyond Boredome and Anxiety. Jossey Bass: San Fransisco.
Csikszentmihalyi, Mihaly (1997) Finding Flow. Psychology Today, July/August Culnan, Mary J.; Patrick J. McHugh; and Jesus I. Zubillaga (2010) How Large U.S.
Companies Can Use Twitter and Other Social Media to Gain Business Value .MIS Quarterly Executive (9) 4
Davis, F. D. (1989) Perceived Usefulness, Perceived Ease of Use, and User Acceptance of Information Technology, MIS Quarterly (13) 3, pp 319-340
Davis, F. D.; R.P. Bagozzi; and P. R. Warshaw (1989) User Acceptance of Computer Technology: A Comparison of Two Theoritical Models, Management Science (35) 8, pp 982-1003
DeLone, W. H. & McLean, E. R. (1992) Information Systems Success: the Quest For Dependent Variable. Information Systems Research, 3, 60-95
DeLone, W. H. & McLean, E. R. (2004) Measuring E-Commerce Success: Applying DeLone & McLean Information Systems Success. International Journal of Electronic Commerce, 9, 31-47
Foxall, G.R, & G. Greenley (1998) The Affective Structure of Consumer Situations. Environment and Behavior (30) 6, pp. 781–798.
Foxall, G.R., &M.M. Yani-de-Soriano (2005) Situational Influences on Consumers’ Attitudes and Behavior.Journal of Business Research (58), pp. 518–525.
Ghani, J. A. and S.P. Deshpande (1994) Task Characteristics and the Experience of Optimal Flow in Human-Computer Interaction.The Journal of Psychology (128) No. 4, pp. 381-391
SNA 17 Mataram, Lombok
Universitas Mataram
24-27 Sept 2014
30 File ini diunduh dari:
www.multiparadigma.lecture.ub.ac.id

Gu, Ja-Chul; Liu Fan; Yung Ho Suh; and Sang-Chul Lee (2010) Comparing Utilitarian and Hedonic Usefulness to User Intention in Multipurpose Information Systems. Cyberpsichology, Behaviour, and Social Networking (13) 3
Gudono. 2012. Analisis Data Multivariat. Yogyakarta:BPFE Hartono, Jogiyanto. 2012. Metodologi Penelitian Bisnis: Salah Kaprah dan
Pengalaman-Pengalaman. Yogyakarta: BPFE ------, 2008. Metodologi Penelitian Sistem Informasi. Yogyakarta: Penerbit Andi Hair, Joseph F.; William C. Black; Barry J. Babin; Rolph E. Anderson (2010)
Multivariate Data Analysis-A Global Perspective: Seventh Edition. Pearson: New Jersey
Heijden, Hans van der (2004) User Acceptance of Hedonic Information Systems. MIS Quarterly (28) 4, pp. 695-704
Hirschman, Elizabeth C. (1983) Predictors of Self-Projection, Fantasy Fulfillment, and Escapism. Journal of Social Psychology (120) 1 pp. 63-76
Hirschman, Elizabeth C and Morris B. Holbrook (1982) Hedonic Consumption: Emerging Concept, Methods and Propositions. Journal Marketing, vol. 46, pp 92-101
Hoffman, D. L. and T.P. Novak (1996) Marketing in Hypermedia Computer-
Mediated Environments: Conceptual Foundations. Journal of Marketing, (60) pp. 50-68
Holbrook, Morris B and Elizabeth C. Hirschman (1982) The Experiential Aspects of Consumption: Consumer Fantasies, Feelings, and Fun. Journal of Consumer Research, vol. 9
Holsapple, Clyde W. & Jiming Wu (2007) User Acceptance of Virtual Worlds: The Hedonic Framework. The Database for Advances Information Systems (38) 4
Huang AH & Yen DC (2003) Usefulness of Instant Messaging Among Young Users: Social vsWork Perspective. Human Systems Management; (22) pp. 63
Igbaria, M dan M. Tan (1997) The Consequences of Information Technology Acceptance on subsequent individual performance.Information and Management (32) pp. 113-121
Kerlinger, Fred (2006) Asas-Asas Penelitian Behavioral. Yogyakarta: UGM Press Kim, Sung S. and Jai-Yeol Son(2009) Out Of Dedication or Constraint? A Dual Model
Of Post-Adoption Phenomena and Its Empirical Test In The Context Of Online Services.MIS Quarterly Vol. 33 No. 1pp 49-70
Nah, Fiona Ful-Hooh, Brenda Exchenbrenner, David DeWester (2011) Enhancing Brand Equity Through Flow and Telepresence: A Comparison of 2D and 3D Virtual Worlds. MIS Quarterly (35) 3, pp. 731-747
Ozen, Hilal and Nil Kodaz (2012) Utilitarian or Hedonic?A CrossCultural Study in Online Shopping.Organizations and Markets in Emerging Economies, 2012, Vol. 3, No. 2(6) Pp. 80-90
Pedhazur, Elazar J. (1982) Multiple Regression In Behavioral Research-Explanation and Prediction: Second Edition, CBS College Publishing:Canada
Roca, Juan Carlos; Chao-Min Chiu; Francisco Jose Martinez (2006) Understanding E-Learning Continuance intention: An Extention of the Technology Acceptance Model. Int. J. Human-Computer Studies 64 pp. 683-696
Seddon P. B. (1997) A Respesification and Extention of the DeLone and McLean Model of IS Success. Information Systems Research, vol. 8, pp 240-253
Siekpe, Jeffrey Sam (2005) An Examination Of The Multidimensionality Of Flow Construct in A Computer-Mediated Environment. Journal of Electronic Commerce Research, (6)no.1
SNA 17 Mataram, Lombok
Universitas Mataram
24-27 Sept 2014
31 File ini diunduh dari:
www.multiparadigma.lecture.ub.ac.id

Sindhav, Birud and Phani Tej Adidam (2012) Hedonic and Utilitarian Values of a Service Experience with a Nonprofit: The Role of Identification. International Management Review (8) 1 pp 37-43
Sumiyana (2007) Analisis Komparasi antara Model Concern for Information Privacy dan Model Internet Users’ Information Privacy Concern: Konsekuensi untuk Proses Penyelarasan Managemen Database (Studi Empiris di Jogyakarta), Jurnal Riset Akuntansi Indonesia (10) No. 2 Hal. 215-242
Venkatesh, Viswanath; James Y. L. Thong; Xin Xu (2012) Consumer Acceptance and Use of Information Technology: Extending the Unified Theory od Acceptance and Use of Technology. MIS Quarterly (35) 1, pp 157-178
Wang, Yi-Shun (2007) Assessing e-commerce systems success: a respesification and validation of the DeLone and McLean model of IS success. Info Systems J 18, 529-557
Wang, Zhihuan; Helana Scheepers (2012) Understanding the Instrinsic Motivation of User Acceptance of Hedonic Information Systems: Toward Unified Research Model. Journal of the Association for Information Systems, (30) Article 17, pp. 255-274
Wells, John D.; Joseph S. Valacich; and Traci J. Hess (2011) What Signal are You Sending? How Website Quality Influences Perceptions of Product Quality and Purchase Intentions. MIS Quarterly (35) 2 pp. 373-396
Wijanto, Setyo Hari (2008) Structural Equation Modelling, Konsep dan Totorial dengan LISREL 8.8.. Jakarta-Graha Ilmu
Wu, Jiming and Xinjian Lu (2013) Effects of Extrinsic and Intrinsic Motivators on Using Utilitarian, Hedonic, and Dual-Purposed Information Systems: A Meta-Analysis. Journal of the Association for Information Systems (14), Issue 3, pp. 153-191
Zhou, Zhongyun (Phil); Yulin Fang; Douglas R. Vogel; Xiao-Ling Jin; and Xi Zhang (2012) Attracted to or Locked In? Predicting Continuance Intention in Social Virtual World Servives. Journal of Management Information Systems, (29) 1 pp 273-305
SNA 17 Mataram, Lombok
Universitas Mataram
24-27 Sept 2014
32 File ini diunduh dari:
www.multiparadigma.lecture.ub.ac.id

Appendix 1 Constructs Measurement
Latent Predictors
Imaginal Response
RESIM1: Playing social media helps me temporarily esape from the world of reality RESIM2: Playing social media helps me temporarily esape from problem and pressures RESIM3: Playing social media helps me temporarily esape from things unpleasant and worrisome RESIM4: Playing social media enables me to project myself into a particular role RESIM5: Playing social media enables me to project myself into a particular character RESIM6: Playing social media enables me to project myself into a particular task.
Emotional Response
RESEM1: To what extent do you feel happy or unhappy when playing social media? RESEM2: To what extent do you feel pleased or annoyed when playing social media? RESEM3: To what extent do you feel satisfied or unsatisfied when playing social media? RESEM4: To what extent do you feel relaxed or bored when playing social media? RESEM5: To what extent do you feel stimulated or relaxed when playing social media? RESEM6: To what extent do you feel exited or calm when playing social media? RESEM7: To what extent do you feel in control or cared for when playing social media? RESEM8: To what extent do you feel controlling or controlled when playing social media? RESEM9: To what extent do you feel dominant or submissive when playing social media?
Flow Experience
FLOWEX1: I have fun when I am playing social media. FLOWEX2: Playing social media provides me with a lot of enjoyment. FLOWEX3: I enjoy playing social media. FLOWEX4: When playing the social media, my attention is focused on the social media. FLOWEX5: When playing the social media, I am absorbed intensely in the social media. FLOWEX6: When playing the social media, I concentrate fully on the social media
SNA 17 Mataram, Lombok
Universitas Mataram
24-27 Sept 2014
33 File ini diunduh dari:
www.multiparadigma.lecture.ub.ac.id

FLOWEX7: Time appears to go by very quickly when playing the social media. FLOWEX8: Sometimes I lose track of time when playing the social media. FLOWEX9: Time flies when playing the social media.
Information Quality
INFQU1: The e-commerce system provide the precise information you need INFQU2: The information content meets you need INFQU3: You feel the output is reliable INFQU4: The e-commerce system provide up-to-date information
System SYSQU1: The e-commerce system is user friendly SYSQU2: The e-commerce system is easy to use SYSQU3: When you have problem, the e-commerce system service show a sincere interest in solving it. SYSQU4: The e-commerce system service is always willing to help you SYSQU5: You feel safe in your transaction with the e-commerce system service in terms of security and privacy protection
Service Quality
SERQU1: The e-commerce system service has the knowledge to answer your questions SERQU2: The e-commerce system service give you individual attention SERQU3: The e-commerce system service understand your specific needs
Peceived Value
PERVAL1: The product/service of the e-commerce system is a good value for money PERVAL2: The price of the product/service of the e-commerce system is acceptable PERVAL3: The product/service of the e-commerce system is considered to be a good buy
Satisfation SATIS1: You are satisfied with thw e-commerce system SATIS2: The e-commerce system is high quality SATIS3: The e-commerce system has met you expectations
Repurchase Intention
INREUSE1: Assuming that you have access to the e-commerce system, you intend to reuse it. INREUSE2: You will reuse the e-commerce system in the future. INREUSE3: You will frequently use the e-commerce system in the future.
SNA 17 Mataram, Lombok
Universitas Mataram
24-27 Sept 2014
34 File ini diunduh dari:
www.multiparadigma.lecture.ub.ac.id

Appendix 2 Convergent Validity Test
Observed
variable
Factor
Loading AVE
C. Alpha
Eliminated
Item
Cronbach
Alpha
Construct
Reliabilitas
RESIM1 0,64
0,565
0,739
0,787 0,816
RESIM2 0,61 0,749
RESIM3 0,00 0,864
RESIM4 0,89 0,687
RESIM5 0,85 0,702
RESIM6 0,73 0,732
RESEM1 0,82
0,674
0,894
0,91 0,942
RESEM2 0,84 0,893
RESEM3 -0,05 0,942
RESEM4 0,86 0,892
RESEM5 0,82 0,895
RESEM6 0,91 0,888
RESEM7 0,77 0,896
RESEM8 0,8 0,893
RESEM9 0,74 0,897
FLOWEX1 0,85
0,695
0,947
0,954 0,929
FLOWEX2 0,85 0,947
FLOWEX3 0,83 0,948
FLOWEX4 0,83 0,948
FLOWEX5 0,87 0,946
FLOWEX6 0,85 0,948
FLOWEX7 0,84 0,948
FLOWEX8 0,81 0,949
FLOWEX9 0,77 0,951
INFQU1 0,88
0,74
0,894
0,921 0,921 INFQU2 0,89 0,891
INFQU3 0,83 0,904
INFQU4 0,84 0,901
SYSQU1 0,72 0,594 0,865 0,882 0,883
SNA 17 Mataram, Lombok
Universitas Mataram
24-27 Sept 2014
35 File ini diunduh dari:
www.multiparadigma.lecture.ub.ac.id

SYSQU2 0,74 0,86
SYSQU3 0,81 0,847
SYSQU4 0,78 0,858
SYSQU5 0,8 0,854
SERQU1 0,89
0,701
0,796
0,877 0,879 SERQU2 0,81 0,836
SERQU3 0,81 0,845
PERVAL1 0,91
0,852
0,928
0,945 0,867 PERVAL2 0,94 0,912
PERVAL3 0,92 0,917
SATIS1 0,87
0,798
0,927
0,936 0,777 SATIS2 0,91 0,894
SATIS3 0,9 0,898
INRUSE1 0,91
0,792
0,892
0,927 0,764 INRUSE2 0,88 0,89
INRUSE3 0,88 0,901
SNA 17 Mataram, Lombok
Universitas Mataram
24-27 Sept 2014
36 File ini diunduh dari:
www.multiparadigma.lecture.ub.ac.id

Appendix 3 Communality Factor Values
FLOWEX PERVAL SATIS INRUSE RESEM RESIM INFQU SYSQU SERQUFLOWEX1 0,85 FLOWEX2 0,85 FLOWEX3 0,83 FLOWEX4 0,83 FLOWEX5 0,87 FLOWEX6 0,85 FLOWEX7 0,84 FLOWEX8 0,81 FLOWEX9 0,77 PERVAL1 0,91 PERVAL2 0,94 PERVAL3 0,92 SATIS1 0,87 SATIS2 0,91 SATIS3 0,9 INRUSE1 0,91 INRUSE2 0,88 INRUSE3 0,88 RESIM2 0,61 RESIM4 0,89 RESIM5 0,85 RESIM6 0,73 RESEM1 0,82 RESEM2 0,84 RESEM4 0,86 RESEM5 0,82 RESEM6 0,91 RESEM7 0,77 RESEM8 0,8 RESEM9 0,74 INFQU1 0,88 INFQU2 0,89 INFQU3 0,83 INFQU4 0,84 SYSQU1 0,72 SYSQU2 0,74 SYSQU3 0,81 SYSQU4 0,78 SYSQU5 0,8 SERQU1 0.89 SERQU2 0.81 SERQU3 0,81
SNA 17 Mataram, Lombok
Universitas Mataram
24-27 Sept 2014
37 File ini diunduh dari:
www.multiparadigma.lecture.ub.ac.id

Appendix 4 AVE Results
FE PV St RI ER IR IQ SQ SeQ
FE 0,69
PV 0,04 0,85
St 0,22 0,56 0,79
RI 0,18 0,25 0,66 0,79
ER 0,36 0,12 0,18 0,12 0,56
IR 0,00 0,02 0,01 0,01 0,00 0,67
IQ 0,04 0,45 0,28 0,13 0,11 0,06 0,74
SQ 0,00 0,12 0,06 0,03 0,00 0,08 0,17 0,59
SeQ 0,01 0,00 0,00 0,00 0,03 0,09 0,10 0,49 0,69
SNA 17 Mataram, Lombok
Universitas Mataram
24-27 Sept 2014
38 File ini diunduh dari:
www.multiparadigma.lecture.ub.ac.id

Appendix 5 Models Comparison
GOF
index Indicators
Etimation Best
Hedonis Utilitarian
Chi-Square Small score
(p>0.05)
852,42(p=0.00) 430,80 (p=0.00) Utilitarian
NCP,
Interval
Small score,
narrow interval
533,45
(449,87;624,70)
257,51 (200,00;
322,73)
Utilitarian
RMSEA,
p(close-fit)
RMSEA ≤ 0,08
(p≥0.50)
0.075 (p=0.00) 0.072 (p=0.00) Equal
ECVI Small score, close
with ECVI
saturated
M*=3,63,
S*=2,94, I*=75,56
M*=1,95, S*=1,67,
I*=44,68
Utilitarian
AIC Small score, close
with AIC saturated
M*=1001,45,
S*=2689,35,
I*=20984,09
M*=539,51,
S*=462,00,
I*=12330,74
Utilitarian
CAIC Small score, close
with CAIC
saturated
M*=1288,14,
S*=2689,35,
I*=20984.09
M*=775,34,
S*=1530,15,
I*=12427,85
Utilitarian
NFI Above 0.90 0.96 0.96 Equal
NNFI Above 0.90 0.97 0.98 Equal
CFI Above 0.90 0.98 0.98 Equal
IFI Above 0.90 0.98 0.98 Equal
RFI Above 0.90 0.95 0.96 Equal
CN Above 200 133.09 146.47 Equal
RMR Standardized RMR
≤ 0,05
0.07 0,08 Hedonis
GFI Above 0.90 0.81 0,87 Equal
AGFI Above 0.90 0.78 0,83 Utilitarian
SNA 17 Mataram, Lombok
Universitas Mataram
24-27 Sept 2014
39 File ini diunduh dari:
www.multiparadigma.lecture.ub.ac.id