the institutional and cultural determinants of location choice institutional determinants of... ·...
TRANSCRIPT
The Institutional Determinants of Location Choice:
Agglomeration in the Global Semiconductor Industry
XAVIER MARTIN Tilburg University (B 1130)
P.O. Box 90153 5000 LE Tilburg The Netherlands
Ph.: + 31 13 466-8098 Fax: +31 13 466-8354
E-mail: [email protected]
ROBERT SALOMON Stern School of Business
New York University 44 W. 4th St., KMC 7-59
New York, NY 10012 Ph.: 212-998-0223 Fax: 212-995-4234
E-mail: [email protected]
ZHEYING WU Marshall School of Business
University of Southern California Bridge Hall 306
Los Angeles, CA 90089-0808 Ph: 213-821-5210
Fax: 213-740-3582 Email: [email protected]
Acknowledgments: Xavier Martin’s research was funded by the CentER for Economic Research at Tilburg University. Robert Salomon’s research was funded by The Center for Japan-US Business and Economic Studies. We appreciate helpful comments from Paul Adler, Nandini Rajagopalan, Daniel Beunza, Joel Brockner, Sheena Iyengar, Bruce Kogut, Kyle Mayer, Myles Shaver, Stephen Tallman, Bernard Yeung, seminar participants at Columbia University, New York University, and University of Southern California. All remaining errors are our own. Version: December 7, 2007
The Institutional Determinants of Location Choice: Agglomeration in the Global Semiconductor Industry
Abstract Although scholars have examined antecedents to agglomeration, we understand less than we should about the impact of institutional environments. We theorize that characteristics of a country’s institutional environment encourage firms to agglomerate. To test our hypotheses, we examine the location pattern of 948 plant investments made by 274 firms across 29 countries in the global semiconductor industry. Findings reveal that agglomeration patterns vary across countries. Specifically, firms prefer to agglomerate in collectivist, and politically and economically uncertain, countries. The results suggest that the institutional environment impacts a firm’s incentives to agglomerate, and that the decision to agglomerate is therefore context-dependent.
Keywords:
Location Choice; Agglomeration; International Business; Comparative Studies

Introduction
Location choice is an integral, yet often overlooked, facet of firm strategy (Porter 2000). Through
its impact on operating costs and revenues, location decisions can influence the development of a firm’s
competitive advantage. Moreover, location can have lasting effects on firm performance.
Although scholars from various disciplines recognize the importance of location choice, research
examining its antecedents has focused largely on natural endowments, knowledge spillovers, and
competitition (Marshall 1920, Weber 1929, Hotelling 1929). We therefore understand less than we should
about how location choice varies across institutional contexts. To fill this gap, we examine institutional
(cultural, political and economic) determinants of agglomeration—i.e., the choice to locate in a
geographic cluster of industrial activity. The decision to agglomerate likely varies across countries, and
institutions play an important role in that decision. Specifically, we believe that a firm’s incentives to
agglomerate vary with the institutional context of a given country.
In order to test these assertions, we examine the location pattern of 948 plant investments made
by 274 firms across 29 countries from 1970 to 2004 to see whether, and how, the institutional
environment impacts a firm’s decision to agglomerate. Accordingly, the dependent variable of interest is
the decision of whether to locate a manufacturing facility within an existing agglomeration. Consistent
with our theory, findings show that agglomeration patterns vary across countries. Firms are more likely to
agglomerate when investing in collectivist countries, and in those countries characterized by political and
economic uncertainty.
This paper is organized as follows: We first review prior literature on the determinants of location
choice. Based on this review, we develop hypotheses related to the institutional determinants of
agglomeration. We subsequently describe the data and methodology used to test these hypotheses. In the
following section we present results. The final section discusses the findings and concludes.
Literature Review
Because the outcomes of location decisions are long-lasting and often irreversible, location
choice can have enduring implications for firm performance. For example, building an efficient scale
3
semiconductor fabrication plant generally requires a commitment of more than $1 billion (IC Knowledge
2001). Location decisions with such substantial commitments often have high stakes. Not surprisingly
therefore, firms tend to carefully consider such decisions.
Recognizing this, scholars in different disciplines have studied the antecedents to location choice.
Economics scholars have predominantly focused on what causes firms to select particular geographical
locations in the first place. On the input side, economic geographers note that resource endowments and
the availability (scarcity) of human capital can facilitate (restrict) a firm’s development. For this reason,
firms should favor sites that are rich with various input factors in order to minimize costs (Ghosh and
Rushton 1987, Weber 1929). Work in industrial organization, by contrast, maintains that firms should
maximize their proximity to customers, yet keep their distance from competitors so as to avoid
head-to-head competition (Hotelling 1929).
Building upon this latter insight, research on firm location choice in the strategy literature has
centered on whether firms choose to locate geographically proximal or distal to one another. This
phenomenon has been referred to as agglomeration (see Shaver and Flyer 2000, for a review).
Agglomeration, or the geographical clustering of firms, can have both positive and negative consequences
for firms. On the one hand, an agglomeration of firms can generate beneficial externalities. For example,
Marshall (1920) argued that the clustering of similar firms creates a pool of specialized labor that can be
shared among members of the agglomeration. Additionally, firms in the agglomeration benefit from
specialized suppliers that increase the overall competitiveness of the industry (Porter 2000). Moreover,
locating close to similar firms affords firms the opportunity to share knowledge with others or absorb
knowledge through competitive spillovers (Marshall 1920). Firms can learn from their competitors’
experiences, and competition among local firms may improve the performance of its members (Shaver
and Flyer 2000, Chung and Song 2004). Such positive externalities motivate firms to agglomerate.
On the other hand, scholars note that agglomerating does not come without costs. As the number
of firms requiring similar resources in an agglomeration increases, competition intensifies, which leads to
a corresponding increase in firm failure (Hannan and Carroll 1992, Hannan et al. 1995). Moreover,
4

competition for similar inputs and markets can be especially intense among collocated firms, especially if
they produce homogenous goods (Fischer and Harrington 1996). Such competition can lead to increased
human resource costs and land rents, and may result in entrenchment (Hoen 2001, Porter 1998,
Schmutzler 1999). For these reasons, firms that are similar to their competitors may strategically avoid
collocating with them and therefore have a disincentive to agglomerate (Baum and Haveman 1997).
The aforementioned literature suggests that firms decide whether to agglomerate by assessing the
advantages and disadvantages given specific external market conditions and individual firm
characteristics. This supports a contingent view of agglomeration; that is, agglomerating may be better for
some firms than for others. Moreover, agglomerating may be better in certain contexts than in others. For
example, Shaver and Flyer (2000) argued that although firms benefit from inward knowledge spillovers in
an agglomeration, they also contribute knowledge to the agglomeration by generating outward spillovers.
Therefore, to avoid information leakage, firms with better technology or stronger capabilities are less
likely to agglomerate. Similarly, Chung and Song (2004) discovered that firms with little or no experience
are more likely to locate their early ventures close to competitors. They argued that firms with less
experience benefit from proximity to their competitors. Furthermore, Sorenson and Audia (2000) found
that location choice is influenced by social networks. They found that entrepreneurial ventures were more
likely to agglomerate, despite intense competition within the agglomeration, because the local area
provided social resources for these firms. Entrepreneurs felt they benefited by maintaining ties to their
existing social networks and preferred not to risk losing those ties by locating farther away. Taken
together, these studies demonstrate that firms do not uniformly decide to agglomerate, but instead,
carefully weigh concerns about firm characteristics and the environment.
In summary, research in management, strategy, and economics has examined antecedents to
agglomeration. However, one important antecedent of agglomeration remains relatively understudied:
the impact of a country’s institutional context. Cultural, political, and economic institutions normalize
firm activities and shape the environment in which firms operate. These forces thereby impact
agglomeration (Whitford and Potter 2007). In certain institutional environments, firms may benefit more
5

from agglomerating, while in others firms may benefit less. In the next section we hypothesize how
national culture, along with political and economic uncertainty are likely to affect agglomeration.
Hypotheses
Cultural Factors. One of the most important factors in the institutional environment in which
firms operate is national culture. Culture normalizes the behavior of organizational actors within societies
(Hofstede, 2001). As a product of the societies from which they are born, firms are inherently imprinted
with societal norms, and these norms influence behavior.
Prior literature has investigated the impact of national culture on firm behavior. For example,
national culture has been shown to affect managerial goals, management processes, organizational values,
and organizational action (Hofstede 1985, 1994, Hofstede, et al. 2002). Although these studies do not
focus on location choice per se, they demonstrate that national culture impacts the decisions and activities
of firms. We likewise expect culture to have an impact on firm behavior with respect to agglomeration.
Though national culture has multiple dimensions (Hofstede 2001), we focus on the continua of
individualism/collectivism and uncertainty avoidance as the cultural factors most likely to influence
agglomeration. Individualism/collectivism addresses the relationship between individual members of a
society and its groups. Because an agglomeration is formed by a group of similar firms, this cultural
dimension is likely to influence an individual firm’s desire to join the group. By contrast, uncertainty
avoidance captures societal attitudes toward risk, ambiguity, and unpredictability. Firms often face a great
deal of uncertainty when making location decisions and the level of uncertainty avoidance in a society
may therefore influence a firm’s location preference. Though the other cultural dimensions (i.e.,
masculinity, power distance, and long-term orientation) describe important features of national culture,
we believe they are less relevant to explaining a firm’s likelihood to join an agglomeration.1
Individualism refers to the extent to which decisions are made independent of larger group
interests and norms, while collectivism encompasses the willingness to cooperate, an emphasis on
1 In results not reported, we explored models including masculinity, power distance, and long-term orientation. Consistent with our priors, we did not find any relationship between these cultural factors and the decision to join an agglomeration.
6

relationships, and subordination to larger group goals (Hofstede 2001, Morris et al. 1994, Triandis 1995).
An important attribute of collectivism is the power of social norms (Triandis 1995). While an
individualist culture encourages social members to preserve and protect individual values and norms, a
collectivist culture places a greater emphasis on the adoption of group norms. Because cultural
expectations normalize behavior (DiMaggio and Powell 1983, Hofstede 2001), a firm in a collectivist
culture will likely follow the norms set by the majority. By contrast, decisions that deviate from those of
the group are more socially acceptable in an individualist culture.
Following the above logic, we can plausibly expect firms to be more likely to agglomerate in
countries characterized by collectivist cultures. From an economic perspective, it could be that the
positive externalities associated with agglomeration are enhanced (diminished) in a collectivist
(individualist) culture while the negative consequences of agglomeration are diminished (enhanced).
Collectivist cultures put a greater emphasis on relationships, harmony, and within-group cooperation
(Chen et al. 2002). Therefore, in a collectivist country, firms within an agglomeration may be more
willing to share their resources and knowledge in order to help each other. In other words, an
agglomeration in a collectivist environment may generate more spillovers and transmit the spillovers
more fluently than an agglomeration in an individualist environment. Moreover, collectivism suppresses
free riding, mitigates opportunistic behavior, induces individuals to sacrifice for the good of the group,
and dampens competition within a group (Earley 1989, Chen et al., 2002). Collectivism thereby acts as a
mechanism that increases trust (decreases opportunistic behavior) among group members and reduces
transaction costs for firms within the agglomeration. Therefore, although Krugman (1991) and Sorensen
and Audia (2000) found that agglomerations are generally characterized by intense competition, the
severity of the competition is likely to vary across countries/contexts. Consequently, firms may have more
to gain and less to lose from agglomerating in a country with a collectivist culture.
From a sociological perspective, firms might obtain greater legitimacy by joining an
agglomeration in countries characterized by collectivism. Because an agglomeration is a manifestation of
group preference, joining the existing agglomeration may be regarded as rational, efficient, and legitimate
7
(Meyer and Rowan 1977). Agglomerating thereby reflects “cultural expression” through a process of
coercive isomorphism (DiMaggio and Powell 1983). To prevent a loss of legitimacy and to enhance
chances for survival, firms in a collectivist culture are more likely to adopt societally accepted norms and
imitate the location behavior of firms that resemble it. Otherwise stated, because collectivist cultures
value conformity with group norms over independent behavior (Morris et. al. 1994), firms face greater
environmental pressures to conform, and agglomerating represents the most legitimate location choice for
these firms. Individualist cultures, by contrast, more readily support independent behavior. In such
cultures, deviation from group norms is more socially acceptable. Therefore, choosing a location far away
from an agglomeration is more likely to be viewed as socially legitimate.
For these reasons, we expect firms in countries characterized by collectivist cultures to be more
likely to agglomerate than firms in countries characterized by individualist cultures. Stated formally,
HYPOTHESIS 1. All else equal, firms will be more likely to locate within an economic agglomeration when investing in a country characterized by a collectivist, versus an individualist, culture.
In addition to individualism/collectivism, we believe that uncertainty avoidance represents an
important cultural determinant of location choice. Again, uncertainty avoidance refers to responses to
unpredictable or ambiguous situations (Hofstede 2001). Individuals in high uncertainty-avoidance
cultures often adhere to norms or fixed patterns of behavior to reduce risk (Hofstede 2001). By contrast,
low uncertainty-avoidance cultures are more comfortable with risk. Individuals from such cultures
generally will not go to extraordinary lengths to mitigate or avoid risk.
By their nature, location decisions involve uncertainty. Firms often put substantial sums of money
at risk and make long-term commitments to specific locales. Not only do firms make monetary and time
commitments to particular locations, but they are also strongly influenced by the institutions and
resources available within the specific environment. One way in which firms can mitigate their exposure
to location risk is by agglomerating, which represents the less risky option because specialized inputs are
more readily available within an agglomeration (Marshall 1920). Furthermore, information about inputs
8
such as labor, suppliers, raw materials, and infrastructure may be known within the agglomeration, or at
the very least more predictable than, alternative locations in which no similar firms exist.
For these reasons, we expect firms in high uncertainty-avoidance cultures, versus their
counterparts in low uncertainty-avoidance cultures, to be more likely to agglomerate. Firms in high
uncertainty-avoidance countries see the specialized inputs available within an agglomeration as a means
to reduce risk given the input uncertainties faced in alternative locations. That is, firms in high
uncertainty-avoidance cultures value those inputs more highly than do firms in low uncertainty-avoidance
cultures. By contrast, in countries with low uncertainty-avoidance cultures, firms are more likely to accept
the additional risks that go along with investing away from the agglomeration. We therefore hypothesize,
HYPOTHSIS 2: All else equal, firms will be more likely to locate within an economic agglomeration when investing in a country characterized by a high uncertainty-avoidant culture.
Besides cultural factors, a country’s political and economic environment also has an impact on
firm strategy. Firms may agglomerate as a strategic response to country-specific institutional risk.
Therefore, in addition to examining the impact of cultural factors on agglomeration, we are also interested
in whether firms agglomerate as a response to uncertainty in the political and economic environment.
Political Factors. Political uncertainty plays a significant role in firm investment and behavior
(Henisz 2000, Henisz 2002). Although uncertain political conditions often discourage investment in the
first place (Williamson 1979, Henisz and Macher 2004), firms can develop strategies to decrease the risk
associated with operating in politically volatile environment (Henisz and Delios 2001). One way to
decrease risk is to generate more accurate expectations of future policy changes (Arrow 1972, Henisz
2002). Agglomerating may provide access to policy information that helps improve expectations because
agglomerations generate spillovers of other firms’ private knowledge of the political environment
(Mariotti and Piscitello 1995). Such spillovers are likely to be more important to firm performance and
survival in an uncertain political environment. A firm may therefore choose to agglomerate in order to
preserve proximity to information sources, to obtain better information on policy issues, and to better
9
understand and adapt to the political environment.
Additionally, a firm may choose to agglomerate in order to increase the power of its industry
group vis-à-vis local and national policy makers. A powerful interest group’s collective action affords
more opportunities to influence policy changes in its favor (Laffont and Tirole 1991, Olson 1965).
Although industry trade associations mainly lobby on behalf of the group in matters of national-level
policy (Porter 2000), networks established within an agglomeration may have an impact on local, and
perhaps national, policies. Furthermore, closely connected groups can coordinate collective actions more
efficiently than loosely connected ones (Olson 1965). Because geographic proximity enables firms to
interact with each other more routinely, firms within the agglomeration may have more power to impact
policy makers than dispersed firms. As a result, in an uncertain political environment, a firm may
agglomerate in order to better mobilize action, if necessary.
In summary, in an environment characterized by uncertain political conditions, agglomerating
benefits a firm by allowing it insight into its competitors’ policy information, thereby enhancing the
positive externalities associated with agglomeration. Moreover, as an interest group, the firms in an
agglomeration may be in a better position to influence policy in their favor. We therefore predict,
HYPOTHESIS 3: All else equal, firms will be more likely to locate within an economic agglomeration when investing in a country where the political environment is uncertain.
Economic Factors. Another source of uncertainty lies in a country’s economic institutions. When
product-market prices are unpredictable, whether due to a lack of market openness, distortions brought
about by regulatory intervention, or inefficient government, the quality of the information that can be
gleaned from the market decreases (Hayek 1945). In such cases, firms have greater difficulty
understanding and predicting future economic states of the environment and must rely on information
from other sources. One important source of such information lies in the knowledge spillovers generated
by firms within an agglomeration. This information, transmitted through the interaction among firms
within the agglomeration, is likely to be richer and more reliable than information available in the market
10
(Burt 1992, Uzzi 1997). This externality is especially important when firms face greater levels of
economic uncertainty, as firms may prefer to collocate to share vital information about the general
economic environment. Information sharing among geographically proximal firms may therefore help
them cope in the presence of economic uncertainty.
Economic uncertainty may also result from inefficient capital markets. When capital markets are
incomplete and financial information is less transparent, it is more difficult for firms to raise capital. In
such situations, lending institutions generally rely on social and environmental cues (Uzzi and Lancaster
2003). For example, with limited resources and information, banks generally restrict loans to firms about
which they have privileged information or with which they share ties—for example, those with shared
board members or social connections, or from the same geographic area (Gerlach 1992, Lamoreaux 1994).
Therefore, in countries with weak external capital markets, firms can obtain financial resources on better
terms by signaling their quality. One observable and persuasive signal is whether the firm is associated in
some way with other reputable corporations (Stuart et al. 1999). A firm may signal its association with or
similarity to other reputable corporations by agglomerating. Because the agglomeration includes many
similar and related firms, potential lenders can recognize the common traits of these firms and better infer
information about each.
By integrating the above arguments, we contend that in uncertain economic environments, firms
can benefit by agglomerating. This strategy may enable firms to obtain information from competitors,
signal their quality to external capital markets, and better attract financial resources. Stated formally,
HYPOTHSIS 4: All else equal, firms will be more likely to locate within an economic agglomeration when investing in a country where the economic environment is uncertain.
Research Design
Sample
We are interested in the impact of a country’s institutional characteristics on agglomeration.
Therefore, an industry characterized by investments in diverse national markets is most appropriate for
11
this study. For this reason, we chose to study the global semiconductor industry, which presents two
advantages for our purposes. First, semiconductor plants are dispersed worldwide and the industry is
global in scope. This offers ample variance in institutional and locational patterns across many countries.
Second, it is a high-profile industry in which plant investments can be reliably documented.
We used the International Fabs on Disk database as the main source of data. This dataset includes
information on 1,229 semiconductor plant investments from 1960 to 2004. It identifies the city and
country in which the plant is located, the corporate parent, the year of establishment, and the technology
used in the plant. These data help us measure a firm’s location choice and capture important firm-specific
characteristics. We supplemented data from this source with information from the Getty Thesaurus of
Geographic Names, Hofstede’s culture index (Hofstede 2001), Henisz’s political constraint (POLCON)
index (Henisz 2002), the Economic Freedom Index from the Fraser Institute, and the Penn World Table.
Due to missing data from the various sources, our final usable sample consists of 948 plants from 274
parent firms across 29 countries.
Measures
Agglomeration. Our dependent variable of interest captures whether a firm elects to agglomerate
when making a new plant investment. Consistent with prevailing literature, we identify agglomerations
based on the density of plants in a given locale, and we define an agglomeration as a geographic location
with at least five neighboring semiconductor plants that are located within a 60-mile radius and that are
separated by an area of distinct, empty geographic space (Baum and Haveman 1997, Alcacer and Zhao
2006).2 The 60-mile cutoff is based on Getis (1969).3 Because we have information on the exact year in
which each semiconductor plant was built, the agglomeration measure is time-varying, allowing for
agglomerations to change as firms build more plants. This allows a more precise definition of the
2 To test the sensitivity of our results to other manifestations of the dependent variable, we defined an agglomeration alternatively as including ten or fifteen plants. We found that the results presented herein are not sensitive to those alternative manifestations; however, we acknowledge that the results were slightly weaker in statistical significance when the cutoff for an agglomeration was fifteen plants. 3 To test the robustness of this measure to other manifestations, we defined alternative agglomeration cutoffs at 0, 100, and 200 miles. The results were quantitatively and qualitatively similar to those presented herein.
12
construct than previously employed in the literature (e.g., Head et al. 1995, Shaver and Flyer 2000).
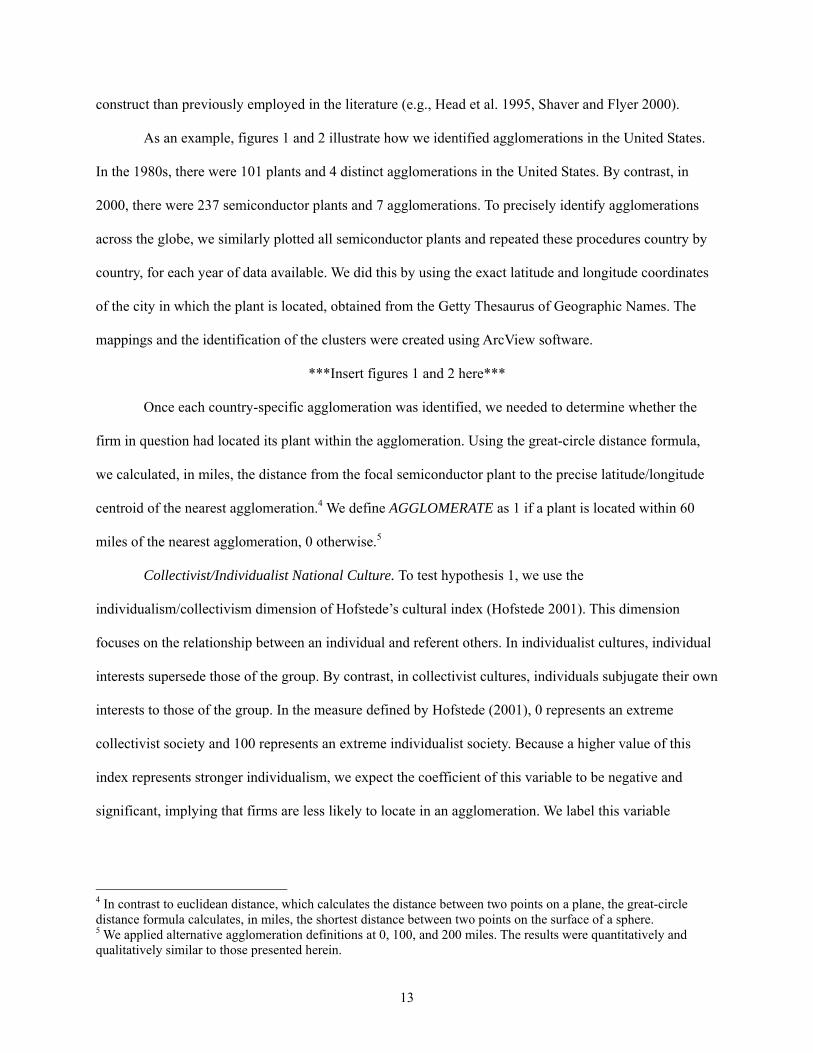
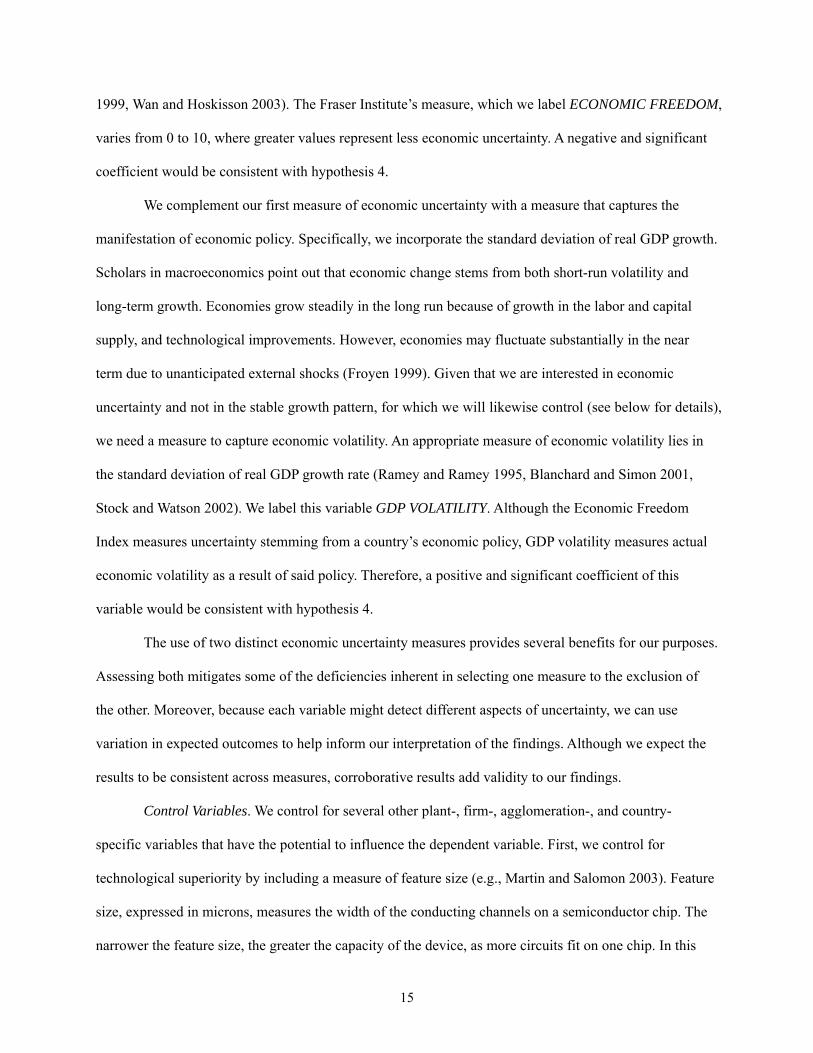
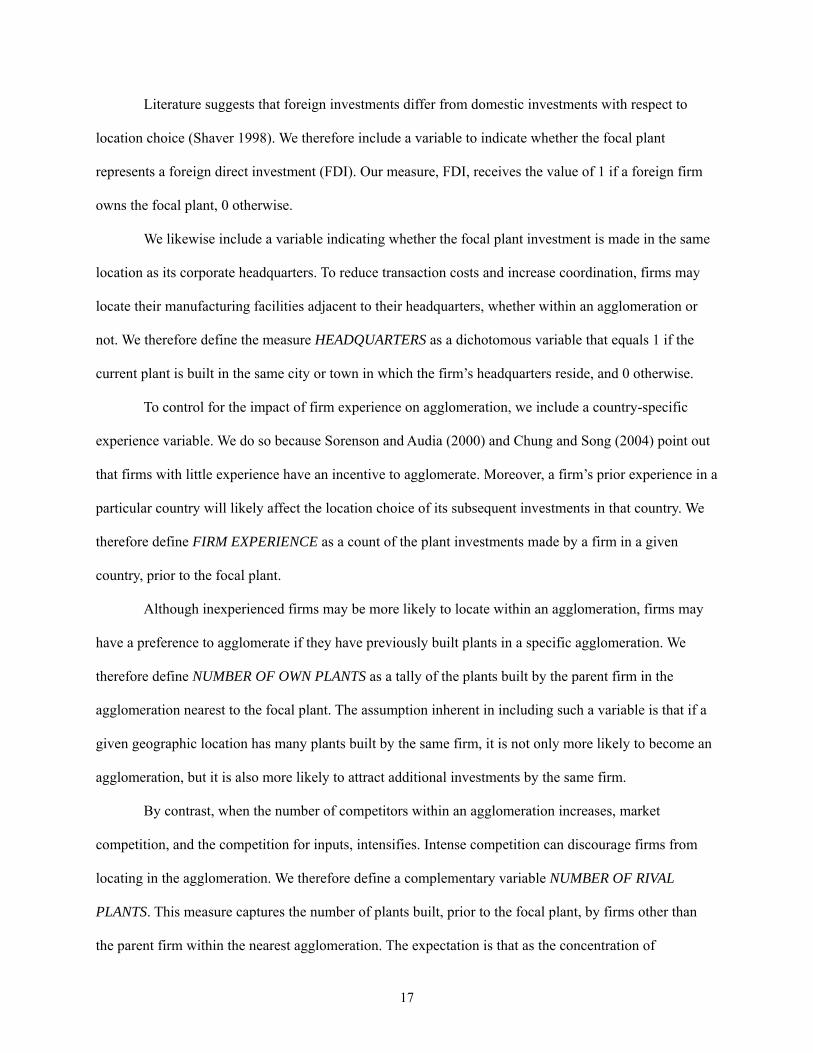
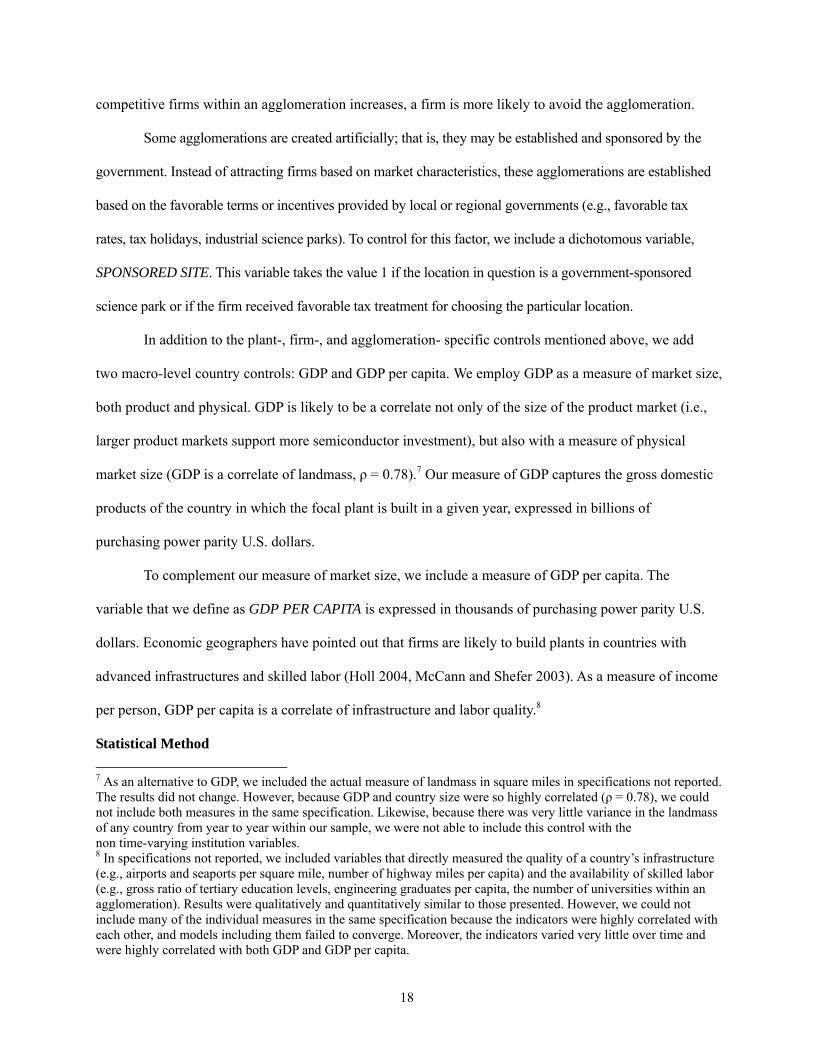
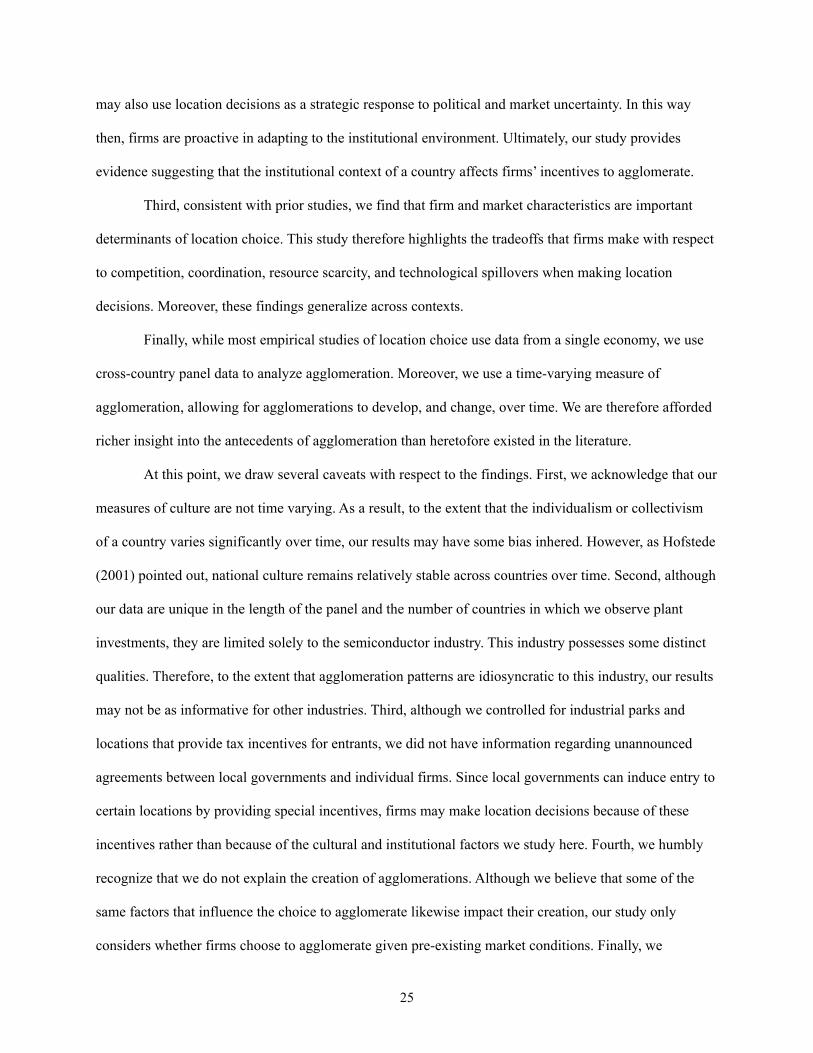
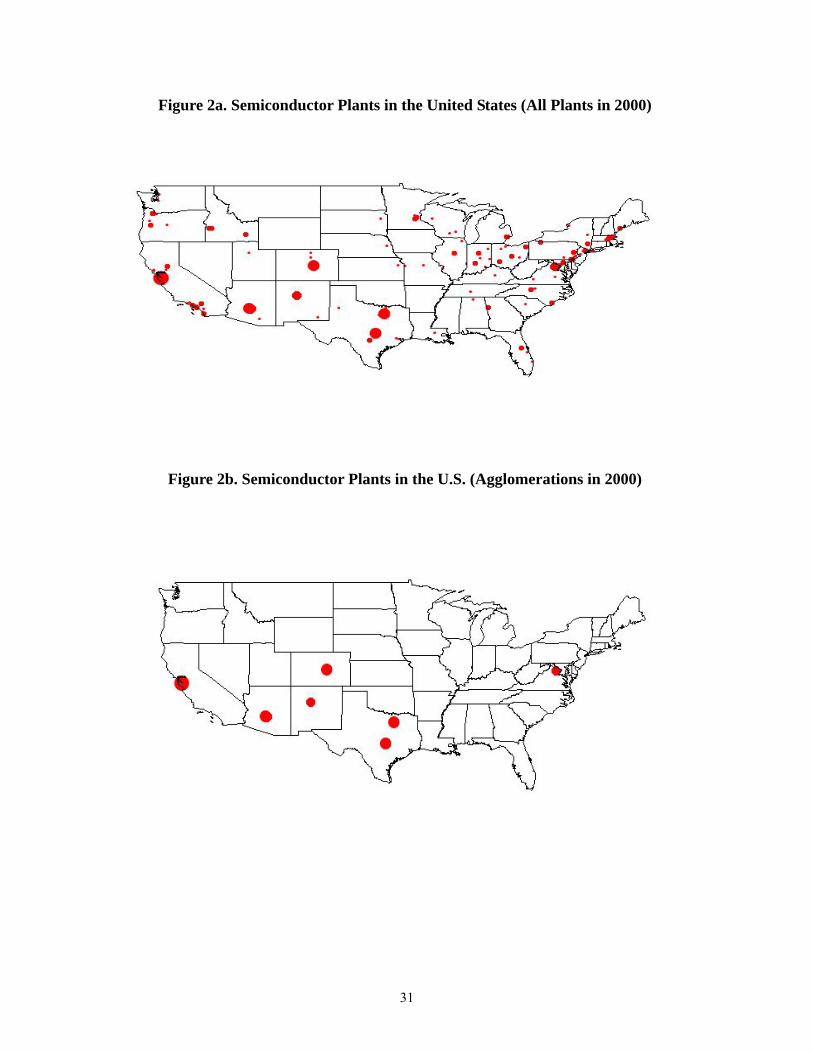
As an example, figures 1 and 2 illustrate how we identified agglomerations in the United States.
In the 1980s, there were 101 plants and 4 distinct agglomerations in the United States. By contrast, in
2000, there were 237 semiconductor plants and 7 agglomerations. To precisely identify agglomerations
across the globe, we similarly plotted all semiconductor plants and repeated these procedures country by
country, for each year of data available. We did this by using the exact latitude and longitude coordinates
of the city in which the plant is located, obtained from the Getty Thesaurus of Geographic Names. The
mappings and the identification of the clusters were created using ArcView software.
***Insert figures 1 and 2 here***
Once each country-specific agglomeration was identified, we needed to determine whether the
firm in question had located its plant within the agglomeration. Using the great-circle distance formula,
we calculated, in miles, the distance from the focal semiconductor plant to the precise latitude/longitude
centroid of the nearest agglomeration.4 We define AGGLOMERATE as 1 if a plant is located within 60
miles of the nearest agglomeration, 0 otherwise.5
Collectivist/Individualist National Culture. To test hypothesis 1, we use the
individualism/collectivism dimension of Hofstede’s cultural index (Hofstede 2001). This dimension
focuses on the relationship between an individual and referent others. In individualist cultures, individual
interests supersede those of the group. By contrast, in collectivist cultures, individuals subjugate their own
interests to those of the group. In the measure defined by Hofstede (2001), 0 represents an extreme
collectivist society and 100 represents an extreme individualist society. Because a higher value of this
index represents stronger individualism, we expect the coefficient of this variable to be negative and
significant, implying that firms are less likely to locate in an agglomeration. We label this variable
4 In contrast to euclidean distance, which calculates the distance between two points on a plane, the great-circle distance formula calculates, in miles, the shortest distance between two points on the surface of a sphere. 5 We applied alternative agglomeration definitions at 0, 100, and 200 miles. The results were quantitatively and qualitatively similar to those presented herein.
13

INDIVIDUALISM.6
Uncertainty-Avoidance National Culture. To test hypothesis 2, we use the uncertainty-avoidance
dimension of Hofstede’s cultural index (Hofstede 2001). This dimension measures responses to
unpredictable and uncertain situations. The scale varies from 0 to 100. Higher values represent more
uncertainty-avoiding cultures. A positive and significant coefficient for UNCERTAINTY AVOIDANCE
would be consistent with our hypothesis.
Political Uncertainty. To operationalize political uncertainty, we chose the political constraints
(POLCON) index as described by Henisz (2002). We adopt this measure because it accurately reflects the
level of political volatility within a country. With greater political checks and balances in place, policies
are less likely to change arbitrarily. In such cases, the political environment will be more predictable. We
label this measure POLITICAL UNCERTAINTY. The index lies on a continuum from 0 to 1, where 0
represents extreme volatility (in which few, if any, checks and balances exist and leaders may make
changes arbitrarily) and 1 represents greater stability (in which many safeguards are in place). The index
has been used widely to measure political uncertainty (e.g., Henisz and Delios 2001, Henisz and Macher
2004). Results consistent with hypothesis 3 would produce a negative and significant coefficient,
suggesting that firms are more likely to agglomerate when faced with political uncertainty.
Economic Uncertainty. To proxy for economic uncertainty, we use two measures. The first one is
the Economic Freedom Index provided by the Fraser Institute. This institute ranks 123 countries based on
their levels of economic restrictions. We adopt this index for several reasons. First, its time and
geographic coverage is comprehensive, allowing us to include the most complete sample possible. Second,
this index combines various sources and indicators of economic uncertainty—e.g., economic regulations,
access to sound money, barriers to international trade, legal structure. Indeed, because of its consistency
and reliability, this index has been widely adopted in the literature (Easton and Walker 1997, Koka et al.
6 Because some agglomerations are not composed entirely of domestic firms, the national culture indexes of individualism/collectivism and of uncertainty avoidance may not precisely reflect the cultural norms of the agglomeration. We therefore explored alternative manifestations of the culture measures in which each index was multiplied by the percentage of domestic firms in the agglomeration. We also ran results in which we limited the sample to domestic firms. The results were similar to those presented.
14
1999, Wan and Hoskisson 2003). The Fraser Institute’s measure, which we label ECONOMIC FREEDOM,
varies from 0 to 10, where greater values represent less economic uncertainty. A negative and significant
coefficient would be consistent with hypothesis 4.
We complement our first measure of economic uncertainty with a measure that captures the
manifestation of economic policy. Specifically, we incorporate the standard deviation of real GDP growth.
Scholars in macroeconomics point out that economic change stems from both short-run volatility and
long-term growth. Economies grow steadily in the long run because of growth in the labor and capital
supply, and technological improvements. However, economies may fluctuate substantially in the near
term due to unanticipated external shocks (Froyen 1999). Given that we are interested in economic
uncertainty and not in the stable growth pattern, for which we will likewise control (see below for details),
we need a measure to capture economic volatility. An appropriate measure of economic volatility lies in
the standard deviation of real GDP growth rate (Ramey and Ramey 1995, Blanchard and Simon 2001,
Stock and Watson 2002). We label this variable GDP VOLATILITY. Although the Economic Freedom
Index measures uncertainty stemming from a country’s economic policy, GDP volatility measures actual
economic volatility as a result of said policy. Therefore, a positive and significant coefficient of this
variable would be consistent with hypothesis 4.
The use of two distinct economic uncertainty measures provides several benefits for our purposes.
Assessing both mitigates some of the deficiencies inherent in selecting one measure to the exclusion of
the other. Moreover, because each variable might detect different aspects of uncertainty, we can use
variation in expected outcomes to help inform our interpretation of the findings. Although we expect the
results to be consistent across measures, corroborative results add validity to our findings.
Control Variables. We control for several other plant-, firm-, agglomeration-, and country-
specific variables that have the potential to influence the dependent variable. First, we control for
technological superiority by including a measure of feature size (e.g., Martin and Salomon 2003). Feature
size, expressed in microns, measures the width of the conducting channels on a semiconductor chip. The
narrower the feature size, the greater the capacity of the device, as more circuits fit on one chip. In this
15

industry, firms compete on the basis of their ability to produce semiconductors with ever thinner features
(Malerba 1985, Eisenhardt and Schoonhoven 1996, Schoonhoven et al. 1990, Henisz and Macher 2004).
As Shaver and Flyer (2000) note, firms with superior technology may have an incentive to locate away
from the agglomeration in order to avoid information leakage. Therefore, we control for the impact of
technological superiority on the decision to agglomerate. To capture the degree of technological
superiority, we measure the focal plant’s feature size relative to other plants within the industry (see
Henisz and Macher 2004, Martin and Salomon 2006). Specifically, we define RELATIVE FEATURE
SIZE as the ratio of the focal plant’s feature size to the average feature size of all plants built prior to it in
the country, in the nearest agglomeration. For the first plant in a given country, the measure receives the
value of 1. Because firms with superior technology are likely to avoid collocating (Shaver and Flyer
2000), we expect this variable to have a positive and significant coefficient. That is, the better the
technology a firm has relative to its closest competitors (i.e., the smaller the value of relative feature size),
the more likely it will choose not to agglomerate.
In addition to the measure of technology to be used in the plant, we include a measure that
captures the purpose of the plant investment. If the purpose of a particular plant is to conduct research and
explore new technologies, a firm may have the incentive to locate its plant within an agglomeration.
Collocating with other plants allows firms to benefit from information spillovers and to access a
pre-existing, specialized labor pool (Almeida and Kogut 1999), which may be more important for
research and development (R&D) facilities than for manufacturing facilities. Moreover, locating within
the agglomeration may help firms maintain closer ties to other supporting institutions such as universities
or government labs. Therefore, we include a variable (R&D FACILITY) controlling for whether the focal
plant is a specialized R&D facility (1) or a manufacturing facility (0).
We include a measure of the joint venture status of the focal plant. Our measure, JOINT
VENTURE, captures whether a particular plant investment is a joint venture with two or more substantive
corporate parents (1), or a wholly-owned facility (0). Because joint ventures have multiple parents with
potentially competing interests, there may be some systematic differences in their location patterns.
16
Literature suggests that foreign investments differ from domestic investments with respect to
location choice (Shaver 1998). We therefore include a variable to indicate whether the focal plant
represents a foreign direct investment (FDI). Our measure, FDI, receives the value of 1 if a foreign firm
owns the focal plant, 0 otherwise.
We likewise include a variable indicating whether the focal plant investment is made in the same
location as its corporate headquarters. To reduce transaction costs and increase coordination, firms may
locate their manufacturing facilities adjacent to their headquarters, whether within an agglomeration or
not. We therefore define the measure HEADQUARTERS as a dichotomous variable that equals 1 if the
current plant is built in the same city or town in which the firm’s headquarters reside, and 0 otherwise.
To control for the impact of firm experience on agglomeration, we include a country-specific
experience variable. We do so because Sorenson and Audia (2000) and Chung and Song (2004) point out
that firms with little experience have an incentive to agglomerate. Moreover, a firm’s prior experience in a
particular country will likely affect the location choice of its subsequent investments in that country. We
therefore define FIRM EXPERIENCE as a count of the plant investments made by a firm in a given
country, prior to the focal plant.
Although inexperienced firms may be more likely to locate within an agglomeration, firms may
have a preference to agglomerate if they have previously built plants in a specific agglomeration. We
therefore define NUMBER OF OWN PLANTS as a tally of the plants built by the parent firm in the
agglomeration nearest to the focal plant. The assumption inherent in including such a variable is that if a
given geographic location has many plants built by the same firm, it is not only more likely to become an
agglomeration, but it is also more likely to attract additional investments by the same firm.
By contrast, when the number of competitors within an agglomeration increases, market
competition, and the competition for inputs, intensifies. Intense competition can discourage firms from
locating in the agglomeration. We therefore define a complementary variable NUMBER OF RIVAL
PLANTS. This measure captures the number of plants built, prior to the focal plant, by firms other than
the parent firm within the nearest agglomeration. The expectation is that as the concentration of
17
competitive firms within an agglomeration increases, a firm is more likely to avoid the agglomeration.
Some agglomerations are created artificially; that is, they may be established and sponsored by the
government. Instead of attracting firms based on market characteristics, these agglomerations are established
based on the favorable terms or incentives provided by local or regional governments (e.g., favorable tax
rates, tax holidays, industrial science parks). To control for this factor, we include a dichotomous variable,
SPONSORED SITE. This variable takes the value 1 if the location in question is a government-sponsored
science park or if the firm received favorable tax treatment for choosing the particular location.
In addition to the plant-, firm-, and agglomeration- specific controls mentioned above, we add
two macro-level country controls: GDP and GDP per capita. We employ GDP as a measure of market size,
both product and physical. GDP is likely to be a correlate not only of the size of the product market (i.e.,
larger product markets support more semiconductor investment), but also with a measure of physical
market size (GDP is a correlate of landmass, ρ = 0.78).7 Our measure of GDP captures the gross domestic
products of the country in which the focal plant is built in a given year, expressed in billions of
purchasing power parity U.S. dollars.
To complement our measure of market size, we include a measure of GDP per capita. The
variable that we define as GDP PER CAPITA is expressed in thousands of purchasing power parity U.S.
dollars. Economic geographers have pointed out that firms are likely to build plants in countries with
advanced infrastructures and skilled labor (Holl 2004, McCann and Shefer 2003). As a measure of income
per person, GDP per capita is a correlate of infrastructure and labor quality.8
Statistical Method 7 As an alternative to GDP, we included the actual measure of landmass in square miles in specifications not reported. The results did not change. However, because GDP and country size were so highly correlated (ρ = 0.78), we could not include both measures in the same specification. Likewise, because there was very little variance in the landmass of any country from year to year within our sample, we were not able to include this control with the non time-varying institution variables. 8 In specifications not reported, we included variables that directly measured the quality of a country’s infrastructure (e.g., airports and seaports per square mile, number of highway miles per capita) and the availability of skilled labor (e.g., gross ratio of tertiary education levels, engineering graduates per capita, the number of universities within an agglomeration). Results were qualitatively and quantitatively similar to those presented. However, we could not include many of the individual measures in the same specification because the indicators were highly correlated with each other, and models including them failed to converge. Moreover, the indicators varied very little over time and were highly correlated with both GDP and GDP per capita.
18
In addition to the control variables mentioned above, we use statistical means to address potential
unobserved firm effects that may affect location decisions. Each parent company, for reasons not fully
observable, may have a different propensity to agglomerate. If a firm has several plants, it is possible that
the error term will not be independent within firm observations. In theory, either a fixed-effects or a
random-effects model may be used to correct for this (Greene 2000). However, in our data, many parent
firms exhibit no variance in the dependent variable—including, necessarily, firms with a single plant.
Under this condition and because we have few observations per firm on average, a random-effects model
is preferred (Kennedy 1998). Accordingly, and given that the dependent variable is binary, we employ a
random-effects logit model. The random-effects specification effectively controls for a full range of
unobserved parent-company effects and is appropriate when studying agglomeration (e.g., Head et. al.
1995, Shaver and Flyer 2000).
Estimates resulting from the random-effects logit model are a direct monotonic, but nonlinear,
function of the underlying variables. A positive coefficient indicates that the variable in question has a
positive effect on the parent firm’s propensity to agglomerate.
Results
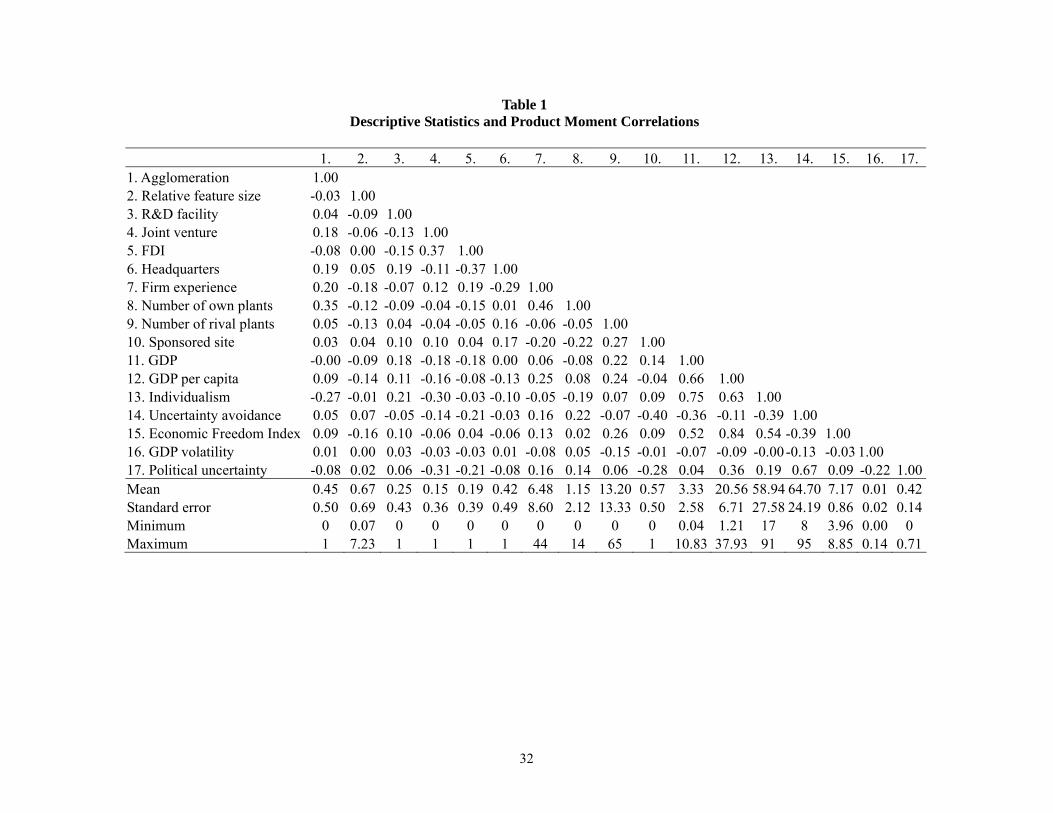
Descriptive statistics and product moment correlations are presented in table 1. About half of the
sample plants are located within an agglomeration, and correlations are generally as expected. We note
that the substantial correlations between individualism and GDP, between Economic Freedom and GDP
per capita, and between GDP and GDP per capita raise some multicollinearity concerns. For this reason,
we examined tolerance statistics and variance inflation factors. None of the independent variables had a
variance inflation contribution greater than 10, which is the generally accepted range for individual
variables (Kennedy 1998). None of the models exceeded 30. All were below the conventional threshold
for models as a whole (Belsley et al. 1980). For this reason, we report the models as specified, and we
conclude that multicollinearity does not adversely impact the findings.
***Insert table 1 about here***
The multivariate regression results are presented in table 2. In addition to random firm effects,
19
we also include fixed-time dummies to control for a time trend in agglomeration patterns. Although not
presented, the time dummies were significant (p < .05) and suggested that firms were more likely to
agglomerate over time. Likewise, the random firm effects were significant as a set (p < .01). This suggests
that there are lasting and systematic differences among firms in their propensities to agglomerate.
***Insert table 2 about here***
Column 1 presents results for the base sample of control variables. Consistent with the findings
of Shaver and Flyer (2000), the positive and significant result on relative feature size indicates that plants
with superior technology are less likely to agglomerate. Although Shaver and Flyer (2000) rely on firm
size as a proxy for superiority and conjecture that technological superiority explains why large firms
locate farther away from the agglomeration, we are able to corroborate their finding by demonstrating the
same effect with a direct, and precise, measure of technological superiority.
Both joint-venture and R&D plants are more likely to be located within an agglomeration,
perhaps reflective of the learning objective of these types of investments. The positive and significant
coefficient on the number of rival plants implies that increased competition discourages collocation. Not
surprisingly, government-sponsored science parks and other areas in which the government offers firms
tax incentives are more likely to become agglomerations.
Counter to our expectations, we find that experienced firms are more likely to agglomerate. As
expected, firms are more likely to agglomerate when plants are built in the same city as the corporate
headquarters. Likewise, firms are more likely to agglomerate if they have more plants within the
agglomeration. Taken together, these results indicate that firms prefer to collocate with themselves, likely
in an effort to increase coordination across facilities and reduce transaction costs.
Finally, with respect to our macro-level variables, we observe mixed evidence. On the one hand,
GDP per capita is positive and significantly related to the likelihood of agglomeration, which indicates
that firms in wealthier nations are more likely to agglomerate. The effect of raw GDP is unstable, which is
likely due to the correlations among some independent variables.
Columns 2 through 7 introduce the independent variables meant to test our hypotheses. In
20

columns 2 and 3, we add indicators of culture. We find a negative and significant relationship between
individualism/collectivism and agglomeration. Consistent with hypothesis 1, the results indicate that firms
are more likely to agglomerate in collectivist cultures and to disperse in individualist cultures. Hypothesis
2, by contrast, does not receive support. The effect of uncertainty avoidance on agglomeration does not
statistically differ from zero. Consistent with hypothesis 3, firms are more likely to agglomerate in
countries characterized by political uncertainty. Columns 5 and 6 add the economic uncertainty measures
meant to test hypothesis 4. We find only partial support for this hypothesis. Although column 6
demonstrates that GDP volatility has a positive and significant impact on agglomeration, which suggests
that firms are more likely to agglomerate in economically unstable environments, the impact of Economic
Freedom does not statistically differ from zero. This latter result is likely due to collinearity induced by
the correlation between Economic Freedom and GDP. In fact, in results not reported, we examined
models including Economic Freedom while excluding GDP and found that results were negative and
significant, consistent with hypothesis 4. Results on the full specification appear in column 7. Despite
collinearity, the directionality and significance levels are consistent with those presented earlier. The
results are robust to this specification and thus lend support to the previous findings.
Additional Analyses
In addition to the results described above, we performed additional tests to assess the robustness
of our findings. First, we adopt alternative measures of the individualism/collectivism dimension used
herein. Although Hofstede (2001) defined useful cultural dimensions, his sample comprised solely of
employees from IBM, a large U.S. multinational corporation. Several scholars have criticized the
measures as biased because of the unrepresentative nature of the sample from the cultures it was intended
to describe (Triandis 1982, Lytle et al. 1995, McSweeney 2002). Alternative proxies of culture, which use
more representative samples, more comprehensive data, and finer-grained measures, have since validated
some of the dimensions originally described by Hofstede. One such measure, for example, is the Schwartz
(1994) index. Schwartz (1994) defined and validated two distinct and orthogonal constructs related to
21

individualism/collectivism, which he referred to as autonomy and conservatism.9 Autonomy refers to
cultures in which individuals are encouraged to think independently and to pursue individual goals.
Conservative cultures value group connections, social relationships, shared goals, social order, and
traditions. These cultural dimensions were operationalized using a sample of school teachers and college
students from sixty-seven nations. Given the complementarity of the Schwartz measures to the Hofstede
measures used in this study, these measures provide a sound alternative to our individualism/collectivism
measure and a useful robustness test. Likewise, the correlation between the Schwartz and Hofstede
measures (ρ = .61) is suggestive of their conceptual consistency (Schwartz 1994, 2004). If the theory
underlying hypothesis 1 is correct, a strongly autonomous national culture should provide firms the
incentive to disperse rather than to agglomerate. We should likewise expect a strongly conservative
culture to encourage agglomeration. Therefore, in table 3, we re-estimate the individualism/collectivism
results from column 2 in table 3 using Schwartz’s (1994) autonomy and conservatism indexes.10
***Insert table 3 about here***
Column 1 introduces the effect of conservatism. Because greater values of this index represent a
more conservative culture, the positive and significant coefficient confirms our prior results. Column 2
introduces the measure of autonomy. The coefficient is negative and significant, as expected.
Second, we re-estimate our models using alternative proxies for political and economic
uncertainty. La Porta, Lopez-de-Silanes, Shleifer, and Vishny (hereafter LLSV) (1998) used a set of
variables to measure different characteristics of a country’s legal system. They argue that features of a
country’s legal system impact political and economic stability, and thereby, corporate governance. We
focus on three specific measures from the LLSV (1998) index germane to our context: efficiency of the
judicial system, rule of law, and corruption.11 If the intuition underlying hypotheses 3 and 4 regarding
9 The conservatism index was later labeled embeddedness in Schwartz (2004). 10 Hofstede (2001) provided data on culture for thirty-three countries in our sample. By contrast, Schwartz’s (1994) data were only available for eighteen countries in our sample. The sample therefore decreases from n = 948 to n = 851 when we switch from the Hofstede (2001) index to the Schwartz (1994) index. The results do not change when we use the Hofstede (2001) measures on the smaller sample. 11 Although the LLSV measure captures twenty-three specific features of a country’s legal system, many of the
22
political and economic uncertainty is correct, we should expect firms to agglomerate in countries in which
the judicial system is inefficient, in those without a longstanding tradition in rule of law, and in those that
exhibit greater levels of corruption.12
***Insert table 4 about here***
Given the high correlations among the three dimensions (0.67, 0.85, and 0.79, respectively)
described by LLSV (1998), we introduce these variables separately into models. Consistent with our
underlying theory, we find that the efficiency index and the corruption index have a significant negative
impact on agglomeration. This suggests that firms are more likely to agglomerate when the legal system
is less efficient, less open, and less transparent. Although the effect for the rule of law index is
directionally correct, it is statistically insignificant.
Third, we adopt another set of measures of political and economic uncertainty. Kaufmann et al.
(2006) measured six features of governmental institutions. Specifically, they estimated participation in
government selection by the people (voice and accountability), the likelihood that a government could be
overthrown (political stability), the quality of government services (government effectiveness), the
efficiency of government policy (regulatory quality), the effectiveness of the legal system (rule of law),
and the degree of corruption (control of corruption). If political and economic uncertainty impact firm
location choice as hypotheses 3 and 4 suggest, we would expect firms to be less likely to agglomerate
when the government and its policies are more stable and efficient, the legal system is more effective, and
corruption is kept in check.13
measures focus on the law as it relates to corporate governance rather than political and economic institutions. For example, constructs measured in LLSV (1998) include creditor rights, mandatory dividend, proxy by mail, etc. In this paper, we are interested in those constructs that are most closely related to macro-level indicators of political and economic uncertainty. We therefore restrict our analysis to efficiency of the judicial system, rule of law, and corruption. 12 The POLCON and Economic Freedom indexes provide information for thirty-three countries in our sample. However, the LLSV data cover only twenty-eight countries in our sample. Therefore, the sample size decreases from n = 948 to n = 905 when we switch to the LLSV data in table 5. As before, the results do not change when we run the results from table 3 on the smaller sample. 13 The Kaufmann et al. (2006) indicators are measured from 1996 to 2005. To preserve the fidelity of these data, we were forced to truncate our sample to match those years. In table 6, we therefore report results of the subsample of observations from 1996 to 2004. Although not reported, we extrapolated these indicators from 1970 to 1995 to be able to run results on the full range of our sample. The results, and therefore our interpretations, did not change.
23
***Insert table 5 about here***
Because these six indicators are highly correlated (bound between 0.61 and 0.93), we introduce
these variables individually into models. Except for the political stability index, each has a negative and
significant coefficient. Because higher values of each index represent more stable governance conditions,
results suggest that firms tend to agglomerate when government policies and legal systems are less stable
and efficient. This is consistent with our theory.
Taken together, the results presented in tables 3, 4, and 5 corroborate the findings from table 2.
We find evidence that firms agglomerate in countries characterized by institutional uncertainty and
conservative cultures, and disperse in countries characterized by autonomous cultures. Altogether, the
results indicate that firms change their agglomeration behavior across cultural and institutional contexts.
Discussion and Conclusion
Although the extant management, strategy, and economics literatures demonstrate that location
choice is dependent upon external market factors and internal firm characteristics, we understand far less
about how institutional factors influence firm location decisions. To fill that gap, this study focused on the
impact of culture, politics, and economics on the agglomeration pattern of firms across countries. In
general, we find evidence consistent with our hypotheses, as country-specific institutional heterogeneity
significantly impacted agglomeration. Specifically, we find that firms are more likely to agglomerate in
countries characterized by collectivist cultures, and political/economic uncertainty.
The findings from this study hold several important implications for research and practice. First,
to our knowledge, no study has focused on the institutional-level determinants of location choice. In this
sense then, ours represents the first cross-country comparative study of its kind, and the first to
demonstrate that agglomeration patterns vary across countries.
Second, our findings not only demonstrate that agglomeration patterns vary across countries, but
that the institutional context plays an important role with respect to firm location choice. We find that the
decision to agglomerate is context dependent. Specifically, firms are shaped by their institutional
environment and they internalize and conform to prevailing norms with respect to agglomeration. Firms
24
may also use location decisions as a strategic response to political and market uncertainty. In this way
then, firms are proactive in adapting to the institutional environment. Ultimately, our study provides
evidence suggesting that the institutional context of a country affects firms’ incentives to agglomerate.
Third, consistent with prior studies, we find that firm and market characteristics are important
determinants of location choice. This study therefore highlights the tradeoffs that firms make with respect
to competition, coordination, resource scarcity, and technological spillovers when making location
decisions. Moreover, these findings generalize across contexts.
Finally, while most empirical studies of location choice use data from a single economy, we use
cross-country panel data to analyze agglomeration. Moreover, we use a time-varying measure of
agglomeration, allowing for agglomerations to develop, and change, over time. We are therefore afforded
richer insight into the antecedents of agglomeration than heretofore existed in the literature.
At this point, we draw several caveats with respect to the findings. First, we acknowledge that our
measures of culture are not time varying. As a result, to the extent that the individualism or collectivism
of a country varies significantly over time, our results may have some bias inhered. However, as Hofstede
(2001) pointed out, national culture remains relatively stable across countries over time. Second, although
our data are unique in the length of the panel and the number of countries in which we observe plant
investments, they are limited solely to the semiconductor industry. This industry possesses some distinct
qualities. Therefore, to the extent that agglomeration patterns are idiosyncratic to this industry, our results
may not be as informative for other industries. Third, although we controlled for industrial parks and
locations that provide tax incentives for entrants, we did not have information regarding unannounced
agreements between local governments and individual firms. Since local governments can induce entry to
certain locations by providing special incentives, firms may make location decisions because of these
incentives rather than because of the cultural and institutional factors we study here. Fourth, we humbly
recognize that we do not explain the creation of agglomerations. Although we believe that some of the
same factors that influence the choice to agglomerate likewise impact their creation, our study only
considers whether firms choose to agglomerate given pre-existing market conditions. Finally, we
25

acknowledge that our results solely demonstrate associations between the cultural/institutional factors and
agglomeration patterns. We cannot discern direction of causality from these data. For all these reasons, we
are therefore hesitant to draw stronger conclusions.
The aforementioned caveats notwithstanding, our results suggest several additional research
extensions. For example, if we assume that location decisions are ultimately tied to performance, future
research would be well served to examine location choice, its fit with the institutional environment, and
performance. All else equal, we would expect firms that agglomerate in countries with more collectivist
cultures and in countries characterized by economic and political uncertainty to perform better than firms
that do not.
As a comparative study of agglomeration across countries/institutional environments, the sample
used herein was comprised largely of plant investments made by domestic firms. An interesting extension
could isolate the subsample of foreign investments to determine whether they exhibit agglomeration
patterns similar to domestic firms. The interesting issue when considering the location decisions of
foreign firms is that in contrast to domestic firms, foreign entrants are from nations where the institutional
environments often differ from those in the host country. The question then is whether foreign firms, in
deciding whether to agglomerate, adapt to those forces in host country, or preserve patterns of behavior
exhibited in their home country.
Our analyses demonstrate the importance of institutional conditions on the choice of location,
and specifically, on the decision to agglomerate with other industry participants. Admittedly, we have
presented only a first pass at what is surely a much more complicated phenomenon. Nevertheless, we
hope others will follow in exploring the interplay between institutions and location. Given the theoretical
importance of these issues and the significance of our findings, further conceptual and empirical research
in this area seems well warranted.
26

References Alcacer, J., M. Zhao. 2006. Understanding local clusters through global firms: The semiconductor
industry. Working Paper, University of Michigan, Ann Arbor, MI. Almeida, P., B. Kogut. 1999. Localization of knowledge and the mobility of engineers in regional
networks. Management Sci. 45(7) 905–917. Arrow, K. J. 1972. The value of and demand for information. C. B. McGuire, R. Radner, eds. Decision
and Organization. North Holland, Amsterdam and London, 131–139. Baum, J. A., H. A. Haveman. 1997. Love thy neighbor? Differentiation and agglomeration in the
Manhattan hotel industry, 1989–1990. Admin. Sci. Quart. 42(2) 304–338. Belsley, D. A., E. Kuh, R. E. Welsch. 1980. Regression Diagnostics. John Wiley and Sons, New York. Blanchard, O., J. Simon. 2001. The long and large decline in U.S. output volatility. Brookings Papers on
Econom. Activity 1 135–174. Burt, R. 1992. The social structure of competition. N. Nohria, R. Eccles, eds. Networks and Organizations.
Harvard Business School Press, Boston, 57–91. Caves, R. E. 1996. Multinational Enterprise and Economic Analysis. Cambridge University Press, New
York Chen, C. C., M. W. Peng, P. A. Saparito. 2002. Individualism, collectivism and opportunism: A cultural
perspective on transaction cost economics. J. of Management 28(4) 567–583. Chung, W., J. Song. 2004. Sequential investment, firm motives, and agglomeration of Japanese
electronics firms in the United States. J. of Econom. and Management Strategy 13(3) 539–560. DeCarolis, D. M., D. L. Deeds. 1999. The impact of stocks and flows of organizational knowledge on
firm performance: An empirical investigation of the biotechnology industry. Strategic Management J. 20 953–968.
DiMaggio, P. J., W. W. Powell. 1983. The iron cage revisited: Institutional isomorphism and collective rationality in organizational fields. Amer. Sociological Rev. 48(2): 147–160.
Earley, P. C. 1989. Social-loafing and collectivism: A comparison of the United States and the People’s Republic of China. Admin. Sci. Quart. 34(4) 565–581.
Easton, S. T., M. A. Walker. 1997. Income, growth, and economic freedom. Amer. Econom. Rev. 87(2) 328–332.
Eisenhardt, K. M., C. B. Schoonhoven. 1996. Resource-based view of strategic alliance formation: Strategic and social effects in entrepreneurial firms. Organ. Sci. 7(2) 136–150.
Fischer, J. H., J. Harrington Jr. 1996. Product variety and firm agglomeration. Rand J. of Econom. 27(2) 281–309.
Froyen, R. T. 1999. Macroeconomics: Theories and Policies, 6th ed. Prentice Hall, Upper Saddle River, NJ.
Gerlach, M. 1992. The Alliance Structure of Japanese Business. University of California Press, Berkeley. Getis, A. 1969. Residential location and the journey to work. Proceedings, Association of Amer.
Geographers 1 55–59. Ghosh, A., G. Rushton. 1987. Spatial Analysis and Location-Allocation Models. Van Nostrand Reinhold,
New York. Graham, E. M., P. Krugman. 1995. Foreign Direct Investment in the United States 3rd ed. Institute for
International Economics, Washington, DC. Greene, W. H. 2000. Econometric Analysis. Prentice Hall, Upper Saddle River, NJ. Hannan, M. T., G. R. Carroll. 1992. Dynamics of Organizational Populations: Density, Legitimation, and
Competition. Oxford University Press, New York. Hannan, M. T., G. R. Carroll, E. A. Dundon, J. C. Torres. 1995. Organizational evolution in a
multinational context: Entries of automobile manufacturers in Belgium, Britain, France, Germany, and Italy. Amer. Sociological Rev. 60(4) 509–528.
Hayek, F. A. 1945. The use of knowledge in society. Amer. Econom. Rev. 35(4) 519–530. Head, K., J. Ries, D. Swenson. 1995. Agglomeration benefits and location choice: Evidence from
27
Japanese manufacturing investments in the United States. J. of Internat. Econom. 38 223–247. Henisz, W. J. 2000. The institutional environment for multinational investment. J. of Law, Econom. and
Org. 16 (2) 334-364. Henisz, W. J. 2002. The institutional environment for infrastructure investment. Indust. and Corporate
Change 11(2) 355–389. Henisz, W. J., A. Delios. 2001. Uncertainty, imitation, and plant location: Japanese multinational
corporations, 1980–1998. Admin. Sci. Quart. 46(3) 443–477. Henisz, W. J., J. T. Macher. 2004. Firm- and country-level trade-offs and contingencies in the evaluation
of foreign investment: The semiconductor industry, 1994–2002. Organ. Sci. 15(5) 537–554. Hoen, A. 2001. Clusters: Determinants and effects. CPB Netherlands Bureau for Economic Policy
Analysis. CPB Memo. Hofstede, G. 1985. The interaction between national and organizational value systems. J of Management
Stud. 22(4) 347–357. Hofstede, G. 1994. Management scientists are human. Management Sci. 40(1, Focused issue: Is
management science international?) 4–13. Hofstede, G. 2001. Culture’s Consequences: Comparing Values, Behaviors, Institutions, and
Organizations Across Nations 2nd ed. Sage Publications, Thousand Oaks, CA. Hofstede, G., C. A. Van Duesen, C. B. Mueller, T. A. Charles, Business Goals Network. 2002. What goals
do business leaders pursue? A study in fifteen countries. J. of Internat. Bus. Stud. 33(4) 785–803. Holl, A. 2004. Transport infrastructure, agglomeration economies, and firm birth: Empirical evidence
from Portugal. J. of Regional Sci. 44(4) 693–712. Hotelling, H. 1929. Stability in competition. The Econom. J. 39(153) 41–57. IC Knowledge. 2001. Can the semiconductor industry afford the cost of new fabs?
http://www.icknowledge.com/economics/fab_costs.htmlKaufmann, D, A. Kraay, M. Mastruzzi. 2006. Government matters V: Governance indicators for
1996–2005. World Bank Policy Research Department Working Paper No. 4012 Kennedy, P. 1998. A Guide to Econometrics. 4th ed. MIT Press, Cambridge, MA. Koka, B. R., J. E. Prescott, R. Madhavan. 1999. Contagion influence on trade and investment policy: A
network perspective. J. of Internat. Bus. Stud. 30(1) 127–147. Krugman, P. R. 1991. Geography and Trade. MIT Press, Cambridge, MA. Laffont, J-J, J. Tirole. 1991. The politics of government decision-making: A theory of regulatory capture.
Quart. J. of Econom. 106(4) 1089–1127. Lamoreaux, N. R. 1994. Insider Lending: Banks, Personal Connections, and Economic Development in
Industrial New England. Cambridge University Press, New York. La Porta, R., F. Lopez-de-Silanes, A. Shleifer, R. W. Vishny. 1998. Law and finance. J. of Political
Econom. 106(6) 1113–1155. Lytle, A. L., J. M. Brett, Z. I. Barsness, C. H. Tinsley, M. S. Janssens. 1995. A paradigm for confirmatory
cross-cultural research in organizational behavior. Res. in Organ. Behavior 17 167–214. Malerba, F. 1985. The Semiconductor Business: The Economics of Rapid Growth and Decline. The
University of Wisconsin Press, Madison, WI. Mariotti, S., L. Piscitello. 1995. Information costs and location of FDIs within the host country: Empirical
evidence from Italy. J of Internat. Bus. Stud. 26(4) 815–841. Marshall, A. 1920. Principle of Economics. Macmillan, London. Martin, X., R. Salomon. 2003. Tacitness, learning, and international expansion: A study of foreign direct
investment in a knowledge-intensive industry. Organ. Sci. 14(3): 297–312. McCann, P., D. Shefer. 2003. Location, agglomeration and infrastructure. Papers in Regional Sci. 83(1)
177–196. McSweeney, B. 2002. Hofstede’s model of national cultural differences and their consequences: A
triumph of faith, a failure of analysis. Human Relations 55(1) 89–118. Meyer, J. W., B. Rowan. 1977. Institutionalized organizations: Formal structure as myth and ceremony.
Amer. J. of Sociology 83 340–363.
28
Morris, M. H., D. L. Davis, J. W. Allen. 1994. Fostering corporate entrepreneurship: Cross-cultural comparisons of the importance of individualism versus collectivism. J. of Internat. Bus. Stud. 25(1) 65–89.
Olson, M. 1965. The Logic of Collective Action. Harvard University Press, Cambridge, MA. Porter, M. E. 1998. On Competition. Harvard Business School, Boston. Porter, M. E. 2000. Locations, clusters, and company strategy. G. L. Clark, M. P. Feldman, M. S. Gertler
eds. The Oxford Handbook of Economic Geography, Oxford University Press, New York, 253–274.
Pouder, R., C. St. John. 1996. Hot spots and blind spots: Geographic clusters of firms and innovation. Acad. of Management Rev. 21(4) 1192–1225.
Ramey, G., V. A. Ramey. 1995. Cross-country evidence on the link between volatility and growth. Amer. Econom. Rev. 85(5) 1138–1151.
Salomon, R., X. Martin. 2007. Technology transfer and implementation performance: A study of time-to-build in the global semiconductor industry. Working Paper, New York University, New York, NY.
Schmutzler, A. 1999. The new economic geography. J. of Econom. Surveys 13(4) 355–379. Schoonhoven, C. B., K. M. Eisenhardt, K. Lyman. 1990. Speeding products to market: Waiting time to
first product introduction in new firms. Admin. Sci. Quart. 35 177–207. Schwartz, S. H. 1994. Beyond individualism/collectivism: New cultural dimensions of values. U. Kim, H.
C. Triandis, C. Kagitcibasi, S-C. Choi, G. Yoon, eds. Individualism and Collectivism: Theory, Method and Application. Sage, Newbury Park, CA, 85–122.
Schwartz, S. H. 2004. Mapping and interpreting cultural differences around the world. H. Vinken, J. Soeters, P. Ester eds. Comparing Cultures: Dimensions of Culture in a Comparative Perspective, Brill Academic Publishers, Leyden, 43–73.
Shaver, J. M. 1998. Do foreign-owned and U.S.-owned establishments exhibit the same location pattern in U.S. manufacturing industries? J. of Internat. Bus. Stud. 29(3) 469–492.
Shaver, J. M., F. Flyer. 2000. Agglomeration economies, firm heterogeneity and foreign direct investment in the United States. Strategic Management J. 21(12) 1175–1193.
Sorenson, O., P. G. Audia. 2000. The social structure of entrepreneurial activity: Geographic concentration of footwear production in the United States, 1940–1989. Amer. J. of Sociology 106(2) 424–462.
Stock, J., M. W. Watson. 2002. Has the business cycle changed and why? National Bureau of Economic Research Working Paper 9127.
Stuart, T. E., H. Hoang, R. C. Hybels. 1999. Interorganizational endorsements and the performance of entrepreneurial ventures. Admin. Sci. Quart. 44 315–349.
Triandis, H. C. 1982. “Culture’s consequence”. Human Organ. 41(1) 86–90. Triandis, H. C. 1995. Individualism and Collectivism. Westview Press. Boulder, CO. Uzzi, B. 1997. Social structure and competition in interfirm networks: The paradox of embeddedness.
Admin. Sci. Quart. 42 35–67. Uzzi, B., R. Lancaster. 2003. Relational embeddedness and learning: The case of bank loan managers and
their clients. Management Sci. 49(4) 383–399. Vukmanic, F. G.., M. R. Czinkota, D. A. Ricks. 1985. National and international data problems and
solutions in the empirical analysis of intra-industry direct foreign investment. A. Erdilek ed. Multinationals as Mutual Invaders: Intra-Industry Direct Foreign Investment. St. Martin’s Press, New York, 160–184.
Wan, W. P., R. E. Hoskisson. 2003. Home country environments, corporate diversification strategies, and firm performance. Acad. of Management J. 46(1) 27–45.
Weber, A. 1929. Theory of Location of Industries. Russel and Russel, New York. Whitford, J., C. Potter. 2007. Regional economies, social networks, and the spatial fragmentation of
production. Socio-econ. Rev. 5(3) 497-526. Williamson, O. E. 1979. Transaction cost economics: The governance of contractual relations. J. of Law
and Econom. 22: 233–262.
29

Figure 1a. Semiconductor Plants in the United States (All Plants in 1980)
Figure 1b. Semiconductor Plants in the United States (Agglomerations in 1980)
30
31
Figure 2a. Semiconductor Plants in the United States (All Plants in 2000)
Figure 2b. Semiconductor Plants in the U.S. (Agglomerations in 2000)
32
1. 2. 3. 4. 5. 6. 7. 8. 9. 10. 11. 12. 13. 14. 15. 16. 17.1. Agglomeration 1.00 2. Relative feature size
-0.03 1.00
3. R&D facility 0.04 -0.09 1.00
4. Joint venture
0.18 -0.06 -0.13 1.005. FDI -0.08 0.00 -0.15 0.37 1.006. Headquarters 0.19 0.05 0.19 -0.11 -0.37 1.007. Firm experience 0.20 -0.18 -0.07 0.12 0.19 -0.29 1.00 8. Number of own plants 0.35 -0.12 -0.09 -0.04 -0.15 0.01 0.46 1.00 9. Number of rival plants 0.05 -0.13 0.04 -0.04 -0.05 0.16 -0.06 -0.05 1.00 10. Sponsored site
0.03 0.04 0.10 0.10 0.04 0.17 -0.20 -0.22 0.27 1.00
11. GDP -0.00 -0.09 0.18 -0.18 -0.18 0.00 0.06 -0.08 0.22 0.14 1.0012. GDP per capita 0.09 -0.14 0.11 -0.16 -0.08 -0.13 0.25 0.08 0.24 -0.04 0.66 1.00 13. Individualism -0.27 -0.01 0.21 -0.30 -0.03 -0.10 -0.05 -0.19 0.07 0.09 0.75 0.63 1.0014. Uncertainty avoidance 0.05 0.07 -0.05 -0.14 -0.21 -0.03 0.16 0.22 -0.07 -0.40 -0.36 -0.11 -0.39 1.00 15. Economic Freedom Index 0.09 -0.16 0.10 -0.06 0.04 -0.06 0.13 0.02 0.26 0.09 0.52 0.84 0.54 -0.39 1.00 16. GDP volatility 0.01 0.00 0.03 -0.03 -0.03 0.01 -0.08 0.05 -0.15 -0.01 -0.07 -0.09 -0.00-0.13 -0.03 1.00 17. Political uncertainty
-0.08 0.02 0.06 -0.31 -0.21 -0.08 0.16 0.14 0.06 -0.28 0.04 0.36 0.19 0.67 0.09 -0.22 1.00
Mean 0.45 0.67 0.25 0.15 0.19 0.42 6.48 1.15 13.20 3.330.57 58.9420.56 64.70 7.17 0.01 0.42Standard error 0.50 0.69 0.43 0.36 0.39 0.49 8.60 2.12 13.33 0.50 2.58 6.71 27.58 24.19
0.86 0.02 0.14
Minimum
0 00.07 00 0 0 0 0 0 0.04 1.21 17 3.968 0.00 0Maximum 1 17.23 11 1 44 14 65 1 10.83 37.93 91 8.8595 0.14 0.71
Table 1 Descriptive Statistics and Product Moment Correlations
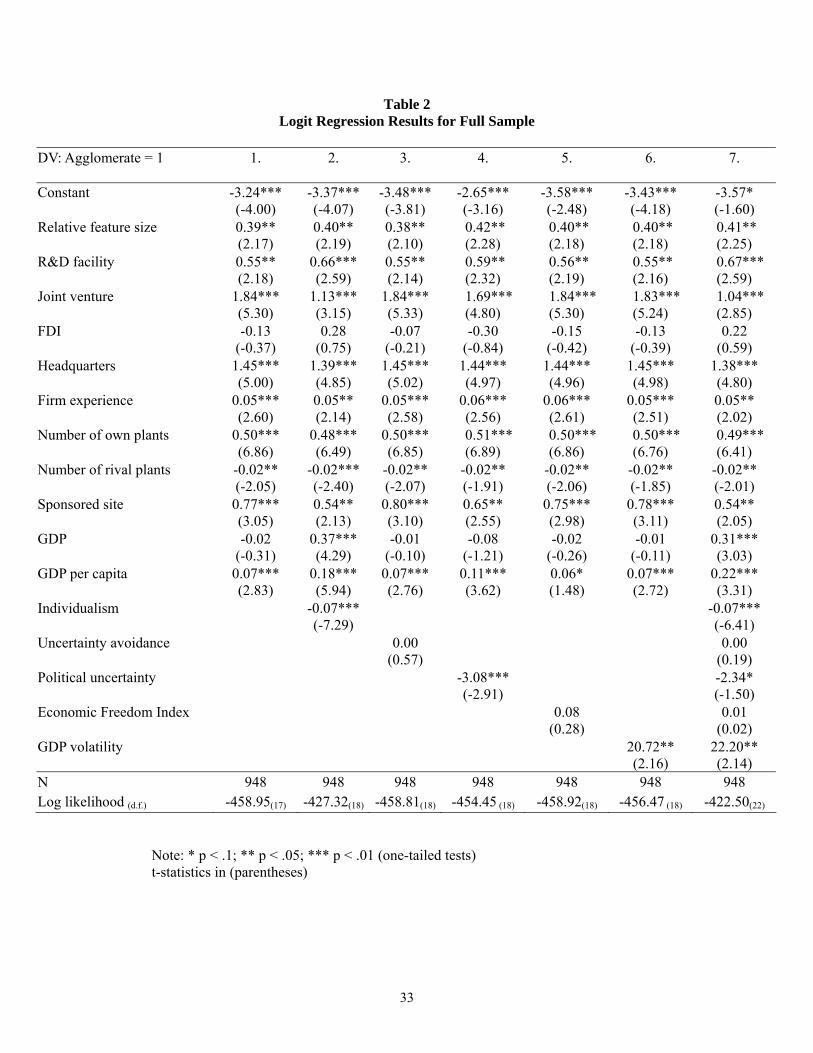
Table 2 Logit Regression Results for Full Sample
DV: Agglomerate = 1
1. 2. 3. 4. 5. 6. 7.
Constant
-3.24*** (-4.00)
-3.37*** (-4.07)
-3.48*** (-3.81)
-2.65*** (-3.16)
-3.58*** (-2.48)
-3.43*** (-4.18)
-3.57* (-1.60)
Relative feature size
0.39** (2.17)
0.40** (2.19)
0.38** (2.10)
0.42** (2.28)
0.40** (2.18)
0.40** (2.18)
0.41** (2.25)
R&D facility 0.55** (2.18)
0.66*** (2.59)
0.55** (2.14)
0.59** (2.32)
0.56** (2.19)
0.55** (2.16)
0.67*** (2.59)
Joint venture 1.84*** (5.30)
1.13*** (3.15)
1.84*** (5.33)
1.69*** (4.80)
1.84*** (5.30)
1.83*** (5.24)
1.04*** (2.85)
FDI
-0.13 (-0.37)
0.28 (0.75)
-0.07 (-0.21)
-0.30 (-0.84)
-0.15 (-0.42)
-0.13 (-0.39)
0.22 (0.59)
Headquarters
1.45*** (5.00)
1.39*** (4.85)
1.45*** (5.02)
1.44*** (4.97)
1.44*** (4.96)
1.45*** (4.98)
1.38*** (4.80)
Firm experience
0.05*** (2.60)
0.05** (2.14)
0.05*** (2.58)
0.06*** (2.56)
0.06*** (2.61)
0.05*** (2.51)
0.05** (2.02)
Number of own plants 0.50*** (6.86)
0.48*** (6.49)
0.50*** (6.85)
0.51*** (6.89)
0.50*** (6.86)
0.50*** (6.76)
0.49*** (6.41)
Number of rival plants -0.02** (-2.05)
-0.02*** (-2.40)
-0.02** (-2.07)
-0.02** (-1.91)
-0.02** (-2.06)
-0.02** (-1.85)
-0.02** (-2.01)
Sponsored site 0.77*** (3.05)
0.54** (2.13)
0.80*** (3.10)
0.65** (2.55)
0.75*** (2.98)
0.78*** (3.11)
0.54** (2.05)
GDP -0.02 (-0.31)
0.37*** (4.29)
-0.01 (-0.10)
-0.08 (-1.21)
-0.02 (-0.26)
-0.01 (-0.11)
0.31*** (3.03)
GDP per capita 0.07*** (2.83)
0.18*** (5.94)
0.07*** (2.76)
0.11*** (3.62)
0.06* (1.48)
0.07*** (2.72)
0.22*** (3.31)
Individualism
-0.07*** (-7.29)
-0.07*** (-6.41)
Uncertainty avoidance 0.00 (0.57)
0.00 (0.19)
Political uncertainty -3.08*** (-2.91)
-2.34* (-1.50)
Economic Freedom Index 0.08 (0.28)
0.01 (0.02)
GDP volatility 20.72** (2.16)
22.20** (2.14)
N 948 948 948 948 948 948 948 Log likelihood (d.f.) -458.95(17) -427.32(18) -458.81(18) -454.45 (18) -458.92(18) -456.47 (18) -422.50(22)
Note: * p < .1; ** p < .05; *** p < .01 (one-tailed tests)
t-statistics in (parentheses)
33
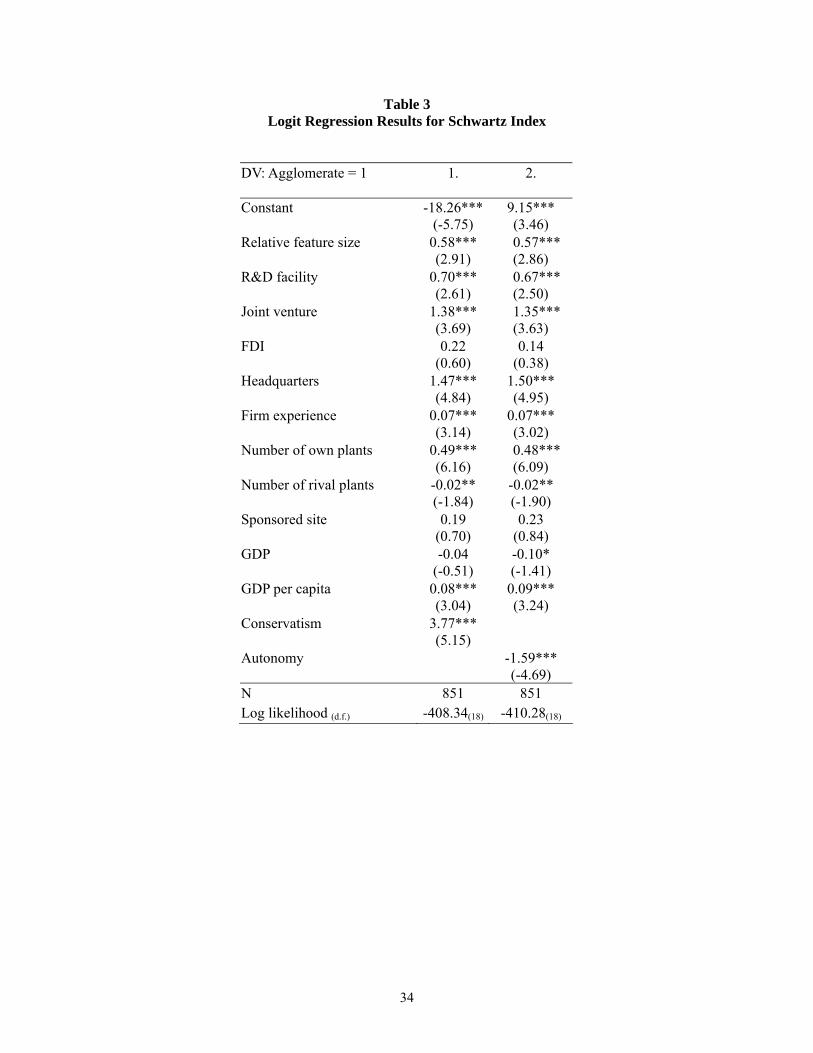
Table 3 Logit Regression Results for Schwartz Index
DV: Agglomerate = 1
1. 2.
Constant
-18.26***(-5.75)
9.15*** (3.46)
Relative feature size
0.58*** (2.91)
0.57*** (2.86)
R&D facility 0.70*** (2.61)
0.67*** (2.50)
Joint venture 1.38*** (3.69)
1.35*** (3.63)
FDI
0.22 (0.60)
0.14 (0.38)
Headquarters
1.47*** (4.84)
1.50*** (4.95)
Firm experience
0.07*** (3.14)
0.07*** (3.02)
Number of own plants 0.49*** (6.16)
0.48*** (6.09)
Number of rival plants -0.02** (-1.84)
-0.02** (-1.90)
Sponsored site 0.19 (0.70)
0.23 (0.84)
GDP -0.04 (-0.51)
-0.10* (-1.41)
GDP per capita 0.08*** (3.04)
0.09*** (3.24)
Conservatism
3.77*** (5.15)
Autonomy -1.59*** (-4.69)
N 851 851 Log likelihood (d.f.) -408.34(18) -410.28(18)
34
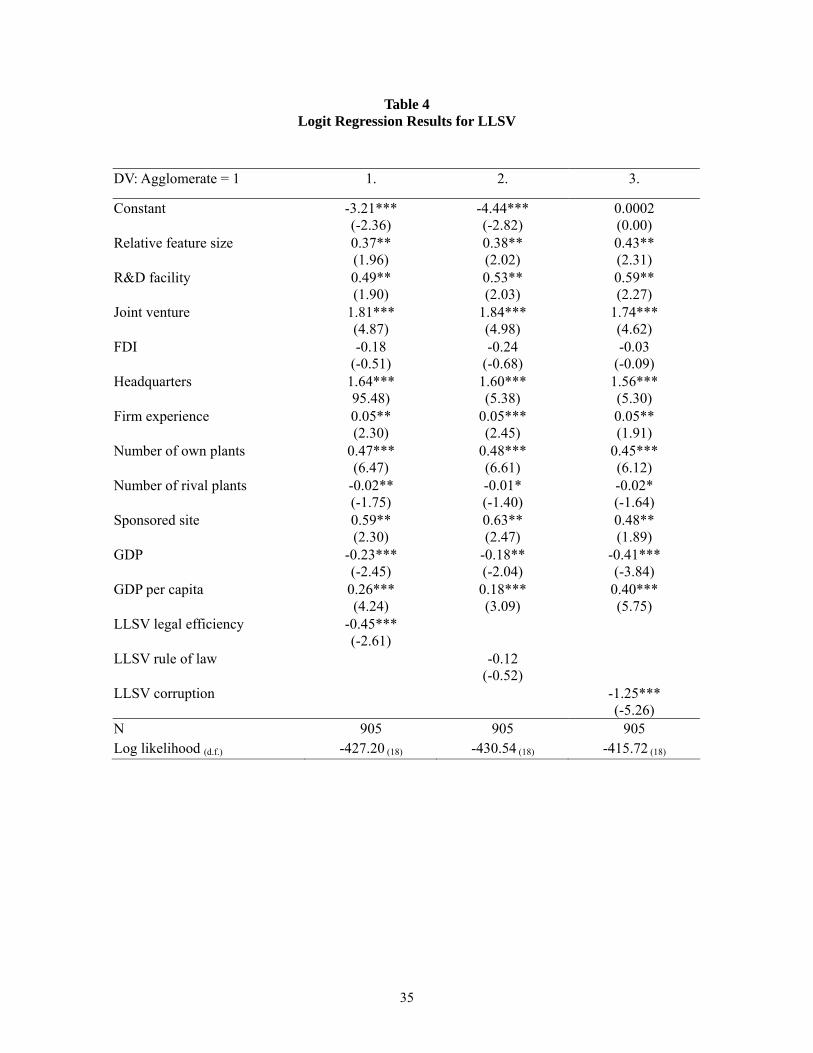
Table 4 Logit Regression Results for LLSV
DV: Agglomerate = 1 1. 2. 3.
Constant
-3.21*** (-2.36)
-4.44*** (-2.82)
0.0002 (0.00)
Relative feature size
0.37** (1.96)
0.38** (2.02)
0.43** (2.31)
R&D facility 0.49** (1.90)
0.53** (2.03)
0.59** (2.27)
Joint venture 1.81*** (4.87)
1.84*** (4.98)
1.74*** (4.62)
FDI
-0.18 (-0.51)
-0.24 (-0.68)
-0.03 (-0.09)
Headquarters
1.64*** 95.48)
1.60*** (5.38)
1.56*** (5.30)
Firm experience
0.05** (2.30)
0.05*** (2.45)
0.05** (1.91)
Number of own plants 0.47*** (6.47)
0.48*** (6.61)
0.45*** (6.12)
Number of rival plants -0.02** (-1.75)
-0.01* (-1.40)
-0.02* (-1.64)
Sponsored site 0.59** (2.30)
0.63** (2.47)
0.48** (1.89)
GDP -0.23*** (-2.45)
-0.18** (-2.04)
-0.41*** (-3.84)
GDP per capita 0.26*** (4.24)
0.18*** (3.09)
0.40*** (5.75)
LLSV legal efficiency
-0.45*** (-2.61)
LLSV rule of law -0.12 (-0.52)
LLSV corruption -1.25*** (-5.26)
N 905 905 905 Log likelihood (d.f.) -427.20 (18) -430.54 (18) -415.72 (18)
35
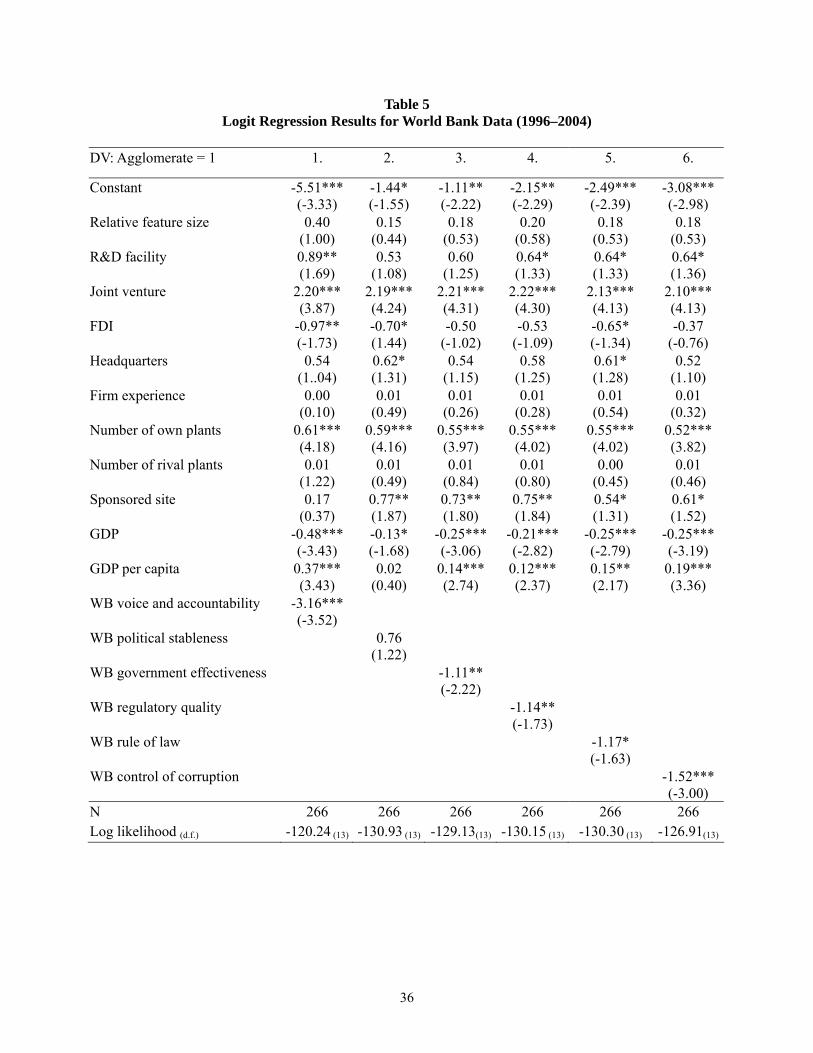
Table 5 Logit Regression Results for World Bank Data (1996–2004)
DV: Agglomerate = 1 1. 2. 3. 4. 5. 6.
Constant
-5.51*** (-3.33)
-1.44* (-1.55)
-1.11** (-2.22)
-2.15** (-2.29)
-2.49*** (-2.39)
-3.08*** (-2.98)
Relative feature size
0.40 (1.00)
0.15 (0.44)
0.18 (0.53)
0.20 (0.58)
0.18 (0.53)
0.18 (0.53)
R&D facility 0.89** (1.69)
0.53 (1.08)
0.60 (1.25)
0.64* (1.33)
0.64* (1.33)
0.64* (1.36)
Joint venture 2.20*** (3.87)
2.19*** (4.24)
2.21*** (4.31)
2.22*** (4.30)
2.13*** (4.13)
2.10*** (4.13)
FDI
-0.97** (-1.73)
-0.70* (1.44)
-0.50 (-1.02)
-0.53 (-1.09)
-0.65* (-1.34)
-0.37 (-0.76)
Headquarters
0.54 (1..04)
0.62* (1.31)
0.54 (1.15)
0.58 (1.25)
0.61* (1.28)
0.52 (1.10)
Firm experience
0.00 (0.10)
0.01 (0.49)
0.01 (0.26)
0.01 (0.28)
0.01 (0.54)
0.01 (0.32)
Number of own plants 0.61*** (4.18)
0.59*** (4.16)
0.55*** (3.97)
0.55*** (4.02)
0.55*** (4.02)
0.52*** (3.82)
Number of rival plants 0.01 (1.22)
0.01 (0.49)
0.01 (0.84)
0.01 (0.80)
0.00 (0.45)
0.01 (0.46)
Sponsored site 0.17 (0.37)
0.77** (1.87)
0.73** (1.80)
0.75** (1.84)
0.54* (1.31)
0.61* (1.52)
GDP -0.48*** (-3.43)
-0.13* (-1.68)
-0.25*** (-3.06)
-0.21*** (-2.82)
-0.25*** (-2.79)
-0.25*** (-3.19)
GDP per capita 0.37*** (3.43)
0.02 (0.40)
0.14*** (2.74)
0.12*** (2.37)
0.15** (2.17)
0.19*** (3.36)
WB voice and accountability -3.16*** (-3.52)
WB political stableness 0.76 (1.22)
WB government effectiveness -1.11** (-2.22)
WB regulatory quality -1.14** (-1.73)
WB rule of law -1.17* (-1.63)
WB control of corruption -1.52*** (-3.00)
N 266 266 266 266 266 266 Log likelihood (d.f.) -120.24 (13) -130.93 (13) -129.13(13) -130.15 (13) -130.30 (13) -126.91(13)
36