the influence of spatial patterns of soil moisture on the grass and
TRANSCRIPT

The Influence of Spatial Patterns ofSoil Moisture on the Grass and ShrubResponses to a Summer Rainstorm in
a Chihuahuan Desert Ecotone
William T. Pockman1* and Eric E. Small2
1Department of Biology, MSC03 2020, University of New Mexico, Albuquerque, New Mexico 87131-0001, USA; 2Department of
Geological Sciences, University of Colorado—Boulder, Boulder, Colorado 80309-0399, USA
ABSTRACT
The cycling of surface water, energy, nutrients, and
carbon is different between semiarid grassland and
shrubland ecosystems. Although differences are
evident when grasslands are compared to shrub-
lands, the processes that contribute to this transition
are more challenging to document. We evaluate
how surface redistribution of precipitation and plant
responses to the resulting infiltration patterns could
contribute to the changes that occur during the
transition from grassland to shrubland. We mea-
sured soil water potential under grasses (Bouteloua
eriopoda), shrubs (Larrea tridentata) and bare soil and
changes in plant water relations and gas exchange
following a 15 mm summer storm in the grassland–
shrubland ecotone at the Sevilleta National Wildlife
Refuge in central New Mexico USA. Following the
storm, soil water potential (Ws) increased to 30 cm
depth beneath both grass and shrub canopies, with
the greatest change observed in the top 15 cm of the
soil. The increase in Ws was greater beneath grass
canopies than beneath shrub canopies. Ws under
bare soil increased only to 5 cm depth. The sub-
stantial redistribution of rainfall and different root-
ing depths of the vegetation resulted in high Ws
throughout most of the rooting volume of the grasses
whereas soil moisture was unchanged throughout a
large portion of the shrub rooting volume. Consis-
tent with this pattern, predawn water potential
(WPD) of grasses increased more than 5 MPa to
greater than -1 MPa whereas WPD of shrubs in-
creased to -2.5 MPa, a change of less than 2 MPa.
Transpiration increased roughly linearly with WPD in
both grasses and shrubs. In grasses, assimilation was
strongly correlated with WPD whereas there was no
relationship in shrubs where assimilation showed no
significant response to the pulse of soil moisture
following the storm. These data show that prefer-
ential redistribution of water to grass canopies en-
hances transpiration and assimilation by grasses
following large summer storms. This process may
inhibit shrubland expansion at the ecotone during
periods without extreme drought.
Key words: precipitation pulses; surface hydrol-
ogy; plant gas exchange; soil moisture; grass–shrub
interactions; spatial pattern of soil moisture.
INTRODUCTION
In the Southwestern U.S., and semiarid environ-
ments worldwide, extensive areas of grassland have
been replaced by shrubland over the past century
(van Vegten 1983; Pelaez and others 1994; Archer
Received 16 October 2009; accepted 10 March 2010;
published online 18 May 2010
Author contributions: William T. Pockman and Eric E. Small conceived
of and designed the study, performed the research, analyzed the data,
contributed new methods or models and wrote the paper.
*Corresponding author; e-mail: [email protected]
Ecosystems (2010) 13: 511–525DOI: 10.1007/s10021-010-9337-2
� 2010 Springer Science+Business Media, LLC
511

1994; Gill and Burke 1999). This process has been
variously attributed to climatic variability and
change, grazing, fire management practices, and
rising atmospheric CO2 concentration (Neilson
1986; Bahre and Shelton 1993; Archer and others
1995; Huxman and others 2005). Identifying the
relative importance of these individual factors is
challenging because interactions among them may
be strong (Archer 1994). Furthermore, historical
records of vegetation change are limited (Buffing-
ton and Herbel 1965; Gibbens and others 2005),
making it difficult to determine whether woody
encroachment has occurred in a continuous but
gradual manner or rapidly during intermittent
events such as severe drought.
The many structural and functional differences
between grasses and shrubs, and the related differ-
ences between grassland and shrubland ecosystems,
lead to dramatic environmental changes when
shrubs replace grasses as the dominant vegetation
(Schlesinger and others 1990). In particular, these
changes may include modified cycling of surface
water, energy, nutrients, and carbon (Abrahams
and others 1995; Wilcox 2002; Houghton and oth-
ers 1999; Pacala and others 2001; Jackson and
others 2002; Kurc and Small 2004; Kurc and Small
2007). Although these differences are evident when
grasslands are compared with shrublands, the
development of these changes during the transition
from grassland to shrubland is more difficult to
evaluate. In this paper, we document how plants at
a grassland–shrubland ecotone use soil water that
infiltrated during a typical summer rainfall event.
We focus on the ecotone because this portion of the
landscape is expected to be the most sensitive to a
variety of forcing mechanisms (Peters 2002; Peters
and others 2006a). Our goal is to quantify the spa-
tial pattern of infiltration and soil water availability
associated with this event and to identify how this
pattern controls transpiration and assimilation by
grasses and shrubs.
At the Sevilleta National Wildlife Refuge in
central New Mexico, USA, large areas of black
grama (Bouteloua eriopoda) grassland and creosote
bush (Larrea tridentata) shrubland are separated by
a narrow ecotone where the dominant grass and
shrub species co-occur. In addition to contrasts in
cover, there are several differences between shrub
and grass species, such as those at the Sevilleta, that
influence water use and carbon fixation in this
system in response to precipitation (Huxman and
others 2004). First, creosote bush has deeper roots
(Kurc and Small 2004), as is typical for woody
species (Schenk and Jackson 2002). Second, the
evergreen creosote bush can potentially exhibit
photosynthesis and transpiration whenever condi-
tions are favorable whereas the activity of black
grama is restricted to the summer months. Third,
creosote bush maintains gas exchange at lower soil
water potentials (Ws; Odening and others 1974;
Ogle and Reynolds 2002) than is typical for black
grama (for example, Morgan and others 2001).
Finally, as is typical of C4 grasses and C3 shrubs, the
C4 black grama, exhibits higher maximum photo-
synthetic rates (Amax), lower maximum transpira-
tion rates (Emax) and increased water use efficiency
(WUE) compared to the C3 creosote bush (for
example, Hamerlynck and others 2000).
The differences between grassland and shrub-
land, such as those at Sevilleta, are not limited to
the specific functional differences between black
grama and creosote bush. Organic carbon and
nutrients in both grassland and shrubland are
concentrated beneath plant canopies relative to the
surrounding bare soil (for example, Schlesinger and
others 1990). These ‘‘islands of fertility’’ are more
strongly developed in the shrubland than in the
grassland (Schlesinger and others 1996; Kieft and
others 1998). There are also important differences
in water cycling between these two ecosystems. At
the hillslope scale, there is more overland flow in
shrublands, leading to soil redistribution and ero-
sion (Abrahams and others 1995; Schlesinger and
others 2000). This soil erosion, in conjunction with
rain-splash, exposes finer textured soils with lower
infiltration capacity in the large interspaces that
exist in shrubland. The resulting spatial pattern of
infiltration capacity, high under canopies and low
in interspaces, leads to focused, deep infiltration
beneath shrub canopies (Bhark and Small 2003).
Due to the combination of these factors, the spatial
distribution of soil and water resources is more
heterogeneous in shrubland (for example, Schle-
singer and others 1990). In addition, there is
greater horizontal redistribution of mineral and
organic matter in the shrubland. Whether the
transported material is simply redistributed locally
or removed entirely is believed to vary with envi-
ronmental conditions (for example, Ludwig and
others 2002; Schlesinger and others 1990).
The well documented biotic and abiotic differ-
ences between grassland and shrubland have long
been used as a starting point for conceptual models
of how herbaceous and woody species interact at
the ecotone between the two ecosystems. Walter’s
two-layer model (1971, 1973) is based on a soil
column split into two layers corresponding to the
rooting depth of woody and herbaceous plants: (1)
an upper-layer from which herbaceous plants can
more efficiently extract soil water; and (2) a
512 W. T. Pockman and E. E. Small

lower-layer in which only woody plants have roots,
and thus the ability to extract water. Although
originally conceived for savanna environments,
this model has been applied to mixed assemblages
of shrubs and grass (for example, Soriano and Sala
1984). Likewise, the pulse-reserve model (Westoby
and Bridges unpublished, cited in Noy-Meir 1973),
which relates precipitation pulses to the resulting
reserves of carbon, has also been widely applied. In
contrast, the Schlesinger and others (1990) model
of desertification is focused on horizontal hetero-
geneities in the distribution of resources: as shrub
encroachment proceeds, water and soil nutrients
are increasingly concentrated beneath shrub can-
opies while the intervening areas become more
barren. Subsequent models have incorporated
additional complexity to better reflect field condi-
tions and to broaden the applicability to diverse
systems. The ‘threshold-delay’ model (Ogle and
Reynolds 2004) modifies the two-layer and pulse-
reserve models, incorporating threshold-specific
responses, delays associated with plant responses
and differences among plant functional types
(Reynolds and others 2004). To assess the interac-
tion of herbaceous and woody vegetation in a pi-
non-juniper savanna, Breshears and Barnes’
(1999) ‘four-compartment’ model considered both
vertical and horizontal heterogeneity in soil water
availability and acquisition by different species.
Data from environments where herbaceous and
woody species coexist have been used to assess how
accurately these disparate conceptual models de-
scribe the actual plant–water interactions that oc-
cur. Although many studies have supported the
two-layer model, others have noted species and
sites that were exceptions (Ogle and Reynolds
2004). For example, at a Chihuahuan desert site,
Montana and others (1995) found that the shrub
Flourensia cernua and the grass Hilaria mutica both
responded strongly to an artificial rainfall event
that only wetted the top 40 cm of soil, whereas the
shrub L. tridentata showed little response and pre-
sumably was more hydraulically connected to
deeper soil. Fewer studies have focused on hori-
zontal heterogeneities of soil moisture, particularly
in environments where woody and herbaceous
species are mixed. Reid and others (1999) showed
that horizontal redistribution of surface water, and
the resulting horizontal and vertical variability of
soil moisture, is critical to understand plant–water
interactions in these areas.
In this study, we document the horizontal and
vertical variations of soil water, with respect to the
spatial arrangement of grasses and shrubs, before
and after a rainfall event. Then, we compare how
shrubs and grasses respond to this event, and link
the differences in their response to the observed
pattern of soil water. Our goal is to answer the
following questions. First, is soil water distributed
uniformly across the landscape, or does the hori-
zontal redistribution of surface water provide
grasses or shrubs access to more soil water? If the
latter is true, then conceptual models that explicitly
address horizontal heterogeneities (for example,
Schlesinger and others 1990; Breshears and Barnes
1999) may be superior to the Walter two-layer
model, at least in environments where woody and
herbaceous species are not completely intermixed
(that is, where bare soil is a significant component
of total cover). Second, how does the depth of the
wetting front resulting from a summer storm
compare to the rooting depths of grasses and
shrubs? It is expected that the wetting front is
shallow and therefore does not propagate below
the root zone of grasses (for example, Sala and
others 1992). If this is the case, then shrubs do not
have exclusive access to any portion of the soil
moisture resulting from summer rainfall. And
third, do shrubs utilize the soil moisture associated
with a summer storm as rapidly and as efficiently as
grasses, or is their response less dramatic? Shrubs
might be less responsive because (1) their roots are
deep relative to summertime wetting fronts (for
example, Ehleringer and others 1991; Montana
and others 1995) or (2) their physiological re-
sponses sometimes lag behind increases in water
availability (Yan and others 2000). Finally, we
sought to evaluate the utility of the various existing
conceptual models in light of the patterns of infil-
tration and plant responses that we observed.
STUDY AREA AND THE GRASS–SHRUB
ECOTONE
Site Description
This study was conducted at the McKenzie Flats
area of the Sevilleta National Wildlife Refuge in
central New Mexico USA (34�20¢N 106�45¢W). The
grassland–shrubland ecotone is narrow at McKen-
zie Flats: end-member grassland and shrubland
ecosystems exist within 2 km of each other in this
area. The end-member grassland is dominated by
black grama (B. eriopoda) and has 50–60% canopy
cover (Figure 1), with individual plants and the
bare soil interspaces of equal size. The micro-
topography associated with each grass clump
isolates adjacent interspaces. In contrast, the end-
member shrubland is dominated by creosote bush
(L. tridentata) with approximately 25% plant cover
Plant Response to Spatial Variation in Soil Moisture 513
(Figure 1) and interspaces are topographically
interconnected, allowing for lateral redistribution
of surface water and the materials it transports
(Abrahams and others 1995; Schlesinger and others
2000; Bedford and Small 2008). Rooting distribu-
tions measured for each species at the site showed
that 90% of the grass roots were above 20 cm
depth whereas the peak root density for the shrubs
was at 30 cm with roots extending to at least 60 cm
(Kurc and Small 2004). In this study, we collected
data from the middle of the ecotone where the
dominant species from the end-member ecosys-
tems co-occur, roughly 1 km from either of the
end-member ecosystems. The spatial arrangement
of the grasses and shrubs is described in more detail
below. Secondary species include Bouteloua gracilis
(blue grama), Hilaria sp., Sporobolus sp., and Gutti-
erezia sarothrae, which together cover less than 5%
of area. The area has not been grazed by livestock
since the 1970s.
The study area is located in the northeast portion
of the Sevilleta, where the elevation is approxi-
mately 1500 m. In this area, the active stream
channel network has not incised McKenzie Flats
and the surface slope is 1–2%. The soil is a sandy
loam with a K-horizon that starts at a depth of
40 cm below the surface. A water retention curve
for soil from the site, based on both field and lab-
oratory measurements (Bhark 2002), is shown in
Figure 2. As expected for a sandy loam soil, volu-
metric water content (h) changes by only 10%
when Ws varies between -0.1 and -10 MPa. In
contrast, nearly the entire range of h exists when
Ws varies from -0.1 MPa to saturation.
Climate and Storm Details
Annual precipitation at the study site is 230 mm,
with roughly half of the annual precipitation
occurring during the summer monsoon (July–
September). Data were collected before and after a
15 mm rain storm on 16 September 2001 (day
259). From June through mid-September of 2001,
there was 115 mm of precipitation at the site,
roughly 10% above the average for this period.
There was a large, multi-day event around day 225
(35 mm), followed by a 12 mm event on day 240.
Then, there was no rainfall for 20 days before or for
15 days after this event. So, although the soil had
been largely drying over the days prior to the
event, the monsoon of 2001 was not a drought
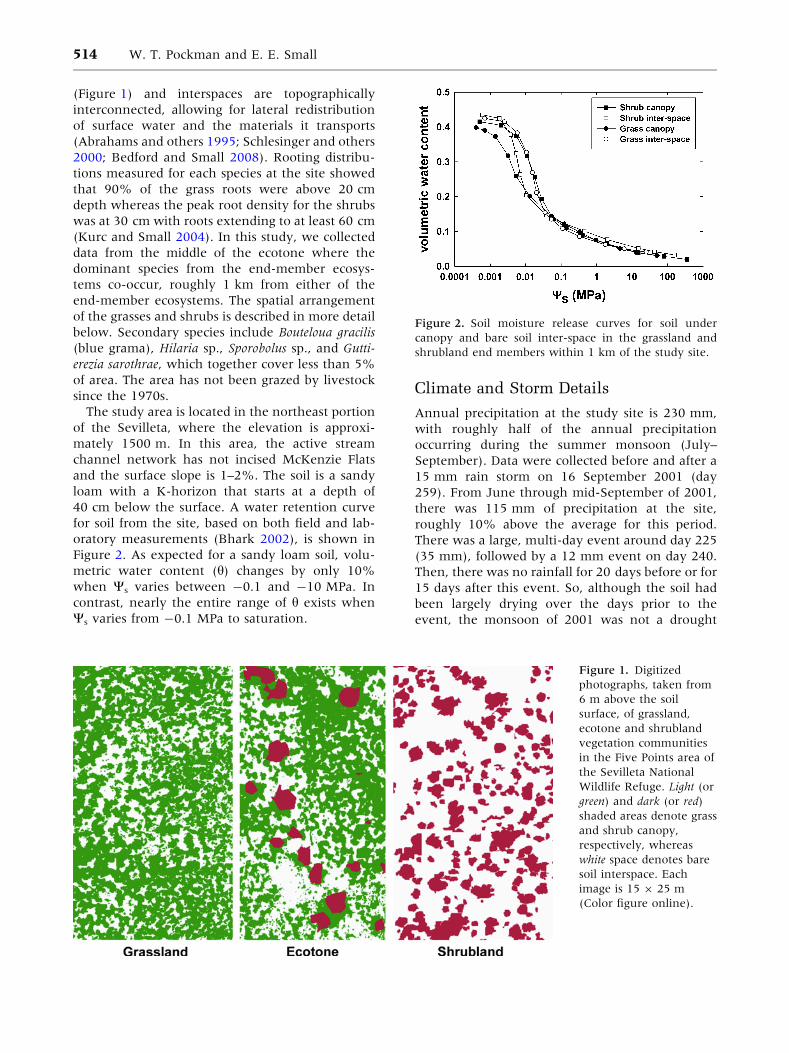
Figure 1. Digitized
photographs, taken from
6 m above the soil
surface, of grassland,
ecotone and shrubland
vegetation communities
in the Five Points area of
the Sevilleta National
Wildlife Refuge. Light (or
green) and dark (or red)
shaded areas denote grass
and shrub canopy,
respectively, whereas
white space denotes bare
soil interspace. Each
image is 15 9 25 m
(Color figure online).
Figure 2. Soil moisture release curves for soil under
canopy and bare soil inter-space in the grassland and
shrubland end members within 1 km of the study site.
514 W. T. Pockman and E. E. Small

year. Although cooling temperatures in the fall can
initiate grass senescence during September and
October in some years, in 2001 temperatures re-
mained high throughout the study period before
cooling in mid-October.
The rainstorm on DoY 259 was large compared to
most storms at the site and in other semiarid
environments (Sala and others 1992). The daily
rainfall total on DoY 259 (15 mm) was greater than
that observed on 90% of the rainy days during the
monsoon season at the Sevilleta site (Figure 3).
Although large storms do not occur frequently, a
disproportionately large fraction of the total rainfall
accumulates during these storms: 40% of the total
rainfall accumulates on days when rainfall is
15 mm or greater. The DoY 259 rainfall event
lasted roughly 20 min, with an average intensity of
about 40 mm/h. More than 75% of the rainfall
recorded throughout the Sevilleta occurs at inten-
sities lower than 40 mm/h. Although the DoY 259
storm was both large and intense, there was no
runoff in the first-order channels below McKenzie
Flats during or after the event. However, we did
observe substantial ponding and surface redistri-
bution at a length scale of approximately 10 m.
Ecotone Geometry
We now describe the spatial distribution of shrubs
and grasses at and around the ecotone (compare
Peters and others 2006a–c for additional descrip-
tion). The ecotone is composed of a matrix of
grassland with interspersed shrub patches. The area
and number of individuals in each shrub patch vary
with distance from the grassland and shrubland end
members. On the grassland side of the ecotone,
individual shrubs, the smallest patch possible, exist
within the grass matrix (Peters and others 2006a, b).
The size of shrub patches and the number of shrubs
that they contain increase from the grassland to
shrubland. On the shrubland side of the ecotone,
only discontinuous bands of grasses exist amidst the
nearly continuous shrub cover and large bare soil
interspaces (Peters and others 2006c).
We collected data from the geographic middle of
the ecotone. In this area, the shrub patches typically
include between 3 and 10 individuals and cover an
area of 10–50 m2. The spacing between adjacent
shrub patches is about 10 m or greater. The inter-
spaces within the shrub patches are large (�1 m), as
in the shrubland (Figure 1), consisting primarily of
bare soil. The interspaces in the grassland matrix are
much smaller (�20 cm) and more disconnected.
Few of the grass clumps at the ecotone are found
beneath or directly adjacent to shrub canopies, and
we estimate that less than 5% of the total grass
biomass is found in these locations. Instead, adja-
cent shrubs and grass clumps are typically separated
by large interspaces (>1 m), similar to those found
within the shrub patches or end-member ecosystem
(Figure 1). Even where some grasses do occur un-
der the shrub canopy, it is rare for these grasses to
surround the shrub base leaving the sub-canopy soil
connected to the bare soil interspaces that appear
around shrubs in the ecotone. These large inter-
spaces define a boundary between the grasses and
shrubs at the ecotone (Peters and others 2006a).
Given this spatial arrangement, it is difficult to apply
the Walter two-layer model at the grass–shrub
ecotone. Nearly all of the grasses at the ecotone are
spatially isolated from the shrubs, given that the
lateral spread of plants like the shrubs and grasses
studied here is typically 2 m or less (Schenk and
Jackson 2002). However, horizontal redistribution
of surface water may still yield strong interactions
between these spatially disparate woody and her-
baceous plants (for example, Breshears and Barnes
1999; Schlesinger and others 1990).
METHODS
Plot Selection, Design, and Installation
We collected plant and soil data from six
10 9 15 m plots established for a manipulative
study of the effects of drought on the ecotone
between grassland and shrubland. The data for the
present study were collected after plot installation
was complete but before any treatment had
Figure 3. Probability density function for daily rainfall
total on days with rain, based on the Socorro, NM (32 km
from the study site) rainfall record from 1950 to 1990.
The dashed line marks the rainfall total delivered in the
storm on day 259.
Plant Response to Spatial Variation in Soil Moisture 515

commenced. The location of each plot was ran-
domly selected, with the constraint that the plot
must contain three or more shrubs. Without this
constraint, the plots would have contained few or
no shrubs, given that the grassland matrix covers
80–90% of the vegetated area at the geographic
center of the ecotone. Therefore, our plots do not
represent the average ecotone, but instead are
centered on the boundary where shrub patches
meet the grass matrix. An additional constraint was
that the distance between plots could not result in
prohibitive cable lengths to dataloggers.
After plot selection, plot edges were trenched to a
depth of 1 m using a trencher (Ditch Witch Model
3700, Charles Machine Works, Perry OK, USA), the
trench was lined with a double layer of heavy
plastic sheeting and backfilled to prevent lateral
movement of sub-surface water into or out of the
plots. During trenching, plywood boards were used
to distribute the weight of the trencher and prevent
damage to the surface of the plot. Since the
inception of the study, all work on the plots has
been completed from transportable scaffold planks
suspended above the plots, to prevent alteration of
the soil surface and vegetation. After trenching,
galvanized sheet metal was inserted along the plot
boundary to prevent water from moving onto the
plots from the areas impacted by foot traffic around
the plots.
Soil Water Potential
To assess variations in soil water content and po-
tential with depth under the different cover types
present (grass canopy, shrub canopy, and bare soil
interspace), we made automated measurements of
soil water potential (Ws) using ceramic Heat Dissi-
pation Sensors (HDS; model 229-L, Campbell Sci-
entific, Logan Utah USA) and stainless steel screen
caged thermocouple psychrometers (TCP; model
PST-55-30, Wescor, Logan Utah USA). The HDS
sensors were measured every hour by a datalogger
(model CR10X, Campbell Scientific Logan UT
USA). The HDS sensors were individually cali-
brated under saturated and air dry conditions
(Bristow and others 1993; Reece 1996). These
sensors have limited sensitivity under very dry
conditions. We assigned a value of -7 MPa to all
HDS readings equal to or lower than that value.
The TCP sensors were individually calibrated in salt
solutions at 25�C (Brown and Bartos 1982) before
installation and, once installed, were measured
every 6 h using a datalogger (model CR7X or
CR7XL, Campbell Scientific). For this study, we
used TCP data collected daily at 0600 h, when the
near surface temperature gradients that can influ-
ence the interpretation of psychrometer data are
minimized.
Soil moisture sensors (HDS and TCP) were in-
stalled in vertical profiles under each cover type
(see below). For each vertical profile, a hand auger
was used to dig a hole 15 cm in diameter to a depth
of roughly 70 cm. Sensors were then installed in
holes parallel to the soil surface on the uphill side of
the augered hole. The HDS sensors, which are more
responsive at water potentials near zero, were in-
stalled at depths of 5 and 15 cm. Contact with
surrounding soil was established by using damp
soil, excavated from the same depth and cover type
of the plot, to completely fill the installation hole.
The TCP sensors were installed at depths of 15, 30,
45, and 60 cm, with the minimum depth deter-
mined by the sensitivity of these sensors to tem-
perature gradients in shallower soils. The sensor
head was installed in a horizontal passage, 5–10 cm
in length, drilled parallel to the soil surface into the
wall of the hole. At least 1 m of the sensor cable
was buried several cm below the sensor depth to
minimize thermal gradients caused by heat transfer
along the cable from the surface, and to eliminate
water traveling along the sensor cable from the
surface to the sensor head. HDS and TCP data from
15 cm depth were linearly related (HDS =
1.4411*TCP -0.6478, r2 = 0.86) for values greater
than -7 MPa. Under the wettest conditions, HDS
sensors were more sensitive to changes in soil wa-
ter potential whereas TCP sensors could differenti-
ate between low water potentials after HDS output
had reached a minimum.
In each plot, the vertical profiles of Ws sensors
were installed at three locations: beneath a shrub,
beneath a grass canopy, and beneath an inter-
space. In total, Ws was measured at 90 locations
across the six plots. These locations were selected
randomly, with three constraints. First, all points
had to be within the range of Ws probe cable leads
and datalogger locations. Second, locations within
1.5 m of the bottom and sides of the plots and
within 3 m of the top of the plots were excluded
to minimize the effects of trenching and eliminate
the effects of no surface water redistribution from
above the plots. Third, only particular locations,
relative to the boundary of shrub patches, were
determined to be acceptable. Only shrubs within
patches of 3 or more individuals were selected.
Only grasses within 2–5 m of the selected shrub
patch were selected for grass soil probes. Inter-
space Ws probes were located beneath the bare soil
that exists between shrub patches and the grass
matrix.
516 W. T. Pockman and E. E. Small

As described below, plant water potential and gas
exchange data were collected from three grasses
and three shrubs in each plot, located less than 2 m
from the profiles measured for soil water potential.
Some shrub roots may exist beneath grass canopies
that are 2–5 m from shrubs (for example, Breshears
and Barnes 1999). However, it is unlikely that
shrub roots exist within the top 30 cm of the soil at
these locations, given that the grass root density is
high to this depth. In the discussion, we address the
potential role of shrub roots at depths greater than
30 cm below grasses. Given this sampling design,
our data collection provides no information about
the grass matrix far removed from shrub patches or
the limited grass cover that exists beneath shrubs.
Instead, we have focused on the plants and soil at
the boundaries of shrub patches and the sur-
rounding grass matrix. Quantifying the plant–wa-
ter interactions at these locations is critical to
understand how the shrub and grass patches within
the ecotone expand or contract.
Estimating Soil Water Content
Our sensors measure Ws but not volumetric water
content (h) at the study site. However, changes in hare important for the goals of our study. Calculating
h from Ws for wet soils (Ws > 1 MPa) is not possi-
ble: the uncertainty of Ws is large (�0.2 MPa) rel-
ative to changes in h. Therefore, we do not
calculate h, but simply refer to the water retention
curve (Figure 2) to assess when the observed
changes in Ws indicate a large change in water
content.
Plant Water Potential
To assess changes in plant water status before and
after the storm, we measured plant water potential
using a Scholander pressure chamber (Turner
1987) at predawn (WPD; 1 h preceding sunrise) and
midday (WMD; solar noon ±1 h). At each sampling
time, we collected small terminal twigs (shrubs) or
stems (grasses) from three individuals in each of
the six plots. Samples were immediately placed in
small plastic bags with a damp paper towel to
minimize subsequent evaporation from leaf tissues
and were measured within 30 min of collection at
predawn and within 10 min of collection at mid-
day.
Plant Gas Exchange
Leaf level assimilation and transpiration were
measured at midday with a LI-6400 open path gas
exchange system (Li-Cor Inc, Lincoln, Nebraska,
USA), using the CO2 mixer to maintain a reference
cell CO2 concentration of 400 ppm (yielding sam-
ple concentrations near ambient), standard leaf
chamber oriented toward the sun, and chamber
temperature and relative humidity tracking ambi-
ent conditions. We measured three leaves on each
of three individuals of grass and shrub in each of
the six study plots. Leaves were harvested when
the measurement was complete and actual leaf
areas were determined after drying in the labora-
tory using a regression between leaf area and leaf
dry weight constructed using samples from the site
for shrub (y = 90.449x - 0.4036, R2 = 0.998) and
for grass (y = 110.16x + 1.0285, R2 = 0.847).
Transpiration and assimilation were recalculated
using the actual leaf area in the cuvette during the
measurement.
Statistical Analyses
Longitudinal analyses of the response of soil water
content under different cover types and the re-
sponses of gas exchange and water potential of
grasses and shrubs following the rainfall event were
performed using mixed general linear models with
repeated measures (Proc Mixed, SAS 8e, SAS
Institute, Cary NC). Specifically, we tested predawn
and midday plant water potential of B. eriopoda and
L. tridentata from 2 days before the storm through
day 15. Similarly, transpiration and assimilation
measurements from the same individuals were
compared between vegetation types throughout
the same period. Soil water potential data from
each sensor type and depth were analyzed sepa-
rately to assess the presence of differences among
cover types at each depth.
RESULTS
Soil Water Potential and Water Content
Prior to the storm on day 259, Ws was decreasing as
the soil dried following 12.5 mm of rain on day 240
(Figure 4). As expected, Ws increased following the
rain on day 259, with the magnitude and timing of
the wetting and subsequent varying by soil depth
and cover type. We calculated the change in Ws,
DW, averaged over the 15 days following the storm,
relative to the value measured on the day before
the storm. This was calculated separately for each
soil depth, cover type and sensor type using the
equation:c
DW ¼ 1
15
X
d¼1;15
Wds �Wd¼0:
Plant Response to Spatial Variation in Soil Moisture 517

We also calculated the maximum increase in Ws
over the 15 day interval relative to the pre-storm
Ws.
As expected for a wetting front propagating
downward through the soil, Ws response was larger
and occurred more quickly in surface soil than
deeper in the root zone. The maximum change in
Ws and the average Ws following the storm were
greatest at the 5 cm depth (Figures 4, 5). Both of
these changes decreased in magnitude at greater
soil depths. This pattern arose because Ws was
lowest at the surface prior to the storm and the
surface soil became wettest after the storm, with Ws
indistinguishable from 0 MPa under shrub and
grass canopy. Observed changes in Ws indicated
that nearly all of the increase in water content
occurred in the upper 15 cm of soil underneath the
shrub and, especially, the grass canopies. Smaller
increases in Ws were also observed in the upper
5 cm under the bare soil interspaces (Figure 4A,
values greater than -2 MPa). No significant re-
sponse was observed under any cover type at
depths greater than 30 cm, with the exception of
soil at 60 cm under the shrub canopy (Figure 4F).
In this location, Ws increased over the 2 days
following the storm and remained significantly
Figure 4. The response of soil water potential (Ws) to
rainfall (day 0 = day 259, vertical line). Each panel shows
Ws under grass (open circle), shrub (open square), and bare
soil interspace (filled triangle), using either heat dissipa-
tion sensors (HDS) or thermocouple psychrometers (TCP)
at depths of 5, 15, 30, 45 or 60 cm below the soil surface.
Shrub symbols are plotted slightly before and grass symbols
slightly after the actual day value to separate error bars
(±1 SE). Each data point and error bar represent the
mean of six measurements, one from each plot, made in
early morning when soil temperature gradients were
small.
Figure 5. Average change in water potential over the
15 day response period relative to the value on the day
before the storm as a measure of the integrated soil water
potential response to the day 259 storm. Data were cal-
culated as the mean of the integrated deviation of soil
water potential at each depth and under each cover type
(G grass; S shrub; I interspace) in six plots measured with
heat dissipation sensors (HDS) or thermocouple psych-
rometers (TCP). At 15 cm, HDS and TCP data are plotted
at slightly different depths to separate error bars (±1 SE).
Similarly, for each depth 9 sensor type combination,
grass data are plotted slightly above the actual depth
while shrub data are plotted slightly below the actual
depth.
518 W. T. Pockman and E. E. Small

greater than the initial Ws until day 266. The ab-
sence of a significant change in Ws at 45 cm (Fig-
ure 4E) and the slower response at 30 cm
(Figure 4D) under the shrub canopy raises the
possibility that the increase in Ws at 60 cm was
mediated by redistribution of water via the roots.
The changes in soil water potential following the
storm on day 259 also exhibited a clear spatial
pattern related to cover type. Overall, increases
were greater beneath grass canopy than shrub
canopy, whereas shrub canopy changes were
greater than beneath interspace (Figures 4, 5). The
greatest differences between cover types were ob-
served at 15 cm, in both the TCP and HDS data
(Figure 4). At this depth, the maximum change
and the average change in Ws were greatest under
grass and smallest under interspaces with shrub
canopies intermediate in their response. For
example, the maximum Ws observed was close to
zero for grass, but did not exceed -2 MPa for shrub
or -4 MPa for bare soil (Figure 4). At 30 cm, the
maximum Ws was observed beneath grass canopies,
although the differences were less than higher in
the soil column. At 5 cm, the maximum change in
Ws and the maximum Ws observed are similar for
grass and shrub canopy. However, the high Ws
values near the surface were relatively short lived
for the shrub canopies (Figure 4) so the average
changes were smaller, perhaps due to more rapid
direct evaporation from soil. Below 30 cm, all
changes were relatively small so cover type con-
trasts were negligible.
Plant Water Potential
Consistent with Ws under the two canopy types,
predawn plant water potential (WPD) was lower in
grasses than in shrubs before the storm on day 259
(Figure 6A). At the same time, midday plant water
potential (WMD) was similar for shrub and grass,
both about -5.5 MPa (Figure 6A). This value was
the same as WPD in grass and lower than WPD in
shrubs, suggesting that transpiration was only
occurring in the shrubs. Following the storm, the
magnitude of the change in WPD and the absolute
values of WPD were greater in grasses than in
shrubs. Grass WPD increased to a maximum value of
-1 MPa, a change of greater than 5 MPa relative to
the initial value. In contrast, shrub WPD only in-
creased to -2.5 MPa, a change of less than 2 MPa.
This contrast in response is consistent with the
observed changes in Ws and the different rooting
depths of grass and shrub.
The temporal pattern of the WPD response was
the same for grass and shrub (Figure 6A). Both
achieved maximum observed WPD values on the
first day after the storm. Values remained elevated
above pre-storm values at least through day 10,
only returning to pre-storm values on day 15. After
the storm, WPD for grass was higher than that for
shrubs, again consistent with the observed Ws time
series for different cover types. The WMD response
was greater for grass than shrub but the duration of
the increase is similar for the two plant types.
Values of WMD remained elevated through day 7,
returning to the pre-storm values by day 10.
Plant Gas Exchange
Prior to the storm, shrubs were transpiring at
approximately 2 mmol m-2 s-1 whereas grass
transpiration was less than 1 mmol m-2 s-1 (Fig-
ure 6B). On the day of the storm, many grass
leaves were curled and somewhat yellowed, mak-
ing it difficult to locate leaves for gas exchange
measurement; measurements of even the greenest
leaves showed very little activity. Among grasses,
Figure 6. Response of A grass and shrub water potential
at predawn (WPD) and midday (WMD) and B grass and
shrub transpiration and assimilation, to rainfall (day
0 = day 259). Gas exchange measurements were made
on day 0 before a convective storm developed in late
afternoon but were not possible in grasses because of
limited availability of suitable leaves (see text). The re-
duced number of leaves measured exhibited very low
rates of transpiration and assimilation (*).
Plant Response to Spatial Variation in Soil Moisture 519

the rapid increase in transpiration one and three
days after the storm was primarily the result of the
recovery of these curled leaves, indicating that their
condition reflected the low water potentials of the
plants rather than senescence. During the 10 day
interval when Ws and WPD were elevated relative to
pre-storm values, the transpiration rates from
grasses and shrubs were very similar, both 3–
5 mmol m-2 s-1. On the first day following the
storm, transpiration from grass was slightly less
than the maximum values observed subsequently.
Elevated transpiration, relative to the pre-storm
period, lasted through and including the sampling
on day 10, similar to that for both Ws and WPD. By
day 15, transpiration from both plant types was
back to the initial pre-storm values. Overall, the
shrub transpiration response to the storm was
smaller than for the grasses, increasing by a factor
of 2 while grass transpiration increased fivefold.
Overall, the grass assimilation response to the
rainfall event far exceeded that of the shrubs (Fig-
ure 6B). Prior to the storm, assimilation was greater
for shrubs than grass, almost 3 and about
1 lmol m-2 s-1. Over the 5 days following the
storm, grass assimilation increased day-by-day to
nearly 20 lmol m-2 s-1. Then, grass assimilation
decreased over the next 10 days to the pre-storm
value. In contrast, shrub assimilation reached its
maximum value on day 1, but the value was only
6.5 lmol m-2 s-1. Over the following 15 days,
shrub assimilation varied between this value and
that observed pre-storm. After the period with
elevated Ws and WPD, the shrub assimilation values
were again higher than for grass, as was the case
before the storm.
Transpiration increased roughly linearly with
WPD for both grasses and shrubs (Figure 7A). The
scatter around the best fit line is similar (R2 is 0.82
and 0.76 for grass and shrub, respectively,
P < 0.01 for both). The slope of the relationship is
somewhat greater for shrub than grass, 0.96 and
0.68, respectively. Assuming that we can extrapo-
late this relationship beyond the data, then we can
make two observations. First, if infiltration patterns
resulted in similar water potential in shrubs and
grasses, we would expect that peak transpiration
rates following the storm would be greater in the
shrubs than in the grasses. Second, we would ex-
pect both grasses and shrubs to cease transpiring at
WPD of roughly -6.5 MPa. Assimilation increased
linearly with WPD for grasses (Figure 7B, R2 = 0.87
and P < 0.001) whereas there was no significant
relationship between assimilation and WPD for
shrubs (P = 0.99).
DISCUSSION
Soil Moisture Dynamics FollowingPrecipitation Pulse
One of the primary goals of our study was to
determine whether the distribution of soil water
after a relatively large summer storm was uniform
or if horizontal redistribution via overland flow
yielded wetter soil beneath plant canopies. Al-
though, the data collected do not directly show the
importance of this process during the smaller
storms that occur more frequently in this system,
our results clearly show that horizontal redistribu-
tion from this large storm led to enhanced soil
water potential under plant canopies, with the
greatest increases observed beneath grass clumps
Figure 7. Grass and shrub transpiration (A) and assim-
ilation (B) expressed as a function of predawn water
potential (WPD) during the response to a single summer
storm. C shows assimilation of grasses and shrubs as a
function of stomatal conductance (gs) during the same
response period.
520 W. T. Pockman and E. E. Small

(Figures 4, 5). Infiltration increased Ws consistently
and substantially in the top 15 cm of the soil col-
umn. Even at 30 cm depth, notable changes in Ws
were only observed at some locations. The in-
creases in Ws at greater depths were less than
1 MPa, which represents a very small change in
water content given the low starting Ws and the
very low slope of the WRC at these potentials
(Figure 2). In the top 20 cm of the soil, the increase
in Ws differed dramatically between cover types.
The increase in Ws beneath grass canopies was
much greater in magnitude and duration than be-
neath shrub canopies, particularly at a depth of
approximately 15 cm. Beneath bare soil, the in-
crease in Ws was extremely limited relative to that
observed beneath either grass or shrub canopy.
This is expected given the differences in micro-
topography, soil texture, and soil structure that
exist between plant canopies and interspaces at this
field site (Bhark and Small 2003; Bedford and
Small 2008) and in similar semiarid environments
(for example, Dunkerley 2002).
The observed patch-type differences in Ws, and
therefore in the amount of water that infiltrated,
are the result of horizontal redistribution of surface
water during and soon after the storm. Our obser-
vations during the storm suggest that runoff was
generated within shrub patches and then trans-
ferred to adjacent grass covered areas, where the
soil micro-topography and grass clumps trapped the
water and it eventually infiltrated. We refer to this
process as preferential redistribution, which has
been observed in other semiarid environments (for
example, Reid and others 1999). We have observed
this same process in other storms. The water is
redistributed across the soil surface over distances
of meters and is directed primarily by the local
micro-topography. Therefore, the surface redistri-
bution is not simply unidirectional, down the rel-
atively uniform slope that exists across the study
site.
Our second goal was to compare the depth of
infiltration under grass and shrub canopies with
the rooting profiles of these functional types. The
water potential response of both grasses and shrubs
demonstrates that the lateral redistribution of sur-
face water and associated horizontal variability of
Ws affects how much water these two types of
plants were able to access following the storm. The
WPD of grasses increased to -1 MPa after the storm,
similar to the Ws measured beneath grass canopies
over the depth interval in which grass roots are
most dense. The same was observed for shrubs: the
WPD of shrubs increased to -2.5 MPa, which is
equivalent to the highest Ws observed beneath
shrubs (at 15 cm), excluding the 5 cm surface layer
where shrub roots are largely absent. A large frac-
tion of the shrub roots were below the wetting
front observed during the storm. However, shrub
plant water potentials did not reflect the more
negative Ws observed in the lower portion of the
shrub’s root zone during the 15 day post-storm
period. This result suggests that the water poten-
tials of both grasses and shrubs are tightly tied to
the water potential of the soil beneath each cover
type, given the spatial distribution of plants at the
ecotone. We expect that this result would not be as
straightforward if the two plant types were inter-
mingled or congregated in patches that are small
relative to the length scale of lateral root spreading.
Our results do not show that shrubs never extract
soil water from beneath grass canopies, or vice
versa, but that the plants are responding most
strongly to Ws beneath their own canopy type.
Our finding that soil wetting from a large rainfall
event was restricted to the top 30 cm of soil is
consistent with the results of previous studies in
adjacent grassland and shrubland ecosystem at
Sevilleta (Kurc and Small 2004, 2007). Across the
transition from shrubland to grassland, soil depth
increases somewhat, however, we are not able to
assess the effect of this change based on our data
from a single storm at one point along the transi-
tion. Under extremely wet conditions, for example
a series of large storms, we might expect soil wet-
ting at our study site to extend to greater depth but
without additional data any estimate of the in-
crease in shrub response associated with this rare
phenomena would be purely speculative.
Our third goal was to link the observed patterns
of infiltration and plant water status to the tran-
spiration and assimilation following the summer
storm. The transpiration data show that the lateral
redistribution of surface water and the resulting
horizontal variability of Ws played a fundamental
role in controlling how the shrubs and grasses were
able to use water following the storm. Consistent
with the patterns observed in previous studies
(Davis and Mooney 1985; Bassirirad and others
1999), the shrubs were transpiring before the
rainfall event, and continued to transpire once WPD
and Ws values returned to pre-storm values on day
15. In contrast, measurable grass transpiration only
occurred during the period with elevated WPD and
Ws. During the period when WPD and Ws were
higher than the pre and post-storm values, grass
and shrub transpiration were equal on a per leaf
area basis. The transpiration rates were equal be-
cause of the preferential redistribution of surface
water to grass canopies, which yielded higher Ws
Plant Response to Spatial Variation in Soil Moisture 521

beneath grass canopies and higher grass water po-
tential. If the Ws and WPD of grasses only increased
to the values observed in the shrub patches, it is
likely that grass transpiration would have been
lower than shrub transpiration (Figure 7). This is
demonstrated by the conditions observed on day
10: Ws and WPD of grasses and shrubs were very
similar and grass transpiration was significantly
less.
The grass assimilation response to the rainfall
event was more rapid and dramatic than the shrub
response. Integrated throughout the post-storm
period, the grasses fixed 2.5 times as much carbon as
the shrubs, on a per leaf area basis. The grass–shrub
difference was greatest 5 days after the storm, when
grass assimilation was higher by a factor of five, a
response similar to that observed under similar
conditions in Hilaria jamesii in the Great Basin
(Schwinning and others 2002). The assimilation by
grasses was higher than that by shrubs for two
reasons. First, as expected for C4 grasses, assimila-
tion was faster at a given WPD, at least for WPD
greater than -3 MPa (Figure 7). Second, the pref-
erential surface water redistribution to grass patches
was critical. The extra water that infiltrated beneath
grass canopies lead to higher values of Ws and WPD,
which in turn allowed for more rapid assimilation
by grasses. If grass Ws and WPD had only increased to
the values observed in shrub patches (-2.5 MPa),
then the total assimilation by grasses during the
post-storm interval would have been roughly half
of that measured, based on the observed relation-
ship between grass assimilation and WPD. Therefore,
in the absence of surface water redistribution, the
assimilation by grasses would have been equal to or
only slightly higher than the assimilation by shrubs.
The assimilation response of the shrubs was
surprising in that it increased slightly in the first
few days after rainfall but showed no clear pattern
even though such a pattern was evident in mea-
surements of both water potential and transpira-
tion (Figure 7). This pattern suggests that the
assimilation response was not limited simply by
stomatal responses but by other factors that are
most likely related to the state of the photosyn-
thetic biochemistry in leaves. This phenomenon
has been observed previously for L. tridentata in
southern New Mexico where it appeared to be a
function of the rainfall history preceding the actual
rainfall event after which gas exchange was mea-
sured (Yan and others 2000).
Overall, surface water redistribution and the
resulting horizontal heterogeneities in Ws played a
critical role in controlling the differences in how
grasses and shrubs used water and fixed carbon
following the storm studied here. Our results do
not prove that this process is important at other
locations and for all storm sizes. However, our
findings suggest that manipulative experiments
intended to understand ecosystem responses to
precipitation regime that utilize designs that do not
allow for horizontal redistribution may not yield
meaningful conclusions (Weltzin and others 2003).
Next, we consider how our results relate to the
different conceptual models used to describe the
interactions between woody and herbaceous
plants. We also discuss how the importance of
surface water redistribution on grass–shrub inter-
actions may vary across climate and locations.
Models of Herbaceous–Woody PlantInteractions
The Walter two-layer model does not describe the
key processes and herbaceous–woody plant inter-
actions that were observed following the summer
rain event at the Sevilleta grass–shrub ecotone.
Although shrub roots were deeper than grass roots,
this did not give the shrubs sole access to any
portion of the rainfall that infiltrated during the
storm because the wetting front did not propagate
below the root zone of grasses. The rain event
studied here was larger than 90% of the storms that
occur at the study site during the monsoon season
(Figure 3). Therefore, our results demonstrate that
the infiltration associated with nearly all summer
storms will not wet the soil below the grass root
zone. The wetting front may only propagate below
the deepest grass roots following the largest storms,
or after a series of storms in rapid succession.
Shrubs are therefore even less likely to experience
high water potential throughout their rooting
profile as the result of summer storms, probably the
reason that they have been shown to be more
responsive to winter precipitation (Reynolds and
others 1999). The spatial arrangement of woody
and herbaceous plants at the ecotone also makes it
difficult to consider the observed plant–water
interactions within the framework of the Walter
model. The shrubs are restricted to distinct patches.
Many of the grasses are located far enough from
these patches that it is unlikely that shrub roots
exist beneath the grass canopies. Although Brisson
and Reynolds (1994) found roots of L. tridentata
occupied soil under bare soil patches, their mea-
surements, in a monodominant shrubland in
southern New Mexico USA, showed gaps and
lower root density where separation between
shrubs was greatest. On the shrubland side of the
ecotone within 1 km of the study site at Sevilleta,
522 W. T. Pockman and E. E. Small

root density is around 10 times lower between
shrub canopies than beneath them (Kurc and Small
2004, Figure 3). Therefore, it is unlikely that shrub
roots extend farther from the shrubs in the eco-
tone.
A conceptual model that explicitly represents the
horizontal arrangement of different plant types
(Breshears and Barnes 1999; Loik and others 2004)
and the lateral redistribution of surface water is
necessary to describe how the grasses and shrubs
responded differently to the rain event studied
here. The magnitude of surface water redistribution
and the impact of water redistribution on different
plant types should depend on four key factors.
First, the spatial distribution of grasses and shrubs is
critical. If two species are completely intermixed,
then redistribution of surface water would not yield
an advantage to either plant type. If woody and
herbaceous plants are segregated, details of the
spatial pattern will control the impact of surface
water redistribution. At the Sevilleta ecotone, we
expect that shrub patches equal in size or smaller
than those studied here lose water to adjacent
grasses, with grasses on the periphery of patches
potentially benefiting more than those in the patch
interior. In contrast, in larger shrub patches, the
surface water redistribution and infiltration pro-
cesses will more closely match those observed in
the end-member shrubland ecosystem: overland
flow from interspaces to canopies yields relatively
deep infiltration beneath shrubs (Bhark and Small
2003). As the size of a shrub patch grows, a greater
fraction of shrubs occupy positions in the landscape
where they can receive run-on from upslope in-
terspaces. In environments where vegetation is
arranged in bands, surface water redistribution
from bare soil to the bands will favor grasses when
these species preferentially grow on the uphill side
of the band (for example, Montana and others
1995).
Second, the characteristics of a rainfall event will
control the amount of surface water redistribution,
and therefore the effects of this process on shrub–
grass interactions. In the Sevilleta grassland and
shrubland, surface water redistribution and focused
infiltration beneath plant canopies grows in
intensity as rainfall event size increases (Bhark and
Small, 2003). We expect the same would be true at
the ecotone. Because the storm studied here was
large, the contrasts in grass and shrub Ws and plant
responses described here may be greater than typ-
ically occurs at this site. High storm intensity also
increases runoff, and should therefore have a sim-
ilar effect on redistribution as storm size. Given
these hypothesized controls of storm size and
intensity, the climate at a site should impact the
importance of surface water redistribution on
shrub–grass interactions. Likewise, shifts in climate
that alter size distribution of rainfall events have
the potential to significantly alter the amount of
water available to grasses and shrubs. A seasonal
bias in these shifts may also favor one functional
type over the other.
Third, other physical attributes of a site that
influence surface water redistribution and infiltra-
tion patterns will also be critical. For example, the
relationship between microtopography, soil prop-
erties, and hillslope geometry controls surface wa-
ter redistribution in semiarid environments (Dunne
and others 1991; Dunkerley 2002). For example,
surface water redistribution will be less important
where coarse soils yield high infiltration rates.
Fourth, the season during which a rainfall event
occurs should control how important surface water
redistribution and heterogeneous infiltration is for
the differential response of woody and herbaceous
plants. In many semiarid environments, rainfall
intensities are lower during the winter months,
which would tend to limit overland flow. The ex-
treme of this scenario would occur at sites, such as
the Great Basin, where a large portion of annual
precipitation is in the form of snow that melts
slowly and infiltrates more evenly. However, such
systems are often characterized by C3 grasses that
utilize soil water during the spring and reproduce
before the stored water is exhausted. In systems
where winter precipitation is less, we expect that
this effect is negligible when compared to the
overriding controls of plant phenology. The domi-
nant grass at the Sevilleta ecotone (B. eriopoda) is
only active during the warmest months of the year.
Therefore, the grasses would not be able to capi-
talize on any preferential redistribution and infil-
tration that occurs during the winter months
(Schwinning and Ehleringer 2001). Although some
water may remain deep in the soil profile until the
grasses become active in July, we expect a large
fraction to be lost through evaporation during the
hot and dry spring.
The results described here have the following
implications for shrub invasion, for environments
similar to the grass–shrub ecotone at the Sevilleta.
Preferential surface water redistribution to grass
canopies and the resulting enhanced grass Ws, WPD
and assimilation should slow the rate at which
shrub patches expand at the ecotone. The extra
water available to grasses at the margins of shrub
patches should help maintain grass biomass. Given
the horizontal redistribution of resources to grasses,
the shrub patches may only expand under extreme
Plant Response to Spatial Variation in Soil Moisture 523

conditions such as multi-year drought, when the
drought tolerance of shrubs and their potential to
use water at any time during the year is critical.
Above, we proposed that the importance of pref-
erential transfer of water to grasses may diminish as
the size of shrub patches increase and therefore this
process may only slow expansion of shrub patches
when they are small. The soil textural changes that
accompany the development of large inter-spaces
would only serve to reinforce the redistribution of
water to shrub canopies.
ACKNOWLEDGMENTS
We thank E. Bhark, S. Kurc, J. Balulis, J. Elliott, O.
Hopkins, E. Posdamer, D. McGhee, and T. Wellman
for their extraordinary efforts in plot construction,
sensor installation and field measurements. S. A.
White processed the overhead photos to obtain the
images in Figure 1. D. G. Williams and M. Loik
provided valuable input on an earlier draft. We
thank the staff of the Sevilleta NWR and LTER. This
study was funded through awards from SAHRA, an
NSF Science and Technology Center at the Uni-
versity of Arizona, the Sevilleta LTER (NSF DEB-
0080529), USDA-NRICGP (98-35100-7025 to
WTP), and the Biological and Environmental Re-
search (BER) Program, U.S. Department of Energy,
through the Southcentral Regional Center of NI-
GEC (to WTP & EES) and the Western Regional
Center of National Institute for Climatic Change
Research (to WTP, EES and Scott Collins).
REFERENCES
Abrahams AD, Parsons AJ, Wainwright J. 1995. Effects of veg-
etation change on interrill runoff and erosion, walnut gulch,
southern Arizona. Geomorphology 13:37–48.
Archer S. 1994. Woody plant encroachment into southwestern
grasslands and savannas: rates, patterns and proximate causes.
In: Vavra M, Laycock WA, Pieper RD, Eds. Ecological impli-
cations of livestock herbivory in the west. Denver, CO: Society
For Range Management. p 13–68.
Archer S, Schimel DS, Holland EA. 1995. Mechanisms of
shrubland expansion: land use, climate or CO2? Clim Change
29:91–9.
Bahre CJ, Shelton MJ. 1993. Historic vegetation change, mes-
quite increases, and climate in southeastern Arizona. J Bio-
geogr 20:489–504.
Bassirirad H, Tremmel DC, Virginia RA, Reynolds JF, DeSoyza
AG, Brunell MH. 1999. Short-term patterns in water and
nitrogen acquisition by two desert shrubs following a simu-
lated summer rain. Plant Ecol 145:27–36.
Bedford DR, Small EE. 2008. Spatial patterns of ecohydrologic
properties on a hillslope-alluvial fan transect, vol. 73, no. 1,
central New Mexico: Catena. pp 34–48.
Bhark EW. 2002. Water availability to vegetation across a
semiarid shrubland and grassland ecotone, Sevilleta Wildlife
Refuge, Neew Mexico. Master’s Thesis. New Mexico Tech,
Socorro, NM.
Bhark EW, Small EE. 2003. Association between plant canopies
and the spatial patterns of infiltration in shrubland and
grassland of the Chihuahuan Desert, New Mexico. Ecosystems
6:185–96.
Breshears D, Barnes F. 1999. Interrelationships between plant
functional types and soil moisture heterogeneity for semiarid
landscapes within the grassland/forest continuum: a unified
conceptual model. Landsc Ecol 14:465–78.
Brisson J, Reynolds JF. 1994. The effect of neighbors on root
distribution in a creosotebush (Larrea tridentata) population.
Ecology 75:1693–702.
Bristow KL, Campbell GS, Calissendorff K. 1993. A test of a heat-
pulse probe for measuring changes in soil water content. Soil
Sci Soc Am J 57:930–8.
Brown R, Bartos D. 1982. A calibration model for screen-caged
peltier thermocouple psychrometers. Usda Forest Service,
Ogden, Ut, Int-293.
Buffington LC, Herbel CH. 1965. Vegetational changes on a
semidesert grassland range from 1858–1963. Ecol Monogr
35:135–64.
Davis SD, Mooney HA. 1985. Comparative water relations of
adjacent California shrub and grassland communities. Oeco-
logia 66:522–9.
Dunkerley D. 2002. Infiltration rates and soil moisture in a gro-
ved mulga community near Alice Springs, arid central Aus-
tralia: evidence for complex internal rainwater redistribution
in a runoff-runon landscape. J Arid Environ 51:199–219.
Dunne J, Dennis A, Bartolome JW, Barrett RH. 1991. Chaparral
response to a prescribed fire in the Mount Hamilton Range,
Santa Clara County, California. Madrono 38:21–9.
Ehleringer JR, Phillips SL, Schuster WSF, Sandquist DR. 1991.
Differential utilization of summer rains by desert plants.
Oecologia 88:430–4.
Gibbens RP, McNeely RP, Havstad KM, Beck RF, Nolen B. 2005.
Vegetation changes in the Jornada Basin from 1858 to 1998. J
Arid Environ 61:651–68.
Gill RA, Burke IC. 1999. Ecosystem consequences of plant life
form changes at three sites in the semiarid United States.
Oecologia 121:551–63.
Hamerlynck EP, Huxman TE, Loik ME, Smith SD. 2000. Effects
of extreme high temperature, drought and elevated CO2 on
photosynthesis of the Mojave Desert evergreen shrub, Larrea
tridentata. Plant Ecol 148:183–93.
Houghton R, Hackler J, Lawrence K. 1999. The US carbon
budget: contributions from land-use change. Science
285:574–8.
Huxman TE, Tissue D, Snyder K, Leffler J, Ogle K, Pockman WT,
Sandquist DR, Williams DG. 2004. Precipitation pulses and
carbon dynamics in semi-arid and arid ecosystems. Oecologia
141:254–68.
Huxman TE, Wilcox BP, Scott R, Snyder K, Breshears D, Small
EE, Hultine KH, Pockman WT, Jackson RB. 2005. Woody
plant encroachment and the water cycle: an ecohydrological
framework. Ecology 86:308–19.
Jackson RB, Banner JL, Jobbagy EG, Pockman WT, Wall DH.
2002. Ecosystem carbon loss with woody plant invasion of
grasslands. Nature 418:623–6.
Kieft TL, White CS, Loftin SR, Aguilar R, Craig JA, Skaar DA.
1998. Temporal dynamics in soil carbon and nitrogen re-
sources at a grassland–shrubland ecotone. Ecology 79:671–83.
524 W. T. Pockman and E. E. Small

Kurc SA, Small EE. 2004. Dynamics of evapotranspiration in
semiarid grassland and shrubland ecosystems during the
summer monsoon season, central New Mexico. Water Resour
Res 40:W09305.
Kurc SA, Small EE. 2007. Soil moisture variations and ecosys-
tem-scale fluxes of water and carbon in semiarid grassland
and shrubland. Water Resour Res 43:W06416. doi:10.1029/
2006WR005011.
Loik ME, Breshears DD, Lauenroth WK, Belnap J. 2004. A
multi-scale perspective of water pulses in dryland ecosystems:
climatology and ecohydrology of the western USA. Oecologia
141:269–81.
Ludwig J, Eager R, Bastin G, Chewings V, Liedloff A. 2002. A
leakiness index for assessing landscape function using remote
sensing. Landsc Ecol 17:157–71.
Montana C, Cavagnaro B, Briones O. 1995. Soil-water use by
coexisting shrubs and grasses in the southern Chihuahuan
Desert; Mexico. J Arid Environ 31:1–13.
Morgan JA, LeCain DR, Mosier AR, Milchunas DG. 2001. Ele-
vated CO2 enhances water relations and productivity and
affects gas exchange in C-3 and C-4 grasses of the Colorado
shortgrass steppe. Glob Chang Biol 7:451–66.
Neilson RP. 1986. High-resolution climatic analysis and south-
west biogeography. Science 232:27–34.
Odening WR, Strain BR, Oechel WC. 1974. The effect of
decreasing water potential on net CO2 exchange of intact
desert shrubs. Ecology 55:1086–95.
Ogle K, Reynolds JF. 2002. Desert dogma revisited: coupling of
stomatal conductance and photosynthesis in the desert shrub,
Larrea tridentata. Plant Cell Environ 25:909–21.
Ogle K, Reynolds JF. 2004. Plant responses to precipitation in
desert ecosystems: integrating functional types, pulses,
thresholds and delays. Oecologia 141:282–94.
Pacala SW, Hurtt GC, Baker D, Peylin P, Houghton RA, Birdsey
RA, Heath L, Sundquist ET, Stallard RF, Ciais P, Moorcroft P,
Caspersen JP, Shevliakova E, Moore B, Kohlmaier G, Holland
E, Gloor M, Harmon ME, Fan SM, Sarmiento JL, Goodale CL,
Schimel D, Field CB. 2001. Consistent land- and atmosphere-
based us carbon sink estimates. Science 292:2316–20.
Pelaez DV, Distel RA, Boo RM, Elia OR, Mayor MD. 1994. Water
relations between shrubs and grasses in semiarid Argentina. J
Arid Environ 27:71–8.
Peters DPC. 2002. Plant species dominance at a grassland–
shrubland ecotone: an individual-based gap dynamics model
of herbaceous and woody species. Ecol Modell 152:5–32.
Peters DPC, Small EE, Gosz J, Parmenter RR, Collins SL, Pock-
man WT. 2006a. Biotic transitions at multiple scales: merging
patch dynamics with ecotones. Landsc Ecol 21:19–33.
Peters DPC, Yao J, Gosz JR. 2006b. Woody plant invasion at a
semin-arid/arid transition zone: importance of ecosystem type
to colonization and patch expansion. J Veg Sci 17(3):389–96.
Peters DPC, Mariotto I, Havstad KM, Murray LW. 2006c. Spatial
variation in remnant grasses after a grassland-to-shrubland
state change: implications for restoration. Rangel Ecol Manage
59(4):343–50.
Reece CF. 1996. Evaluation of line heat dissipation sensor for
measuring soil matric potential. Soil Sci Soc Am 60:1022–8.
Reid K, Wilcox B, Breshears D, Macdonald L. 1999. Runoff and
erosion in a pinon-juniper woodland: influence of vegetation
patches. Soil Sci Soc Am J 63:1869–79.
Reynolds JF, Virginia RA, Kemp PR, de Soyza AG, Tremmel DC.
1999. Impact of drought on desert shrubs: effects of season-
ality and degree of resource island development. Ecol Monogr
69:69–106.
Reynolds JF, Kemp PR, Ogle K, Fernandez RJ. 2004. Modifying
the ‘pulse-reserve’ paradigm for deserts of North America:
precipitation pulses, soil water and plant responses. Oecologia
141:194–210.
Sala OE, Lauenroth WK, Parton WJ. 1992. Long-term soil–water
dynamics in the shortgrass steppe. Ecology 73:1175–81.
Schenk HJ, Jackson RB. 2002. The global biogeography of roots.
Ecol Monogr 72:311–28.
Schlesinger WH, Reynolds JF, Cunningham GL, Huenneke LF,
Jarrell WM, Virginia RA, Whitford WG. 1990. Biological
feedbacks in global desertification. Science 247:1043–8.
Schlesinger WH, Raikes JA, Hartley AE, Cross AE. 1996. On the
spatial pattern of soil nutrients in desert ecosystems. Ecology
77:364–74.
Schlesinger WH, Ward TJ, Anderson J. 2000. Nutrient losses in
runoff from grassland and shrubland habitats in Southern
New Mexico: I. Field plots. Biogeochemistry 49:69–86.
Schwinning S, Ehleringer JR. 2001. Water use trade-offs and
optimal adaptations to pulse-driven arid ecosystems. J Ecol
89:464–80.
Schwinning S, Davis K, Richardson L, Ehleringer JR. 2002.
Deuterium enriched irrigation indicates different forms of rain
use in shrub/grass species of the Colorado plateau. Oecologia
130:345–55.
Soriano A, Sala O. 1984. Ecological strategies in a Patagonian
arid steppe. Vegetatio 56:9–15.
Turner NC. 1987. The use of the pressure chamber in studies of
plant water status. International conference on measurement
of soil and plant water status, Logan, Utah, vol. 2, pp 13–24.
Van Vegten JA. 1983. Thornbush invasion in a savanna eco-
system in eastern Botswana. Vegetatio 56:3–7.
Walter H. 1971. Ecology of tropical and subtropical vegetation.
Edinburgh: Oliver & Boyd.
Walter H. 1973. Vegetation of Earth. Heidelberg: Springer-Verlag.
Weltzin JF, Loik ME, Schwinning W, Williams DG, Fay PA,
Haddad BM, Harte J, Huxman TE, Knapp AK, Lin G, Pockman
WT, Shaw MR, Small EE, Smith MD, Smith SD, Tissue DT, Zak
JC. 2003. Assessing the response of terrestrial systems to po-
tential changes in precipitation. Bioscience 53:941–52.
Wilcox B. 2002. Shrub control and streamflow on rangelands: a
process based viewpoint. J Range Manage 55:318–26.
Yan SG, Wan CG, Sosebee RE, Wester DB, Fish EB, Zartman RE.
2000. Responses of photosynthesis and water relations to
rainfall in the desert shrub creosote bush (Larrea tridentata) as
influenced by municipal biosolids. J Arid Environ 46:397–412.
Plant Response to Spatial Variation in Soil Moisture 525