the influence of reaction media on cdin2s4 and znin2s4
TRANSCRIPT

CrystEngComm
PAPER
Cite this: CrystEngComm, 2015, 17,
8492
Received 21st July 2015,Accepted 5th October 2015
DOI: 10.1039/c5ce01432h
www.rsc.org/crystengcomm
The influence of reaction media on CdIn2S4 andZnIn2S4 nanocrystallite formation and growth ofmesocrystal structures†
M. V. Carević,a M. I. Čomor,*a M. N. Mitrić,a T. S. Barudžija,a S. P. Ahrenkielb
and N. D. Abazović*a
A hot-injection method for the synthesis of CdIn2S4 in three different compositions of organic media/sol-
vents was studied. Nanosized CdIn2S4 is successfully synthesized in an oleic acid/oleylamine mixture of
complexing/capping agents. The obtained mesocrystals of 20–30 nm in diameter are self-organized in
marigold-like structures. The estimated band-gap of synthesized semiconductor is in the visible spectral
region and has a value of about 2.1 eV. The potential of the band edges is calculated using an empirical
equation. The as-prepared material was successfully transferred from organic to aqueous media by using
2-mercaptoethanol in a surface ligand exchange process. Using a similar synthetic procedure, ZnIn2S4synthesis was performed. The obtained materials were characterized using UV/vis spectroscopy, XRD and
TEM. Formation and growth mechanisms of the synthesized materials are proposed.
Introduction
It is well known that binary II–VI metal sulfides (CdS, ZnS)are unstable during photocatalytic processes and easilyundergo photocorrosion under the influence of photo-generated holes. Efforts have been made in order to stabilizethese materials, mostly by the incorporation of metal sulfidesinto their interlayers, but although this step stabilizes thephotocatalyst, its photocatalytic efficiency is reduced.1 As areplacement, ternary metal sulfides can be considered sincethey have narrow band gaps and strong absorption in the visi-ble spectral region.2 Beside their possible application asphotocatalysts in degradation processes of various pollutants,these properties make this class of materials suitable forapplication in photoproduction of H2 from water and H2S.Two semiconductors from this II–III2–VI4 family that are espe-cially interesting are CdIn2S4 (CIS) and ZnIn2S4 (ZIS). CIS hasa direct band gap of 2.1–2.2 eV (about 560 nm) meaning thatit has strong absorption in the visible part of the spectrum. Itusually crystallizes in a cubic spinel structure which belongsto the Fd3m space group. In contrast, bulk ZIS has an indirect
band-gap, with reported energy values from 2.1 to 1.8 eV (590to 690 nm) which makes it a very suitable material for solarenergy conversion applications. It has three polymorphs:rhombohedral, cubic and hexagonal, wherein the hexagonalform (space group P63mc) is the most common one.
Both materials are typically synthesized via asolvothermal/hydrothermal route2–8 but a few groups haveused different approaches: a hot-wall epitaxy method,9 amicrowave-solvothermal approach10,11 and ultrasonic spraypyrolysis (USP).12 Interestingly, there are very few articles13–16
where a hot-injection approach is used for the synthesis ofthese materials. The hot-injection method has been widelyused in synthesis of II–VI semiconductors since the first arti-cle of Murray et al.17 where the authors presented a new wayto synthesize highly crystalline CdE (E = S, Se, Te) nano-particles. In the huge number of articles that followed thatdeal with the hot-injection method, it has been shown thatthis route of synthesis provides not just control over sizesand shapes, but also over the crystallinity and crystal phaseof the obtained particles. The only “catch” is choosing theappropriate combination of ion precursors and surfactants/organic solvents, since temperature/time frame is not theonly factor that can influence the reaction rates and sizes ofobtained nanoparticles. This approach was our method ofchoice for the synthesis of CIS and ZIS as a continuation ofour previously published results.18,19
In this paper, we have studied the influence of differentorganic reaction media on the crystallinity and crystal phaseof the obtained materials. The importance of this depen-dence, as Bhirud et al.5 proposed, is crucial for the
8492 | CrystEngComm, 2015, 17, 8492–8499 This journal is © The Royal Society of Chemistry 2015
a Vinča Institute of Nuclear Sciences, University of Belgrade, P.O. Box 522,
Belgrade, Serbia. E-mail: [email protected], [email protected] South Dakota School of Mines and Technology, 501 E. Saint Joseph Street,
Rapid City, SD 57701, USA
† Electronic supplementary information (ESI) available: Table S1. Molarities ofprecursor solutions; XRD patterns of synthesized samples together with corre-sponding JCPDS cards and relative intensities of related diffraction peaks; Taucplots of samples C2; additional TEM images of sample C3 (CdIn2S4) before andafter surface ligand exchange. See DOI: 10.1039/c5ce01432h
Ope
n A
cces
s A
rtic
le. P
ublis
hed
on 0
5 O
ctob
er 2
015.
Dow
nloa
ded
on 1
2/10
/202
1 9:
59:1
8 PM
. T
his
artic
le is
lice
nsed
und
er a
Cre
ativ
e C
omm
ons
Attr
ibut
ion-
Non
Com
mer
cial
3.0
Unp
orte
d L
icen
ce.
View Article OnlineView Journal | View Issue
CrystEngComm, 2015, 17, 8492–8499 | 8493This journal is © The Royal Society of Chemistry 2015
application of these materials. Photocatalytic activity of CISparticles highly depends on their crystallinities rather thanon particle sizes or surface areas, since a lack of defect sitespromotes separation and migration of photogenerated car-riers towards their surfaces. We tried to show that by propercombination of organic surfactants, it is possible to obtainhighly crystalline samples. For most applications, aqueousmedia is required, so here we also proposed an easy way totransfer the obtained samples from organic media to water,by using 2-mercaptoethanol as a capping agent.
ExperimentalMaterials
All chemicals were of analytical grade (highest available) andwere used without further purification. All precursor solu-tions were freshly prepared before synthesis.
Cadmium acetate dihydrate (CdIJAc)2), zinc acetate (ZnIJAc)2),indium acetate (InIJAc)3), oleic acid (OA, C17H33COOH),1-octadecene (ODE, C18H36), oleylamine (OLAM, C18H35NH2)and 2-mercaptoethanol (2ME, HS–C2H4–OH) were purchasedfrom Sigma-Aldrich. Sulfur powder was obtained from AlfaAesar. Toluene and acetone were purchased from JT Baker.
Sample C1
Cadmium – Cd1. CdIJAc)2 (0.1 mmol; 0.0266 g), OA (0.2mmol; 0.0632 ml) and ODE (2 ml) were loaded in a three-neck flask and heated at 200 °C under a constant Ar flow.After about 30 min, a brown solution was formed, and wasleft at room temperature to cool down.
Indium – In1. InIJAc)3 (0.2 mmol; 0.0584 g), OA (0.6 mmol;0.189 ml) and ODE (2 ml) were loaded in a three-neck flaskand heated at 270 °C under a constant Ar flow. After about30 min, a pale yellow solution was formed.
Sulfur – S1. Sulfur powder (0.4 mmol; 0.0128 g) and ODE(2 ml) were loaded in a three-neck flask and heated at 90 °Cunder a constant Ar flow. After about 30 min the solutionwas left at room temperature to cool down.
Sample C2
Cadmium – Cd2. CdIJAc)2 (0.0667 mmol; 0.0177 g) and OA(2 ml) were loaded in a three-neck flask and heated at 200 °Cunder a constant Ar flow. After about 30 min, a brown solu-tion was formed, and was left at room temperature to cooldown.
Indium – In2. InIJAc)3 (0.2 mmol; 0.0584 g) and OA (2 ml)were loaded in a three-neck flask and heated at 270 °C undera constant Ar flow. After about 30 min, a pale yellow solutionwas formed.
Sulfur – S2. Sulfur powder (0.4 mmol; 0.0128 g) and OA(2 ml) were loaded in a three-neck flask and heated at 90 °Cunder a constant Ar flow. After about 30 min the solutionwas left at room temperature to cool down.
Sample C3
Cadmium – Cd2. CdIJAc)2 (0.0667 mmol; 0.0177 g) and OA(2 ml) were loaded in a three-neck flask and heated at 200 °Cunder a constant Ar flow. After about 30 min, a brown solu-tion was formed, and was left at room temperature to cooldown.
Indium – In2. InIJAc)3 (0.2 mmol; 0.0584 g) and OA (2 ml)were loaded in a three-neck flask and heated at 270 °C undera constant Ar flow. After about 30 min, a pale yellow solutionwas formed.
Sulfur – S3. Sulfur powder (0.4 mmol; 0.0128 g) and OLAM(1 ml) were loaded in a three-neck flask and heated at 90 °Cunder a constant Ar flow. After about 30 min the solutionwas left at room temperature to cool down.
Sample Z1
Zinc – Zn1. ZnIJAc)2 (0.1 mmol; 0.0219 g) and OA (2 ml)were loaded in a three-neck flask and heated at 200 °C undera constant Ar flow. After about 30 min, the obtained solutionwas left at room temperature to cool down.
Indium – In2. InIJAc)3 (0.2 mmol; 0.0584 g) and OA (2 ml)were loaded in a three-neck flask and heated at 270 °C undera constant Ar flow. After about 30 min, a pale yellow solutionwas formed.
Sulfur – S4. Sulfur powder (0.4 mmol, 0.0128 g) and OLAM(2 ml) were loaded in a three-neck flask and heated at 90 °Cunder a constant Ar flow. After about 30 min the solutionwas left at room temperature to cool down.
(Molarities of all precursor solutions are given in Table S1in ESI.†)
General procedure for synthesis
In a typical synthesis, separate precursor solutions of Cd/Zn,In, and S were prepared in a convenient organic solvent,under a constant Ar flow. Then, at 270 °C, the Cd/Zn and S solu-tions were swiftly injected into the In solution, and the reac-tion mixture was kept at that temperature for a fixed time.Exact combinations of precursors and reaction times arepresented in Table 1. After synthesis, the mixtures were leftto cool down to room temperature, and then the obtainedprecipitates were washed three times with a toluene–acetonemixture (3/1, v/v) in order to discard excess organic mole-cules. Finally, the obtained nanocrystals were either re-dispersed in toluene (for TEM and optical measurements) ordried at 60 °C for XRD measurements.
Table 1 Assigning of samples according to precursor combination andreaction time
Sample Precursor combination Reaction time
C1 Cd1 + In1 + S1 4 hC2 Cd2 + In2 + S2 4 hC3 Cd2 + In2 + S3 1 hZ1 Zn1 + In2 + S4 30 min
CrystEngComm Paper
Ope
n A
cces
s A
rtic
le. P
ublis
hed
on 0
5 O
ctob
er 2
015.
Dow
nloa
ded
on 1
2/10
/202
1 9:
59:1
8 PM
. T
his
artic
le is
lice
nsed
und
er a
Cre
ativ
e C
omm
ons
Attr
ibut
ion-
Non
Com
mer
cial
3.0
Unp
orte
d L
icen
ce.
View Article Online

8494 | CrystEngComm, 2015, 17, 8492–8499 This journal is © The Royal Society of Chemistry 2015
Organic to aqueous phase transfer of C3
4 ml of CIS–toluene dispersion was dried under Ar flow.Then, 4 ml of a 1 M aqueous solution of 2-mercaptoethanol(pH = 8–9) was added to this dried sample. After slight shak-ing, nanoparticles were dispersed in water and used for opti-cal and TEM measurements. This dispersion was stable formonths (no precipitation or degradation).
XRD. XRD patterns were recorded using a Philips PW 1050powder diffractometer with Ni filtered CuKα radiation (λ =1.5418 Å) and a scintillation detector. Diffraction data werecollected with a step of 0.05° and 6 s counting time per step.
TEM. TEM (JEOL JEM-2100 LaB6) samples were preparedby dipping a carbon-coated copper grid into toluene or waterdispersions and the grids with the nanocrystals were dried inair. The acceleration voltage used was 200 kV.
Optical measurements. UV–vis absorption spectra wereobtained using an Evolution 600 UV/vis spectrophotometer(Thermo Scientific). Samples were prepared by simple re-dispersion of the obtained materials into toluene or water.
Results and discussionCdIn2S4
Typically, in hot-injection synthesis of II–VI semiconductors,a TOP/TOPO combination of solvent/capping agents is used.Both molecules contain a phosphorus ion, and because ofthis fact, their usage and later disposal could be consideredas extremely harmful to the environment. As the method hasdeveloped through the years, hydrocarbon molecules withsome other functional groups (amino, carboxyl, etc.) havebeen used instead, in order to control the reaction courseand growth of the particles, as these molecules are regardedas a lesser threat to humans and the environment. Lately, allthese considerations went one step further, and utilization of1-octadecene or paraffin (both are hydrocarbon chains with-out any functional groups) as solvent/reaction media, mean-ing the reaction occurred primarily in the organic phase, tookplace. Such a method was firstly introduced by Yu et al.,20 forsynthesis of CdS.
Guided by this “greener” approach, we also have tried tosynthesize CIS in conditions where oleic acid is used only instoichiometric amounts, i.e. only as a complexation agent forcations, while ODE was used as both a solvent for elementalsulfur and an overall reaction medium. The X-raydiffractogram of a sample (C1) synthesized in this way ispresented in Fig. 1 (and Fig. S1 in ESI†). However, as can beseen in Fig. 1, all the major diffraction peaks originate fromhexagonal CdS (JCPDS card No. 75-1545). However, morecareful consideration of the diffraction pattern reveals thepresence of cubic CdIn2S4 (JCPDS card No. 27-0060). Namely,low-intensity peaks may be seen at about 33° and 40.7° thatoriginate from reflections (400) and (422) of the cubicCdIn2S4 phase. Additionally, diffraction peaks at about 27°,44° and 48° are obviously broader due to overlapping of the(002), (110) and (103) reflections of the major hexagonal CdS
phase and (311), (511) and (440) reflections of the cubicCdIn2S4 phase, respectively.
Evidently, these reaction conditions did not favour forma-tion of CIS, even if the temperature was high enough (270°C) for degradation of cation–acid complexes, and the reac-tion time was 4 h which should be enough for completion ofthe reaction between ions. Clearly, temperature/time frame isnot a major factor in determining the course and output ofthe reaction. Rather, in this case the chemical properties ofoleic acid and ODE are a major factor, oleic acid having adual role as both a complexing and capping agent, but themost important factor is the ratio between In ions and oleicacid. Battaglia and Peng21 have investigated the influencethat different fatty acids have on formation of InP . Theyfound that not just the length of the hydrocarbon chain, butalso the relative molar ratio between In and fatty acid deter-mines whether InP will be formed or not. For example, if themolar ratio between In and myristic acid in the reaction mix-ture was 1 : 2, there was no distinguishable absorption peakof InP nanoparticles as proof of their formation. Also, if thisratio is 1 : 4.5 at longer reaction times, the absorption peak isnot well defined. They concluded that for each examined acidthere is a certain molar ratio between In and fatty acid, atwhich it is possible to synthesize InP nanoparticles of highquality. Such a ratio surely exists also for In and oleic acid,and we presumed that we were not within that specific con-centration window, so the reactivity of In ions necessary forformation of CIS was not reached. However, this questionneeds detailed study, especially because here we are trying tosynthesize ternary (not binary) sulfides. An additional draw-back of this combination of solvent/complexation agents isthat neither the size nor morphology of the particles can becontrolled, as can be seen from TEM images (Fig. 2).Although the sample is highly crystalline and crystal planesare clearly visible, the sizes of the particles range from 2 to
Fig. 1 XRD pattern of sample C1, synthesized in 1-octadecene.
CrystEngCommPaper
Ope
n A
cces
s A
rtic
le. P
ublis
hed
on 0
5 O
ctob
er 2
015.
Dow
nloa
ded
on 1
2/10
/202
1 9:
59:1
8 PM
. T
his
artic
le is
lice
nsed
und
er a
Cre
ativ
e C
omm
ons
Attr
ibut
ion-
Non
Com
mer
cial
3.0
Unp
orte
d L
icen
ce.
View Article Online

CrystEngComm, 2015, 17, 8492–8499 | 8495This journal is © The Royal Society of Chemistry 2015
20 nm while the morphology varies from spherical particlesto faceted flakes (Fig. 2b–d).
Our next step was to go to the extreme, and to use onlyoleic acid, while in order to push the reaction towards forma-tion of CIS, the molarity of Cd ions was decreased to 2/3 ofthe stoichiometric value (sample C2). A diffractogram of thissample is presented in Fig. 3 (and Fig. S2 in ESI†).
Clearly, the majority of the material is cubic crystallineform CIS (JCPDS card No. 27-0060), but there are still a fewlow-intensity peaks that most probably originate from hexag-onal CdS. The existence of well-defined sharp peaks that are
broad at the low intensity and form so-called “hills” at lowerdegrees regions, indicated a simultaneous presence of well-crystallized crystal domains together with crystal domains ofjust a few nanometers. Using an X-ray Line Profile FittingProgram (XFIT)22 we calculated that coherent domain sizes ofthe larger fraction/particles in the sample are about 29 nm.Co-existence of two types of materials in sample C2 is con-firmed with TEM images (Fig. 4a). SAED confirmed the exis-tence of CdS and CIS in the sample (Fig. 4d). According tothe XRD pattern larger particles originate from CIS (Fig. 4b),while particles of about 4 nm are from CdS (Fig. 4c). Interest-ingly, there is a certain uniformity in the particle sizes inboth groups (indicated by the arrows in Fig. 4a).
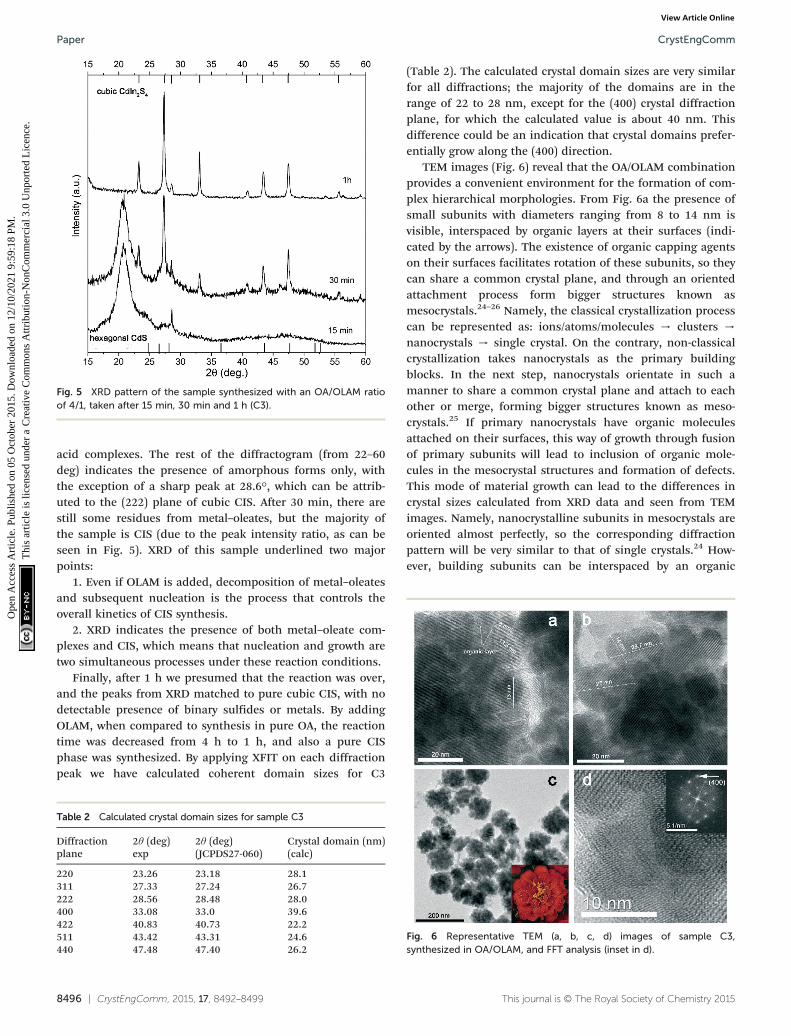
Diffractograms and TEM images of both samples gave usa hint about the growth mechanism of CIS. Since CdS is inboth samples, it seems that initially CdS nanoparticles areformed, while later through a cation exchange process Cdions are partially replaced with In ions, with formation of CISas the final product. This means that the reaction betweenthe ions needs to be accelerated. One of the ways this can beachieved is to speed up degradation of the metal–oleic acidcomplex by addition of oleylamine, which, as an organicbase, enables faster decomposition of this complex.23 Bearingin mind that OLAM is also a reducing agent and may serve asa weak capping agent, we kept the volume of oleic acidhigher than that of OLAM, so the final volume ratio was OA :OLAM = 4 : 1. In order to track the influence of OLAM addi-tion, the reaction time was varied from 15 min to 1 h. XRDpatterns of these samples are presented in Fig. 5 (and Fig. S3in ESI†).
After 15 min, a peak at about 20.8° dominates thediffractogram, which we believe originates from metal–oleic
Fig. 2 TEM images (a–d) of sample C1, synthesized in presence of1-octadecene.
Fig. 3 XRD pattern of sample C2, synthesized in oleic acid.Fig. 4 TEM images (a, b, c) of sample C2, synthesized in oleic acid, (d)SAED pattern.
CrystEngComm Paper
Ope
n A
cces
s A
rtic
le. P
ublis
hed
on 0
5 O
ctob
er 2
015.
Dow
nloa
ded
on 1
2/10
/202
1 9:
59:1
8 PM
. T
his
artic
le is
lice
nsed
und
er a
Cre
ativ
e C
omm
ons
Attr
ibut
ion-
Non
Com
mer
cial
3.0
Unp
orte
d L
icen
ce.
View Article Online
8496 | CrystEngComm, 2015, 17, 8492–8499 This journal is © The Royal Society of Chemistry 2015
acid complexes. The rest of the diffractogram (from 22–60deg) indicates the presence of amorphous forms only, withthe exception of a sharp peak at 28.6°, which can be attrib-uted to the (222) plane of cubic CIS. After 30 min, there arestill some residues from metal–oleates, but the majority ofthe sample is CIS (due to the peak intensity ratio, as can beseen in Fig. 5). XRD of this sample underlined two majorpoints:
1. Even if OLAM is added, decomposition of metal–oleatesand subsequent nucleation is the process that controls theoverall kinetics of CIS synthesis.
2. XRD indicates the presence of both metal–oleate com-plexes and CIS, which means that nucleation and growth aretwo simultaneous processes under these reaction conditions.
Finally, after 1 h we presumed that the reaction was over,and the peaks from XRD matched to pure cubic CIS, with nodetectable presence of binary sulfides or metals. By addingOLAM, when compared to synthesis in pure OA, the reactiontime was decreased from 4 h to 1 h, and also a pure CISphase was synthesized. By applying XFIT on each diffractionpeak we have calculated coherent domain sizes for C3
(Table 2). The calculated crystal domain sizes are very similarfor all diffractions; the majority of the domains are in therange of 22 to 28 nm, except for the (400) crystal diffractionplane, for which the calculated value is about 40 nm. Thisdifference could be an indication that crystal domains prefer-entially grow along the (400) direction.
TEM images (Fig. 6) reveal that the OA/OLAM combinationprovides a convenient environment for the formation of com-plex hierarchical morphologies. From Fig. 6a the presence ofsmall subunits with diameters ranging from 8 to 14 nm isvisible, interspaced by organic layers at their surfaces (indi-cated by the arrows). The existence of organic capping agentson their surfaces facilitates rotation of these subunits, so theycan share a common crystal plane, and through an orientedattachment process form bigger structures known asmesocrystals.24–26 Namely, the classical crystallization processcan be represented as: ions/atoms/molecules → clusters →
nanocrystals → single crystal. On the contrary, non-classicalcrystallization takes nanocrystals as the primary buildingblocks. In the next step, nanocrystals orientate in such amanner to share a common crystal plane and attach to eachother or merge, forming bigger structures known as meso-crystals.25 If primary nanocrystals have organic moleculesattached on their surfaces, this way of growth through fusionof primary subunits will lead to inclusion of organic mole-cules in the mesocrystal structures and formation of defects.This mode of material growth can lead to the differences incrystal sizes calculated from XRD data and seen from TEMimages. Namely, nanocrystalline subunits in mesocrystals areoriented almost perfectly, so the corresponding diffractionpattern will be very similar to that of single crystals.24 How-ever, building subunits can be interspaced by an organic
Fig. 5 XRD pattern of the sample synthesized with an OA/OLAM ratioof 4/1, taken after 15 min, 30 min and 1 h (C3).
Table 2 Calculated crystal domain sizes for sample C3
Diffractionplane
2θ (deg)exp
2θ (deg)(JCPDS27-060)
Crystal domain (nm)(calc)
220 23.26 23.18 28.1311 27.33 27.24 26.7222 28.56 28.48 28.0400 33.08 33.0 39.6422 40.83 40.73 22.2511 43.42 43.31 24.6440 47.48 47.40 26.2
Fig. 6 Representative TEM (a, b, c, d) images of sample C3,synthesized in OA/OLAM, and FFT analysis (inset in d).
CrystEngCommPaper
Ope
n A
cces
s A
rtic
le. P
ublis
hed
on 0
5 O
ctob
er 2
015.
Dow
nloa
ded
on 1
2/10
/202
1 9:
59:1
8 PM
. T
his
artic
le is
lice
nsed
und
er a
Cre
ativ
e C
omm
ons
Attr
ibut
ion-
Non
Com
mer
cial
3.0
Unp
orte
d L
icen
ce.
View Article Online

CrystEngComm, 2015, 17, 8492–8499 | 8497This journal is © The Royal Society of Chemistry 2015
layer, so the existence of these defects make them observableby TEM. This is also a reason why calculated values fromXRD data are higher. Anyhow, from Fig. 6b, it is clear thatthe mesocrystals have diameters ranging from 20 to 30 nm,which is in good agreement with calculated crystal domainsizes.
The obtained mesocrystals are self-organized in marigold-like structures (Fig. 6c) and highly crystalline. The well-ordered crystalline planes are clearly seen all over themarigold-like structures, although individual smaller nano-particles and subunits can also be seen. Similar marigold-likesuperstructures can be found in the literature,2,4,5,11,12 but, asfar as we know, their growth through mesocrystal arrange-ment has not been reported until now. Fig. 6d represents onefragment of the marigold-like structures and the matchingFFT analysis. The spot indicated by the arrow corresponds tothe (400) planes.
In order to evaluate the optical properties of C3, a UV/visabsorption spectrum was recorded, and then presented as aTauc plot (Fig. 7a). By extrapolation of the linear region ofthis plot we have estimated that the band-gap energy of thissample is in the visible part of the spectrum and has avalue of ~2.1 eV. Besides the value of the band-gap, veryimportant parameters that determine if a material is suitablefor water splitting and photocatalytic applications at all, arethe relative potentials at which the semiconductor's conduc-tion and valence band edges are suited. For successfulapplication, it is necessary that the edge potential of the con-duction band (CB) is situated above the H+/H2 potential,while the valence band (VB) edge potential should be belowthe oxygen evolution level. The easiest way to calculate thesevalues is by using an empirical equation related toelectronegativity27
ECB,VB = E0 + (χCd + χIn2 + χS
4)1/7 ± 1/2Eg
where χ is the absolute electronegativity, Eg is the estimatedband-gap energy of the semiconductor, while E0 represents
the difference between the normal hydrogen electrode (NHE)and the vacuum, and has a value of −4.5 eV.
According to this equation, the bottom of the conductionband of C3 is situated at −0.605 eV, while the top of thevalence band is at 1.495 eV. These calculated potentials areschematically depicted in Fig. 7b. As can be seen, the calcu-lated positions of the band edges are properly positioned ver-sus the H+/H2 and O2/H2O potentials. According to this, theobtained sample could be considered as an appropriate mate-rial for water splitting.
However, for most applications one of the requirements isthe possibility of working in aqueous media. As the synthe-sized particles are capped with a combination of organic OA/OLAM molecules, it was necessary to exchange these surfaceligands with a hydrophilic molecule. For this purpose wechose 2-mercaptoethanol (2ME, HS–C2H4–OH) since it has amercapto (–SH) group which enables easy bonding to cationson a CIS particle’s surface, and a hydrophilic hydroxyl (–OH)group. Adjacent absorption spectra of sample C3 capped withOA/OLAM and capped with 2ME are presented in Fig. 8a.Upon surface ligand exchange, the main optical characteris-tics were preserved, but it is also interesting to notice that forthe 2ME capped sample in the long wavelength region therewas less light scattering; a sign that particles/agglomerateswere better dispersed. Actually, from the TEM images(Fig. 8b and c, Fig. S5 and S6 in ESI†) it is clear that whilethe crystallinity (inset) and size of the mesocrystallineagglomerates are preserved, the structures are lesscompacted. Such dispersions stayed stable for a few monthswithout any precipitation even if they were kept at room tem-perature, not protected from light, which is an advantage forthis method of organic/water transfer. Here, it should bestressed that mesocrystals could be considered as “nano-particles that are glued together by an inorganic or organiclinker”.26 If the nature of the “glue” is changed, it could beexpected that the properties of the mesocrystals will change.The properties of mesocrystals are usually inherited from the
Fig. 7 a) Tauc plot of sample C3, b) positions of calculated bandedges versus NHE.
Fig. 8 a) Adjacent UV/vis spectra of sample C3 capped with OA/OLAMdispersed in toluene and 2ME dispersed in water; b) TEM image of“marigold” capped with OA/OLAM; c) TEM image of “marigold”capped with 2ME. Inset: enlarged fragment of “marigold” capped with2ME.
CrystEngComm Paper
Ope
n A
cces
s A
rtic
le. P
ublis
hed
on 0
5 O
ctob
er 2
015.
Dow
nloa
ded
on 1
2/10
/202
1 9:
59:1
8 PM
. T
his
artic
le is
lice
nsed
und
er a
Cre
ativ
e C
omm
ons
Attr
ibut
ion-
Non
Com
mer
cial
3.0
Unp
orte
d L
icen
ce.
View Article Online

8498 | CrystEngComm, 2015, 17, 8492–8499 This journal is © The Royal Society of Chemistry 2015
nanoparticles they are built from, but if fusion between theseprimary building blocks is achieved, the newly-formedmesocrystals could have some new and enhanced characteris-tics (specific surface area, porosity, photocatalytic activity,etc.). Anyhow, whether mesocrystals are considered forapplications in photocatalysis, solar energy conversion oroptoelectronics, they need to be well characterized, andcompared with their nanocrystalline and single-crystalcounterparts.24–26
ZnIn2S4
In order to check if it is possible to use the same generalmethod of synthesis for the other three-component semicon-ductors, we have chosen to synthesize ZIS, another semicon-ductor from the II–III2–VI4 family. As Bae et al.28 suggested,Cd2+ has a weaker binding energy with oleic acid than Zn2+,hence the same principle of OLAM usage was tried for thesynthesis of ZnIn2S4. Considering this difference betweenstrengths of metal–oleate bonds, the volume of OLAM wasincreased, so the final ratio was OA :OLAM = 2 : 1. The reac-tion was stopped after 30 min, in order to see the early stagesof nucleation and growth, and to characterize the system inan intermediate state. The XRD pattern of this sample (Z1)(Fig. 9 and S7 in ESI†) revealed a presence of both hexagonalZIS (JCPDS No. 065-2023) and rhombohedral ZnS (JCPDS No.089-2181). Peaks of these two phases are at very similar 2θvalues, so it was not possible to calculate crystallite sizes. Theonly feature that unmistakably distinguishes ZIS from ZnS isa peak at 21.6°, which corresponds to diffraction from the(006) crystal plane. Again, the existence of both binary andternary sulfides leads us to conclude that the ZIS growsthrough a Zn2+/In3+ cation exchange process.
The morphology of Z1 was examined by TEM (Fig. 10).The images revealed the presence of small round particles,with diameters of about 3 nm (Fig. 10a and b), but also thin
flakes with diameters of about 25 nm (Fig. 10a). HexagonalZnIn2S4 has a lamellar crystal structure13,29 so formation ofsuch layered structures or flakes is not unexpected. In theirarticle from 2006, Gou et al.6 have shown that reaction tem-perature and time are the main factors that influencewhether these layers will fold into tubes or not. In their syn-thesis, for temperatures higher than 180 °C, lamellar struc-tures start to fold at the edges and if the sample was kept atelevated temperature for sufficient time, the resulting mor-phology can be tubular.
Our samples also showed the beginning of tube formation(Fig. 10a and c). The length of the tubular structures matcheswell with the flake diameters. However, we believe that thereaction time of 30 min was not sufficient for completion offolding and formation of tubular structure. A possible expla-nation could be that ZnS nucleation/Zn2+/In3+ cationexchange/flake rolling are simultaneous processes. Anyhow,additional detailed experiments must be conducted in orderto be sure that our synthetic procedure can finally lead totubular ZnIn2S4.
Conclusions
A hot-injection method for the synthesis of CIS is presented.The influences of different organic reaction media on CIS for-mation are followed and explained, and it was found that forthe given experimental conditions pure CIS can be synthe-sized only with a combination of OA and OLAM. It is pro-posed that CIS grows from binary CdS through a Cd/In cationexchange process. Synthesized particles of about 25 nm indiameter are self-organized in marigold-like mesocrystalstructures. By using an empirical equation we have calculatedthe positions of the conduction (−0.605 V) and valenceband (1.495 V) edges of synthesized CIS. According to thesecalculated values, the synthesized material could be consid-ered as an appropriate material for water splitting.
Furthermore, we have proposed an easy way to transferCIS from the organic phase to aqueous media, by using 2ME.Upon transfer, all the main characteristics of the material areFig. 9 XRD pattern of sample Z1 synthesized in OA/OLAM = 2/1.
Fig. 10 TEM (a, b, c) images of sample Z1 synthesized in OA/OLAM =2/1.
CrystEngCommPaper
Ope
n A
cces
s A
rtic
le. P
ublis
hed
on 0
5 O
ctob
er 2
015.
Dow
nloa
ded
on 1
2/10
/202
1 9:
59:1
8 PM
. T
his
artic
le is
lice
nsed
und
er a
Cre
ativ
e C
omm
ons
Attr
ibut
ion-
Non
Com
mer
cial
3.0
Unp
orte
d L
icen
ce.
View Article Online

CrystEngComm, 2015, 17, 8492–8499 | 8499This journal is © The Royal Society of Chemistry 2015
preserved, but also better stability of the obtained dispersionis achieved. Mainly, the mesocrystalline structure of the mari-gold agglomerates is preserved, making applications of thesematerials demanding an aqueous medium feasible.
Additionally, initial experiments in the synthesis of ZIS byusing the OA/OLAM combination are presented. Mixedbinary/ternary sulfides are obtained. Ternary sulfides grow inthe form of flakes, that over time probably start to roll,forming tubes. Future work will be directed towards the syn-thesis of pure ZIS, as well as clarifying its nucleation, growthand tube formation mechanisms.
Acknowledgements
Financial support for this study was granted by the Ministryof Education and Science of the Republic of Serbia (Projects:III45020 and OI172056) and COST actions CM1101 andMP1106.
Notes and references
1 W. Shangguan and A. Yoshida, J. Phys. Chem. B, 2002, 106,12227.
2 B. B. Kale, J.-O. Baeg and S. M. Lee, Adv. Funct. Mater.,2006, 16, 1349.
3 L. Fan and R. Guo, J. Phys. Chem. C, 2008, 112, 17000.4 W. Jiang, X. Yin, F. Xin, Y. Bi, Y. Liu and X. Li, Appl. Surf.
Sci., 2014, 288, 138.5 A. Bhirud, N. Chaudhari, L. Nikam, R. Sonawane, K. Patil,
J.-O. Baeg and B. Kale, Int. J. Hydrogen Energy, 2011, 36,11628.
6 X. Gou, F. Cheng, Y. Shi, L. Zhang, S. Peng, J. Chen and P.Shen, J. Am. Chem. Soc., 2006, 128, 7222.
7 J. Zhou, G. Tian, Y. Chen, X. Meng, Y. Shi, X. Cao, K. Panand H. Fu, Chem. Commun., 2013, 49, 2237.
8 S. N. Baek, T. S. Jeong, C. J. Youn, K. J. Hong, J. S. Park,D. C. Shin and Y. T. Yoo, J. Cryst. Growth, 2004, 262, 259.
9 L. Ye, J. Fu, Z. Xu, R. Yuan and Z. Li, ACS Appl. Mater.Interfaces, 2014, 6, 3483.
10 X. Hu, J. C. Yu, J. Gong and Q. Li, Cryst. Growth Des.,2007, 7(12), 2444.
11 S. K. Apte, S. N. Garaje, R. D. Bolade, J. D. Ambekar, M. V.Kulkarni, S. D. Naik, S. W. Gosavi, J.-O. Baeg and B. B. Kale,J. Mater. Chem., 2010, 20, 6095.
12 W. Wang, T. W. Ng, W. K. Ho, J. Huang, S. Liang, T. An, G.Li, J. C. Yu and P. K. Wong, Appl. Catal., B, 2013, 129, 482.
13 L. Shang, C. Zhou, T. Bian, H. Yu, L.-Z. Wu, C.-H. Tung andT. Zhang, J. Mater. Chem. A, 2013, 1, 4552.
14 S. Peng, L. Li, Y. Wu, L. Ji, L. Tian, M. Srinivasan, S.Ramakrishna, Q. Yan and S. G. Mhaisalkar, CrystEngComm,2013, 15, 1922.
15 S. Peng, S. G. Mhaisalkara and S. Ramakrishna, Mater. Lett.,2012, 79, 216.
16 J. Feng, H. Zhu, X. Wang and X. Yang, Chem. Commun.,2012, 48, 5452.
17 C. B. Murray, D. J. Norris and M. G. Bawendi, J. Am. Chem.Soc., 1993, 115, 8706.
18 N. D. Abazović, M. I. Čomor, M. N. Mitrić, E. Piscopiello, T.Radetić, I. A. Janković and J. M. Nedeljković, J. Nanopart.Res., 2012, 14, 810.
19 M. V. Beloš, N. D. Abazović, J. Kuljanin Jakovljević, I.Janković, S. P. Ahrenkiel, M. Mitrić and M. I. Čomor,J. Nanopart. Res., 2013, 15, 2148.
20 W. W. Yu and X. Peng, Angew. Chem., Int. Ed., 2002, 41, 2368.21 D. Battaglia and X. Peng, Nano Lett., 2002, 2, 1027.22 R. W. Cheary and A. A. Coelho, J. Appl. Crystallogr., 1992, 25,
109.23 N. Bao, X. Qiu, Y.-H. A. Wang, Z. Zhou, X. Lu, C. A. Grimes
and A. Gupta, Chem. Commun., 2011, 47, 9441.24 H. Cölfen and M. Antonietti, Angew. Chem., Int. Ed.,
2005, 44, 5576.25 Y. Liu, Y. Zhang and J. Wang, CrystEngComm, 2014, 16,
5948.26 L. Zhou and P. O'Brien, J. Phys. Chem. Lett., 2012, 3, 620.27 Y. Xu and M. A. A. Schoonen, Am. Mineral., 2000, 85, 543.28 W. K. Bae, M. K. Nam, K. Char and S. Lee, Chem. Mater.,
2008, 20, 5307.29 L. Shi, P. Yin and Y. Dai, Langmuir, 2013, 29, 12818.
CrystEngComm Paper
Ope
n A
cces
s A
rtic
le. P
ublis
hed
on 0
5 O
ctob
er 2
015.
Dow
nloa
ded
on 1
2/10
/202
1 9:
59:1
8 PM
. T
his
artic
le is
lice
nsed
und
er a
Cre
ativ
e C
omm
ons
Attr
ibut
ion-
Non
Com
mer
cial
3.0
Unp
orte
d L
icen
ce.
View Article Online