the influence of marketing mix on customer loyalty …
TRANSCRIPT

THE INFLUENCE OF MARKETING MIX ON CUSTOMER LOYALTY THROUGH
CUSTOMER SATISFACTION AS AN INTERVENING VARIABLE (With Case Study
of Make Over Cosmetics Customers at Mall Metropolitan Bekasi)
Sekolah Tinggi Ilmu Ekonomi Indonesia – 2020 1
THE INFLUENCE OF MARKETING MIX ON
CUSTOMER LOYALTY THROUGH CUSTOMER
SATISFACTION AS AN INTERVENING VARIABLE
(With Case Study of Make Over Cosmetics Customers at
Mall Metropolitan Bekasi)
Devy Kartika Rizki
Management
Sekolah Tinggi Ilmu Ekonomi Indonesia Jakarta
Jakarta, Indonesia
Abstract–This study aimed to find out how much the influence of
marketing mix has on customer loyalty through customer
satisfaction as an intervening variable with a case study of Make
Over Cosmetics customers in Metropolitan Mall Bekasi.
Marketing mix consist of four variables: (1) Product, (2) Price, (3)
Location/Distribution Channel, (4) Promotion. This study used an
associative research strategy that is measured using the path
analysis method with SPSS 24.00. The population of this study was
the user/consumer of Make Over Cosmetics in Metropolitan Mall
Bekasi, with a total sample of 100 respondents. Data collection
technique used field studies by distributing questionnaires. In the
research, we found that product, location/distribution channel,
and promotion directly had a significant influence on customer
satisfaction. Customer satisfaction had a significant influence on
customer loyalty. Product indirectly influenced customer loyalty.
Promotion indirectly influenced customer loyalty. However, price
did not have significant influence on customer loyalty nor
customer satisfaction.
Keywords: Marketing Mix, Customer Satisfaction, Customer
Loyalty
I. INTRODUCTION In Indonesia, there are many kinds of cosmetic brands, from local to imported brands that are
often sought after by Indonesian women. There are various kinds of cosmetic brands from various
countries that are sold in the Indonesian market such as Etude House and The Face Shop from
South Korea, Make Up Forever from the United States, Oriflame from Sweden, Canmake from Japan, and many others. Along with the times, cosmetics seem to be a primary need for some
women. In the modern era like this century, companies are increasingly competing to introduce
their products to customers in order to win market share. Customers are the main factor for the existence of a company. Various methods are used by companies in order to reach various target
markets/customers and different circles. In buying a product, customers will not only immediately

Devy Kartika Rizki
Sekolah Tinggi Ilmu Ekonomi Indonesia - 2020 2
buy the goods or services they see, but customers certainly want what they have sacrificed (in this
case money) to get an item or service that can satisfy and meet their needs.
There are various kinds of strategies implemented by companies in Indonesia, one of which is the Marketing Mix Strategy. The marketing mix consists of a set of variables that a company can
control and use to influence customer responses in its target market. These variables or activities
need to be combined and coordinated by the company as effectively as possible in conducting marketing activities.
Thus, companies not only have the best combination of activities, but can coordinate the
various marketing mix variables to carry out an effective marketing program. The elements or
variables of the marketing mix strategy consist of four, namely: (1) product; (2) price; (3) location / distribution channel; (4) promotion (Sofjan Assauri, 2015).
Every company must know how their company's products can provide satisfaction for
customers, such as PT Paragon Technology and Innovation or known as PTI Paragon. PTI Paragon has been established since 1985 which is engaged in the beauty sector. The company, which is
located in the Jatake Industrial Estate, Tangerang, provides many types of cosmetic and facial care
products which are divided into several cosmetic brands including Make Over, Emina, Wardah,
also hair care, Innovation Xalon. In Indonesia, Make Over Cosmetics already has many stores in various areas such as Jakarta,
Bandung, Semarang, and even distribution to Makassar and NTT. Make Over Cosmetics is often
referred to as an international brand which in the minds of Indonesians is a quite “expensive” brand. However, even though there are many such circulating mindset, Make Over Cosmetics is
still widely circulating in the Indonesian cosmetics market. That's why researchers want to know
how these consumers continue to consume Make Over Cosmetics products, despite the relatively more expensive prices compared to other local cosmetic brands. In addition, the location of the
Make Over Cosmetics counter in Bekasi is one of which is in the Bekasi Metropolitan Mall, which
is in the center of Bekasi city, so according to the researcher, it is very easy for consumers to get
Make Over Cosmetic products, so that researchers want to know. Also, we often see Make Over Cosmetics advertisements in electronic media such as television, in which the advertisements
display many attractive and unique colors, will that attract customers to keep using the product
because the colors on Make Over Cosmetics products are different and bolder than local products on the Indonesian market.
With the explanation as above, researchers are also interested in conducting research entitled
“THE INFLUENCE OF MARKETING MIX ON CUSTOMER LOYALTY THROUGH CUSTOMER SATISFACTION AS AN INTERVENING VARIABLE (With Case Study of Make
Over Cosmetics Customers at Mall Metropolitan Bekasi)”
II. LANDASAN TEORI DAN PENGEMBANGAN HIPOTESIS 2.1 Review Penelitian
Research by Tengku Putri Lindung Bulan with the title “Pengaruh Diversifikasi Produk dan
Harga terhadap Kepuasan Konsumen pada Juragan Jasmine Langsa” (Jurnal Manajemen Dan
Keuangan, Vol. 6, No. 1, Mei 2017, ISSN 2252-844x). The purpose of this study was to determine
the effect of product diversification and price on consumer satisfaction cosmetics "Juragan Jasmine Langsa". The results showed that KK = 3.176 + 0.482 DP - 0.014 H. The sampling technique used
was accidental sampling, which is whoever is met during the study and meets certain criteria, then
they are the sample. So, the number of samples in this study was 96 people. By t test, the variable of product diversification and price obtained a significance value <0.05 and it can be stated that the
product and price diversification has a significant effect on consumer satisfaction of cosmetics
"Juragan Jasmine Langsa". For the F test, the significance value is obtained <0.05 and it can be
stated that the variable product diversification and price simultaneously have a significant effect on

THE INFLUENCE OF MARKETING MIX ON CUSTOMER LOYALTY THROUGH
CUSTOMER SATISFACTION AS AN INTERVENING VARIABLE (With Case Study
of Make Over Cosmetics Customers at Mall Metropolitan Bekasi)
Sekolah Tinggi Ilmu Ekonomi Indonesia – 2020 3
consumer satisfaction of cosmetic consumers "Juragan Jasmine Langsa". The coefficient of
determination can be explained that product and price diversification affects consumer satisfaction
at Juragan Jasmine Langsa by 49.80%, while the remaining 50.2% is influenced by other variables outside of this research model.
Research by Riska Asnawi et al, entitled “Pengaruh Kualitas Produk Terhadap Loyalitas
Pelanggan Kosmetik Wardah di Transmart Bahu Manado” (Jurnal Administrasi Bisnis, Vol. 9, No. 3, 2019; ISSN 2338-9605). This study aimed to determine the effect of product quality on customer
loyalty Wardah Cosmetics at Transmart Bahu Manado. This research method used quantitative
methods, with a sample of 96 respondents who were Wardah product customers. The sampling
technique in this study was purposive sampling. The data collection technique in this study was a questionnaire. The data analysis method used in this research was simple regression data analysis
with the associative approach method to see the causal relationship which includes validity tests,
reliability tests and simple regression analysis processed using the SPSS 25 computer program. Based on the results of the calculation of the coefficient of determination, the R square value is
0.725 or 72.5%, which stated that there was a variable effect of product quality on customer
loyalty, while 0.245 was a residual value or 24.5% was influenced by other factors not present in
the study. This showed that product quality had a significant effect on customer loyalty. If the product quality will have been getting better, customer loyalty will also be higher.
Research by Andrew A. Lumintang with the title “Bauran Pemasaran Pengaruhnya Terhadap
Loyalitas Konsumen Sabun Mandi Lifebuoy di Kota Manado” (Jurnal EMBA, Vol.1 No.3, tahun 2013; ISSN 2303-1174). “Bauran Pemasaran Pengaruhnya Terhadap Loyalitas Konsumen Sabun
Mandi Lifebuoy di Kota Manado” (Jurnal EMBA, Vol.1 No.3, tahun 2013; ISSN 2303-1174). This
study aimed to determine the effect both simultaneously and partially of the product, price, location/distribution channel and promotion on consumer loyalty. The research design used a
survey, and the research method was the associative method. The research questionnaire was
distributed to 272 people, but 111 questionnaires were returned. Of the 111 questionnaires that can
be analyzed, 100 are, while 11 are incomplete. Samples were taken from consumers of Lifebuoy soap users in the Malalayang Satu village, Manado. The research instrument was using a Likert
scale, and the analysis technique used multiple linear regression, considering that the model was
composed of a number of causal relationships between latent variables. The results show that marketing mix consisting of product, price, location / distribution channel and promotion variables
had a significant effect on consumer loyalty both simultaneously and partially.
Research by Moh. Budi Darma et al with the “Pengaruh Citra Merek dan Kepuasan Pelanggan Terhadap Loyalitas Pelanggan Kosmetik” (Jurnal Riset Sains Manajemen, Vol. 2, No. 1,
2018, ISSN 2597-4726). This study aimed to analyze the effect of brand image on customer
satisfaction, the effect of brand image on customer loyalty, the effect of customer satisfaction on
customer loyalty, and the effect of brand image on customer loyalty mediated by customer satisfaction. This research used quantitative methods. The sample of this study was 51 respondents
using accidental sampling. The data collection technique used a questionnaire, and the data analysis
technique was path analysis. Based on the results of hypothesis testing, the effect of brand image on customer satisfaction was positive and significant, the influence of brand image on customer
loyalty was positive and significant, the effect of customer satisfaction on customer loyalty wass
positive and significant, and brand image affected customer loyalty through customer satisfaction
as a mediation. Research by Ida Ayu Putu Dian Savitri and I Made Wardana with the title “Pengaruh Citra
Merek, Kualitas Produk, dan Persepsi Harga Terhadap Kepuasan dan Niat Beli Ulang” (E-Jurnal
Manajemen Unud, Vol. 7, No. 10, 2018; ISSN 2302-8912). The purpose of this study was to determine the effect of brand image, product quality, and perceived price on satisfaction and
repurchase intention of cosmetic customers in Denpasar. This research was conducted in Denpasar,
involving 120 respondents. The purposive sampling method was chosen as a method of data

Devy Kartika Rizki
Sekolah Tinggi Ilmu Ekonomi Indonesia - 2020 4
collection. Data collection was carried out by distributing questionnaires. The data from the results
of the questionnaire collection then processed using validity and reliability tests to determine the
feasibility and consistency of indicators in the questionnaire. In addition to the validity and reliability tests, another test was carried out, which named path analysis. The results of this study
found that brand image, product quality, and perceived price had a positive and significant effect
on customer satisfaction. Brand image was the most dominant variable that affects customer satisfaction. Customer satisfaction also had a positive and significant effect on repurchase
intention. So it can be concluded that creating repurchase intention in consumers can be done by
increasing customer satisfaction.
Research by N A Wahab, et al from MARA Technology University, Shah Alam, Selangor, Malaysia, with the title “The Relationship Between Marketing Mix and Costumer Loyalty in Hijab
Industry: The Mediating Effect of Customer Satisfaction” (Procedia Economics and Finance,
Vol.37 tahun 2016; ISSN 2212-5671). This study aimed to determine the relationship between the marketing mix and customer loyalty in the hijab industry, as well as the mediating effect of
customer satisfaction. This research was a correlational study, which answered questions about the
relationship between variables. For this study, convenience sampling technique was used to obtain
data from respondents by collecting data based on a questionnaire distributed to around 250 female customers. Based on the research results, the correlation between the marketing mix which consists
of product, price, location/distribution channel, and promotion had a positive and significant
relationship to customer satisfaction. Meanwhile, the results also showed that there is a positive relationship between customer satisfaction and customer loyalty. So that it can be concluded that
all the existing variables were related to one another.
Research by Nurul Aishah M. and Dang Merduwati H., from the MARA University of Technology, Selangor, Malaysia, with the title “Factors Influencing Customers’ Satisfaction And
Brand’s Loyalty in Cosmetics Products Among Students” (Research Hub, Vol. 2, Issue 1 tahun
2016, ISSN 2180-0065). This study aimed to determine the factors that influenced customer
satisfaction and brand loyalty to cosmetic products among teenagers. Teens often buy products without considering how the product affects health, lack of information when deciding to use the
product or lack of information. The results of this study said that there were three factors that
influence adolescents in getting satisfaction when buying or using cosmetic products, including price, location, and how to promote the product.
Research by Dr. J. Gayathri and J. Kousika from Tirupur Kumaran College for Women,
Tamilnadu, India, with the title “A Study on Customer Satisfaction And Preference Towards Foreign Brand Cosmetics In Tirupur City” (Intercontinental Journal Of Marketing Research
Review, ISSN 2321-0346, Vol. 4, Issue 9, September 2016). This study aimed to determine
customer satisfaction with foreign cosmetic brands in the city of Tirupur, India. The results showed
that foreign branded cosmetic products were able to maintain their top ranking by providing quality products at affordable prices for consumers. The introduction of new (promotional) products in the
market to satisfy consumers was also an important reason for foreign branded cosmetics to be at the
top of the consumer market. From this research it explained that in order to gain a place in the minds of consumers, companies must pay a lot of attention to key factors such as product quality,
price, well-established distribution networks and liaison to agents and so on. By knowing the
preferences and customer satisfaction for the selected foreign branded cosmetic products among
Tirupur cities, consumers expressed their opinion on certain aspects of the foreign branded cosmetic products to the extent that they are satisfied.
2.2 Marketing Mix Kotler dan Keller (2016:27) defines the marketing mix as a social process in which
individuals and groups get what they want by making, offering or exchanging products and
services that have value. Meanwhile, according to Assauri (2015: 75), the marketing mix is a

THE INFLUENCE OF MARKETING MIX ON CUSTOMER LOYALTY THROUGH
CUSTOMER SATISFACTION AS AN INTERVENING VARIABLE (With Case Study
of Make Over Cosmetics Customers at Mall Metropolitan Bekasi)
Sekolah Tinggi Ilmu Ekonomi Indonesia – 2020 5
strategy to mix marketing activities, in order to find the maximum combination that can be
controlled by the company to influence the reactions of buyers or consumers. The marketing mix
consists of four components: 1) Product,
2) Price,
3) Place (Location/distribution channel), 4) Promotion.
2.3 Product
The definition of a product according to Fandy Tjiptono (2012: 80) is everything that producers can offer to be noticed, requested, searched for, purchased, used, or consumed by the
market as a fulfillment of the needs or desires of the relevant market. Products are everything that
is produced by a company or manufacturer to meet the needs and desires of customers, whether physical products or in the form of services, ideas, and so on. Some product components that are
product indicators according to Kotler and Armstrong (2014: 248) are:
1) Product Quality
2) Product Features 3) Product Design
2.4 Price Kotler dan Amstrong (2014:314) define price as the amount of money charged for a product
or service, the amount of value exchanged by customers for the benefit of owning or using a
product or service. The indicators are: 1) Affordability of prices
2) Price compatibility with product quality
3) Price match with benefits
4) Price competitive
2.5 Location/Distribution Channel
Distribution is an activity that must be carried out by entrepreneurs to distribute, distribute, send and deliver goods that are marketed to customers (Gitosudarmo, 2014: 12). In distributing
products, companies need distributors, either company-owned or outside the company, so that the
products being sold can be consumed by customers / product users. The indicators in distribution activities according to Gitosudarmo (2014: 14) include:
1) Product availability
2) Range of distribution
3) Level of convenience
2.6 Promotion
Promotion is an attempt to notify or offer a product or service to the public (market) with the aim of attracting customers to buy or consume it. (Zebua, 2018: 34). While Kotler and Armstrong
(2014: 76), promotion refers to activities that communicate the benefits of the product and persuade
target customers to buy it. The indicators of the promotion are:
1) Advertising 2) Sales Promotion
3) Public Relations
4) Personal Selling

Devy Kartika Rizki
Sekolah Tinggi Ilmu Ekonomi Indonesia - 2020 6
2.7 Customer Satisfaction
According to Tjiptono, (2012: 146), customer satisfaction is a feeling of disappointment or
pleasure for someone who appears after comparing perceptions of the performance of a product with his expectations. So, if the expectations are below the perception then the customer is not
satisfied and vice versa if the expectations are greater than the perception, the customer is satisfied.
Indicators to measure customer satisfaction according to Kotler (2014: 150) are: 1) Customer expectations are fulfilled after buying a product, that is, what the customer
gets is similar/ near to what the customer expected before using the product and the
customer feels satisfied with the service provided by the employee.
2) Always buy products, where customers make repeated purchases within a certain period.
3) Will recommend to others, in this case the customer will say good things about the
company to others.
2.8 Customer Loyalty
According to Sheth & Mittal (in Tjiptono, 2012: 482) customer loyalty is a customer
commitment to a brand, store, or supplier, based on a very positive attitude and is reflected in consistent repeat purchases. According to Griffin (2010: 31), customer loyalty indicators consist of:
1) Make regular repeat purchases, that is, customers will buy the same products by the
company. 2) Make purchases between product and service lines, that means customers make
purchases on other products from the same company.
3) Referring to other people, customers communicating the products to other people. 4) Resistant against competitors, customers are not interested in offers of similar
products produced by competitors.
2.9 Relation Among Research Variables 1) The Influence of Product on Customer Satisfaction
A product is anything that a producer/company can offer to be noticed, requested,
sought, purchased, used, or consumed by the market as a fulfillment of the market's needs or wants. This is supported by research by Tengku Putri Lindung Bulan (2017) which also
shows that there is a positive and significant influence of products on customer satisfaction.
2) The Influence of Price on Customer Satisfaction Price is defined as the amount of money charged for a product or service, the amount
of value exchanged by customers for the purpose of owning or using the product or service.
This is supported by research by Tengku Putri Lindung Bulan (2017) which also shows that
there is a positive and significant influence of price on customer satisfaction. 3) The Influence of Location/Distribution Channel on Customer Satisfaction
Distribution is an activity that must be carried out by entrepreneurs to distribute or
deliver the goods to customers. This is supported by the research of Nurul Aishah and Dang Merduwati (2016) which also shows that there is a positive and significant influence of
location/distribution channel on customer satisfaction.
4) The Influence of Promotion on Customer Satisfaction
Promotion is an attempt to notify or offer a product or service to the public with the aim of attracting customers to buy or consume it. This is supported by the research of Nurul
Aishah and Dang Merduwati (2016) which also shows that there is a positive and significant
influence of promotion on customer satisfaction. 5) The Influence of Product on Customer Loyalty
Products are everything that is produced by a company to meet customer needs and
desires, both physical products and in the form of services, ideas, and others. This is

THE INFLUENCE OF MARKETING MIX ON CUSTOMER LOYALTY THROUGH
CUSTOMER SATISFACTION AS AN INTERVENING VARIABLE (With Case Study
of Make Over Cosmetics Customers at Mall Metropolitan Bekasi)
Sekolah Tinggi Ilmu Ekonomi Indonesia – 2020 7
supported by research by Riska Asnawi et al (2019) which also shows that there is a positive
and significant influence of products on customer loyalty.
6) The Influence of Price on Customer Loyalty Kotler and Armstrong (2014: 314) define price as the amount of money charged for a
product or service, the amount of value exchanged by customers for the benefit of owning or
using a product or service. This is supported by the research of Nurul Aishah and Dang Merduwati (2016) which also shows that there is a positive and significant influence between
price on customer loyalty.
7) The Influence of Location/Distribution Channel on Customer Loyalty
In distributing products, companies need distributors, either company-owned or outside the company, so that the products being sold can be consumed by customers/product
users. This is supported by research by Andrew A. Lumintang (2013) which also shows that
there is a positive and significant influence of location/distribution channels on customer loyalty.
8) The Influence of Promotion on Customer Loyalty
Promotion refers to activities that communicate the benefits of the product and
persuade target customers to buy it. This is supported by Dr. J. Gayathri and J. Kousika (2016) which also show that there is a positive and significant influence of promotion on
customer loyalty.
9) The Influence of Customer Satisfaction on Customer Loyalty Customer satisfaction, according to Tjiptono (2012:146), is a feeling of
disappointment or pleasure for someone who appears after comparing perceptions of the
performance of a product with his expectations. This is supported by research by M. Budi Darma et al. (2018) which also shows that there is a positive and significant influence of
customer satisfaction and customer loyalty.
2.10 Hyphotesis
1) It is suspected that there is a direct effect of the product (X1) on customer satisfaction (Y)
2) It is suspected that there is a direct effect of the price (X2) on customer satisfaction (Y) 3) It is suspected that there is a direct effect of the location/distribution channel (X3) on
customer satisfaction (Y)
4) It is suspected that there is a direct effect of the promotion (X4) on customer satisfaction (Y) 5) It is suspected that there is a direct effect of the product (X1) on customer loyalty (Z)
6) It is suspected that there is a direct effect of the price (X2) on customer loyalty (Z)
7) It is suspected that there is a direct effect of the location/distribution channel (X3) on
customer loyalty (Z) 8) It is suspected that there is a direct effect of the promotion (X4) on customer loyalty (Z)
9) It is suspected that there is a direct effect of the customer satisfaction (Y) on customer
loyalty (Z) 10) It is suspected that there is an indirect effect of the product (X1) on customer loyalty (Z)
through customer satisfaction (Y) as an intervening variable
11) It is suspected that there is an indirect effect of the price (X2) on customer loyalty (Z)
through customer satisfaction (Y) as an intervening variable
12) It is suspected that there is an indirect effect of the location/distribution channel (X3) on
customer loyalty (Z) through customer satisfaction (Y) as an intervening variable
13) It is suspected that there is an indirect effect of the promotion (X1) on customer loyalty (Z) through customer satisfaction (Y) as an intervening variable
Devy Kartika Rizki
Sekolah Tinggi Ilmu Ekonomi Indonesia - 2020 8
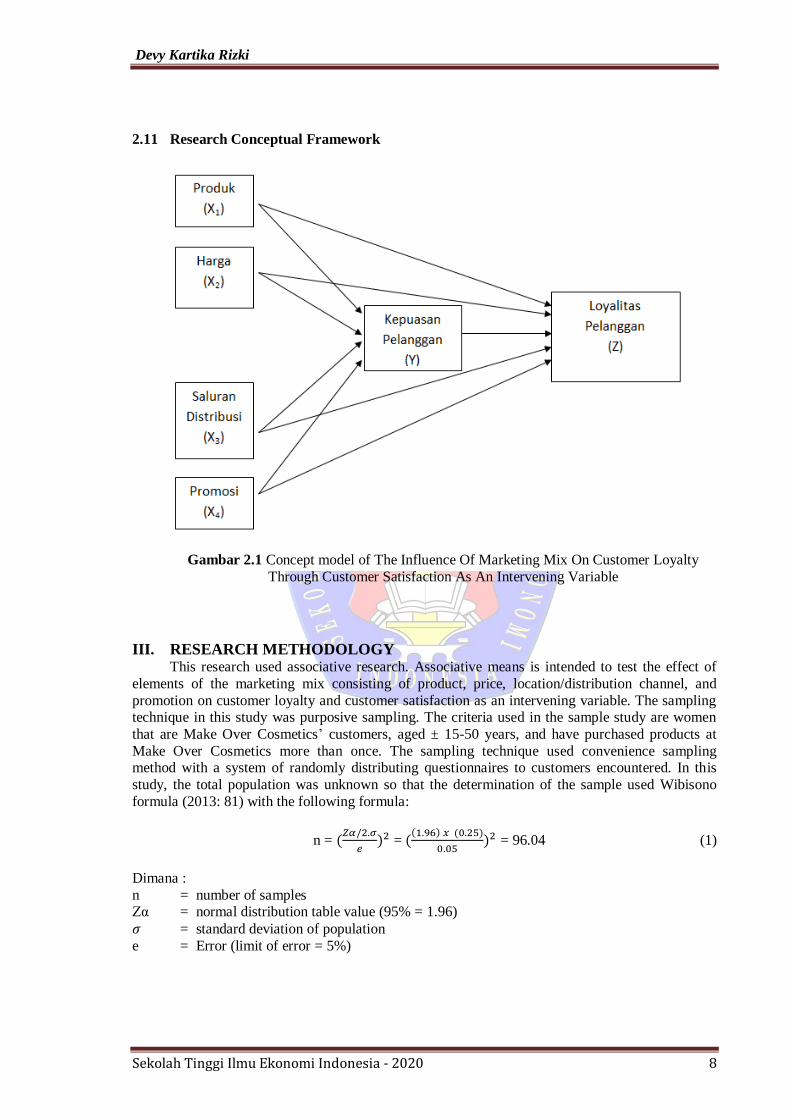
2.11 Research Conceptual Framework
Gambar 2.1 Concept model of The Influence Of Marketing Mix On Customer Loyalty
Through Customer Satisfaction As An Intervening Variable
III. RESEARCH METHODOLOGY This research used associative research. Associative means is intended to test the effect of
elements of the marketing mix consisting of product, price, location/distribution channel, and
promotion on customer loyalty and customer satisfaction as an intervening variable. The sampling technique in this study was purposive sampling. The criteria used in the sample study are women
that are Make Over Cosmetics’ customers, aged ± 15-50 years, and have purchased products at
Make Over Cosmetics more than once. The sampling technique used convenience sampling method with a system of randomly distributing questionnaires to customers encountered. In this
study, the total population was unknown so that the determination of the sample used Wibisono
formula (2013: 81) with the following formula:
n = (𝑍𝛼/2.𝜎
𝑒)2 = (
(1.96) 𝑥 (0.25)
0.05)2 = 96.04 (1)
Dimana :
n = number of samples Zα = normal distribution table value (95% = 1.96)
𝜎 = standard deviation of population
e = Error (limit of error = 5%)

THE INFLUENCE OF MARKETING MIX ON CUSTOMER LOYALTY THROUGH
CUSTOMER SATISFACTION AS AN INTERVENING VARIABLE (With Case Study
of Make Over Cosmetics Customers at Mall Metropolitan Bekasi)
Sekolah Tinggi Ilmu Ekonomi Indonesia – 2020 9
After the calculation, it has been found that n = 96.04, the number of samples to be taken in
this study was about up to 100 respondents. The reason for taking the sample to 100 people, the
calculation result was 96.04, so it woud be easier to carry out the process if the population was rounded to 100 respondents.
The data collection method in this study used a questionnaire that was made by the researcher. The questionnaire was given directly at the place that became the object of research,
Make Over Cosmetic counter at Metropolitan Mall Bekasi. In this study, the answers to the
questionnaire were scored using a Likert scale.
Analysis method of this research used validity test, reliability test, and path analysis method.
The validity test is for knowing if there are questions on the questionnaire that must be discarded or
replaced because they are considered irrelevant. The validity test can be seen by looking at rcount, if r count > r table then the item is valid to be researched. The reliability test is a continuation of the
validity test, where the items that enter the test are only valid items. To determine whether it is
reliable or not, this study used limit of 0.6, means if the reliability is less than 0.6, it means that it is
not good, is acceptable if 0.7, and around or above 0.8 is good. In path analysis, the influence of exogenous variables on endogenous variables can be in the form of direct and indirect effects or in
other words, path analysis takes into account the direct and indirect effects. Structural equation or
also called a structural model, where each dependent/endogenous variable (Y) is determined by a set of independent/exogenous variables (X).
IV. FINDING ANG DISCUSSION 4.1 Description of the Research Subject
PT Paragon Technology and Innovation was established on February 28, 1985, which was
originally named PT Pusaka Tradisi Ibu. This company just changed its name to PT Paragon Technology and Innovation in 2011. The company was founded by a married couple, Drs. H.
Subakat Hadi, M.Sc and Dra. Hj. Nurhayati Subakat, Apt. In 1999, PT Pusaka Tradisi Ibu through
its factory received halal certification from LPPOM MUI, with the Wardah cosmetic brand as the pioneer of the halal brand in Indonesia. In 2010, the company released another cosmetic brand,
Make Over. Make Over Cosmetics is a trusted local brand cosmetic that develop according to the
changing needs of each consumer. Make Over Cosmetic provides various types of products that
have become the main choice of makeup artists, both for daily use, for stage, commercial needs (fashion runaway, TV shows, etc.). Make Over Cosmetics is always committed to continuously
making superior products (made from quality raw materials from all over the world and carefully
processed to produce quality makeup products), harmless (produced in GMP factories and certified HALAL by BPOM), and making customers as inspiration for each product.
4.2 Description of Respondents by Age Tabel 4.1 Data of Respondents by Age
Criteria (years
old)
Amount Percentage (%)
< 20 20 20
20-25 66 66
26-30 9 9
> 30 5 5
Total 100 100
Source: Processed by researchers (2019)

Devy Kartika Rizki
Sekolah Tinggi Ilmu Ekonomi Indonesia - 2020 10
Table 4.1 shows that from 100 female respondents who bought Make Over Cosmetics
products, the largest number of respondents were between 20-25 years, with a total of 66 people.
There are quite a lot of make-up users in this age range, because at this age, women use makeup regularly to support their appearance for various daily activities so that their appearance looks more
attractive and increases their self-confidence.
4.3 Description of Respondents by Occupation
Tabel 4.2 Data of Respondents by Occupation
Criteria Amount Percentage (%)
Student 6 6
College student 64 64
Employee 24 24
Housewife 6 6
Total 100 100
Source: Processed by researchers (2019)
Table 4.2 shows that from 100 respondents in this study, the largest number of respondents were students with 64 people (64%). Just like respondents based on age, respondents in this group
consider make-up as a necessity (not just because they were tempted to buy). Some students
revealed that they use Make Over Cosmetics because of the durability of its products with a variety of attractive colors, as well as the location which is in the Bekasi Metropolitan Mall which is close
to home and quite strategic in the city center, so they often buy and use Make Over Cosmetics.
4.4 Descriptions of Respondents Based on Purchase Frequency
Tabel 4.3 Data of Respondents Based on Purchase Frequency
Criteria Jumlah Persentase (%)
2 times 49 49
3 times 27 27
4 times 11 11
More than 4 13 13
Total 100 100
Source: Processed by researchers (2019)
Table 4.3 shows the characteristics of the respondents when viewed from the frequency of purchasing within 6 months. Respondents in this study were also 100 people, where respondents
who made product purchases twice were 49 people (49%). Some respondents said that, because
Make Over Cosmetics products are quite expensive, they tend to save/prepare money before buying the product again.
4.5 Validity Test According to Syahrum and Salim (2012: 133) validity is a measure that shows the level of
validity of an instrument. In this study, the validity of the data was tested using the SPSS 24
application. To calculate the validity of the instrument, the examiner compared the value of R tabel
with Rcount. The formula used in this study is df = N–2, where N is the number of respondents. So is df = 100 – 2 with an alpha of 0.05, then we have the R table results are 0.1966. The following results
of data processing for all instrument is:

THE INFLUENCE OF MARKETING MIX ON CUSTOMER LOYALTY THROUGH
CUSTOMER SATISFACTION AS AN INTERVENING VARIABLE (With Case Study
of Make Over Cosmetics Customers at Mall Metropolitan Bekasi)
Sekolah Tinggi Ilmu Ekonomi Indonesia – 2020 11
Tabel 4.4 Validity Test Result
Variabel Item code Rcount Rtable Result
Product P1 0.605 0.1966 Valid
P2 0.710 0.1966 Valid
P3 0.749 0.1966 Valid
P4 0.641 0.1966 Valid
P5 0.563 0.1966 Valid
Price H1 0.503 0.1966 Valid
H2 0.685 0.1966 Valid
H3 0.774 0.1966 Valid
H4 0.764 0.1966 Valid
Location/distribution
channel
D1 0.879 0.1966 Valid
D2 0.852 0.1966 Valid
D3 0.833 0.1966 Valid
Promotion PR1 0.702 0.1966 Valid
PR2 0.670 0.1966 Valid
PR3 0.611 0.1966 Valid
PR4 0.621 0.1966 Valid
PR5 0.737 0.1966 Valid
Costumer
Satisfaction
KP1 0.770 0.1966 Valid
KP2 0.860 0.1966 Valid
KP3 0.829 0.1966 Valid
KP4 0.791 0.1966 Valid
Customer Loyalty L1 0.877 0.1966 Valid
L2 0.838 0.1966 Valid
L3 0.716 0.1966 Valid
L4 0.661 0.1966 Valid
Source: Processed by researchers (2019)
4.6 Reliability Test
Syahrum and Salim (2012: 134) explain that reliability is used to determine the consistency of measuring instruments that usually use questionnaires. To determine whether it is reliable or not,
this study used limit of 0.6, means if the reliability is less than 0.6, it means that it is not good, is
acceptable if 0.7, and around or above 0.8 is good. The following results of data processing for all instrument is:
Tabel 4.5 Hasil Uji Reliabilitas Instrumen
Variabel Cornbach’s
Alpha Alpha Keputusan
Product (X1) 0.665 0.60 Reliabel
Price (X2) 0.624 0.60 Reliabel
Location/Distribution Channel (X3) 0.749 0.60 Reliabel
Promotion (X4) 0.688 0.60 Reliabel
Costumer Satisfaction (Y) 0.827 0.60 Reliabel
Costumer Loyalty (Z) 0.776 0.60 Reliabel
Source: Processed by researchers (2019)

Devy Kartika Rizki
Sekolah Tinggi Ilmu Ekonomi Indonesia - 2020 12
Based on the results of the statistical test above, it was found that the cronbach alpha value
exceeded the alpha value which is 0.60. It can be seen that the product variable (X1) which consists
of 5 points has a cronbach alpha value of 0.665, the price variable (X2) consisting of 4 points has a cronbach alpha value of 0.624, the distribution channel variable (X3) which consists of 3 points has
a cronbach alpha value 0.814, the promotion variable (X4) which consists of 5 proints has a
cronbach alpha value of 0.688, the customer satisfaction variable (Y) which consists of 4 points has a cronbach alpha value of 0.827, the customer loyalty variable (Z) which consists of 4 points has a
cronbach alpha value of 0.776. Thus, it can be stated that all instruments are reliable.
4.7 Path Analysis
4.7.1 Structural Equations 1
The first is to look at the influence of the independent variables, in this case is the marketing
mix which consists of four, product, price, location/distribution channel, and promotion. Dependent variable in this case is customer satisfaction. Based on the results assisted by SPSS 24, the
following results were obtained:
Tabel 4.6 Structural Equations1
Source: Processed by researchers (2019)
Referring to Standardized Coefficients Beta, it is known that the influence of the X1 variable
(product) on customer satisfaction is 0.602 or 60.2%, the X2 variable (price) on customer satisfaction is -0.010 or -1%, the X3 variable (location/distribution channel) on customer
satisfaction is 0.146 or 14.6%, and variable X4 (promotion) on customer satisfaction is 0.168 or
16.8%.
Tabel 4.7 Coefficient of Determination (R2) Structural Equations 1
Model Summary
Model R R Square Adjusted R Square
Std. Error of the Estimate
1 .706a .498 .477 1.975
a. Predictors: (Constant), Promotion, Distibution_Channel, Price, Product
Source: Processed by researchers (2019)
Referring to table 4.7, the score for the R square is known to be 0.477. This shows that X
(product, price, location/distribution channel, promotion) simultaneously effects on Y (customer
satisfaction) with 47.7%, while the remaining 52.3% is the influence of other factors. Thus, the path diagram of structural equation 1 can be illustrated:
Model
Standardized
Coefficients
Sig. Beta
1 Product .602 .000
Price -.010 .899
Location/distribution channel .146 .049
Promotion .168 .040
a. Dependent Variable: Customer_Satisfaction

THE INFLUENCE OF MARKETING MIX ON CUSTOMER LOYALTY THROUGH
CUSTOMER SATISFACTION AS AN INTERVENING VARIABLE (With Case Study
of Make Over Cosmetics Customers at Mall Metropolitan Bekasi)
Sekolah Tinggi Ilmu Ekonomi Indonesia – 2020 13
Gambar 4.1 Path Diagram of Structural Equation 1
The regression equation for the model above is Y = 0,602 X1 – 0,010 X2 + 0,146 X3 + 0,168 X4 +
0,523 e1
4.7.2 Structural Equations 2
The second is to see the influence of the independent variable which is X (marketing mix) on
the dependent variable which is Z (customer loyalty) through Y (customer satisfaction) as an intervening variable. Based on the results assisted by SPSS 24, the following results were obtained:
Tabel 4.8 Structural Equations 2
Source: Processed by researchers (2019)
Referring to table 4.8 in Standardized Coefficients Beta, the influence of variable X1
(product) on Z (customer loyalty) is 0.104 or 10.4%, variable X2 (price) is -0.018 or -1.8%,
Model
Standardized
Coefficients
Sig. Beta
1 Product .104 .198
Price -.018 .760
Location/distribution channel .070 .239
Promotion -.105 .111
Customer Satisfaction .776 .000
a. Dependent Variable: Customer_Loyalty

Devy Kartika Rizki
Sekolah Tinggi Ilmu Ekonomi Indonesia - 2020 14
variable X3 (location/distribution channel) is 0.070 or 7%, and X4 variable (promotion) is -0.105
or -10.5%. Meanwhile, Y (customer satisfaction) to Z (customer loyalty) is 0.776 or 77.6%.
Tabel 4.9 Coefficient of Determination (R2) Structural Equations 2
Model Summary
Model R R Square
Adjusted R
Square
Std. Error of the
Estimate
1 .829a .687 .670 1.636
a. Predictors: (Constant), Promotion, Distibution_Channel, Price,
Product, Costumer_Satisfaction
Source: Processed by researchers (2019)
Referring to table 4.9, the score of the R square value is known to be 0.670. This shows that
X (product, price, location/distribution channel, promotion) and Y (customer satisfaction)
simultaneously effect Z (customer loyalty) with 67%, while 33% is the influence of other factors. Then, the path diagram of structural equation 2 can be described as:
Gambar 4.2 Path Diagram of Structural Equation 2
The regression equation for the model above is Z = 0,104 X1 – 0,018 X2 + 0,070 X3 - 0,105 X4 +
0,330 e2
4.8 The result of Path Analysis
4.8.1 Direct effect
1) The influence of product on customer satisfaction X1 Y = 0.602 or 60.2%
2) The influence of price on customer satisfaction
X2 Y = -0.010 or -1%

THE INFLUENCE OF MARKETING MIX ON CUSTOMER LOYALTY THROUGH
CUSTOMER SATISFACTION AS AN INTERVENING VARIABLE (With Case Study
of Make Over Cosmetics Customers at Mall Metropolitan Bekasi)
Sekolah Tinggi Ilmu Ekonomi Indonesia – 2020 15
3) The influence of location/distribution channel on customer satisfaction
X3 Y = 0.146 or 14.6%
4) The influence of promotion on customer satisfaction X4 Y = 0.168 or 16.8%
5) The influence of product on customer loyalty
X1 Z = 0.104 or 10,4% 6) The influence of price on customer loyalty
X2 Z = -0.018 or -1.8%
7) The influence of location/distribution channel on customer loyalty
X3 Z = 0.070 or 7% 8) The influence of promotion on customer loyalty
X4 Z = -0,105 atau -10,5%
9) The influence of customer satisfaction on customer loyalty Y Z = 0,776 atau 77,6%
4.8.2 Indirect effect
1) The influence of the product on customer loyalty through customer satisfaction
X1 Y Z = (0.602 × 0.776) = 0.483 atau 48.3%
2) The influence of the price on customer loyalty through customer satisfaction
X2 Y Z = (-0.010 × 0.776) = -0.007 atau -0.7%. 3) The influence of the location/distribution channel on customer loyalty through customer
satisfaction
X3 Y Z = (0.146 × 0.776) = 0.113 atau 11.3% 4) The influence of the promotion on customer loyalty through customer satisfaction
X4 Y Z = (0.168 × 0.776) = 0.130 atau 13%
V. CONCLUSION AND RECOMMENDATION
5.1 Conclusion
1) The product directly had a significant effect with 60.2% on customer satisfaction. So,
60.2% of Make Over Cosmetics customer satisfaction at Metropolitan Mall Bekasi
was influenced by the product.
2) Price directly did not have a significant effect on customer satisfaction. So, price was
not a customer satisfaction factor for Make Over Cosmetics customers at
Metropolitan Mall Bekasi.
3) Location/distribution channel directly provided a significant effect with 14.6% on
customer satisfaction. Thus, 14.6% of Make Over Cosmetics customer satisfaction at
Metropolitan Mall Bekasi was influenced by the location/distribution channel.
4) Promotion directly had a significant effect of 16.8% on customer satisfaction. So,
16.8% of Make Over Cosmetics customer satisfaction at Metropolitan Mall Bekasi
was influenced by promotion.
5) Product directly did not have a significant effect on customer loyalty. So, product
was not a customer satisfaction factor for Make Over Cosmetics customers at
Metropolitan Mall Bekasi.
6) Price directly did not have a significant effect on customer satisfaction. So, price was
not a customer satisfaction factor for Make Over Cosmetics customers at
Metropolitan Mall Bekasi.

Devy Kartika Rizki
Sekolah Tinggi Ilmu Ekonomi Indonesia - 2020 16
7) Location/distribution channel directly did not have a significant effect on customer
satisfaction. So, location/distribution channel was not a customer satisfaction factor
for Make Over Cosmetics customers at Metropolitan Mall Bekasi.
8) Promotion directly did not have a significant effect on customer satisfaction. So,
promotion was not a customer satisfaction factor for Make Over Cosmetics
customers at Metropolitan Mall Bekasi.
9) Customer satisfaction had a significant effect on customer loyalty with 77.6%. So, it
can be concluded that customer satisfaction affects loyalty to Make Over Cosmetics
customers at Metropolitan Mall Bekasi.
10) Product through customer satisfaction indirectly had an effect on customer loyalty
with 48.3%. Thus, 48.3% of Make Over Cosmetics customer loyalty at Metropolitan
Mall Bekasi was influenced by the product through customer satisfaction.
11) Price indirectly did not have a significant effect on customer loyalty through
customer satisfaction as an intervening variable. So, price was not a customer loyalty
factor for Make Over Cosmetics customers at Metropolitan Mall Bekasi.
12) Location/distribution channel indirectly did not have a significant effect on customer
loyalty through customer satisfaction as an intervening variable. So,
location/distribution channel was not a customer loyalty factor for Make Over
Cosmetics customers at Metropolitan Mall Bekasi.
13) Promotion through customer satisfaction indirectly had an effect on customer loyalty
with 13%. Thus, 13% of Make Over Cosmetics customer loyalty at Metropolitan
Mall Bekasi was influenced by the promotion through customer satisfaction.
5.2 Recommendation
1) Maintaining product quality is important for the company because customer
satisfaction and loyalty are largely influenced by the product itself.
2) Ease of obtaining products is an important point for some customers. For this reason,
in a modern era like today, media platforms such as online shopping can be used to
reach customers who are not in big cities.
3) Social media platforms can be another facility to introduce, advertise, and keep
customers aware of products.