the influence of experiential marketing on loyalty and
TRANSCRIPT
Andalas Management Review (AMAR)Vol. 1, No. 1 (2015) 17-38© The Management Institute, Faculty of Economics, Andalas University
The Influence of Experiential Marketing on Loyalty and Customer Satisfaction
(The Case Study in the English Village in Pare, Kediri, East Java)
Nuri Purwanto1 STIE PGRI Dewantara Jombang, Jombang, Indonesia
MardiastutikSTIE PGRI Dewantara Jombang, Jombang, Indonesia
ABSTRACT
The research objective is to study the influence of experiential marketing on loyal-ty and customer satisfaction. The experiential marketing concept contains sense, feel, think, act and relate which became the predictor variable (X), customer satis-faction the intervening variable (Z), and loyalty variable the bound variable (Y). In this research, primary and secondary data were used. The primary data were obtained from many sources such as journals, books, magazines, and internet, while the primary data were obtained from questioners. The respondents were both male and female students learning in the English Village Pare, and have taken the course for two months. The number of sample respondents was 140 which were derived in non-random, while the data analysis method used path analysis by operating smart PLS Software. The validity and reliability of the data were examined before they were declared valid and reliable. From the results, it is found that experiential marketing variable influences customer satisfaction in spite of only sense, feel, and think dimensions. The influence is not only stuck on the satisfaction, yet from the satisfaction, there is a positive and significant influence on loyalty.Keyword: experiential marketing, loyalty, customer satisfaction
1 Corresponding author can be contacted via email: [email protected] and phone: (0321) 865180

AMAR Vol. 1, No. 1 (2015) 18
1. INTRODUCTION
Nowadays, Indonesia opens for any international cooperation as by the end of 2015 it is going to face the ASEAN Economic Community (AEC). This will definitely provide opportunities and challenges for school and university students, educators, and entrepreneurs. English is the most-commonly-used language as a mean of international communication. This is essential to master it well, both in oral and written forms. It is possible that the rapid technological development makes us more active in responding global information as an asset to fulfill the market needs. As a lingua franca, English is not only used for academic purpose which its mastery is limited to linguistic aspects, but also as a medium of global communication.
“English village” located in Tulungrejo village, Pare district, Kediri regency is a place to visit and to learn English. This is not an official village name, yet this is only an epithet given to areas along Anyelir Street, Brawijaya Street, and Kemuning Street in Singgahan village and Tulungrejo village, Pare district Kediri regency East Java province. These villages are scenic, placid, and cool areas far from the city crowd. Those who live in the areas are Javanese Indonesian, so it is not a place where the Britons live. With the fast-growing villages, this obviously entices hard competitions among such business doers alike.
Therefore, each institution must be able to create strategies to survive heighten competition. Today, the institutions’ orientation is changing from conventional approach to contemporary one. The conventional approach focuses on customer satisfaction, cost reduction, market place, and market research, while the contemporary one on customer loyalty, customer retention, zero defection, and lifelong customers, (Tjiptono, 2014). To answer the challenges, one of the strategies which can be used by marketing department is the experiential marketing, for this method does not only speak about how to sell products to customers, but also about explaining how to give experiential impression to customers. By applying the experiential marketing, producers or owners are able to develop the relations with the existing customers, attract potential customers, and create loyal customers, (Zena & Aswin, 2012). There are four types of experiences stated by Schmitt (1999) called as strategic experiences module which includes sense, feel, think, act and relate, and combination of the experiences are named experiential marketing. The application

Purwanto & Mardiastutik, The Influence of Experiential Marketing 19
of experiential marketing indirectly impacts on customer loyalty, but it has to go through the satisfaction variable as stated by Kotler (2003) the customer satisfaction must be there to make real the relation of customer loyalty to a company. It is supported by the research of Lin et al. (2009) visitor’s perception to the experiential marketing which shows a direct relation to customer satisfaction and an indirect relation to customer loyalty through customer satisfaction. Based on the problem stated above, the present study is intended to investigate how strong the influence of experiential marketing on loyalty and customer satisfaction.
2. THEORY
2.1. Experiential Marketing
Experiential Marketing is a marketing approach which involves customer’s emotion and feeling by creating so positive and unforgettable experiences that consumers use the products fanatically (Schimt in Alkilani ,2013). Moreover, he stated that experiences obtained by costumers involve the following dimensions:
1. Sense, related to verbal-visual styles and symbols which can create the impression totality. To create such a strong impression, whether it is via advertisements, packaging, or website, a marketer should select right colors compatible with his/her company’s profile. The color choice will have to be attractive to trigger customers’ attention. Besides, right style choices are also important. The combination of shapes, colors and other elements should form a variety of styles which are minimalistic, ornamental, dynamic, and static.
2. Feel, it is different to a sensory impression because this is strongly related to a person’s mood and emotion. It is not only about beauty, but also about mood and emotion that can bring happiness and sadness.
3. Think, by thinking, someone is able to stimulate his/her intellectuality and creativity.
4. Act, it is in relation to real attitudes and life style which are about how a person does something and expresses his/her life style. Act here encompasses real attitude and wide life style.
5. Relate, it is in relation to a person’s culture or a reference group that may form his/her social identity. A marketer is to be able to form
AMAR Vol. 1, No. 1 (2015) 20
social identity (generation, nationality, and ethnic) for its customers with products and services offered. A marketer can use cultural symbols on advertisement campaigns and web design identifying a certain group of customers.
A marketer should be careful in deciding an approach being used, for each approach has various impacts. By selecting a right approach for the products and services being sold, a customer will probably elicit experiences a marketer expected.
2.2. Customer Satisfaction
Engel, Blackwell, and Miniard (1990) stated that customer satisfaction is a post-sale evaluation in which the alternatives chosen are at least equal or even beyond customers’ expectation. Wilkie in Tjiptono (2000) suggests that customer satisfaction is an emotional respond to the evaluation of a product or service-consuming experience. Kotler (2003) stated that customer satisfaction is a person’s happy or upset feeling which emerges after having compared a perception to expectations over the performance or outcome of a product. Lupiyoadi (2001) confirmed that customer satisfaction is a level of emotion where someone utters the results of comparisons to an accepted and expected product or service performance.
Satisfaction is considerably the function of perception or impression over performance and expectation. If the performance is lower than expectation, a customer may be upset. However, if the performance exceeds expectations, a customer may be pleased and satisfied. Another point of view states that customer satisfaction is the function of differences between performance given and expectation. A customer may feel one of common satisfaction levels. If the performance meets the expectation, the customer feels satisfied, while if the performance exceeds the expectation, the customer may be happy or even very pleased (Kotler, 1994).
According to Day (in Tse and Walton, 1998) quoted by Tjiptono (2014) it was stated that satisfaction or dissatisfaction of a customer is the respond to the evaluation of incompatibility or disconfirmation felt between previous expectations (or other performance norms) and actual product performance. Customer satisfaction can relatively be achieved if no gap between perception and expectation (Tjiptono, 2014). The gap between expectation and perception over a company’s services can be

Purwanto & Mardiastutik, The Influence of Experiential Marketing 21
used to measure customer satisfaction. If the level of perception is smaller than the level of expectation means that customers are dissatisfied.
According to Tjiptono (2014), there were two types of customer satisfaction:
1. Cognitive Model
In this model, customer estimation is based on the difference between a group of relatively ideal combination for an individual and its perception about both the combination and actual attributes. In other words, the estimation is based on the ratio or differences between the ideal and actual,
2. Affective Model
This model states that individual customer estimation to a product or service is not merely based on rational calculations but also on subjective necessities.
2.3. Loyalty
Customer satisfaction does not present if costumers find better service provider, which make them turn to another distributor. Therefore, customer satisfaction should be in line with customer loyalty. According to Piotr in Zena (2012), it was indicated that a loyal costumer shows the following characteristics:
1. They spend money buying products or services form a company
2. They suggest other people buy products or services produced by the company
3. They believe that it is important to buy products or services from the company
Grandholt et al in Zena (2012) indicated that costumer loyalty consists of four indicator :
costumer repurchase intention, price tolerance, wilingnes to recommend a brand or company, and wilingness to cross purchase
2.4. Experiential marketing, job satisfaction, and loyalty
Marketers have particularly changed their concepts from the traditional concept which is “feature and benefit” creation to customer

AMAR Vol. 1, No. 1 (2015) 22
experience creation (Pine and Gilmore, 1998). Based on the construct examination, there is a relation between experiential marketing, brand image, experiential value, customer satisfaction, and behavioral intention (Huang, 2004). Lin et al .,(2009) stated that a visitor’s perception on experiential marketing shows direct relation to customer satisfaction, and indirect relation to customer loyalty based on customer satisfaction.
The findings are different from Alkilani (2013) in which only sense and feel experiences dimensions have a positive relation to customer satisfaction variable, while other dimensions namely feel, think, act and relate do not impact directly on customer satisfaction. In Wang and Chien’s research (2010), it was found that only sense stimulus, think stimulus, and relate stimulus that influence customer satisfaction, while feel stimulus and act stimulus are not significant. Chaudri and Holbrock in Zena (2012) mentioned that loyalty is formed by attitude loyalty and behavioral loyalty, and the explanations of the both dimensions are as follows: (1) attitude loyalty means to be loyal to attitude and to be tolerant to prices; (2) behavior loyalty means repeatedly purchasing and recommending products or companies.
Based on the problems above, there are some hypotheses :H1. Sense directly influences costumer satisfaction H2. Feel directly influences costumer satisfaction H3. Think directly influences costumer satisfaction H4. Act directly influences costumer satisfaction H5. Costumer satisfaction directly influences customer satisfaction H6. Experiental marketing indirectly influences loyalty variabel through customer satisfaction variabel

Purwanto & Mardiastutik, The Influence of Experiential Marketing 23
3. RESEARCH METHOD
3.1. Sample
According to Arikunto (2003), it was stated that sample is a part of population (some or representatives being researched). Research sample is some of the data sources taken, and it can represent the whole population. Sugiyono (2004) explained that sample is some of the number and characteristics which belong to population. In this research, the sampling technique used is non-probability sampling (non-random sampling acquisition) through quota sampling technique. The number of samples used in this research is 140.
Table 1 Demographic Characteristic of the Sample
Table 1. Demographic Characteristic of the sample
Characteristic Frequency PercentageGender
• Male • Female
Total
5090140
35,71 %64,28%100 %
Education • High school• College
Total
8060140
57, 14 %42, 85 %100 %
Age • 25 – 30• 17 – 22
Total
25115140
17,86 %82,14 %100 %
3.2. Measurement
Experiental Marketing is measured through five dimentions based on the research conducted by Lin et al (2009)
1. Sense experience
a. I think that the class designs in the English Village are very comfortable

AMAR Vol. 1, No. 1 (2015) 24
b. I think that the learning areas in the English Village are very comfortable
c. I think that the learning facilities in the English Village are very comfortable
2. Feel experience
a. I pay close attention to the teaching methods of the tutors in the English Village
b. I think that both the tutors and staffs in the English Village are very friendly
c. I think that the learning atmosphere in the English Village is very comfortable
d. I think that I feel at home in the English Village
e. I think that both the society and tutors in the English Village are very friendly
3. Think experience
a. The tutors‘ teaching methods make me think about the materials taught
b. The unique methods inspire me to learn
c. The learning experiences in the English Village turn my point of view in learning English
d. Both the tutors and staffs in the English Village make me vigorous in learning English
4. Act experience
a. I would like to share my learning experiences with friends and family
b. My learning experiences in the English Village turn my English-learning habbits
c. I will come to learn in the English Village in the next opportunity
d. Coming to the English Village broadens my English knowledge
Purwanto & Mardiastutik, The Influence of Experiential Marketing 25
The customer satisfaction variable is measured through five items based on Lin et al‘s research (2009) :
1. I feel satisfied with the facilities provided by the institution in the English Village
2. I feel satisfied with the services provided by the staffs in the English Village
3. I feel satisfied with the methods used by the tutors in the English Village
4. I feel satisfied with the learning atmosphere in the English Village
5. I think that the learning experiences in the English Village are more than I expected
The loyalty variable is measured through four items based on Chaudry and Holborck in Zena (2012) :
1. I am not interested to learn English in other places but in the English Village
2. I will not be interested to move to other places though the course fees in the English Village are raised
3. I often give friends and family some information of the service and accesses of the English courses
4. I will come back again to learn English in the English Village
3.3. Analysis
The data are analized using Software smart PLS which include descriptive statistics such as the frequency and percentage to describe characteristics of the respondents. Hypotheses examination uses path analysis. Of the exam, the direct influence of the experiental marketing on the customer satisfaction, the indirect influence on the loyalty through the customer satisfaction variable and the direct influence of the customer satisfaction variable on loyalty will be found.

AMAR Vol. 1, No. 1 (2015) 26
4. RESULTS
4.1. Data Analysis and Hypotheses Examination
Linear exam or structural exam was administered to know the relation among construct, significance value, and R-square of the research model. The structural model was evaluated using R-square for dependent construct t-test and for significance of structural path of coefficient parameter. This research uses the Partial Least Square method (PLS) to know the structural relation.
4.2. Convergent Validity Evaluation
It was done by looking at the outer loading value of each indicator. If the value is greater than 0.5, it can be interpreted that the indicator is valid.
Table 2. Outer loading value of the variable Sense (X1)
Original Sample
(O)
Sample Mean (M)
Standard Deviation (STDEV)
Standard Error
(STERR)
T Statis-tics (|O/STERR|)
x1.1 <- sense 0.781 0.779 0.062 0.062 12.664
x1.2 <- sense 0.746 0.741 0.063 0.063 11.816
x1.3 <- sense 0.879 0.882 0.025 0.025 34.694
Table 2 explains the outer loading value of the variable Sense (X1) where the value of indicator X1.1 was 0.781, indicator X1.2 was 0.746, and indicator X1.3 was 0.879. It showed that the outer loading value of the indicators were greater than 0.5, so it could be stated that the variable sense indicator (X1) had been constructed and explained well by its indicators or convergent valid.
Table 3 explains about the outer loading value of the variable Feel (X2) where the value of indicator X2.1 was 0.618, indicator X2.2 was 0.734, and indicator X2.3 was 0.797, indicator X2.4 was 0.767, and X2.5 was 0.549. It showed that the outer loading value of the indicators were greater than 0.5 so it could be stated that the variable Sense indicator (X1) had been constructed and explained well by its indicators or convergent valid.

Purwanto & Mardiastutik, The Influence of Experiential Marketing 27
Table 3. Outer loading value of the variable Sense (X1)
Original Sample
(O)
Sam-ple
Mean (M)
Standard Deviation (STDEV)
Standard Er-ror (STERR)
T Statis-tics (|O/STERR|)
x2.1 <- feel 0.618 0.609 0.127 0.127 4.878
x2.2 <- feel 0.734 0.732 0.050 0.050 14.575
x2.3 <- feel 0.797 0.798 0.042 0.042 19.085
x2.4 <- feel 0.767 0.758 0.055 0.055 13.902
x2.5 <- feel 0.549 0.550 0.105 0.105 5.254
Table 4. Outer loading value of the Variable Think (X3)
Original Sample
(O)
Sample Mean (M)
Standard Deviation (STDEV)
Standard Error
(STERR)
T Statis-tics (|O/STERR|)
x3.1 <- think
0.537 0.524 0.141 0.141 3.804
x3.2 <- think
0.776 0.772 0.065 0.065 12.022
x3.3 <- think
0.629 0.612 0.109 0.109 5.759
x3.4 <- think
0.756 0.744 0.078 0.078 9.692
Table 4 explains about the outer loading value of the variable Think (X3) where the value of indicator X3.1 was 0.537, indicator X3.2 was 0.776, and indicator X3.3 was 0.629, and indicator X3.4 was 0.756. it shows that the outer loading value of the indicators were greater than 0.5, so it could be stated that the variable Think indicator (X1) had been constructed and explained well by its indicators or convergently valid.

AMAR Vol. 1, No. 1 (2015) 28
Table 5. Outer Loading Variable Act (X4)
Original Sample
(O)
Sample Mean (M)
Standard Deviation (STDEV)
Standard Error
(STERR)
T Statis-tics (|O/STERR|)
x4.1 <- act 0.476 0.453 0.177 0.177 2.680
x4.2 <- act 0.732 0.722 0.096 0.096 7.655
x4.3 <- act 0.630 0.621 0.147 0.147 4.292
x4.4 <- act 0.765 0.748 0.085 0.085 9.016
Table 5 explains about the outer loading value of the variable Act (X4) where the value of indicator X4.1 was 0.476, indicator X4.2 was 0.732, and indicator X4.3 was 0.630, and indicator X4.4 was 0.756. It showed that the outer loading value of the indicators were greater than 0.5, except X4.1, so it could be stated that the variable Act indicator (X4) had been constructed and explained well by its indicators or convergent valid.
Table 6. Outer Loading Variable Act (X4)
Original Sample
(O)
Sample Mean (M)
Standard Deviation (STDEV)
Standard Error
(STERR)
T Statis-tics (|O/STERR|)
z1 <- CS 0.690 0.677 0.128 0.128 5.372
z2 <- CS 0.805 0.805 0.041 0.041 19.672
z3 <- CS 0.734 0.735 0.058 0.058 12.690
z4 <- CS 0.802 0.805 0.044 0.044 18.209
z5 <- CS 0.632 0.634 0.098 0.098 6.465
Table 6 explains about the outer loading value of the variable Customer Satisfaction (Z) where the value of indicator Z.1 was 0.690, indicator Z.2 was 0.805, and indicator Z.3 was 0.734, and indicator Z4 was 0.802. it showed that the outer loading value of the indicators were greater than 0.5, so it could be stated that the variable Customer Satisfaction (Z) had been constructed and explained well by its indicators or convergent valid.

Purwanto & Mardiastutik, The Influence of Experiential Marketing 29
Table 7. Outer Loading Variable Act (X4)
Original
Sample (O)
Sam-ple
Mean (M)
Standard Deviation (STDEV)
Standard Error
(STERR)
T Statis-tics (|O/STERR|)
y1 <- Loyalty 0.630 0.613 0.191 0.191 3.297
y2 <- Loyalty 0.496 0.494 0.159 0.159 3.118
y3 <- Loyalty 0.754 0.747 0.068 0.068 11.056
y4 <- Loyalty 0.698 0.675 0.109 0.109 6.373
Table 7 explains about the outer loading value of the variable Loyalty (X1) where the value of indicator Y.1 was 0.630, indicator Y.2 was 0.496, and indicator Y.3 was 0.754, and indicator Y.4 was 0.698. It showed that the outer loading value of the indicators were greater than 0.5 except Y.2, so it could be stated that the variable Sense indicator (X1) had been constructed and explained well by its indicators or convergent valid.
4.3. Discriminant Validity Evaluation
This evaluation was done using the value of square root of average variance extracted (AVE) and the value of composite reliability. The AVE model evaluation was done by comparing the value of square root AVE to the standard of comparison value. If the square root AVE is greater than 0.5, the discriminant validity is attained. Based on table 4.6, it showed that the square root AVE value in variable Sense (X1) was 0.735, variable Feel (X2) was 0.652, variable Think (X3) was 0.660, variable Act (X4) was 0.699, variable Customer Satisfaction (Z) was 0.804, and variable Loyalty (Y) is 0.681 which was greater than 0.5, so it could be said that the model was good according to discriminant validity.
The composite reliability model evaluation was done to determine if construct has high reliability or not. The composite reliability value was greater than 0.6 which stated that the construct is reliable. Based on table 4.6, the composite reliability value in variable Sense (X1) was 0.854, variable Feel (X2) was 0.743, variable Think (X3) was 0.750, variable Act (X4) was 0.825, variable Customer satisfaction (Z) was 0.845, and variable Loyalty (Y) is 0.772 which was greater than 0.6, and it could be said the latent variable had high reliability.

AMAR Vol. 1, No. 1 (2015) 30
Table 8. Outer Loading Variable Act (X4)
Square Root Average Variance Extracted
(AVE)
Composite Reliabil-ity
(CR)Sense (X1) 0.735 0.854
Feel (X2) 0.652 0.743
Think (X3) 0.660 0.750
Act (X4) 0.699 0.825
Customer Satisfaction (Z) 0.804 0.845
Loyalty (Y) 0.681 0.772
4.4. Structural Model Measurement
After the estimated model had met the criteria of convergent validity and discriminant validity, the structural (inner model) model examination was conducted. The inner model is valued based on the relation between the latent construct and coefficient parameter path estimation result and significance level (Ghozali, 2008).
Table 9. R-square
R Square (R2)Customer Satisfaction (Z) 0.652
Loyaly (Y) 0.205
Coefficient determination (R-square) obtained from the models of variable Sense (X1), Feel (X2), Think (X3), and Act (X4) against variable Customer Satisfaction (Z) is 0.652, so it can be explained that variable Customer Satisfaction (Z) was influenced by variable Sense (X1), Feel (X2), Think (X3), and Act (X4) as to 65%, and 34% by other variables outside the research.
Coefficient determination (R-square) obtained from the models of variable Customer Satisfaction (Z) against variable Loyalty (Y) was 0.205, so it could be explained variable Loyalty (Y) was influenced by variable Customer Satisfaction (Z) as to 20.5%, and 79.95% by other variables outside the research.
Purwanto & Mardiastutik, The Influence of Experiential Marketing 31
4.5. Hypotheses Testing
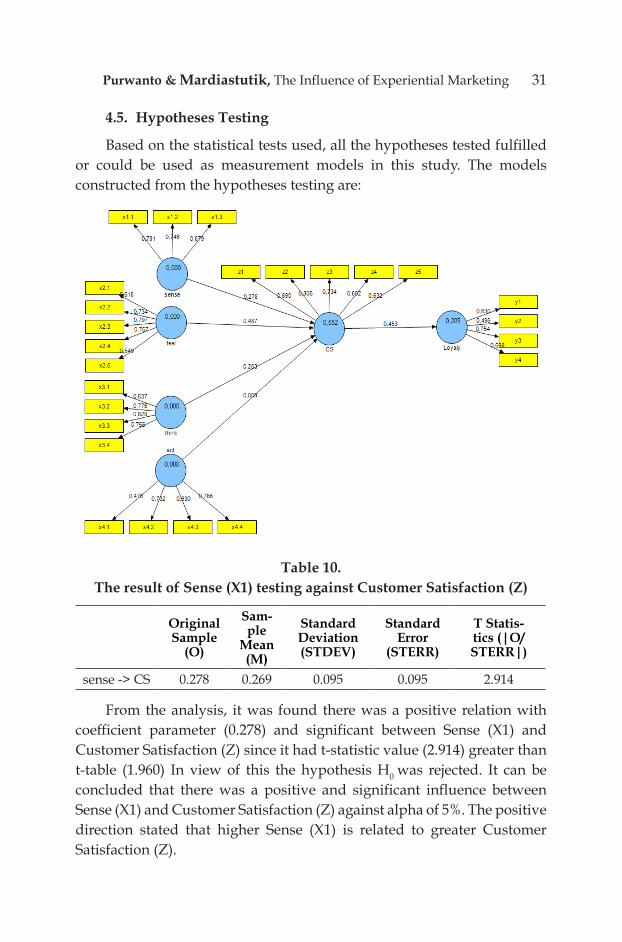
Based on the statistical tests used, all the hypotheses tested fulfilled or could be used as measurement models in this study. The models constructed from the hypotheses testing are:
Table 10.The result of Sense (X1) testing against Customer Satisfaction (Z)
Original Sample
(O)
Sam-ple
Mean (M)
Standard Deviation (STDEV)
Standard Error
(STERR)
T Statis-tics (|O/STERR|)
sense -> CS 0.278 0.269 0.095 0.095 2.914
From the analysis, it was found there was a positive relation with coefficient parameter (0.278) and significant between Sense (X1) and Customer Satisfaction (Z) since it had t-statistic value (2.914) greater than t-table (1.960) In view of this the hypothesis H0 was rejected. It can be concluded that there was a positive and significant influence between Sense (X1) and Customer Satisfaction (Z) against alpha of 5%. The positive direction stated that higher Sense (X1) is related to greater Customer Satisfaction (Z).

AMAR Vol. 1, No. 1 (2015) 32
Table 11.Testing of Hypothesis Feel (X2) against Customer Satisfaction (Z)
Original Sample
(O)
Sam-ple
Mean (M)
Standard Deviation (STDEV)
Standard Error
(STERR)
T Statis-tics (|O/STERR|)
feel -> CS 0.487 0.492 0.095 0.095 5.104
From the analysis, it was found there was a positive relation with coefficient parameter (0.487) and significant between Feel (X2) and Customer Satisfaction (Z) since it had t-statistic value (5.104) greater than t-table (1,960), so hypothesis H0 was rejected and it could be concluded that there was a positive and significant influence between Feel (X2) and Customer Satisfaction (Z) against alpha of 5%. The positive direction stated that higher Feel (X2) corresponds to greater Customer Satisfaction (Z).
Table 12.The testing of Hypothesis Think (X3) against Customer Satisfaction
(Z)
Original Sample
(O)
Sam-ple
Mean (M)
Standard Deviation (STDEV)
Standard Error
(STERR)
T Statis-tics (|O/STERR|)
think -> CS 0.203 0.192 0.080 0.080 2.532
From the analysis, it was found there was a positive relation with coefficient parameter (0.203) and significant between Think (X3) and Customer Satisfaction (Z) since it had t-statistic value (2.532) greater than t-table (1,960), so hypothesis H0 was rejected and it could be concluded that there was a positive and significant influence between Think (X3) and Customer Satisfaction (Z) against alpha of 5%. The positive direction stated that the higher Think (X3) corresponds to the greater Customer Satisfaction (Z).
From the analysis, it was found there was a negative relation with coefficient parameter (-0.008) but not significant between Act (X4) and Customer Satisfaction (Z)since it had t-statistic value (0.113) smaller than t-table (1.960), so hypothesis H0 was accepted and it could be concluded that there was a negative but not significant influence between Act (X4) and Customer Satisfaction (Z) against alpha of 5%. The negative direction

Purwanto & Mardiastutik, The Influence of Experiential Marketing 33
stated that the higher Act (X4) was, the lower Customer Satisfaction (Z). However, this influence was neglected since it was not significant in influencing Customer Satisfaction (Z).
Table 13The testing of Hypothesis Act (X4) against Customer Satisfaction (Z)
Original Sample
(O)
Sam-ple
Mean (M)
Standard Deviation (STDEV)
Standard Error
(STERR)
T Statis-tics (|O/STERR|)
act -> CS -0.008 0.015 0.071 0.071 0.113
Table 14.The testing of Hypothesis Customer Satisfaction (Z) against Loyalty
(Y)
Orig-inal
Sample (O)
Sample Mean (M)
Standard Deviation (STDEV)
Standard Er-ror (STERR)
T Statis-tics (|O/STERR|)
CS -> Loyalty 0.453 0.471 0.075 0.075 6.019
From the analysis, it was found there was a positive relation with coefficient parameter (0.453) and significant between Customer Satisfaction (Z) and Loyalty (Y)since it had t-statistic value (6.019) greater than t-table (1,960), so hypothesis H0 was rejected and it could be concluded that there was a positive and significant influence between Customer Satisfaction (Z) and Loyalty (Y) against alpha of 5%. The positive direction stated that the higher Customer Satisfaction (Z) is related to the greater Loyalty (Y).
Table 15. Testing of Hypothesis Sense(X1) against Loyalty (Y)
Orig-inal
Sample (O)
Sam-ple
Mean (M)
Standard Deviation (STDEV)
Standard Error
(STERR)
T Statis-tics (|O/STERR|)
Sense -> Loyalty 0.126 0.126 0.046 0.046 2.709
From the analysis, it was found there was a positive relation with coefficient parameter (0.126) and significant between Sense (X1) and

AMAR Vol. 1, No. 1 (2015) 34
Loyalty (Y) since it had t-statistic value (2.709) greater than t-table (1,960), so hypothesis H0 was rejected and it could be concluded that there was a positive and significant influence between Sense (X1) and Loyalty (Y) against alpha of 5%. The positive direction stated that the higher Sense (X1) was, the greater Loyalty (Y) indirectly through Customer Satisfaction (Z).
Table 16.Testing of Hypothesis Feel (X2) against Loyalty (Y)
Original Sample
(O)
Sample Mean (M)
Standard Deviation (STDEV)
Standard Error
(STERR)
T Statis-tics (|O/STERR|)
feel -> Loyaly 0.221 0.232 0.059 0.059 3.739
From the analysis, it was found there was a positive relation with coefficient parameter (0.221) and significant between Feel (X2) and Loyalty (Y) since it had t-statistic value (3.739) greater than t-table (1,960), so hypothesis H0 was rejected and it could be concluded that there was a positive and significant influence between Feel (X2) and Loyalty (Y) against alpha of 5%. The positive direction stated that the higher Sense Feel (X2), the greater Loyalty (Y) indirectly through Customer Satisfaction (Z) was.
Table 17.The testing of Hypothesis Think (X3) against Loyalty (Y)
Original Sample
(O)
Sample Mean (M)
Standard Deviation (STDEV)
Standard Error
(STERR)
T Statis-tics (|O/STERR|)
think -> Loyaly 0.092 0.090 0.041 0.041 2.257
From the analysis, it was found there was a positive relation with coefficient parameter (0.092) and significant between Think (X3) and Loyalty (Y) since it had t-statistic value (2.257 greater than t-table (1,960), so hypothesis H0 was rejected and it could be concluded that there was a positive and significant influence between Think (X3) and Loyalty (Y) against alpha of 5%. The positive direction stated that the higher Sense Think (X3), the greater Loyalty (Y) indirectly through Customer Satisfaction (Z) was.
Purwanto & Mardiastutik, The Influence of Experiential Marketing 35
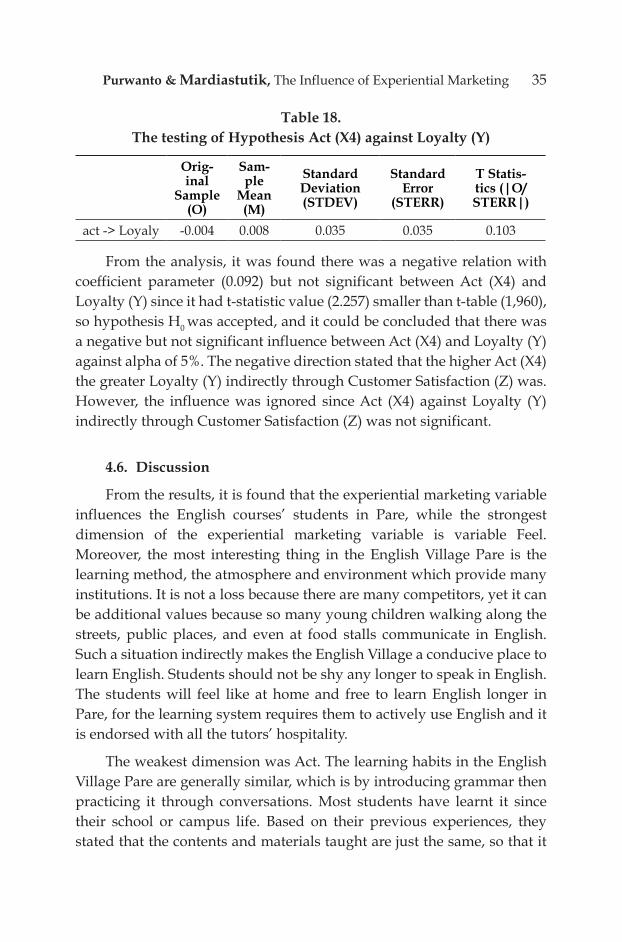
Table 18.The testing of Hypothesis Act (X4) against Loyalty (Y)
Orig-inal
Sample (O)
Sam-ple
Mean (M)
Standard Deviation (STDEV)
Standard Error
(STERR)
T Statis-tics (|O/STERR|)
act -> Loyaly -0.004 0.008 0.035 0.035 0.103
From the analysis, it was found there was a negative relation with coefficient parameter (0.092) but not significant between Act (X4) and Loyalty (Y) since it had t-statistic value (2.257) smaller than t-table (1,960), so hypothesis H0 was accepted, and it could be concluded that there was a negative but not significant influence between Act (X4) and Loyalty (Y) against alpha of 5%. The negative direction stated that the higher Act (X4) the greater Loyalty (Y) indirectly through Customer Satisfaction (Z) was. However, the influence was ignored since Act (X4) against Loyalty (Y) indirectly through Customer Satisfaction (Z) was not significant.
4.6. Discussion
From the results, it is found that the experiential marketing variable influences the English courses’ students in Pare, while the strongest dimension of the experiential marketing variable is variable Feel. Moreover, the most interesting thing in the English Village Pare is the learning method, the atmosphere and environment which provide many institutions. It is not a loss because there are many competitors, yet it can be additional values because so many young children walking along the streets, public places, and even at food stalls communicate in English. Such a situation indirectly makes the English Village a conducive place to learn English. Students should not be shy any longer to speak in English. The students will feel like at home and free to learn English longer in Pare, for the learning system requires them to actively use English and it is endorsed with all the tutors’ hospitality.
The weakest dimension was Act. The learning habits in the English Village Pare are generally similar, which is by introducing grammar then practicing it through conversations. Most students have learnt it since their school or campus life. Based on their previous experiences, they stated that the contents and materials taught are just the same, so that it

AMAR Vol. 1, No. 1 (2015) 36
was not considered extraordinary. The average periods of time offered by most of the institutions in Pare are 6 months the longest and 2 weeks the shortest. That is relatively sufficient for the students to learn. Based on the findings, the hypotheses of Alkilani’s (2013) only sense and feel experiences dimensions have a positive relation with customer satisfaction dimension, while the other dimensions which are feel, think, act and relate do not indirectly influence variable customer satisfaction.
From the results, it is found that only some experiential marketing variable namely sense, feel, and think dimensions influence customer satisfaction . The influence is not only stuck on the satisfaction. Furthermore satisfaction has positive and significant influence on loyalty. The findings are in line with the previous research which stated that customer satisfaction has to be in line with customer loyalty (Piotr in Zena, 2012)
5. CONCLUSION
The main objective of present study is to investigate the influence of experiential marketing on loyalty and customer satisfaction. From the four dimensions proposed, there are only Act dimension which does not influence customer satisfaction. The findings interestingly shows that not all dimensions of experiential marketing (Act, Sense, Feel, Relate and Act) influence customer satisfaction. The findings are useful for marketing service providers as a deservedly-discussed phenomena depiction from the marketing side. The weaknesses of this research are the small number of sample proposed and not all dimensions of experiential marketing are tested. This research only tests act, sense, feel and act dimensions without using related dimension. It is hoped the future research will be able to use all the complete variable dimensions in other settings.
REFERENCES Alkilani, K., Ling, K. C., & Abzakh, A. A. (2013). The Impact of Experiental
Marketing and Customer Satisfaction on Customer Commitment in the World of Social Networks. Asian Social Science, 262-269.
Arikunto, S. (2006). Prosedur Penelitian Suatu Pendekatan Praktik. Jakarta: Rineka Cipta.
Assael, H. (1998). Consumer Behaviour and Marketing Action. New York: International Thomson Publishing.

Purwanto & Mardiastutik, The Influence of Experiential Marketing 37
Chaudhuri, A., & Holbroock, M. B. (2001). The Chain of Effects From Brand Trust and Brand Affect to Brand Performance: The Role of Brand Loyalty . Journal of Marketing, 81-93.
Ferdinands, A. (2002). Structural Equation Modeling dalam Penelitian Manajemen Aplikasi Model-model Rumit dalam Penelitian untuk Tesis s-2 dan Disertasi s-3 . Semarang : BP Universitas Diponegoro.
Ghozali, I. (2008). Structural Equation Modeling Metode Alternatif dengan Partial Least Square.Semarang: BP Universitas Diponegoro
Kotler, P. (2003). Marketing Management . New Jersey: Prentice Hall.Lin, K. M., Chang, C. M., Lin, Z. P., Tseng, M. L., & Lan , L. W. (2009).
Application of Experiental Marketing Strategy to Indentify Factors Affecting Guests’ Leisure Behavior in Taiwan Hot Springs Hotel. Wseas Transcation on Business and Economics, 229-237.
Rohman , F. (2009). Peran Nilai Hedonik Konsumsi dan Reaksi Impulsif sebagai Mediasi Pengaruh Faktor Situasional Terhadap Keputusan Pembeli Impulsif di Butik kota MALANG. Desertasi Universitas Brawijaya Malang.
Schmitt, B. (1999). Journal of Marketing Management , 15-53.Solimun. (2002). Multivariat Analysis Structural Equation Modeling (SEM)
Lisrel dan Amos . malang : Universitas Negeri Malang.Sugiyono. (2005). Metode Penelitian Bisnis . Bandung: CV Alfabeta.Tjiptono, F. (2014). Pemasaran Jasa Prinsip,Penerapan dan Penelitian .
Yogyakarta: CV Andi Offset.Wang, C. Y., & Lin, C. H. (2010). A Study of The Effect of Tv Drama on
Relationships Among Tourists’ Experiental Marketing, Experiental Value and Satisfaction. International Journal of Organizational Innovation, 107-121.
Zena, P. A., & Hadisumarto, A. D. (2012). The Study of Relationship among Experiental Marketing, Service Quality, Costumer Satisfaction, and Costumer Loyalty. ASEAN Marketing Journal, 37-44.
