the influence of ipr on the offshoring of innovation
TRANSCRIPT

The influence of IPR on the offshoring of innovation
activities: governance choices, and location strategies
adopted by MNCs in China
A thesis submitted to The University of Manchester for the degree of
Doctor of Philosophy
in the Faculty of Humanities
2019
Jie Hong
Alliance Manchester Business School
University of Manchester
2
List of contents
List of contents ............................................................................................................. 2
List of figures ............................................................................................................... 5
List of tables ................................................................................................................. 8
List of abbreviations ................................................................................................... 10
Abstract ...................................................................................................................... 12
Declaration ................................................................................................................. 13
Copyright statement .................................................................................................... 14
Acknowledgement ...................................................................................................... 15
Chapter 1 Introduction ................................................................................................ 16
1.1 Offshoring business services .............................................................................. 16
1.2 Factors behind offshoring decisions ................................................................... 19
Chapter 2 Positioning and overview of the three research papers ................................. 23
2.1 Why China? ....................................................................................................... 23
2.2 Paper 1: The evolution of the Chinese IPR system: Phases of change and impact
on innovation activities ............................................................................................ 27
2.3 Paper 2: The influence of the institutional environment in host countries on
offshore governance choice and business outcomes ................................................. 29
2.4 Paper 3: Why do multinational firms locate R&D to China? An analysis of the
determinants of location strategies ........................................................................... 31
2.5 The Overall Research Framework of the Thesis ................................................. 33
Chapter 3: The evolution of the Chinese IPR system: Phases of change and impact on
innovation activities .................................................................................................... 35
3.1 Introduction ....................................................................................................... 35
3.2 The IP systems in China .................................................................................... 38
3.2.1 Administrative track .................................................................................... 38
3.2.2 The judicial track ........................................................................................ 41
3.3 The evolution of Chinese IPR related laws......................................................... 43
3.3.1 Legislative guidance.................................................................................... 44
3.3.2 An overview of evolutionary changes in the Chinese IP system ................... 45
3.3.3 First wave of revisions (1990s) .................................................................... 52
3.3.4 Second wave of revisions (2000s) ............................................................... 54
3.3.5 Third wave of revisions (since 2008) ........................................................... 60
3.4 IP protection enforcement and IP activities in China .......................................... 65

3
3.4.1 IP protection enforcement in China ............................................................. 66
3.4.2 IP activities in China: patent application and grant, trademark registration .. 75
3.5. Discussion and Conclusion ............................................................................... 83
References ............................................................................................................... 88
Appendix A1 A brief summary of the key aspects of IP law have been revised ........ 92
Appendix A2 Utility model patents and design patents application and granting .... 101
Chapter 4: The influence of the institutional environment in host countries on
innovation offshore governance choice and business outcomes ................................. 107
4.1 Introduction ..................................................................................................... 107
4.2 Offshoring business services and governance choices ...................................... 110
4.2.1 Factors influencing offshore governance choices ....................................... 111
4.2.2 The pros and cons of different offshore governance modes........................ 114
4.2.3 Contribution to the literature and research questions .................................. 115
4.3 Data ................................................................................................................. 116
4.4 Factors influencing offshoring (Descriptive data analysis results) .................... 119
4.4.1 Factors driving offshoring ......................................................................... 120
4.4.2 Risk factors affecting offshoring ............................................................... 122
4.4.3 Outcomes achieved via offshoring ............................................................. 124
4.5 Regression results ............................................................................................ 126
4.5.1 First stage: governance choice ................................................................... 127
4.5.2 Second stage: offshore outcomes ............................................................... 131
4.5.3 First stage results: Factors behind offshore governance choices ................. 135
4.5.4 Second stage results: The relationships between the governance
misalignment, the institutional factors, and the achievement of certain outcomes 136
4.5.5 Robustness Checks .................................................................................... 146
4.6 Discussion and conclusion ............................................................................... 147
References ............................................................................................................. 153
Appendix B1: Robustness check ............................................................................ 160
Chapter 5: Why do multinational firms locate R&D to China? An analysis of the
determinants of location strategies ............................................................................ 165
5.1 Introduction ..................................................................................................... 165
5.2 Developing a conceptual framework for MNCs location strategies .................. 167
5.2.1 Location strategies .................................................................................... 167
5.2.2 The role of resources and institutions in locations strategies: a conceptual
framework ......................................................................................................... 169
5.3 Sampling and data ........................................................................................... 173
4
5.4 The evolution of the choices of different location strategies MNCs have adopted
in China................................................................................................................. 177
5.5 Influencing factors and location strategies ....................................................... 183
5.5.1 Variables ................................................................................................... 183
5.5.2 What factors affect the location strategies that firms adopted in China? ..... 187
5.5.3 Robustness Check ..................................................................................... 194
5.6 Discussion and conclusions ............................................................................. 196
References ............................................................................................................. 201
Appendix C1: The data details of share of location strategies (4 intervals) ............. 208
Appendix C2: The share of location strategies (5 intervals) ................................... 209
Appendix C3: The share of location strategies (yearly) .......................................... 211
Appendix C4: Exploitative patent vs. explorative patent ........................................ 213
Appendix C5: Fixed effects regression results of pharmaceutical industry and
electronics industry respectively ............................................................................ 217
Chapter 6 Conclusions .............................................................................................. 218
6.1 Summary of findings ....................................................................................... 218
6.1.1 Summary of findings: The evolution of the Chinese IPR system - Phases of
changes and impact on innovation and international business ............................. 219
6.1.2 Summary of findings: The influences that institutional environment in host
countries have on the choice of offshore governance mode and firm performance
.......................................................................................................................... 220
6.1.3 Summary of findings: Why do multinational firms locate R&D to China? An
analysis of the determinants of location strategies .............................................. 222
6.2 Contributions and implications ........................................................................ 225
6.3 Limitations and future research ........................................................................ 227
References ............................................................................................................. 230
Total word count (including footnotes but excluding references and appendices): 53,724

5
List of figures
Figure 1.1: 2017 A.T. Kearney Global Services Location Index - Top attractive
destinations for global service offshoring (Gott & Sethi, 2017). .................................. 18
Figure 2.1: GDP (constant 2010 billion US$) of China, Brazil, India, Russia, UK, and
US from 1995 to 2017. ................................................................................................ 24
Figure 2.2: GDP per capita (constant 2010 US$) of China, Brazil, India, Russia, UK,
and US from 1995 to 2017. ......................................................................................... 24
Figure 2.3: Enrolment in tertiary education (all programmes) from 1995-2016. ........... 25
Figure 2.4: FDI net inflows (BoP, current million US$) of China, Brazil, India, Russia,
UK, and US from 1990 to 2017. .................................................................................. 26
Figure 2.5: Positioning of the three papers .................................................................. 34
Figure 3.1: The main responsibilities of the major administrative bodies involved in IP
activities. .................................................................................................................... 40
Figure 3.2: Judicial system in China. ........................................................................... 42
Figure 3.3: The legislative system of China. ................................................................ 45
Figure 3.4: Number of patent dispute cases received by SIPO from 1997-2017. .......... 66
Figure 3.5: Number of counterfeit patent cases and cases of passing off others’ patents
handled by SIPO from 1988-2017. .............................................................................. 67
Figure 3.6: Number of trademark infringement cases investigated by SAIC from 1997-
2016. ........................................................................................................................... 69
Figure 3.7: Total value of fines imposed by SAIC on trademark infringement cases from
1997-2016 (in million £). ............................................................................................ 70
Figure 3.8: Average value of fines imposed by SAIC on trademark infringement case
from 1997-2016 (in £). ................................................................................................ 70
Figure 3.9: Number of new IPR-related civil cases of first instance accepted by local
people’s courts from 2004-2016. ................................................................................. 71
Figure 3.10: Number of new IPR-related civil cases of first instance concluded by local
people’s courts from 2004-2016, by the origin of interested parties. ............................ 72
Figure 3.11: Number of new IPR-related civil cases of first instance concluded by local
people’s courts from 2004-2016, involving foreign interested parties (excluding Hong
Kong, Macao, and Taiwan). ........................................................................................ 72
Figure 3.12: Number of new IPR-related criminal cases of first instance concluded by
local people’s courts from 2004-2016, by the types of act. .......................................... 74
Figure 3.13: Number of suspects are sentenced in the new IPR-related criminal cases of
first instance concluded by local people’s courts from 2004-2016, by the types of act. 74
Figure 3.14: Total number of invention patents applications from 1995-2016 in China.
................................................................................................................................... 76

6
Figure 3.15: Total number of invention patents applications by foreign applicants from
1995-2016 in China..................................................................................................... 77
Figure 3.16: Number of invention patents applications by foreign applicants from four
different countries and regions from 1995-2016 in China. ........................................... 77
Figure 3.17: Total number of invention patents granted from 1995-2016 in China. ..... 78
Figure 3.18: Total number of invention patents granted to foreign applicants from 1995-
2016 in China. ............................................................................................................ 79
Figure 3.19: Number of invention patents granted to foreign applicants from four
different countries and regions from 1995-2016 in China. ........................................... 79
Figure 3.20: Total number of three types of patents applied by domestic applicants from
1995-2016 in China..................................................................................................... 80
Figure 3.21: Total number of three types of patents granted by domestic applicants from
1995-2016 in China..................................................................................................... 80
Figure 3.22: Number of applications of trademark registration (domestic applicant) from
1982-2017. .................................................................................................................. 81
Figure 3.23: Number of applications of trademark registration (foreign applicant) from
1982-2017. .................................................................................................................. 82
Figure 4.1: Conceptual framework. ........................................................................... 114
Figure 4.2: Firms’ preference for driving factors behind offshoring decision of
innovation and other business services, by different governance mode in varied
locations. .................................................................................................................. 121
Figure 4.3: Firms’ preference for risk factors behind offshoring decision of innovation
and other business services, by different governance mode in varied locations. ......... 123
Figure 4.4: Firms’ preference for the achievements behind offshoring decision of
innovation and other business services, by different governance mode in varied
locations. .................................................................................................................. 125
Figure 5.1: 4 types of location strategies of FDI in R&D. .......................................... 169
Figure 5.2: Resources, institutions and location strategies. ........................................ 172
Figure 5.3: The share of patents that include inventors in China based on patents filed
from 1990-2014 in both computer and electronics industry and pharmaceutical industry.
................................................................................................................................. 179
Figure 5.4: The share of family size of patents that include inventors in China based on
patents filed from 1990-2014 in both computer and electronics industry and
pharmaceutical industry. ........................................................................................... 179
Figure 5.5: The share of citations of patents that include inventors in China based on
patents filed from 1990-2014 in both computer and electronics industry and
pharmaceutical industry. ........................................................................................... 180
Figure 5.6: The evolution of the share of each location strategies of electronics firms
(host country: China). ............................................................................................... 181

7
Figure 5.7: The evolution of the share of each location strategies of pharmaceutical
firms (host country: China). ...................................................................................... 181
Figure 5.8: The evolution of the share of each location strategies of pharmaceutical
firms (host country: other). ........................................................................................ 182
Figure 5.9: The evolution of the share of each location strategies of electronics firms
(host country: other). ................................................................................................. 183

8
List of tables
Table 3.1: Milestones of the evolution of Chinese IP system: from 1978 – present ...... 48
Table 4.1: Number of implementations of each governance mode regarding different
functions by location. ................................................................................................ 118
Table 4.2: Number of implementations of each governance mode regarding different
functions by industry. ................................................................................................ 119
Table 4.3: Variable description (first stage) ............................................................... 129
Table 4.4: Descriptive statistics and correlations for explanatory and control variables
(first stage) .......................................................................................................... 130
Table 4.5: Variable description (second stage) .......................................................... 132
Table 4.6: Descriptive statistics and correlations for explanatory and control variables
(second stage) ...................................................................................................... 134
Table 4.7: First-stage: governance choices (probit regression model) ........................ 136
Table 4.8: Second-stage regression results. Dependent variables: probability of
achieving the outcomes of “better focus on core competencies” and “better access to
qualified personnel” .................................................................................................. 138
Table 4.9: Second-stage regression results. Dependent variables: probability of
achieving the outcomes of “improved organisational flexibility” and “increase in firm's
overall competitiveness”. .......................................................................................... 140
Table 4.10: Second-stage regression results. Dependent variables: probability of
achieving the outcomes of “increased productivity/efficiency” and “improved service
quality”. .................................................................................................................... 142
Table 4.11: Second-stage regression results. Dependent variables: probability of
achieving the outcomes of “Better access to new markets” and “Breakthrough process
improvement(s)”. ...................................................................................................... 144
Table 4.12: Summary of the regression results. ......................................................... 146
Table 5.1: An overview of the sample. ...................................................................... 176
Table 5.2: Variables definition and operationalisation. .............................................. 186
Table 5.3: Descriptive statistics and correlations for explanatory and control variables:
the share of four location strategies that firms adopted in China in electronics industry.
................................................................................................................................. 188
Table 5.4: Descriptive statistics and correlations for explanatory and control variables:
the share of four location strategies that firms adopted in China in pharmaceutical
industry. .................................................................................................................... 189
Table 5.5: Fixed effects regression results of pharmaceutical industry and electronics
industry respectively. Dependent variable: the share of technology building and
technology augmenting strategies adopted in China (baseline). ................................. 190
9
Table 5.6: Fixed effects regression results of pharmaceutical industry and electronics
industry respectively. Dependent variable: the share of market seeking and technology
exploiting strategies adopted in China (baseline). ...................................................... 191
Table 5.7: Fixed effects regression results of pharmaceutical industry and electronics
industry respectively. Dependent variable: the share of technology building and
technology augmenting strategies adopted in China. ................................................. 193
Table 5.8: Fixed effects regression results of pharmaceutical industry and electronics
industry respectively. Dependent variable: the share of market seeking and technology
exploiting strategies adopted in China. ...................................................................... 194
Table 5.9: SUR regression results of pharmaceutical industry and electronics industry
respectively. Dependent variable: the share of technology building and technology
augmenting strategies adopted in China. ................................................................... 195
Table 5.10: SUR regression results of pharmaceutical industry and electronics industry
respectively. Dependent variable: the share of market seeking and technology exploiting
strategies adopted in China........................................................................................ 195

10
List of abbreviations
BRIC – Brazil, Russia, India, China
CIBER – Duke University Centre for International Business Education and Research
CNIPA – National Intellectual Property Administration of PRC
CPC – Communist Party of China
CPCC – Copyright Protection Centre of China
EPO – European Patent Office
FDI – Foreign Direct Investment
GDP – Gross Domestic Product
GSLI – Global Services Location Index
HBA – Home-base augmenting
HBE – Home-base exploiting
IB – International Business
IP – Intellectual Property
IPC – International Patent Classification
IPR – Intellectual Property Rights
JPO – Japanese Patent Office
MNC – Multinational corporation
MS – Market Seeking
MOU – China-US: Memorandum of Understanding on The Protection of Intellectual
Property
NBER – National Bureau of Economic Research
NCAC – National Copyright Administration of PRC
NPC – National People's Congress
ORN – Offshoring Research Network
PATSTAT – Patent Statistical Database
PCT – Patent Cooperation Treaty
R&D – Research and Development
RBV – Resource Based View
PRC – People’s Republic of China
RQ – Research Question

11
RTA – Revealed Technology Advantage
S&E – Science and Engineering
SAIC – State Administration for Industry and Commerce
SIPO – The State Intellectual Property Office
TA – Technology Augmenting
TB – Technology Building
TCE – Transaction Cost Economics
TE – Technology Exploiting
TRIPS – Trade-Related Aspects of Intellectual Property Rights
TS – Technology Seeking
UK – United Kingdom
US – United States of America
USPTO – United States Patent and Trademark Office
USTR – United States Trade Representative
VIF – Variance inflation factor
WCT – WIPO Copyright Treaty
WEF – World Economic Forum
WGI – Worldwide Governance Indicators
WIPO – World Intellectual Property Organization
WPPT – WIPO Performances and Phonograms Treaty
WTO – World Trade Organisation
12
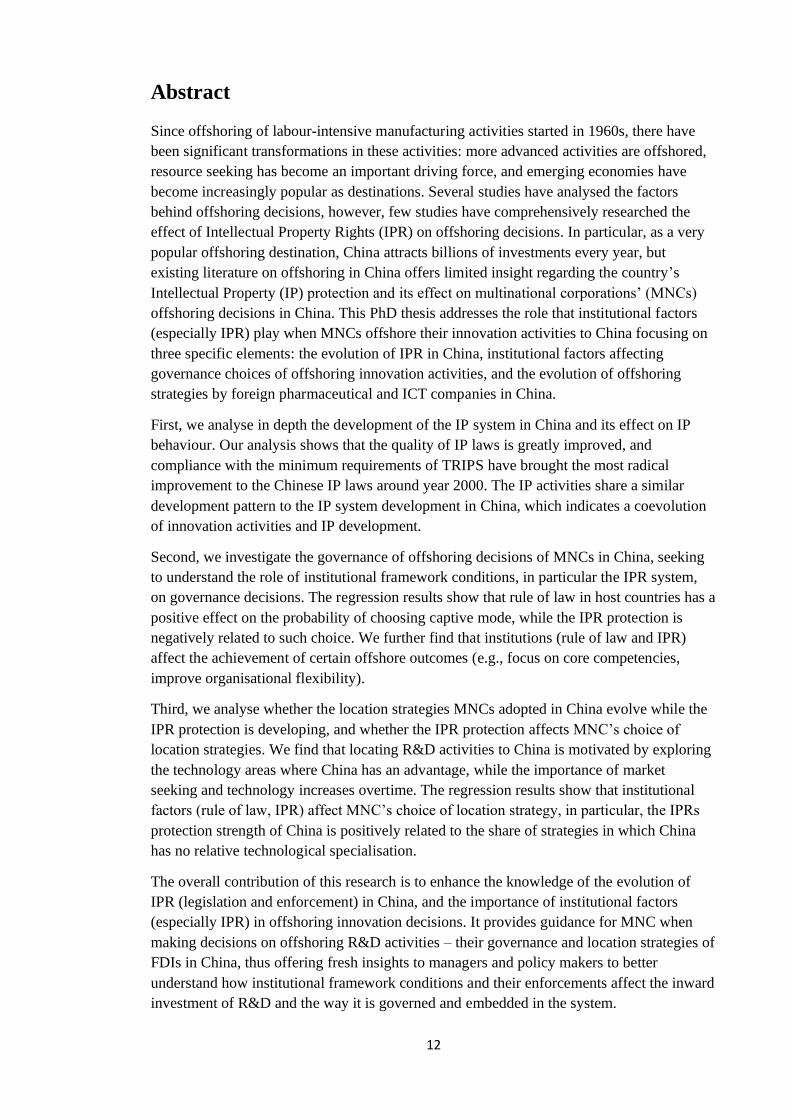
Abstract
Since offshoring of labour-intensive manufacturing activities started in 1960s, there have
been significant transformations in these activities: more advanced activities are offshored,
resource seeking has become an important driving force, and emerging economies have
become increasingly popular as destinations. Several studies have analysed the factors
behind offshoring decisions, however, few studies have comprehensively researched the
effect of Intellectual Property Rights (IPR) on offshoring decisions. In particular, as a very
popular offshoring destination, China attracts billions of investments every year, but
existing literature on offshoring in China offers limited insight regarding the country’s
Intellectual Property (IP) protection and its effect on multinational corporations’ (MNCs)
offshoring decisions in China. This PhD thesis addresses the role that institutional factors
(especially IPR) play when MNCs offshore their innovation activities to China focusing on
three specific elements: the evolution of IPR in China, institutional factors affecting
governance choices of offshoring innovation activities, and the evolution of offshoring
strategies by foreign pharmaceutical and ICT companies in China.
First, we analyse in depth the development of the IP system in China and its effect on IP
behaviour. Our analysis shows that the quality of IP laws is greatly improved, and
compliance with the minimum requirements of TRIPS have brought the most radical
improvement to the Chinese IP laws around year 2000. The IP activities share a similar
development pattern to the IP system development in China, which indicates a coevolution
of innovation activities and IP development.
Second, we investigate the governance of offshoring decisions of MNCs in China, seeking
to understand the role of institutional framework conditions, in particular the IPR system,
on governance decisions. The regression results show that rule of law in host countries has a
positive effect on the probability of choosing captive mode, while the IPR protection is
negatively related to such choice. We further find that institutions (rule of law and IPR)
affect the achievement of certain offshore outcomes (e.g., focus on core competencies,
improve organisational flexibility).
Third, we analyse whether the location strategies MNCs adopted in China evolve while the
IPR protection is developing, and whether the IPR protection affects MNC’s choice of
location strategies. We find that locating R&D activities to China is motivated by exploring
the technology areas where China has an advantage, while the importance of market
seeking and technology increases overtime. The regression results show that institutional
factors (rule of law, IPR) affect MNC’s choice of location strategy, in particular, the IPRs
protection strength of China is positively related to the share of strategies in which China
has no relative technological specialisation.
The overall contribution of this research is to enhance the knowledge of the evolution of
IPR (legislation and enforcement) in China, and the importance of institutional factors
(especially IPR) in offshoring innovation decisions. It provides guidance for MNC when
making decisions on offshoring R&D activities – their governance and location strategies of
FDIs in China, thus offering fresh insights to managers and policy makers to better
understand how institutional framework conditions and their enforcements affect the inward
investment of R&D and the way it is governed and embedded in the system.

13
Declaration
No portion of the work referred to in the thesis has been submitted in support of an
application for another degree or qualification of this or any other university or other
institute of learning.

14
Copyright statement
i. Author of this thesis (including any appendices and/or schedules to this thesis)
owns certain copyright or related rights in it (the “Copyright”) and s/he has
given The University of Manchester certain rights to use such Copyright,
including for administrative purposes.
ii. Copies of this thesis, either in full or in extracts and whether in hard or
electronic copy, may be made only in accordance with the Copyright, Designs
and Patents Act 1988 (as amended) and regulations issued under it or, where
appropriate, in accordance with licensing agreements which the University has
from time to time. This page must form part of any such copies made.
iii. The ownership of certain Copyright, patents, designs, trademarks and other
intellectual property (the “Intellectual Property”) and any reproductions of
copyright works in the thesis, for example graphs and tables (“Reproductions”),
which may be described in this thesis, may not be owned by the author and may
be owned by third parties. Such Intellectual Property and Reproductions cannot
and must not be made available for use without the prior written permission of
the owner(s) of the relevant Intellectual Property and/or Reproductions.
iv. Further information on the conditions under which disclosure, publication and
commercialisation of this thesis, the Copyright and any Intellectual Property
and/or Reproductions described in it may take place is available in the
University IP Policy (see
http://documents.manchester.ac.uk/DocuInfo.aspx?DocID=24420), in any
relevant Thesis restriction declarations deposited in the University Library, The
University Library’s regulations (see
http://www.library.manchester.ac.uk/about/regulations/) and in The University’s
policy on Presentation of Theses.

15
Acknowledgement
First and foremost, I would like to thank my supervisors Prof Silvia Massini and Prof
Jakob Edler for your amazing support and friendship over the past years. Before
embarking on my PhD journey, I was a novice in this field, but with your help I have
grown immensely and have learned so much from you during this time. You have
always been there for me when I needed it, and I could not have done this without you.
For this I will always remain grateful.
I would also like to thank Prof Philippe Laredo and Dr John Rigby for your valuable
comments and suggestions for my research during the annual review meetings which
helped me to continuously adjust and refine this project. Sincere thanks are also
expressed to all the people at the MIoIR institute and other institutions at Alliance
Manchester Business school for their nice and friendly help with all kinds of issues, big
and small, throughout my time here. Special mentions to Prof Joseph Lampel, Dr
Yanchao Li, Prof Charles Cui, Prof Paul Irwing, Dr Jenny Rodriguez.
All the people at the PGR office must also be mentioned here for all your help on
various things over the years. Lynne Barlow-Cheetham, Stefan Johnson, Kristin
Trichler, Paul Greenham, and Madonna Fyne. You have all made my stay here in
Manchester so much better with excellent support and administration.
I am very grateful and appreciative to have received the Alliance Manchester Business
School Doctoral Studentship, and also wish to extend my thanks to all the participants
and organisers of 2018 R&D management conference, and the 2018 EIBA conference.
Last but not least I want to thank my incredible and wonderful friends and PhD
colleagues at the School who filled my life with fun during the hard work of my PhD,
Ping Sun, Yan Xu, Dhruba Borah, Xiuqin Li, Chanaka Ganepola, Haitong Li, Chao Li,
and Fengjie Pan, as well as my other friends who in their own ways have supported me.
Yingying Wu, Wen Liu, Xiao Xu, Zhou Zhou, and Shuo Peng are just some of the
people I want to acknowledge, with many others helping out on the way. My husband
Emil and family also deserve my unlimited appreciation and love. Thank you all for
everything you have done for me during these years.

16
Chapter 1 Introduction
1.1 Offshoring business services
The term offshoring is normally used to refer to the process of sourcing business
activities, processes, or functions overseas to serve the domestic market and global
operations (Manning, et al., 2008; Kenney, et al., 2009; Lewin, et al., 2009). Offshoring
is treated as a strategy of efficiency-seeking, (human) resource-seeking, or acquiring
access to foreign markets (Jensen & Pedersen, 2012). The overall purpose behind
offshoring activities is to improve or maintain profitability in highly competitive
industries (Dunn, et al., 2009). This is typically achieved by separating a value chain
into different processes and locating each one to the place where it can be accomplished
with the highest efficiency, or at the lowest cost (Schwörer, 2013).
Offshoring in a modern context dates back to the 1960s, where labour-intensive
manufacturing processes comprised the major part of offshoring activities for the
purpose of minimising costs (Frobel, et al., 1980). The characteristics of offshoring
activities transformed in the late 1980s and throughout the 1990s, where global
Research and Development (R&D) alliances experienced a remarkable increase,
especially in the biotechnology and information technology sectors (Belderbos, et al.,
2004). Since the late 1990s, companies from developed countries have also started to
source business processes to foreign countries to support their domestic and global
operations (Kenney, et al., 2009). By the 2000s, activities that are being offshored have
extended to include high value professional and business services (Manning, et al.,
2008; Stringfellow, et al., 2008), marking an evolution of offshoring from low to high
value activities. The consequence is that global sourcing of value-added activities has
become an increasingly important organisational option (Dossani & Kenney, 2006;
Nieto & Rodríguez, 2011), with some authors referring to offshoring of innovation
activities as “next-generation offshoring” (Lewin & Couto, 2007). The term offshoring
innovation activities in this thesis refers to locating business activities such as R&D,
product design, software applications, as well as basic and applied research overseas to
not only serve the local market, but also to contribute to firm’s global operations. An
increasing number of firms are now setting up wholly owned R&D centres in emerging
countries such as Russia, China and India, or undertake arms-length sub-contracting of
R&D in these countries. Furthermore, a wider range of industries has been seen to adopt
17
an R&D offshoring strategy than previously (Bardhan & Jaffee, 2005). Scholars
observed that this phenomenon started by larger leading companies, such as Motorola
and General Electric (Delios & Henisz, 2003), with small and medium sized firms
following by offshoring new product design jobs in increasing fashion later (Dossani &
Kenny, 2007). In addition, researchers also have found a shift of governance choices.
Lewin and Volberda (2011) stated that wholly-owned subsidiary was preferred over the
outsourcing by firms in early years, but this has changed over time, indicating that
companies’ preference has shifted in favour of outsourcing, regardless of nationality or
functions.
The choices of destinations for advanced activities offshoring have also evolved from
developed countries to developing countries (Massini & Lewin, 2012). Among all these
different offshoring destinations, it is argued that Asia is now playing a central role in
the growing global innovation networks (Ernst, 2006), and the emergence of new
science and engineering (S&E) clusters in Asian countries have attracted firms from
Western developed countries to offshore to those countries (Lewin, et al., 2009).
However, researchers noted that the majority of high-end product development and
engineering activities are still being carried out in the Western developed countries
(Manning, et al., 2008). The total amount of R&D performed outside home countries
remained comparatively small and less important for many companies (Birkinshaw,
2002), even though researchers claim that it would grow significantly over the coming
decade and become one of the key strategic issues on the agendas of firms with
international ambitions (Dossani & Kenny, 2007; Lewin, et al., 2009).
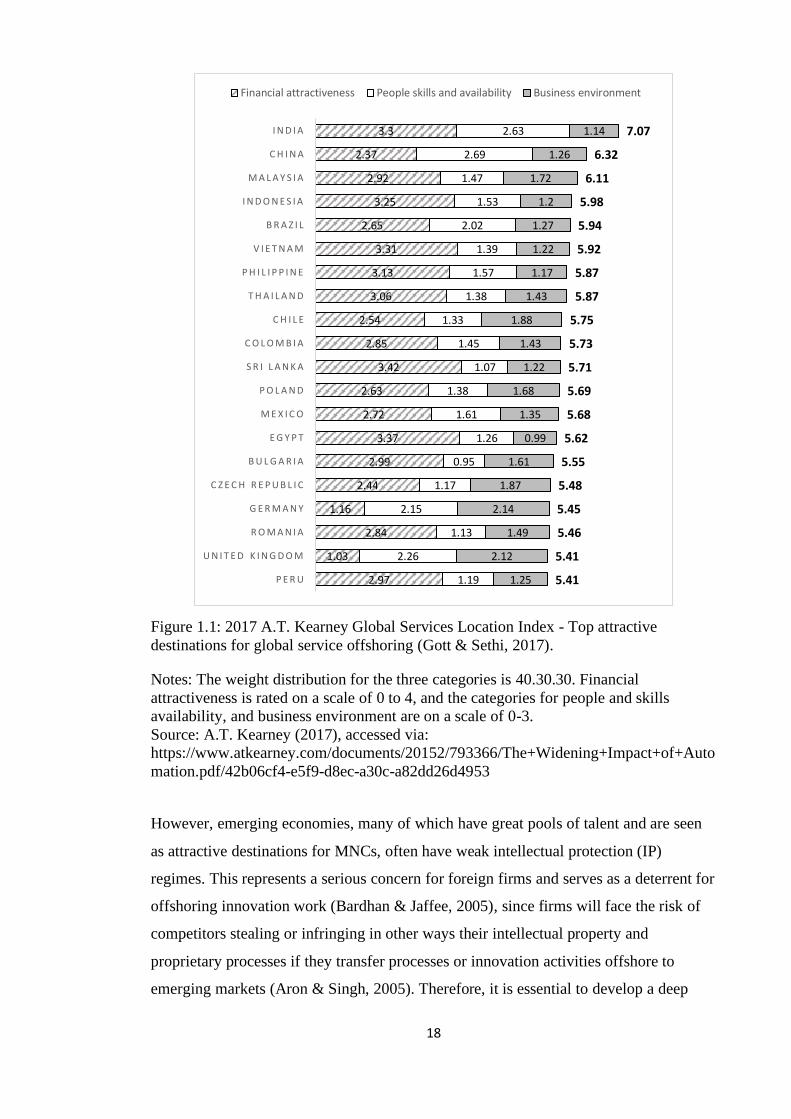
A.T. Kearney developed a ‘Global Services Location Index’1 (GSLI ), and have
identified the top attractive destinations for global service offshoring based on their
financial attractiveness, people skills and availability, and business environment in 2017
(Figure 1.1). Emerging economies, specifically China and India, have taken the leading
positions and remained the top destinations since 2004 (Gott & Sethi, 2017). Therefore,
it is important to analyse what factors affect firm’s offshoring decisions, especially to
offshore innovation activities to emerging countries.
1 Formerly known as “Offshore Location Attractiveness Index”.
18
Figure 1.1: 2017 A.T. Kearney Global Services Location Index - Top attractive
destinations for global service offshoring (Gott & Sethi, 2017).
Notes: The weight distribution for the three categories is 40.30.30. Financial
attractiveness is rated on a scale of 0 to 4, and the categories for people and skills
availability, and business environment are on a scale of 0-3.
Source: A.T. Kearney (2017), accessed via:
https://www.atkearney.com/documents/20152/793366/The+Widening+Impact+of+Auto
mation.pdf/42b06cf4-e5f9-d8ec-a30c-a82dd26d4953
However, emerging economies, many of which have great pools of talent and are seen
as attractive destinations for MNCs, often have weak intellectual protection (IP)
regimes. This represents a serious concern for foreign firms and serves as a deterrent for
offshoring innovation work (Bardhan & Jaffee, 2005), since firms will face the risk of
competitors stealing or infringing in other ways their intellectual property and
proprietary processes if they transfer processes or innovation activities offshore to
emerging markets (Aron & Singh, 2005). Therefore, it is essential to develop a deep
2.97
1.03
2.84
1.16
2.44
2.99
3.37
2.72
2.63
3.42
2.85
2.54
3.06
3.13
3.31
2.65
3.25
2.92
2.37
3.3
1.19
2.26
1.13
2.15
1.17
0.95
1.26
1.61
1.38
1.07
1.45
1.33
1.38
1.57
1.39
2.02
1.53
1.47
2.69
2.63
1.25
2.12
1.49
2.14
1.87
1.61
0.99
1.35
1.68
1.22
1.43
1.88
1.43
1.17
1.22
1.27
1.2
1.72
1.26
1.14
5.41
5.41
5.46
5.45
5.48
5.55
5.62
5.68
5.69
5.71
5.73
5.75
5.87
5.87
5.92
5.94
5.98
6.11
6.32
7.07
P E R U
U N I T E D K I N G D O M
R O M A N I A
G E R M A N Y
C Z E C H R E P U B L I C
B U L G A R I A
E G Y P T
M E X I C O
P O L A N D
S R I L A N K A
C O L O M B I A
C H I L E
T H A I L A N D
P H I L I P P I N E
V I E T N A M
B R A Z I L
I N D O N E S I A
M A L A Y S I A
C H I N A
I N D I A
Financial attractiveness People skills and availability Business environment

19
understanding of the institutional environments of the emerging countries foreign
MNCs choose to offshore R&D to, especially those related to IP and business laws.
1.2 Factors behind offshoring decisions
For the past two decades, Transaction Cost Economics (TCE) has dominated the
literature on the determinants of firm boundaries (Argyres & Zenger, 2012), and has
proved as an insightful theory for studying global sourcing transactions (Schneider, et
al., 2013). From the TCE perspective, most studies on offshoring have focused on the
direct economic benefits that derive from it (Monczka, et al., 2005; Grossman & Rossi-
Hansberg, 2008; Mudambi & Venzin, 2010) as offshoring can offer increased
competitiveness by a reduction of costs (Cadarso Vecina, et al., 2012). With regard to
innovation offshoring, the wage advantage is also cited as an important determinant
behind offshore location choices (Lewin & Peeters, 2006), and countries which provide
labour arbitrage in terms of R&D wages will be attractive offshore locations for R&D
projects (Demirbag & Glaister, 2010). However, this view is challenged by researchers
who argue that most of the US services actually had been offshored to other developed
countries (Trefler, et al., 2005). Although cost factors may determine the initial decision
to offshore, they do not necessarily affect subsequent evolution towards offshoring of
more advanced activities (Maskell, et al., 2007). Companies frequently evolve from
seeking cost reductions to knowledge-seeking objectives.
Along TCE, the Resource Based View (RBV) (Barney, 1991; Penrose, 1959) of the
firm has become increasingly important in strategic management (Wu, 2010), as well as
in the decisions of the firms’ boundaries since it contends that the reasons for
internalisation extend beyond the cost of transacting through the market to the
conditions that enable firms to establish, maintain, and use capabilities more efficiently
than markets can do (Teece, et al., 1997). It is consistent with the argument that
financial implications are no longer the only driver, and that other driving forces, such
as utilising service providers’ expertise or capabilities and service providers' flexibility
(Trefler, et al., 2005), are becoming increasingly important (Roza, et al., 2011). In other
words, offshoring firms do not only try to cut costs, but also try to create value through
strategic sourcing of knowledge-intensive activities, such as R&D, product design, and
engineering services and that offshoring decisions are driven by more strategic reasons,
such as accessing higher-level human capital, building organisational flexibility,

20
increasing local absorptive capacity, sourcing of innovation, accessing talent with
specialised capabilities around the world (which directly relates to the decline in young
adults selecting S&E careers in Western countries), as well as market seeking (Lewin, et
al., 2009; Massini & Lewin, 2012). Among the factors mentioned above, it is becoming
clear that accessing pools of highly skilled talent around the world has emerged as a
new key strategic driver, especially for offshoring innovation activities (Manning, et al.,
2008; Bunyaratavej, et al., 2007). Besides obtaining access to talent pools, researchers
have also made the argument that offshoring enables MNCs to access knowledge in
varied markets and benefit from increased diversity and heterogeneity in their
knowledge bases, which may arise as a result of complementary technologies in the
offshore site (Nieto & Rodríguez, 2011). Therefore, firms can improve their own
abilities to combine knowledge for innovation (D’Agostino, et al., 2013). It is argued
that offshoring R&D activities to countries with more specialised knowledge provides
firms with location-specific resourcing and specialisation advantages, and therefore,
firms can obtain better innovation inputs, greater flexibility, and thus enhanced
innovation capabilities (Nieto & Rodríguez, 2011). Furthermore, obtaining access to the
experience of varied academic and educational institutions, as well as innovative
environments, has the potential to support the growth of individually distinct scientific
and technological cultures, which in turn may spur innovation along radically different
lines and finally enrich the global economic welfare (Bardhan, 2006).
At the same time, since organisations are operating within a given context, they need to
conform to the dictates of the institutional environment if they want to gain success and
survival (Scott, 2008). This is mainly because if strategies do not conform to the
institutional norms of the host market, they may not be viewed as legitimate (Kostova &
Zaheer, 1999). In addition, if firms intend to expand abroad successfully, they need to
balance the benefits of resource-based advantage exploitation with the costs of not being
isomorphic with the host market institutional environment (Brouthers, et al., 2008).
Besides, being familiar with the location and its particular institutional context can bring
benefits and advantages to firms (Madhok, 2002). Therefore, the institutional
environment can affect which market the MNCs would like to enter, as well as the
governance choices (Brouthers, 2002). Scott (1995) and North (1990) maintained that a
country’s specific institutional environment is made up of a formal regulatory
dimension, which includes governmental or political actions (often referred to as
country risk) and legal regulations, and an informal dimension—its social norms. These
21
different dimensions generate both opportunities and barriers to business activity.
Therefore, from the Institutional theory’s perspective, offshoring decisions are not only
affected by cost and resources seeking/complementing factors, but also greatly affected
by the institutional environment.
With regard to the informal dimension of a country’s institutional environment, cultural
differences between host and home country can also affect companies’ offshoring
decisions, as cultural differences can increase the complexity of transferring functions
abroad (Hutzschenreuter, et al., 2011). Therefore, additional costs for training and
acquiring information may be required (Bunyaratavej, et al., 2007). Some scholars have
analysed in more detail the influence that culture poses, and conclude that cultural
influences could have greater impact in the early stages of offshoring (Massini &
Lewin, 2012). It is also argued that firms are more likely to respond to internal
uncertainties resulting from geographic and cultural distance by leveraging the internal
controls and collaboration mechanisms of a captive offshore service centre (Gooris &
Peeters, 2014; Hutzschenreuter, et al., 2011). In addition, language barrier, which is
another form of cultural difference, may pose an obstacle to the delivery of key
component of services and increase the complexity of communication, as well as
management (Bunyaratavej, et al., 2007; Doh, et al., 2009).
Regarding the formal regulatory dimension, firms that are seeking protection for
technology transferred across national borders face a complex variety of legal rules and
procedures (Oxley, 1999). Therefore, the legal system in host country is an important
factor that firms need to consider when they are making offshoring decisions (Javalgi, et
al., 2009), especially the intellectual property rights (IPR) regime when offshoring
strategic important innovation activities (Bardhan & Jaffee, 2005; Oxley, 1999).
Scholars argue that in some industries, such as the pharmaceutical industry, the
importance of IPR is higher than in others (Bardhan & Jaffee, 2005). Indeed, Oxley
(1999) recognised that firms were reluctant to transfer advanced technology to unrelated
third parties (e.g. a licensee) in countries with weak IPR regimes.
The discussion above has unpacked the reasons behind the importance of institutional
factors to MNC’s decisions of offshoring innovation activities, especially the influences
of IPR (Gonzalez, et al., 2006; Rebernik & Bradac, 2006; Dunning, 1988; Dunning,
1980; Gammeltoft, 2006; Kinkel, et al., 2007). However, we also note that very few
studies have comprehensively researched the effect of IPR and other institutional factors
22
on offshoring decisions. In this thesis, we are aiming to find answers to the Research
Question (RQ):
RQ: Do institutional factors influence the offshoring innovation activities? And
specifically, what is the role of IPR in offshoring of innovation?
The rest of the thesis is organised in the following order to address this research
question: Chapter 2 provides an overview of offshoring of business services in the
selected country and introduces the three research papers, the underlying rationale for
those studies and the specific sub-research questions, how they contribute collectively,
and adopting different methodologies to address the research question above. Chapter 3
presents Paper 1, which analyses the evolution of Chinese IP system. Studies have
shown that governance and location choices are interrelated (Contractor, et al., 2010),
but in order to develop a deeper understanding of the role that the institutional
environment plays in offshoring innovation activities, we analyse the influences
institutional factors have on offshore governance choices, and the effect of institutions
on location strategies in Chapters 4 and 5, which present Paper 2 and Paper 3,
respectively. Chapter 6 concludes the thesis with a discussion on the overall findings of
the thesis and how they addressed the main research question, its contribution and
implications, as well as the limitations of this research and future research directions.

23
Chapter 2 Positioning and overview of the three research
papers
In order to develop a deeper understanding of the role of institutional factors (especially
IPR) on MNCs offshoring their innovation activities, we address this issue in three
separate but inter-related papers. Due to our interest in the role of IPR on offshoring of
innovation activities, it is important to focus the study on a country where the IP regime
has undergone substantial changes over time. Therefore, this PhD thesis starts with
analysing the evolution of the Chinese IP system, with the aim to acquire a thorough
understanding of the Chinese IPR regime. Second, since the chosen governance mode is
considered to be a significant determinant of the overall success of foreign activities
(Chen & Hu, 2002), we test the relationships between institutional factors and
offshoring governance modes. Third, we focus specifically on firms that have
established R&D centres in China (captive operations) to analyse the evolution of their
location strategies, and further test the relationships between institutional factors and the
choice of location strategies.
2.1 Why China?
Two of the three papers in this PhD thesis focus on China. The rationale behind this
choice is that the change of IPR over time allows us to see how different IPR settings
affect offshoring behaviour, and that China is an ever increasingly popular destination
for offshoring R&D activities. Despite China having undergone a drastic improvement
in the IPR law and IP enforcement over the last 35 years, the IPR protection regime in
China is a major concern for firms and governments (e.g., United States, European
Union). We also note that multinational companies have followed different approaches
towards offshoring of high value activities to China over the past years. For example, in
2014 Adobe shut down its Chinese R&D centre, established just nine years ago,
blaming hostile government and software piracy in China as the main reason, as well as
wage inflation (Carsten, 2014). However, Apple and Ford continue to aggressively
expand their innovation activities in China (Murphy, 2014; Dou, 2014). These opposing
strategies make China an interesting setting to study, especially in the context of why
MNCs choose China as a destination where to conduct R&D.

24
Figures 2.1 and 2.2 present the Gross Domestic Product (GDP) and GDP per capita of
BRIC countries (Brazil, Russia, India, China), the United Kingdom (UK), and the
United States (US) from 1995 to 2017. It can be observed that China has become the
second largest economy in terms of GDP among these six countries since 1999.
However, the GDP per capita of China is only slightly higher than in other developing
countries, such as India, due to its large population, although it also keeps increasing.
Figure 2.1: GDP (constant 2010 billion US$) of China, Brazil, India, Russia, UK, and
US from 1995 to 2017.
Source: The World Bank database, accessed via: https://data.worldbank.org/
Figure 2.2: GDP per capita (constant 2010 US$) of China, Brazil, India, Russia, UK,
and US from 1995 to 2017.
0
2000
4000
6000
8000
10000
12000
14000
16000
18000
20000
19
95
19
96
19
97
19
98
19
99
20
00
20
01
20
02
20
03
20
04
20
05
20
06
20
07
20
08
20
09
20
10
20
11
20
12
20
13
20
14
20
15
20
16
20
17
US
China
UK
India
Brazil
Russia
0
10000
20000
30000
40000
50000
60000
US
UK
Russia
Brazil
China
India

25
Source: The World Bank database, accessed via: https://data.worldbank.org/
Previous studies have claimed that the availability of talent and cheaper labour cost in
China has made it a very attractive destination for offshoring business services activities
(Kedia & Mukherjee, 2009; Li & Kozhikode, 2009; Roza, et al., 2011). As shown in
Figure 2.3, the enrolment in tertiary education in emerging economies during 1995-
2016 increased notably, especially in China and India, while the enrolment in developed
economies (such as US and UK) remained at a similar level or even decreased.
Figure 2.3: Enrolment in tertiary education (all programmes2) from 1995-2016.
Source: UNESCO database, accessed via:
http://data.uis.unesco.org/Index.aspx?DataSetCode=EDULIT_DS
Figure 2.4 presents the amount of foreign direct investment (FDI) net inflows into
Brazil, Russia, India, China, UK, and US from 1990 to 2017. While the US attracts
almost the majority of FDI during the whole period, China is the leading country among
of the BRIC countries. The graph shows that the first notable increase of FDI inflows in
China occurs in 1993, one year after the “China-US: Memorandum of Understanding on
The Protection of Intellectual Property” reached an agreement, and the first Patent law
amendment was published. The second notable increase occurs in 2001 when China
2 According to the International Standard Classification of Education 2011 (ISCED 2011), “all
programmes” refers to: Short-cycle tertiary education, Bachelor or equivalent, Master or equivalent, and
Doctoral or equivalent.
0
5,000,000
10,000,000
15,000,000
20,000,000
25,000,000
30,000,000
35,000,000
40,000,000
45,000,000
50,000,000
China
India
US
Brazil
Russia
UK

26
became a member of the World Trade Organisation (WTO), and the FDI net inflows in
China increased dramatically. A Financial Times report shows that between January
2010 and December 2014, China has attracted 88 greenfield R&D projects from foreign
firms, for a total 5.5 billion USD capital investment, revealing that China has caught up
with the US in attracting foreign investment in R&D (Fingar, 2015).
Figure 2.4: FDI net inflows (BoP, current million US$) of China, Brazil, India, Russia,
UK, and US from 1990 to 2017.
Source: The World Bank database, accessed via: https://data.worldbank.org/
Previous studies have stated that deficiencies still exist in the Chinese IP system, and
the IP infringement in China is still at a relatively high level (Cao, 2014). For example,
the United States filed a complaint regarding the IPR protection in China to the WTO
on 10 April 2007 where it raised the issue of four aspects of the Chinese IP laws and
custom measures being inconsistent with the TRIPS agreement, and urged China to
improve its IP system (WTO, 2010). Because of this, MNCs may stop offshoring
important R&D unless special contingencies are adopted by them (Quan & Chesbrough,
2010). On the other hand, some researchers claim that the quality of IPR protection in
China is improving (Awokuse & Yin, 2010). Since China joined the WTO at the end of
2001, the IP laws in China have been revised more than once, and the government has
repeatedly emphasised the importance of improving the Chinese IP system and their
plans regarding how to improve it. According to the World Economic Forum (WEF)
annual Executive Opinion Survey, the position of China in the IPR protection ranking
0
100000
200000
300000
400000
500000
600000
19
90
19
91
19
92
19
93
19
94
19
95
19
96
19
97
19
98
19
99
20
00
20
01
20
02
20
03
20
04
20
05
20
06
20
07
20
08
20
09
20
10
20
11
20
12
20
13
20
14
20
15
20
16
20
17
US
China
Brazil
UK
India
Russia
27
was 49th among 140 countries in 2018, while its position was 48th among 59 countries in
1999 (WEF, 2018). In addition, the Ginarte-Park index that measures the IPR protection
strength of a country, reveals that the score of China increased from 1.33 before 1990 to
4.08 in 2005 (Park, 2008; Ginarte & Park, 1997). All these factors indicate that the
Chinese IP system is improving, although distance still exists between China and
developed countries in terms of IP enforcement.
In summary, the trends and figures above show that the Chinese economy and
enrolment in tertiary education are consistently increasing, and the market size and the
availability of talent make China a popular destination for attracting FDI. This includes
FDI in R&D, an area which is sensitive and dependent on the IPR protection in host
countries (Oxley, 1999). Although different IPR index or survey scores suggest that the
IPR regime in China is improving, some researchers and foreign governments argue that
the IPR protection in China is still rather weak, and that MNCs should be cautious when
locating R&D activities in China. Nevertheless, due to China’s attractiveness of foreign
innovative activities and its debatable IPR regime, it is important to develop a deep
understanding of the Chinese IPR regime, how it has evolved, and how MNCs manage
their R&D activities in China.
The following three sections outline how the three research papers contribute to this
research agenda. These are followed by a concluding section which brings them
together to address the main research question of the thesis, that is the role of
institutional factors, and especially IPR, on the offshoring of innovation activities.
2.2 Paper 1: The evolution of the Chinese IPR system: Phases of change and
impact on innovation activities
The IPR protection regime in China has been studied by many scholars, however, we
note that Chinese IPR protection regime is still a debatable topic among scholars even
in recent research. One group of researchers claim that IPR protection in China has
undergone remarkable development, and that accessing the TRIPS agreement has
brought a “structural breakpoint impact” on Chinese IP protection system (Li & Yu,
2015), as China realised the importance of protecting IP and treated IP as an important
asset (Li & Yu, 2015; Nguyen, 2010). Given the numerous changes made in the
relatively short history of the Chinese IP system, researchers claim that IPR protection

28
in China will become even better as China starts to develop its own intellectual property
(Swike, et al., 2008) and because the Chinese economy and technology are developing
rapidly (Peng, 2013; Peng, et al., 2017). On the other hand, another group of researchers
argue that several defects remain in the Chinese IP system, which include authority
overlapping3 and IP protection enforcement inconsistency among central government,
local governments and individual ministries (Brander, et al., 2017), and too low fines
and penalties for IPR violations to prevent infringements from happening (Cox &
Sepetys, 2009). In order to have a comprehensive understanding of the Chinese IP
system, the first research paper aims to answer the following research question:
RQ1: How has the IP legislation in China evolved? How has the IP enforcement in
China changed? Finally, what further changes to the IP activities in China have been
accomplished?
Different from previous studies which analysed the IPR protection in China mostly
based on previous economic and business research, news, government reports (e.g., US
government statements), or discussed from a cultural perspective, we investigate the
Chinese IPR regime from both written law and law in practice aspects. First, building
on Ginarte and Park’s work (1997), we develop a novel five-dimensional assessment
framework (the scope of protection, the duration of protection and clarity of procedural
provisions, enforcement mechanisms, protection strength of IPR, and the restrictions on
IPR) to analyse the provisions of each IP law (Patent law, Trademark law, and
Copyright law) and their amendments. We conclude that Chinese IP laws have been
improved in a systematic way in 2000, which established a solid foundation for the
future development of Chinese IP legislations. Second, secondary data published by the
State Intellectual Property Office have been gathered to analyse the IP law enforcement
in China. The number of cases handled by administrative departments and the courts
suggest that the IP enforcement in China has been strengthening only from 2008, which
suggests that the IP enforcement in China was weak before 2008 but is improving
gradually since then. This explains past studies arguing that the IPR protection in China
is weak, especially its enforcement (Hu & Jefferson, 2009; Greguras, 2007; Liu, 2005).
3 Authority overlapping indicates central government, local governments and individual ministries can
claim authority on a subject in the same area.

29
Finally, we analyse the trends of patent applications and granting, and trademark
registrations in China during the period of 1980s to 2016. The results suggest
coevolution of the innovation activities in China and Chinese IP system. They show that
both IP laws and IP enforcement in China are improving, and that joining WTO has
provided a solid foundation for China to improve its IP system. Our findings enhance
knowledge and understanding of the IP development in China, which could help MNCs
to decide which specific strategies they could adopt in accordance to the IPR regime
when offshoring innovation activities to China.
2.3 Paper 2: The influence of the institutional environment in host countries
on offshore governance choice and business outcomes
The role of the institutional environment of a host country on MNCs’ decisions to
offshore innovation has been recognised (e.g., Brouthers, et al., 2008; Madhok, 2002),
however, it remains under-investigated empirically. Research on firms’
internationalisation, has shown that governance modes, i.e., fully owned, hierarchical
solutions or more arm length outsourcing contracts, are very important strategic
decisions, as they affect MNCs’ performance and achievable savings (Lu, 2002), with
different governance modes offering specific benefits and risks (Hutzschenreuter, et al.,
2011; Elia, et al., 2014). Therefore, in the second research paper we focus on analysing
the relationship between institutional factors and offshore governance modes (captive4
and offshore outsourcing5).
Previous studies anchored on TCE and the RBV of the firm, suggest that cost reduction
(such as labour arbitrage, reducing fixed investments) and accessing valuable resources
(such as high-level human capital, sourcing of innovation) affect a firm’s governance
choices (Lewin, et al., 2009; Massini & Lewin, 2012; Youngdahl & Ramaswamy, 2008;
Kotabe & Murray, 2004). However, as Williamson suggests when discussing
governance choices, “the institutions of governance (firms, markets, hybrids, bureaus)
are embedded in the institutional environment" (Williamson, 1992), thus recommending
that the institutional environment of countries should also be taken into consideration.
Previous studies have shown that when MNCs expand their operations globally, the
4 Captive mode means establishing a wholly owned subsidiary abroad. 5 Offshore outsourcing here refers to contracting out a function or process to a third-party supplier in a
foreign country.

30
process of internationalisation and subsequent foreign operations may be severely
affected by the legal system in the relevant host country (Flores & Aguilera, 2007;
Gooris & Peeters, 2016). Some scholars have stated that firms often adopt captive mode
in countries with weak legal systems (Kshetri, 2007). The IPR protection of host
country is especially important when innovation activities are offshored. Oxley (1999)
points out that a hierarchical governance mode is preferred when the IPR protection in
the host country is weak, since offshore outsourcing can increase the risk of IP leakage,
which can erode firm’s competitive advantages (Hutzschenreuter, et al., 2011).
We note that although the central nature institutional factors have on offshore
governance choices has been recognised in previous research (Flores & Aguilera, 2007;
Javalgi, et al., 2009; Oxley, 1999; Hutzschenreuter, et al., 2011), very few studies have
comprehensively analysed their effect on governance choices and how these may be
mitigated. It also remains unclear whether the quality of rule of law and the IPR regime
in host countries affects a firm’s choice in this regard. Previous studies argue that
offshoring can achieve certain business outcomes, such as access to qualified personnel,
improve firm’s competencies, etc. However, whether the institutional factors have an
effect on offshoring outcomes also remains obscure. Furthermore, studies have shown
that it is the alignment between firm’s governance choice and the governance mode
recommended by theories normally used to study governance choices (e.g., TCE, RBV,
etc.) that impact on firm performance (Brouthers, 2002; Shavers, 1998). However, those
studies are not specifically focused on offshoring innovation activities for which firm’s
knowledge is particularly important. To summarise, the research questions of the second
paper are the following:
RQ2.1: Do institutions such as rule of law and IPR regime in host countries affect a
firm’s offshore governance choices when offshoring innovation activities?
RQ2.2: Do governance misalignment and institutions affect achieving business
outcomes when offshoring innovation activities?
The data used in this paper are derived from the Offshoring Research Network (ORN)
database, which comprises international and longitudinal surveys (conducted in 2007,
2009, and 2011) among companies and is focussed on surveying offshore project
implementations, which is the unit of analysis. Among all the 13 functions firms
31
offshored, we select product design, research and development, software development,
and engineering services to represent innovation functions. For the regression analysis,
we supplement the ORN data with data on institutional factors (IPR and rule of law)
from the United States Trade Representative’s Special 301 report and the International
Property Rights Index (IPRI) as developed by Property Rights Alliance. We adopt a
Heckman-based approach and first test the relationships between institutional factors
and the offshore governance choices, and then we analyse the effect of institutional
factors and governance misalignment on the achievement of offshoring outcomes. The
regression results show that rule of law in host countries has a positive effect on the
probability of choosing captive mode, while IPR protection is negatively related to such
choice. Regarding business outcomes from offshoring, the findings of this paper show
that firms that fail to adopt offshore outsourcing mode are less likely to focus on core
competencies, access to qualified personnel, improve organisational flexibility and
firm’s overall competitiveness, but are more likely to gain access to new markets.
Regarding firms that fail to adopt captive mode, they are more likely to improve
organisational flexibility, firm’s overall competitiveness, and productivity/efficiency.
We find that institutions in host countries do affect achieving certain offshore outcomes,
specifically, the rule of law in host countries was found to be positively related to
focusing on core competencies, but negatively related to increasing firm’s overall
competitiveness, service quality, accessing to new markets, and breakthrough process
improvement(s). Furthermore, the results also show that the IPR protection strength is
negatively related to focusing on core competencies, and accessing qualified personnel.
Our findings first suggest that host countries could strengthen their institutional
environment, in particular, the rule of law and IPR protection, so that MNCs will be
more committed to the country respectively by establishing wholly-owned subsidiaries,
or it will be more willing to outsource innovation activities to local suppliers. Second,
they can provide guidance to decision makers in firms regarding what needs to be
considered when deciding governance choices.
2.4 Paper 3: Why do multinational firms locate R&D to China? An analysis
of the determinants of location strategies
From the previous two papers, we learn that the IP laws and enforcement in China are
improving making an increasingly attractive offshoring destination for innovation, and

32
that IP activities and IP system development in China are seemingly coevolving. We
also find that institutional factors affect offshore governance choices and the probability
of achieving business outcomes from offshore by using the survey data. However, it is
not clear how the MNCs manage R&D activities offshored to China. Previous studies
suggest that captive mode increases the opportunities for market development in the
long run and could mitigate the risks caused by weak institutions (Kshetri, 2007;
Caniato, et al., 2015), but whether having a wholly-owned R&D centre in China means
that important technologies are actually offshored there remains unknown. Therefore,
whether the improvement of IPR regime could strengthen MNCs’ confidence of
locating strategically important technologies to China also needs to be thoroughly
analysed. In this paper, we analyse location strategies adopted by MNCs which
established R&D centres in China from two knowledge-intensive industries that have
different characteristics, pharmaceuticals and computer and electronics industries.
Home-base-exploiting (HBE) and home-base-augmenting (HBA) are the two main
motives developed by Kuemmerle (1999). When sufficient science and technology
resources are present in developed economies, the R&D sites offshored to these
countries are more likely to be driven by HBA motives, while R&D activities offshored
to countries with a relative attractive market or developing economies are more focused
on product commercialisation and adaption (HBE) (Liu & Chen, 2012; Kuemmerle,
1999). However, researchers have shown that these strategies may be changing over
time, for example, R&D activities conducted in China were initially focused on HBE,
but gradually involved HBA and HBE strategies simultaneously (Bruche, 2009; Ernst,
2006).
Using the revealed technology advantage (RTA) index of firm’s home country and host
country, Patel and Vega (1999) further categorised the drivers of MNCs to establish
R&D overseas into 4 different types of location strategies for R&D: Technology
Seeking (TS), Market Seeking (MS), HBA, and HBE. Studies have shown that HBA
and HBE are the two main motives that drive MNCs to establish R&D centres overseas
(Patel & Vega, 1999; Le Bas & Sierra, 2002).
Previous studies have two limitations. First, they only focused on identifying the
dominant location strategies during a short period, and second, it remains under-
investigated whether the location strategies adopted by MNCs are affected by
33
institutional factors in the host country. The research questions of this paper which
focus on R&D location strategies in China are the following:
RQ3.1: What are the R&D location strategies of MNCs in China? And how have they
evolved?
RQ3.2: What factors affect the choice of different location strategies by MNCs in
China?
We have selected the 79 top performing multinational firms by sales revenue that have
established wholly owned labs in China from the pharmaceutical and computer and
electronics industries. By using the patent data extracted from worldwide Patent
Statistical Database (PATSTAT), we build and compare the RTA indexes of firm’s
home and host countries, and calculate the share of each strategy adopted by a firm in a
given year. We find that locating R&D activities to China are motivated by exploring
the technology areas where China has an advantage, while the importance of market
seeking and technology exploiting (in technology fields in which China does not have
relative specialisation) increases gradually over time, especially for computer and
electronics firms. We also find that institutional factors (i.e. IPR protection strength of
home and host countries, quality of rule of law, and institutional distance) play a role on
specific MNC’s strategies for offshoring R&D activities to China. In particular, the
results show that the IPR protection strength of China is positively related to the share
of both market seeking and technology exploiting strategies, which suggest that when
firms are planning to conduct R&D activities in areas in which China is not specialised,
they are more likely to offshore such activities if the IPR protection regime in China is
stronger. Our findings strengthen our understanding of MNC’s strategies of conducting
R&D in China, and extend previous works by testing the effect of institutional factors
on the choices of location strategies.
2.5 The Overall Research Framework of the Thesis
The three sections above introduced the sub-research questions of each paper, and how
they are inter-related. These three research papers studied the evolution of Chinese IP
system comprehensively, tested the relationships between institutional factors

34
(especially IPR) and offshore governance choices, and analysed the evolution of
location strategies MNCs adopted in China, as well as the effect institutional factor
(especially IPR) on choices of location strategies. The sub-research questions we
addressed in each paper contribute to the understanding of the main research question
“Do institutional factors influence the offshoring innovation activities? And
specifically, what is the role of IPR for offshoring of innovation?”. The multiple data
sources (e.g., Chinese laws, government reports, survey data, patent data) and different
methodologies (qualitative and quantitative research methods) adopted in each paper
complement each other, which also reinforce the fact that the three papers help
answering the main research question jointly and coherently. The contributions of the
three research papers and their connections are represented visually in Figure 2.5. The
following three Chapters: Chapter 3, Chapter 4 and Chapter 5 present the three research
papers of this thesis.
Figure 2.5: Positioning of the three papers
RQ: Do institutional factors influence the offshoring innovation activities? And specifically, what is the role of IPR in offshoring of innovation?
Paper 1: The evolution of the Chinese IPR system: Phases of change and impact on innovation activities
RQ1: How has the IP legislation in China evolved? How has the IP enforcement in China changed? Finally, what further changes to the IP activities in China have been accomplished?
Data source: Chinese IP laws, government reports
Research method: Qualitative research
Paper 2: The influence of the institutional environment in host countries on offshore governance choice and business outcomes
RQ2.1: Do institutions such as rule of law and IPR regime in host countries affect a firm’s offshore governance choices when offshoring innovation activities?
RQ2.2: Do governance misalignment and institutions affect achieving business outcomes when offshoring innovation activities?
Data source: Survey data (ORN), United States Trade Representative’s Special 301 report, WGI
Research method: Quantitative research (Heckman-based approach )
Paper 3: Why do multinational firms locate R&D to China? An analysis of the determinants of location strategies
RQ3.1: What are the R&D location strategies of MNCs in China? And how have they evolved?
RQ3.2: What factors affect the choice of different location strategies by MNCs in China?
Data source: Patent data (PASTAT), Datastream, Compustat, United States Trade Representative’s Special 301 report, WGI
Research method: Quantitative research (Fixed effects regression)

35
Chapter 3: The evolution of the Chinese IPR system: Phases
of change and impact on innovation activities
Abstract
Since the 1980s, the Chinese IPR system has undergone significant changes in both the
design of the legislation and its enforcement. The IP laws in China have been revised
three times since the first IP law was enacted in 1982. In this paper we aim to develop a
deeper understanding of how the IP legislations and enforcement in China have
evolved, and shed more light on the impact of these changes on the nature and extent of
IP activities in China by analysing the changes introduced in each revision, as well as
their impact on the trends of patents and trademarks applied/registered and granted
during this period. Our results show that IP laws and their enforcement have been
greatly enhanced, especially since 2000. We also show that IP activities follow a similar
development pattern to the IP laws development in China, with the number of patent
and trademark applications and grants/registrations showing a very modest increase
until 2000, but then a remarkable increase began, which further increased after 2008.
3.1 Introduction
In 1978, an “open-door” policy was adopted in China, which gradually transformed the
planned economy system operating in China for 30 years into a market economy
system. In order to support this economic system transformation, China also joined a
series of intellectual property rights (IPR) protection international conventions/treaties,
and established its own legal system to protect IPR. China signed the WIPO convention
in 1980, and on 11th December 2001, China was accepted as a member of the World
Trade Organization (WTO). As a compulsory requirement for becoming a member of
the WTO, China had to improve its IP system to comply with the minimum standards of
the Agreement on Trade-Related Aspects of Intellectual Property Rights (TRIPS) (Li &
Yu, 2015; Keupp, et al., 2009). Patent law, Trademark law, and Copyright law were all
revised, and several other IP related laws and regulations were also issued during this
period. It is stated that improvements made this time made the Chinese IP laws in

36
compliance with the TRIPS agreement, as well as meeting international standards in
other respects as well (Wang, 2004; Gao, 2008).
The IP laws in China have not remained unchanged over the last three decades. They
have been revised 3 times, and the Chinese IP regimes have been developed for over 35
years since the first IP law was enacted, however, the quality of IPR protection in China
is still a debatable topic. One group of scholars posit that after years of development and
law revisions, the IPR protection in China has been greatly improved and that such
differences between China and other developed economies will be narrowed down
(Wang, 2004). Barren and Wrathall (2006) stated that “China’s road to protecting IPR is
actually quite impressive given its rudimentary legal environment”.
The development of the Chinese IP system has been strongly affected by the WTO and
TRIPS agreement (Papageorgiadis & McDonald, 2018). Gao (2008) observed that the
numerous efforts that were made to improve the IPR protection in China during 2001,
when China joined WTO, have resulted in great progress regarding building up a
“modern, transparent, and effective” IP system, which not only meets the requirements
of TRIPS agreement, but also helps China to integrate into global economy. Peng and
colleagues (2017) argue that at the early stage of economic development, most countries
will choose to not enforce a high standard and strict IP protection.
However, a group of researchers hold opposite opinions regarding the IP protection in
China, and argue that although China has established IP laws that generally meet
international standards (Greguras, 2007), weak enforcement of IPR in China still
remains one of the biggest deficiencies in its IP system (Hu & Jefferson, 2009;
Greguras, 2007; Cao, 2014; Liu, 2005). Some researchers argue that IP infringement in
China is still at a relatively high level (Cao, 2014), and that the current Chinese IP laws
are complex and confusing since IP rights are governed by several separate legal
regimes (Wang, 2004).
After reviewing relevant streams of literature, we conclude that their statements
regarding IPR protection in China are mostly based on previous economic and business
research, news, government reports (e.g., US government statements), or discussed
from a cultural perspective. Few studies have thoroughly reviewed how the IP laws in
China have been revised, which could be one of the reasons for the opposite conclusions
on the current and future state of IPR in China reported in previous studies.
37
Furthermore, few studies reviewed how the IP activities in China have evolved while
the IP system in China is under development. Therefore, in this paper, we will analyse
in more detail how the IP legislations in China have evolved, and how the IP
enforcement in China changed, as well as what changes to the IP activities in China
have accomplished.
In this paper, we discuss the varied aspects that have been changed in each law revision
in detail based on the later three waves of change. In 2000, IP laws were changed in a
systematic and tremendous way, which also established a robust foundation for the
future development of Chinese IP legislations. The revisions provided after 2008 are
believed to be for China’s own goal of improving its innovation ability by enhancing
the level of IP protection (Li & Yu, 2015; Yang & Yen, 2009), and solving the
problems that exist when practicing IP laws after the second wave of revisions. By
analysing the revisions of patent law and trademark law, it can be noted that all five
aspects listed have been further improved, and we trust that this wave of change can
increase the IPR protection in China to a higher level.
After reviewing the evolution of Chinese IP laws, we analyse the IP enforcement in
China, the data does not show the same development pattern, but we note that while the
number of cases handled by administrative departments and the courts has remained at
comparative low level during the period of 2004 to 2008, all show substantial increase
after 2008. The data shows that IP enforcement in China is strengthening, although it
only started recently. With regard to the IP activities, we analyse the trends of patent
applications and granting, and trademark registrations in China during the period of
1980s to 2016. We note that the changes of all these aspects show a similar pattern of
the development of Chinese IP laws. Our findings contribute to existing literature and
enhance our understanding of the IP development in China, and its impact on domestic
and foreign innovation activities.
This paper is organised by starting with a general introduction on the IP systems in
China in section 3.2. In section 3.3, we introduce how the legislative system works in
China, provide an overview of evolutionary changes in the Chinese IP system, and then
review what changes have been brought in each wave of IP law revisions. We analyse
how the IP enforcement evolved, and how the patent application and granting,
trademark registration developed in China in section 3.4. In section 3.5 we then discuss
the main findings and conclude the paper.

38
3.2 The IP systems in China
The IP system in China is based on three fundamental aspects: legislative guidance,
administrative control and judicial enforcement (Yang, 2003). China was operating as a
planned economy system for 30 years since the establishment of the People’s Republic
of China (PRC), which resulted in protection of IPR as mainly relying on the
administrative regulations. It is only after the “open-door” policy adopted in 1978, and
that the planned economy system in China gradually started its transformation into a
market economy system, a legal system to protect IPR gradually was established and
improved since then (Wu, 2009). Therefore, in the practice of IPR protection, a “dual-
track” system comprising both administrative and judicial protection has been formed in
China, and both tracks operate in parallel. Scholars have stated that the joint efforts
made by administrative departments and the judicial organs lead to more comprehensive
protection for IPR in China (Liu, 2005). In this section, the administrative protection
route and judicial protection route will be introduced.
3.2.1 Administrative track
The Administrative body in China has the authority to supervise the implementation of
laws, as well as settle disputes administratively (Yang & Clarke, 2005). This includes
IP-related disputes, and the administrative body also handles the application,
examination, and approval of national patents (Yang, 2003). The State Intellectual
Property Office (SIPO) is the administrative authority that has the responsibility of
handling China’s overall patent work of comprehensively coordinating foreign-related
IPR affairs (SIPO, 2002), which include the Patent office, the Patent Re-examination
Board within patent office, and other directly affiliated units of SIPO. The trademark
registration and administration are handled by the Trademark Office, while the
Trademark Review and Adjudication Board is responsible for handling trademark
disputes. Both administrative authorities belong to the State Administration for Industry
and Commerce (SAIC) (SAIC, 2009). Copyright related matters, are mainly managed
by the National Copyright Administration of PRC (NCAC), and the Copyright
Protection Centre of China (CPCC, a subsidiary of NCAC) which is mainly responsible

39
for copyrights registration (NCAC, 2017; CPCC, 2017). More detailed responsibilities
of each IP related administrative authorities are shown in Figure 3.1.

40
Figure 3.1: The main responsibilities of the major administrative bodies involved in IP activities. Sources: Bosworth, D. & Yang, D., 2000. Intellectual property law, technology flow and licensing opportunities in the People's Republic of China. International Business Review, 9(4), pp. 453-477.
SIPO, 2018. State Intellectual Property Office of the PRC [Online] Available at: http://english.cnipa.gov.cn/; SAIC, 2018. State Administration for Industry &
Commerce of the PRC [Online] Available at: http://home.saic.gov.cn/english/aboutus/Departments/index.html; NCA, 2018. National Copyright Administration of
the PRC [Online] Available at: http://www.ncac.gov.cn/chinacopyright/channels/476.html.
State CouncilAdministrative organs for Intellectual Property Protection
State Intellectual Property Office of the P.R.C. (SIPO)
Patents, utility models, industrial designs
Patent Office • Taking the lead in drafting the revised Patent Law and associated
regulations;• Formulating the principles and policies for foreign-related IPR
affairs;• Devising plans for nation-wide patent development and the
expansion of the patent information network;• Establishing the standards for the determination of both patent
right and the infringement thereof, as well as designating and managing the authorities charged with patent determination, offering guidance to local authorities in the settlement of patent disputes, investigating and handling of passing-off of patent issues, taking charge in the review of patent agencies and in the qualification of personnel in foreign-related patent agencies;
• Promoting the dissemination and publicity of the Patent Law and related regulations
• Etc.
Patent Re-examination Board of SIPO• Examine the request for re-examination submitted by an applicant
who is not satisfied with a decision made by the SIPO rejecting a patent application or an IC layout design application;
• Examine the request for patent invalidation and the request concerning withdrawal of an exclusive right of an IC layout design;
• With responsibility for the litigation work where the patent re-examination board is considered as the defendant of an administrative lawsuit.
State Administration for Industry and Commerce of the P.R.C. (SAIC)
Trademarks
Trade Office :• Take charge of trademark registration and
administration;• Carry out, in accordance with law, the protection
of the exclusive rights of trademarks, investigation on trademark infringements, handling of trademark disputes, and the recognition and protection of well-known trademarks;
• Undertake the registration, filing and protection of special marks and official marks;
• Conduct study and analysis on information of trademark registration, and publish the information according to law to provide information services for the public and government’s policy-making;
• Implement the trademark strategy.
Trademark Review and Adjudication Board • Examine the request for re-examining the decision
made by the Trademark Office regarding rejecting a trademark registration application, not approving a trademark registration, or cancelling a registered trademark;
• Hear the application of declaring the registered trademark invalid
• Attend administrative lawsuit related to trademark review and adjudication in accordance of the law
• Etc.
National Copyright Administration of the P.R.C. (NCA)
Copyrights
NCA • To participate in the drafting of laws, regulations and rules in
relation to copyright, and to draw out copyright administrative policies and measures and organise the implementation;
• To draw out the national copyright strategy and plan and organise the implementation;
• To supervise the implementation of laws, regulations and rules in relation to copyright;
• To organise the investigate into and deal with significant and foreign-related copyright infringement cases, organise and coordinate the special raid or actions against copyright infringement and piracy;
• To organise and promote the national software legalisation work; • To undertake the work concerning the establishment of copyright
pubic service system, supervise and administer the work of copyright registration, etc;
• To supervise and administer the copyright evaluation, trading and licensing business, provide guidance on the management of state-owned copyright assets, and responsible for the work concerning the national copyright demonstration;
• To deal with foreign-related copyright relations;• Etc.
Copyright Protection Center of China (CPCC)• Copyright registration;• Copyright appraisal;• Supervising International Standard Record Coding (ISRC) Center of
China• Etc.

41
On 21st March, 2018, the Communist Party of China (CPC) Central Committee released
a plan to restructure SIPO by incorporating part of functions of the SAIC, and the
General Administration of Quality Supervision, Inspection and Quarantine, to improve
operations including separated administration and overlapping enforcement (Xinhua,
2018). The restructuring is planned to be completed before the end of 2018, and SIPO
was renamed National Intellectual Property Administration of PRC (CNIPA) on 28th
August, 2018. The new agency will perform the combined duties of protecting IPR,
accelerating the establishment of an IPR protection system, registering/granting and
administratively adjudicating trademarks, patents and geographical indication of origin
(Xinhua, 2018).
3.2.2 The judicial track
There are three different types of litigation relating to IP matters in China: civil,
criminal and administrative litigation. Civil and criminal litigation takes place in the
people’s courts, which comprise a four-tier system (Bosworth & Yang, 2000; Long &
Wang, 2015). An overview of the judicial system in China is shown in Figure 3.2.
According to the Civil procedure law of PRC (2012), a Basic Level People's Court shall
have jurisdiction as the court of first instance over civil cases, unless the case has
significant influences, or is determined by the Supreme People’s court to be under the
jurisdiction of a higher level of court, or is an important foreign-related case. However,
since IP related cases have certain characteristics such as a high degree of complexity,
specialism and professionalism, which may be beyond the capacity of basic courts to
handle, the Supreme People’s court have issued different regulations regarding the
jurisdiction of Local People’s Courts over IPR civil cases of the first instance6.
6 According to “Notice of the Supreme People’s Court on Issuing the Standards for the Jurisdiction of the
Basic People’s Courts over Intellectual Property Civil Cases of First Instance” (The Supreme People's
Court of China, 2010), all IP civil cases which do not meet the requirements of “a civil case with the
subject matter of action at a value of less than £20.6 million, and the trial of first instance of a civil case
where the place of domicile of one party is outside its territorial jurisdiction or where a foreign, Hong
Kong, Macao or Taiwan element is involved with the subject matter of action at a value of at least £10.3
million”, cases of first instance shall be under the jurisdiction of the intermediate people's court, except
those which shall be designated by the Supreme People's Court with jurisdiction in civil cases concerning
general IPR.

42
Figure 3.2: Judicial system in China.
Source: Bosworth, D. & Yang, D., 2000. Intellectual property law, technology flow and
licensing opportunities in the People's Republic of China. International Business
Review, 9(4), pp. 453-477.
If a party is not satisfied with the judgment of the first instance trial, they can make an
appeal to the people's court at the next level. However, for IP related cases, the Supreme
People’s court have stipulated that if the civil case involves professional technologies,
including a patent for invention, utility model patent, new variety of plants, layout
design of integrated circuit, know-how, computer software or monopolistic IP, the
Supreme People's Court shall accept the appeal. In addition, if not satisfied with a first-
instance judgment or ruling rendered for an IP-related administrative case involving
professional technologies including patent, new variety of plants, layout design of
integrated circuit, know-how, computer software and monopolistic IP, the Supreme
People's Court shall accept the appeal as well (Standing Committee of the NPC, 2018).
Starting from 1993, intellectual property tribunals have been established in the
intermediate and higher people’s court, and even in the basic level people’s court in
some specific cities (e.g., Beijing, and Shanghai) (Bosworth & Yang, 2000). As of
2014, there are 164 basic level people’s courts with jurisdiction in general IP civil cases
of first instance in 20 provinces or municipalities, and most of these courts are in
provinces or municipalities with more developed technology and economy, such as
Beijing, Jiangsu, Zhejiang, Guangdong, and Shanghai7 (The Supreme People's Court of
7 The number of basic level people’s courts with jurisdiction in general IP civil cases of first instance in
top five provinces or municipalities are: 12 courts in Beijing, 35 courts in Jiangsu, 32 courts in Zhejiang,
33 courts in Guangdong, and 6 courts in Shanghai.

43
China, 2015). In order to promote the implementation of the national strategy of
development driven by innovation and further strengthen the judicial protection of
intellectual property rights, Special Intellectual Property Courts were established in
Beijing, Shanghai, and Guangzhou by the end of 2014 (The Standing Committee of the
NPC, 2014). According to “Interpretation of the Supreme People's Court on the
Application of the Civil Procedure Law of the PRC” (The Supreme People's Court of
China, 2015), Patent infringement cases shall be under the jurisdiction of intellectual
property courts, as well as the intermediate people's courts and basic people's courts
specified by the Supreme People's Court8.
Courts are responsible for judicial enforcement regarding patents (Yang, 2003). There
are four major ways of dispute settlement in China: consultation, mediation, arbitration
and litigation. Among these, consultation, mediation and arbitration are preferred in
China due to cultural reasons. Compared with litigation, these are also more flexible,
less time consuming and costly (Yang & Clarke, 2005; Bosworth & Yang, 2000). Since
IPR protection is enforced via a dual-track system in China, disputes can either be
submitted to courts or the relevant administrative authorities (Cao, 2014). How are IPR
protected through legislations and how specifically have the IPR related laws evolved?
The following sections will discuss this.
3.3 The evolution of Chinese IPR related laws
In this section, we develop a deeper understanding of how the IPR related laws in China
have evolved over time. We start with introducing the overall picture of the Chinese
legislative system and the time when each revision was issued, and then discuss what
changes have been brought with each revision of each type of law.
8 The Supreme People’s court also issued Provisions on the Jurisdiction of the IP Courts of Beijing,
Shanghai and Guangzhou on 27th October 2014, which stipulated that the IP Courts have first instance
jurisdiction over the following cases (The Supreme People's Court of China, 2014): “1. Civil and
administrative cases involving patent, new plant varieties, layout designs for integrated circuits, technical
trade secrets, and computer software; 2. Court appeals against administrative acts involving copyright,
trademarks and unfair competition, made by State Council departments or the local governments above
county level; and 3. Civil cases involving the recognition of well-known trademarks. In addition, appeals
against IP civil and administrative first-instance judgments or orders made by the basic people’s courts in
the location of the IP courts involving copyright, trademark, technology contracts, unfair competition,
shall be under the jurisdiction of the IP courts. However, appeals against the first-instance judgments and
orders made by the IP Courts shall be under the jurisdiction of the IP trial division of the superior
people’s court in the location of the IP court”.
44
3.3.1 Legislative guidance
The Chinese legislative system operates on two levels (Figure 3.3). At the top, the
National People's Congress (NPC) is responsible for enacting and amending the
constitution, criminal, civil, and state organic laws and other basic laws (NPC, 2015). It
also handles the nominations and removals of presidents of the Supreme People's court
(Yang & Clarke, 2005). The Standing Committee of NPC enacts and amends all the
other laws except those that should be enacted by the NPC. The NPC functions through
the Standing Committee while it is not in session, and it can partially amend and
supplement national laws enacted by the NPC on the basis that the amendment or
supplement do not contravene the basic principles of national law (NPC, 2015). Its legal
function also includes legal interpretation, examination of bills drafted by the State
Council, and appointment and removal of vice presidents and judges of the Supreme
People’s Court, and members of the Judicial Committee (Yang & Clarke, 2005).
At the lower legislative tier, various local People's congresses, representing either
provinces, autonomous regions, municipalities, or ministries, are responsible for
enacting local decrees on the basis that they will not contravene any provision of the
Constitution, national law and administrative regulations (NPC, 2015). In addition, the
various ministries, commissions, the People's Bank of China, the Auditing Agency, and
a body directly under the State Council exercising regulatory function, may enact
administrative rules within the scope of its authority in accordance with national laws,
administrative regulations, as well as decisions and orders of the State Council (NPC,
2015).
Based on this system, China has three different types of legal code: national law,
administrative regulations, local decrees, autonomous decrees and special decrees, and
rules. National law has higher legal authority than administrative regulations, local
decrees and administrative or local rules. Administrative regulations have higher legal
authority than local decrees and administrative or local rules (NPC, 2015).

45
Figure 3.3: The legislative system of China.
Source: National People’s Congress (2015). The Legislation Law of The People’s
Republic of China
3.3.2 An overview of evolutionary changes in the Chinese IP system
The establishment of the Chinese IP system can be traced back to the end of the Qing
Dynasty (1636-1912), when the Qing government was forced to accept the revolution
and establish the modern legal system due to the introduction of Western capitalism
(Liu, 2015). “Reward Regulations on the Development of Technology”, “Trial
Procedures of Trademark Registration”, and “Copyright Law of Qing Dynasty” were
enacted in 1989, 1904 and 1910 respectively by the Qing government (Liu, 2015).
However, it is claimed that the society at that time was not prepared for such change
since the traditional Chinese culture has greatly affected people’s view of IP (Yang,
2003). The failure of this reform may be attributed to two reasons: first, people in China
lack understanding of the concept of IP due to the influences of Confucianism (Cao,
2014; Peng, et al., 2017). Second, Chinese people at that time valued agriculture highly,
but the development of industry and commerce were undervalued. The reform
challenged this traditional social ideology, but its own influence and inspiration were
too weak to reform successfully (Yang, 2003).
Although the reform failed and the Qing government was soon overthrown, these laws
were partially inherited by the following governments: The Provisional Government of
the Republic of China, Beiyang Government, and Nationalist government (this whole
period is from 1911 to 1949) (Liu, 2015). Due to the limitation of the specific economic

46
and social conditions, as well as the influence of traditional ethics and culture in China,
the IP related laws that existed during that period of time were not thoroughly
implemented, but they still influenced the Chinese society deeply (Liu, 2015; Yang,
2003).
In 1949, the PRC was established. However, during the first 30 years of establishment,
the public ownership system of sole production means was adopted under the theories
of Marxism, Leninism and Maoism. This system was not suitable for the development
of a market economy, and was also not able to provide the necessary social and
economic conditions for the establishment of an IP system (Liu, 2015). Therefore, it is
agreed by researchers that the establishment of a systematic IP system in China started
after 1978 when China adopted an “Open-door policy” (Liu, 2015; Yang, 2003). The
adoption of the “Open-door policy” initiated the beginning of a comprehensive
economic reform, which aimed to transform the planned economy to a socialist market
economy with “Chinese characteristics” (Hou, 2011; Yang, 2003).
Table 3.1 shows the milestones in the progress of China’s IP system. In 1979, China
and the US initiated a Sino-US Trade Agreement. One of the provisions stated that both
parties acknowledged the importance of protecting patents, trademarks and copyrights
in trade relations, and both parties agreed that the strength of IPR protection provided to
the individual or legal person from the other party’s country should be compatible with
the other party to give their own such protection (China and United States, 1979). Soon
after this, China signed the WIPO convention in 1980, and since then China has
undertaken a revolutionary transformation with respect to IPR from a country without
any protection to one with a broad and systematic system (Yang, 2003). The first
Trademark and Patent Laws were enacted in 1982 and 1984, respectively. The United
States Trade Representative (USTR) started publishing the Special 301 Report in 1989,
which evaluates the IPR protection strength of the US’s trading partners (USTR, 1989).
In the report published in 1989, China was put on the “Priority Watch list”, and the
report stated that as a trading partner to the US, China should make progress in
“enacting Copyright law (including copyright protection of software) and improve and
adequate patent protection for all classes of inventions” (USTR, 1989). It can be noted
that the Copyright Law was enacted a little later in 1990 (Regulations on Computer
Software Protection was also enacted one year later after the Copyright Law was
enacted). At the same time, China established SIPO and NCAC, and also joined the
Paris Convention for the Protection of Industrial Property, the Madrid Agreement
47
Concerning the International Registration of Marks, and the Washington Treaty on
Intellectual Property in Respect of Integrated Circuits during the same period of time.
Even though China enacted the Copyright law and copyright protection of software in
1990 and 1991 respectively, China was still on the priority watch list in the Special 301
Report published in 1990 due to its inadequate protection of patent (USTR, 1990). The
situation between China and the US was not getting better, and China was listed as one
of the priority foreign countries in 1991, which means the USTR must start a 6 months
section 301 investigation of that country within 30 days if such country was identified
as a priority foreign country, and measures might be taken by the USTR at the end of
the investigation (USTR, 1991). In the Special 301 report published in 1991, which
mentioned that China was the only major trading partner of US that offered “neither
product patent protection for pharmaceuticals and other chemicals, or copyright
protection for US works. Trademarks are granted to the first registrant in China
regardless of the original owner. Trade secrets are not adequately protected” (USTR,
1991).
In order to settle the Section 301 action, China and the US started a negotiation of IPR
protection in China in 1991, and entered into the “China-US: Memorandum of
Understanding on The Protection of Intellectual Property” (MOU) in 1992 (Kshetri,
2009). The MOU firstly required the Chinese government to revise its patent laws to
include chemical inventions (pharmaceuticals and agricultural chemicals) as its
patentable subject matter, and also provided requirements regarding term of protection,
compulsory licenses and rights conferred which should be included in patent law.
Second, the MOU required the Chinese government to enact a bill related to the
protection against unfair competition, which should be implemented before 1st January
1994. Third, the MOU also required China to accede to the Berne Convention for the
Protection of Literary and Artistic Works (Berne Convention) and Convention for the
Protection of Producers of Phonograms Against Unauthorized Duplication of Their
Phonograms (Geneva Convention), the Chinese government was required to issue new
regulations to comply with these two conventions and the MOU (China and United
States, 1992). It can be noted that China revised its Patent law (1992) and Trademark
law (1993), and enacted Anti-unfair competition law (1993). China not only joined the
Berne Convention (1992) and Geneva Convention (1992) as required by the MOU, but
also acceded to a series of the international IP treaties, such as Universal Copyright
Convention, Patent Cooperation Treat, Nice Agreement Concerning the International
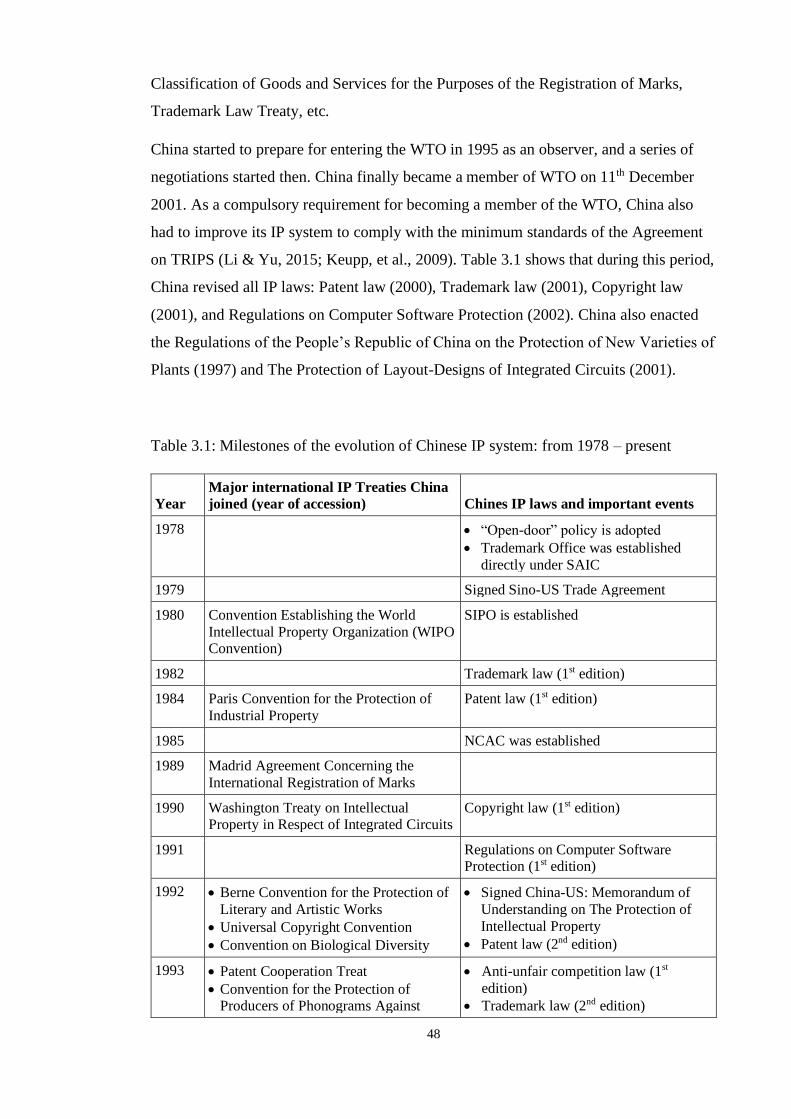
48
Classification of Goods and Services for the Purposes of the Registration of Marks,
Trademark Law Treaty, etc.
China started to prepare for entering the WTO in 1995 as an observer, and a series of
negotiations started then. China finally became a member of WTO on 11th December
2001. As a compulsory requirement for becoming a member of the WTO, China also
had to improve its IP system to comply with the minimum standards of the Agreement
on TRIPS (Li & Yu, 2015; Keupp, et al., 2009). Table 3.1 shows that during this period,
China revised all IP laws: Patent law (2000), Trademark law (2001), Copyright law
(2001), and Regulations on Computer Software Protection (2002). China also enacted
the Regulations of the People’s Republic of China on the Protection of New Varieties of
Plants (1997) and The Protection of Layout-Designs of Integrated Circuits (2001).
Table 3.1: Milestones of the evolution of Chinese IP system: from 1978 – present
Year
Major international IP Treaties China
joined (year of accession) Chines IP laws and important events
1978 • “Open-door” policy is adopted
• Trademark Office was established
directly under SAIC
1979 Signed Sino-US Trade Agreement
1980 Convention Establishing the World
Intellectual Property Organization (WIPO Convention)
SIPO is established
1982 Trademark law (1st edition)
1984 Paris Convention for the Protection of
Industrial Property
Patent law (1st edition)
1985 NCAC was established
1989 Madrid Agreement Concerning the
International Registration of Marks
1990 Washington Treaty on Intellectual Property in Respect of Integrated Circuits
Copyright law (1st edition)
1991 Regulations on Computer Software Protection (1st edition)
1992 • Berne Convention for the Protection of
Literary and Artistic Works
• Universal Copyright Convention
• Convention on Biological Diversity
• Signed China-US: Memorandum of
Understanding on The Protection of
Intellectual Property
• Patent law (2nd edition)
1993 • Patent Cooperation Treat
• Convention for the Protection of Producers of Phonograms Against
• Anti-unfair competition law (1st
edition)
• Trademark law (2nd edition)
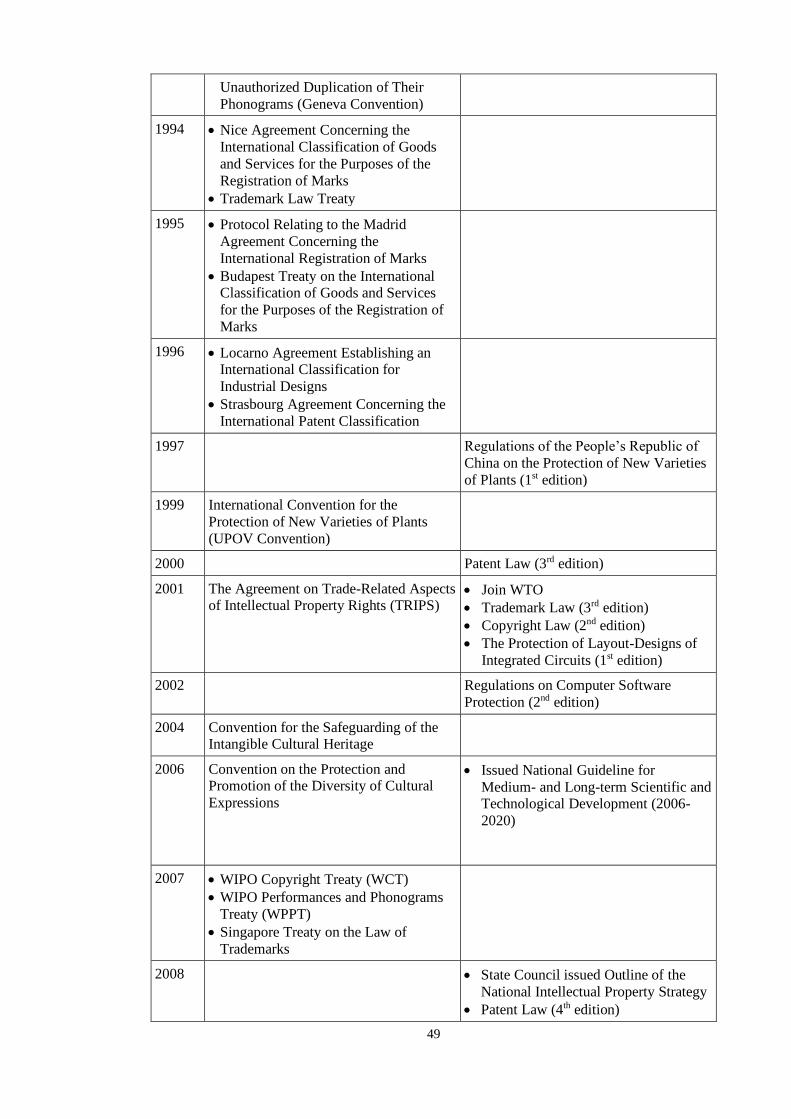
49
Unauthorized Duplication of Their
Phonograms (Geneva Convention)
1994 • Nice Agreement Concerning the
International Classification of Goods
and Services for the Purposes of the
Registration of Marks
• Trademark Law Treaty
1995 • Protocol Relating to the Madrid
Agreement Concerning the
International Registration of Marks
• Budapest Treaty on the International Classification of Goods and Services
for the Purposes of the Registration of
Marks
1996 • Locarno Agreement Establishing an International Classification for
Industrial Designs
• Strasbourg Agreement Concerning the
International Patent Classification
1997 Regulations of the People’s Republic of
China on the Protection of New Varieties
of Plants (1st edition)
1999 International Convention for the
Protection of New Varieties of Plants
(UPOV Convention)
2000 Patent Law (3rd edition)
2001 The Agreement on Trade-Related Aspects of Intellectual Property Rights (TRIPS)
• Join WTO
• Trademark Law (3rd edition)
• Copyright Law (2nd edition)
• The Protection of Layout-Designs of
Integrated Circuits (1st edition)
2002 Regulations on Computer Software
Protection (2nd edition)
2004 Convention for the Safeguarding of the Intangible Cultural Heritage
2006 Convention on the Protection and Promotion of the Diversity of Cultural
Expressions
• Issued National Guideline for
Medium- and Long-term Scientific and Technological Development (2006-
2020)
2007 • WIPO Copyright Treaty (WCT)
• WIPO Performances and Phonograms
Treaty (WPPT)
• Singapore Treaty on the Law of
Trademarks
2008 • State Council issued Outline of the
National Intellectual Property Strategy
• Patent Law (4th edition)
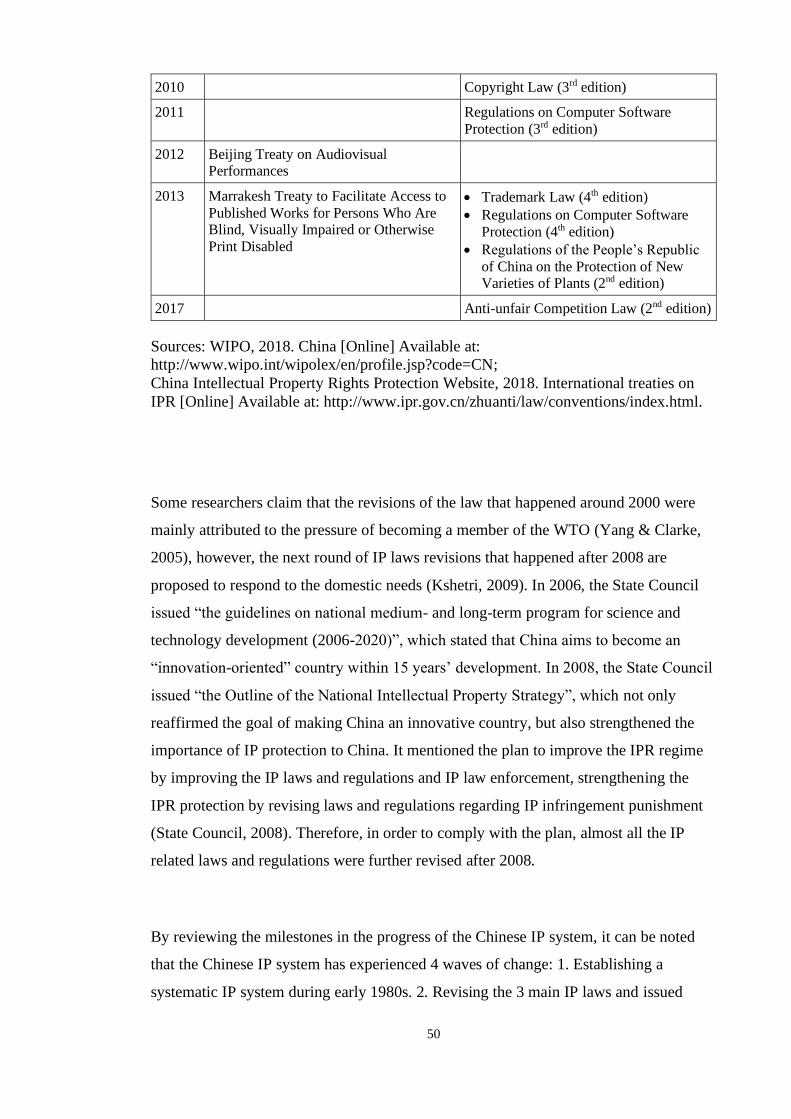
50
2010 Copyright Law (3rd edition)
2011 Regulations on Computer Software
Protection (3rd edition)
2012 Beijing Treaty on Audiovisual Performances
2013 Marrakesh Treaty to Facilitate Access to
Published Works for Persons Who Are Blind, Visually Impaired or Otherwise
Print Disabled
• Trademark Law (4th edition)
• Regulations on Computer Software
Protection (4th edition)
• Regulations of the People’s Republic
of China on the Protection of New Varieties of Plants (2nd edition)
2017 Anti-unfair Competition Law (2nd edition)
Sources: WIPO, 2018. China [Online] Available at:
http://www.wipo.int/wipolex/en/profile.jsp?code=CN;
China Intellectual Property Rights Protection Website, 2018. International treaties on
IPR [Online] Available at: http://www.ipr.gov.cn/zhuanti/law/conventions/index.html.
Some researchers claim that the revisions of the law that happened around 2000 were
mainly attributed to the pressure of becoming a member of the WTO (Yang & Clarke,
2005), however, the next round of IP laws revisions that happened after 2008 are
proposed to respond to the domestic needs (Kshetri, 2009). In 2006, the State Council
issued “the guidelines on national medium- and long-term program for science and
technology development (2006-2020)”, which stated that China aims to become an
“innovation-oriented” country within 15 years’ development. In 2008, the State Council
issued “the Outline of the National Intellectual Property Strategy”, which not only
reaffirmed the goal of making China an innovative country, but also strengthened the
importance of IP protection to China. It mentioned the plan to improve the IPR regime
by improving the IP laws and regulations and IP law enforcement, strengthening the
IPR protection by revising laws and regulations regarding IP infringement punishment
(State Council, 2008). Therefore, in order to comply with the plan, almost all the IP
related laws and regulations were further revised after 2008.
By reviewing the milestones in the progress of the Chinese IP system, it can be noted
that the Chinese IP system has experienced 4 waves of change: 1. Establishing a
systematic IP system during early 1980s. 2. Revising the 3 main IP laws and issued

51
some IP related regulations during early 1990s due to pressure from the US
government. 3. Revising the IP laws and regulations around 2000 for the purpose of
becoming a member of the WTO. 4. Improving the IP laws and regulations after 2008 in
order to comply with the development goal of the Chinese government. However, from
previous studies, it is not clear whether and which of these three waves of change
brought a radical improvement to the Chinese IP system.
Ginarte and Park (1997) developed an index of patent systems strength which can be
used to reflect the quality of the patent law (Brander, et al., 2017). This index is based
on five elements: coverage (patentability of varied types of products), membership in
international treaties, duration of protection, enforcement mechanisms, and restrictions
on patent rights. Most of the products listed by Ginarte and Park are patentable in
China, and China also joined all the international treaties listed by them. Therefore,
based on the five aspects developed by Ginarte and Park (1997) which are used to score
patent systems strength, and also considering the characteristics of Chinese law, we
build a new five-dimensional assessment scheme which is used to analyse the changes
of the IP law revisions. A revision of IP law could be viewed as improvement if: (1) the
scope of protection is expanded; (2) the duration is extended to be consistent with the
international standards, the procedural provisions are simplified and clearly defined
regarding application, transferring IP rights, declaring an IP right invalid, re-examining,
etc.; (3) enforcement mechanisms9: more powers are granted to administrative and
judicial authorities, and each of their duties are defined clearly; (4) protection strength
of IP rights10: the types of acts considered as infringement are clearly defined, and
punishment for IP infringer is increased; (5) the restrictions on IP rights are clearly
defined, and consistent with international standards. In the following section, we
analyse more precisely what changes each revision of the three main IP laws (Patent
law, Copyright law, and Trademark law) introduced based on these five aspects, and
detailed content regarding these revisions are shown in Appendix A111).
9 Enforcement mechanism refers to the types of power can be exercised by administrative and judicial
authorities, and how to exercise those power. 10 Protection strength of IP rights refers to what type of act will be considered as infringement, and the
punishment IP infringer will receive. 11 The content in the Appendix A1 is summarised and directly cited from the provisions of IP laws in
China.
52
3.3.3 First wave of revisions (1990s)
Unlike Patent law and Trademark law which were enacted in 1980s, the Copyright law
was first enacted in 1990, so the first wave of revisions happened during 1990s only
involved Patent law and Trademark Law, and these will be analysed below.
3.3.3.1 Patent law (1992)
In the previous section we stated that the MOU required the Chinese government to
revise its patent law to include chemical inventions as patentable subject matters, and
also provided requirements regarding term of protection, compulsory licenses and rights
conferred which should be included in patent law. From the main aspects of patent law
that were revised in 1992, it can be noted that the revisions generally meet such
requirements of the MOU.
First, with regard to scope of protection, the 1992 amendment not only expanded
patentable subject matter by removing “Food, beverage and condiment; Drugs and
substances obtained by chemical means”12 from the list of subjects which shall not be
granted patent rights, but also extended the protection of patented methods to include
“use, sell the products that are developed directly through the use of the patented
method”13. In addition, the 1992 amendment granted a new right to the patentee14. The
1992 amendment added that the foreign applicant enjoys the same right of priority as
the Chinese applicant15. Second, the first revision of patent law extended the duration of
patent protection from 15 to 20 years for invention patents to comply with international
standards (e.g., EPO, JPO), and the duration of utility model patent and design patent
was extended from 5 to 10 years16. This harmonised most national IP regimes. The
revision also perfects the procedure provision of patent application, examination and
approval of patent applications, which include the following aspects: further clarified
the scope of patent application documents that can be modified17; the 1992 amendment
added more detailed provisions that are related to declaring a patent right invalid18; and
12 Patent law, 1984, Article 25, section(s) 4 & s5. 13 Patent law, 1992, Article 11, paragraph 1. 14 Patent law, 1992, Article 11, paragraph 3. 15 Patent law, 1992, Article 29. 16 Patent law, 1992, Article 45. 17 Patent law, 1992, Article 33. 18 Patent law, 1992, Article 50.
53
the time limit for revoking a patent right changed from “within three months since the
date the patent office announces the patent application”19 to “within six months since
the date that the patent office announced the grant of patent right”20. Third, the 1992
amendment strengthened the patent rights protection by adding a provision that is
related to punishment of counterfeits21. Fourth, the amendment changed the conditions
for compulsory licensing for exploitation of a patent by putting more restriction on the
administrative department to grant a compulsory license for exploitation of a patent22.
3.3.3.2 Trademark law (1993)
Some researchers argue that the Chinese IP laws drafted are greatly affected by the
international treaties and conventions China joined (Yang & Clarke, 2005). Before
China first revised its Trademark law in 1993, it joined the Madrid Agreement
Concerning the International Registration of Marks in 1989, seven years after it enacted
the first Trademark law. Yang and Clarke (2005) claimed that the 1993 amendment of
Trademark law in China is based on the Madrid Agreement. The 1993 amendment
mainly covers changes in 3 aspects:
First, the 1993 amendment included service trademarks in the law in addition to
trademarks for goods, it also added certain type of “geographic names” that cannot be
used as trademarks23. Second, it perfects the procedures for Trademark Registration by
making changes of three different aspects: (1) Simplified the procedure “Where same
applicant for registration of a trademark intends to use the same trademark for goods in
different classes”24. (2) Added a new provision in article 27 which provides that the
trademark office shall cancel the registered trademark if “the registration of a trademark
was acquired by fraud or any other unfair means”. Third, strengthened the protection of
trademarks by not only enlarging the scope of acts that shall be considered infringement
of registered trademarks, but also made more detailed provisions regarding
counterfeiting a registered trademark25. In addition, the 1993 amendment specified that
19 Patent law, 1984, Article 41. 20 Patent law, 1992, Article 41. 21 Patent law, 1992, Article 63, paragraph 2. 22 Patent law, 1992, Articles 51&52. 23 Trademark law, 1993, Article 4, and Article 8. 24 Trademark law, 1993, Article 12. 25 Trademark law, 1993, Article 38.
54
when the case is serious enough to constitute a crime, the party shall be prosecuted
according to the law (Article 40).
It can be noted that the revisions in 1990s did improve the quality of both Patent law
and Trademark law regarding its protection scope, duration and the procedures of
application/registration, and protection strength. Although some researchers argue that a
relatively complete trademark legal system was basically established in China with this
revision (He, 2013), and the revision also narrowed down the gap between Chinese
Patent law and international standard of patent protection, the improvement is still
limited.
3.3.4 Second wave of revisions (2000s)
In the previous section we show that China prepared for joining the WTO from 1995,
since it is the member country’s obligation to provide appropriate IP laws which should
comply with the minimum standards of TRIPS (Papageorgiadis & McDonald, 2018).
Researchers argue that joining the WTO served as accelerator for improving the existent
laws of IP in China (Wang, 2004), and it is widely agreed that all relevant Chinese IP
laws revised during this period of time (for example, Patent law (2000), Trademark law
(2001) and Copyright law (2001)) are for the purpose of fulfilling such obligations (Cox
& Sepetys, 2009; Li & Yu, 2015). The revisions of each type of law will be analysed in
more detail in below.
3.3.4.1 Patent law (2000)
Compared with the 1992 amendment of Patent law, the 2000 amendment involved
changes to 35 provisions. The major differences between the 1992 and 2000
amendments can be summarised in five different aspects.
First, the 2000 amendment enlarged the scope of patent rights protection by including
“offer to sell the patented production or the products that are developed directly through
the use of patented method”26 to be one type of the acts that a patentee can prohibit
others to exploit the patent without his/its permission. Second, it deleted all the
26 Patent law, 2000, Article 11, section 1.

55
provisions related to revoking patent rights, and only kept the provisions related to
declaring a patent right invalid to avoid the confusing when implementing relevant
provisions. The 2000 amendment simplified the procedures for Chinese unit or
individual applying for patent in a foreign country, and the procedures to transfer a
patent right to a foreigner27. In addition, it also perfects the procedures of declaring a
patent invalid and protecting patent rights28.
Third, with regard to enforcement mechanism, the changes made to Patent law include:
(1) the 2000 amendment clearly defined the job functions of the IP related
administrative departments, and also specified the obligations of the relevant
administration department29. (2) Added pre-litigation provisional measures that a
patentee can take to protect his/its rights30. (3) The amendment provides that an
application for a patent for utility model or design or a patent reexamination or
invalidation shall finally be examined by the court31, while such final decisions in the
1992 amendment are made by the Patent review board.
Fourth, it strengthened the protection of IP by revising the Patent law in accordance to
the requirement of TRIPS. The changes made to Patent law not only include adding a
provision to protect the bona fide third party from considering his/its act as infringement
in Article 6332, but also clarified the way to calculate the amount of compensation33.
Last but least, modified the conditions for granting a compulsory license by putting
more strict conditions on granting a compulsory license for exploitation of a patent34.
Some scholars claim that this revision made Patent law one of the laws closest to the
TRIPS standards in the Chinese IP system, with some provisions even the same as what
is required in TRIPS or very close to the requirement (Liu, 2002). However, some
researchers found that a patent protection gap still exists between China and other
developed countries, which indicates that the patent system in China could be further
improved (Gao, 2008).
27 Patent law, 2000, Articles 19 & 20. 28 Patent law, 2000, Articles 45, 46, 47. 29 Patent law, 2000, Articles 66 & 67. 30 Patent law, 2000, Article 61. 31 Patent law, 2000, Article 41 s2; Article 46, s2. 32 Article 63 provides that if anyone “uses, or sells a patented product without knowing that such product
is produced and sold without permission of the patentee, or such product is directly obtained by using the
patented method, he shall not be liable for compensation provided that the legitimate source of the
product can be proved”. 33 Patent law, 2000, Article 60. 34 Patent law, 2000, Articles 51, 52, 55.

56
3.3.4.2 Trademark law (2001)
The purpose of revising the Trademark law in 2001 was for joining the WTO and
meeting the minimum requirement of TRIPS, similarly to the revisions of the revising
Patent law and Copyright law. The 2001 amendment of Trademark law revised 23
articles of the 1993 Trademark law and added 23 articles, it is stated that this revision
has greatly changed content of 1993 Trademark law (Xiao, 2007). The changes are
summarised in the following points.
First, regarding the scope of protection, the changes made to Trademark law include: (1)
Enlarged the scope of applicants by granting a “natural person” the right to apply for
trademark registration, as well as adding a situation where more than one applicant can
“jointly file an application” and “jointly enjoy and exercise the exclusive right to use the
trademark”35. (2) It not only expanded the types of visual signs that can be registered as
trademarks and the types of trademarks, but also modified and revised the cases when a
sign cannot be used or registered as a trademark36. (3) In order to keep consistent with
provisions of TRIPS, the 2001 amendment added provisions to protect well-known
trademarks37.
Second, the new amendment perfected the procedures related to application for
trademark registration and assignment of registered trademarks, as well as the
procedures related to requiring the Trademark Review and Adjudication Board for
adjudication of trademarks with disputes38.
Third, the enforcement mechanism is improved in following aspects: (1) Established a
judicial review system for reviewing the decision or adjudications made by the
administrative departments39. (2) Assigned certain power to the administrative authority
for industry and commerce to protect the trademark right, stop and punish trademark
35 Trademark law, 2001, Articles 4&5. 36 Trademark law, 2001, Articles 8-12. 37 Trademark law, 2001, Article 14. 38 Trademark law, 2001, Articles 26, 29, 33. 39 Trademark law, 2001, Articles 32, 34, 43.

57
infringement40. (3) The newly added articles 5741 and 5842 are related to “property
preservation before litigation” and “evidence preservation”. (4) The 2001 Trademark
law added the obligations of the staff member who works in relevant administrative
departments43.
Fourth, it strengthened the protection strength of Trademark law by increasing the
amount of compensation. In particular, the 2001 Trademark law not only added “the
appropriate expenses of the infringee for stopping the infringement” to be part of the
compensation, but also confirmed that “the People's Court shall impose an amount of
damages of no more than £51,50044 according to the circumstances of the infringement
if it is difficult to determine the profit that the infringer has earned or the injury that the
infringee has suffered”45.
Some researchers claim that the 2001 amendment basically implemented the relevant
requirements of TRIPS, with no big difference when comparing with the international
trademark rules regarding the overall framework and major system design of the
trademark legislation (He, 2013; Jin, 2013). However, gaps still exist between the
Chinese Trademark law and TRIPS standards in several different aspects, such as
protection standards and level of Chinese Trademark law are comparative low, more
subjects should be included in the scope of protection content (Wei, 2012).
3.3.4.3 Copyright law (2001)
The Copyright law enacted in 1990 has 56 articles, and the first amendment of
Copyright law has 60 articles, of which 53 are modified or added. The purpose of
revising the Copyright law was also to meet the minimum requirements of TRIPS, so
this amendment is basically modified according to the relevant provisions of the Berne
Convention for the Protection of Literary and Artistic Works, TRIPS and other related
40 Trademark law, 2001, Articles 53, 54, 55. 41 Article 57 provides that a trademark registrant or interested parts may file an application with the
People's Court to take measures for property preservation before litigation if he/it has evidence to show
that another person is committing or will commit an infringement of the right to use its or his registered
trademark, and irreparable damages will be caused if failing to stop the infringement. 42 Article 58 provides that “In order to stop an infringing act, any trademark registrant or interested party
may file an application with the People's Court for evidence preservation before instituting legal
proceedings where the evidence will possibly be destroyed or lost or difficult to be obtained again in the
future”. 43 Trademark law, 2001, Articles 60, 61, 62. 44 We use the average exchange rate of RMB to GBP, 1 RMB = £0.103 45 Trademark law, 2001, Article 56.
58
international treaties, as well as the development of the internet (Gao, 2002). The
changes of the Copyright law can mainly be categorised into 5 different aspects, which
are analysed in more detail below.
First, the 2001 amendment redefined the protection content and scope in the Copyright
law. The changes made in this category comprise four parts: (1) Expanded the objects of
copyright protection by including “acrobatic works, architecture, works created by
virtue of an analogous method of film production, model works, and a work that is
created by compilation of several works, parts of works, data that do not constitute a
work or other materials and having originality in the selection or arrangement of its
contents”46. (2) Specified the copyright in the internet environment47. (3) Added new
types of personality rights and property rights that should be included in copyrights48.
(4) The 2001 amendment added a requirement that a producer of sound recordings or
video recording or the publisher shall obtain permission from the copyright owner for
exploiting its/his work49. (5) Modified and strengthened the rights of the owner of
“neighbouring rights”50 can enjoy51. (6) Changed the rights that shall be enjoyed by the
owner of a cinematographic work52.
Second, the new amendment requires that assignment of a copyright shall conclude a
contract in writing, and specifies the basic clauses that should be included in the
contract. The 2001 Copyright law also revoked the provision that “the term of validity
of a contract shall not exceed 10 years”53.
46 Copyright law, 2001, Article 3.
47 Copyright law, 2001, Article10, s12; Article 37, s6; Article 41, 42, 47, 48. 48 Copyright law, 2001, Article10. 49 Copyright law, 2001, Article39. 50 Neighbouring rights, also referred to as related rights, are defined as “protect the legal interests of
certain persons and legal entities that contribute to making works available to the public or that produce subject matter which, while not qualifying as works under the copyright systems of all countries, contains
sufficient creativity or technical and organizational skill to justify recognition of a copyright-like property
right. Traditionally, related rights have been granted to three categories of beneficiaries: performers,
producers of phonograms and broadcasting organizations” (WIPO, 2016). 51 For example, the 2001 amendment added that “a publisher has the right to license or prohibit any other
person to use the typographical arrangement of books or periodicals he has published, the term of
protection for such right is 10 years”. The types of rights a producer of sound recordings or video
recordings can enjoy expanded from “to authorize others to reproduce“ to “reproduce, distribute, rent and
communicate to the public on an information network”. 52 Copyright law, 2001, Article15. 53 Copyright law, 1990, Article 26.

59
Third, the strength of copyright protection provided by the relevant administrative
departments and judiciary authorities is enhanced. The new amendment54 not only
clearly defined the legal status of the copyright administration department, but also
expanded the administrative penalties that the copyright administration department may
impose to deal with the infringement. It added new articles regarding specific measures
that the People’s Court could take to protect the rights of copyright owners, the
amendment also specifies that the court should make a decision within 48 hours
regarding whether or not to take such measures55. Furthermore, it added a new article
which provides that the publisher or producer of a reproduction, the distributor of a
reproduction, and the renter of the reproduction of a cinematographic work has the
obligation to provide evidence to prove that his/its distributed or rented reproduction
has been from a lawful source56.
Fourth, several provisions are modified so that the copyright protection by judiciary
authorities can be further strengthened. The revisions include: (1) Article 46 adds new
types of infringement acts that should bear civil liability, such as “plagiarizing a work of
another person”, “exploiting the typographic arrangement of a book or periodical
without the permission of the publisher”, etc. (2) Article 47 adds new types of
infringement acts that should bear civil liability, and in some circumstances, it may bear
administrative penalties, or the infringer may be prosecuted if the act constitutes a
crime. For example, “distributing, performing, showing, broadcasting, compiling or
communicating to the public on an information network a work created by another
person, without the permission of the copyright owner”. (3) Clarified how to calculate
and decide the amount of compensation57.
54 Article 47 provides that if the infringement is harming the public interest at the same time, “a copyright
administration department may order to cease the infringing act, confiscate unlawful income from the act,
confiscate and destroy infringing reproductions and impose a fine. where the circumstances are serious,
the copyright administration department may also confiscate the materials, tools, and equipment mainly
used for making the infringing reproductions”. 55 Copyright law, 2001, Article50. 56 Copyright law, 2001, Article52. 57 Articles 48 provides the amount of compensation shall be “the actual injury suffered by the right holder,
where the actual injury is difficult to compute, the damages shall be paid on the basis of the unlawful
income of the infringer. The amount of damages shall also include the appropriate fees paid by the right
holder to stop the infringing act”. It also specifies that if “the right holder's actual injury or infringer's
Unlawful income cannot be determined, the People's Court shall Judge the damages not exceeding
£51,500 depending on the circumstances of the infringing act”.

60
Fifth, it narrowed down the scope of reasonable use of copyright, and also revised
several occasions that do not need the permission from the copyright owner58.
These five aspects of changes show that the 2001 amendment brought a tremendous
change to the Copyright law in China. This amendment not only narrowed down the gap
between the Copyright law of China and relevant international treaties, but also
improved the level of protections for copyright owners (Gao, 2008). The revision is also
important for the growth of creative industries in China, such as software design.
3.3.5 Third wave of revisions (since 2008)
In order to achieve the goal of making China an innovative country, “the Outline of the
National Intellectual Property Strategy” issued in 2008 specified that one of the
strategic focuses is to improve the IP regime by promptly revising Patent law,
Trademark law and Copyright law and related regulations (State Council, 2008).
Another wave of IP laws revisions started since then. Some researchers claim that the IP
law revisions conducted during this period are driven by the domestics needs for the
first time in the IP regime development history in China (Wu, 2009).
3.3.5.1 Patent law (2008)
Researchers argue that the 2008 Patent law was motivated neither by external pressure
nor by the pressure of complying with international treaties. The amendment this time
was enacted mainly for China’s own goal of improving its innovation ability by
enhancing the level of IP protection (Li & Yu, 2015; Yang & Yen, 2009). The 2008
amendment modified 36 articles, and the revisions can be categorised into five aspects.
First, the 2008 amendment raised the standards for patent applications. For example, the
novelty requirement for patentability is raised from a “relative novelty” standard to an
“absolute novelty” standard. The requirement of “creativity” is also changed from
comparing with technologies available before the date of application into comparing
58 For example, article 23 states that “in compiling and publishing textbooks for implementing the nine-
year compulsory education and the national educational program, parts of published works, short written
works, music works or single copies of works of painting or photographic works may be compiled into
textbooks without the authorization from the authors, except where the authors have declared in advance
the use thereof is not permitted”.

61
with the existing technologies. The requirements for granting a patent right to a design
are also raised59. Restrictions have been put on the patent right in the 2008 amendment,
which provides that only one patent can be granted for the same invention60. More
importantly, the 2008 Patent law add provisions of generic resources61. Furthermore, it
enlarged the scope of patent protection by adding “offer to sell” to be the type of acts
which requires permission of the patentee if a unit or individual intends to exploit a
design patent62.
Second, the new amendment reduced the requirements for a Chinese unit or individual
to apply for a patent abroad, and the requirement for foreigner/foreign enterprise/foreign
organisation to apply for a patent in China, as well as the requirements when a Chinese
unit or individual intends to transfer the patent right to a foreigner/foreign
enterprise/foreign organisation63.
Third, the amendment strengthened the administrative enforcement of patent protection
so that the IPR protection level of China can be improved. For example, the revisions
include increasing the administrative penalty standards from imposing a fine of no more
than three times the unlawful gain to four times to a person who counterfeits the patent
of another person, and a fine of no more than £5,150 increased to £20,600 which may
be imposed on him if there are no unlawful gains64. It also specified special measures
that can be taken to protect patent rights, for example, it firstly added the provisions of a
pre-litigation provisional measure by citing relevant provisions from the Civil
Procedure law65.
Fourth, strengthening patent protection is one of the aspects that the 2008 amendment
focused on. The revisions of this aspect are constituted by revising the situations that are
not considered as infringement, and perfecting the provisions regarding compensation
for infringement. For example, the fine imposed on the patent infringer increased from
no more than 3 times of the unlawful gains, in addition to confiscate the unlawful gains,
59 Patent law, 2008, Articles 22&23. 60 Patent law, 2008, Article 9, s1. 61 Article 5 provides that “Patent rights shall not be granted for inventions that are accomplished by
relying on genetic resources which are obtained or used in violation of the provisions of laws and
administrative regulations”. Article 26 specifies that “the patent application documents shall indicate the
direct and original source of the genetic resources if the invention-creation accomplished by relying on
genetic resources”. 62 Patent law, 2008, Article 11, s2. 63 Patent law, 2008, Article 10, s2; Article 19, s1; Article 20, s1. 64 Patent law, 2008, Article 63. 65 Patent law, 2008, Articles 66&67.
62
to no more than 4 times. The fine imposed on the patent infringer increased from no
more than £5,150 to £20,600 if there are no unlawful gains66. Fifth, it perfected
provisions of compulsory license, for example, the newly-added article 50 provides that
a compulsory license for manufacturing a drug which is protected by patent rights can
be granted for the benefit of public health.
To summarise the revisions made in the 2008 amendment, the scope of patent
protection is expanded, the strength of patent protection of both administrative
departments and the People’s court is greatly enhanced, it is claimed that this
amendment further improved the patent protection in China and will help to promote
scientific and technological progress and economic and social development (Guo,
2009).
3.3.5.2 Trademark law (2013)
Some researchers claim that the third revision of Trademark law is also mainly aimed to
meet the domestic needs and solving the problems that have existed when practicing
trademark law in past 10 years after the second revision (He, 2013; Jin, 2013). The 2013
amendment of Trademark law modified 53 articles of the 2001 Trademark law, and the
total number of articles increased from 64 to 73. The revisions of this amendment are
categorised into five parts, which are analysed in more detail below.
First, the revisions related to the scope of protection include: (1) Regarding the types of
signs that can be registered as trademarks by including “sound” to be one of the signs
that can be registered67. (2) Modified the types of signs that cannot be used as
trademarks, for example, the 2013 amendment specifies that the signs that are likely to
mislead the public in terms of the quality, place of production or other characteristics of
the goods cannot be used as trademarks68. (3) The 2013 Trademark law perfect the rules
to protect well-known trademarks69. (4) Strengthened the protection of unregistered
trademarks70. (5) Specified a situation where using a registered trademark or an
unregistered well-known trademark of another party as the trade name in its enterprise
name and mislead the public constitutes unfair competition71.
66 Patent law, 2008, Article 63. 67 Trademark law, 2013, Article 8. 68 Trademark law, 2013, Article 10. 69 Trademark law, 2013, Articles 13&14. 70 Trademark law, 2013, Article 15, paragraph 2. 71 Trademark law, 2013, Article 58.

63
Second, it improved the procedural provisions by bringing changes to following points:
(1) Perfect the provisions regarding raising objection of the trademark registration72. (2)
Established that “good faith” should be the fundamental principle that should be upheld
in the application for trademark registration and in the use of trademarks73. (3) Revised
the provision of renewal, transfer and licensing of registered trademarks74. (4) In order
to reduce confusion among “revoking a registered trademark”, “disputes/opposition”,
and “declare a registered trademark invalid”, the 2013 amendment changed Chapter 5
from “Adjudication of disputes concerning registered trademarks” to “Declaration of the
invalidity of registered trademarks”. (5) The 2013 Trademark law also added relevant
provisions regarding declaring the registered trademark invalid75. (6) New provisions
are added regarding the time limit for trademark examination76.
Third, regarding the enforcement mechanism, the amendment not only authorised the
trademark office the power to require the applicant to explain or correct the contents of
the trademark registration application during the interview, but also strengthened the
law enforcement of administrative departments77. Most importantly, it reduced the
burden of right holders to provide evidence78. In addition, it also specified the activities
of the trademark agency79.
Fourth, it strengthened the protection of trademark rights by expanding the type of acts
that will be considered infringement acts, as well as increasing the legal compensation
for infringement. The 2013 Trademark law not only provided a clear procedure of how
to decide the amount of compensation that the infringer should pay, but also increased
the amount of compensation from £51,500 in 2000 to £309,000 in 2013 if “it is difficult
to determine the actual loss suffered by the right holder as a result of the infringement,
the profits gained by the infringer from the infringement or the royalties of the
72 Trademark law, 2013, Articles 33&35. 73 Trademark law, 2013, Article 7, paragraph 1 74 Trademark law, 2013, Chapter IV. 75 Trademark law, 2013, Articles 46&47. 76 Trademark law, 2013, Articles 28, 34, 35. 77 For example, the 2013 amendment specified that the fine that the local administrative department for
industry and commerce can impose, by providing that “if the illegal business revenue is £5,150 or more, a
fine of up to 20% of the illegal business revenue may be imposed; if there is no illegal business revenue
or the illegal revenue is less than £5,150, a fine of up to £1,030 may be imposed” (Article 60, paragraph
2). 78 Trademark law, 2013, Article 63. 79 Trademark law, 2013, Articles 19&20.

64
registered trademark concerned”80. Last but not least, the amendment added restrictions
on the exclusive rights of registered trademark81.
It has been stated that when practicing the 2001 Trademark law, several problems exist.
For example, the trademark registration process is complicated, and the trademark
protection needs to be strengthened (He, 2013). After reviewing all the revisions
introduced with the 2013 amendment, it is stated the main system and basic functions of
trademark law have been relatively completed, the revision could also help to improve
the economic environment in China (Jin, 2013).
3.3.5.3 Copyright law (2010)
Different from the massive revisions that have been done to Patent law and Trademark
law, only two articles of Copyright have been revised in 2010. First, the 2010
amendment specified that the State has the right to supervise and manage the
publication or distribution of works in accordance with the law (Article 4). Second, the
newly added article 26 provides that “In case of a pledge over copyright, the pledger
and pledgee shall register the pledge concerned with the copyright administration
department under the State Council”, which is related to copyright licensing and
assignment contracts.
In summary, after reviewing various aspects of the changes introduced with each law
revision in detail based on the later three waves of change, it can be noted that each
revision improved the IP law by (1) expanding the scope of protection, (2) clarifying
and simplifying the application, approval, re-examination and dispute solving processes,
(3) granting more power to the courts, allowing the administrative penalties to be
imposed by administrative departments, and (4) enhancing the protection strength of IP
laws by increasing the amount of compensation. The revisions made around the early
1990s only cover limited aspects82, and are mainly a response to the requirements made
by the US government. The amendments enacted around the year 2000 for the purpose
80 Trademark law, 2013, Article 63. 81 Trademark law, 2013, Article 59. 82 For example, the changes made in the 1993 Trademark law amendment only covers 3 aspects:
protection scope, the procedures of application/registration, and protection strength.

65
of complying with the minimum requirements of TRIPS. For example, there are several
provisions added for this purpose, to include “offer to sell” to be one of the acts that a
patentee can prevent others from exploiting the patent without its/his permission in
Patent law, added provision of protecting “well-known” trademarks in Trademark law,
and strengthening owner’s “neighbouring rights” in Copyright law. All three IP laws
specified the way to calculate compensation and Trademark law and Copyright law also
modified certain provisions so that the power of judiciary authorities can be further
strengthened.
Following a decade of strong technological and economic developments, the revisions
made after 2008 were mainly motivated by the need to improve China’s innovation
ability and transformation of the economy. Both Trademark law and Patent law further
increased the amount of compensations, and they also authorised more power to both
administrative department and judiciary authorities to strengthen the law enforcement.
In addition, the 2008 Patent law raised the standards for patent applications so that the
quality of patents applied for in China could be improved. According to the five aspects
we used to analyse all the revisions, the revisions introduced around the year 2000
covered almost all of these five aspects, as well as the amendments of Patent law and
Trademark law enacted since 2008. It can be concluded that the quality of Chinese IP
laws in books is radically improved in early 2000s, and such quality is further enhanced
in 2008.
3.4 IP protection enforcement and IP activities in China
In the previous sections, we have reviewed the “dual-track” IP system in China and
what changes have been made in IP laws in early 1990s, around 2000, and after 2008. In
this section, we analyse the impact of these changes on IP activities of China during
these periods. First, we discuss their trends in relation to IP enforcement in China, and
then we discuss how patent applications and grants, and trademark registrations in
China have changed through time.

66
3.4.1 IP protection enforcement in China
Among the defects of the Chinese IP system which are discussed in previous studies,
weak IP protection enforcement in China is one of the most prominent weakness
highlighted by several studies (Cao, 2014; Greguras, 2007; Hu & Jefferson, 2009; Liu,
2005). In this section, we will focus on analysing the IP protection enforcement
situation in this section. Figure 3.4 shows the number of patent dispute cases received
by SIPO from 1997 to 2017, and most of the patent dispute cases are related to IP
infringement dispute cases according to the “White Papers on China's Intellectual
Property Rights Protection” published during this period. It can be noted that there were
less than 1,000 cases handled per year by SIPO during the period of 1997 to 2001,
which increased to around 1,500 per year during 2002 to 2005, after which it decreased
to about 1,000 cases per year during 2007 to 2010. There is a notable increase in 2012,
the number of patent dispute cases received by SIPO doubled from 1,286 in 2011 to
2,510 in 2012. From 2012 to 2017, the average yearly increasing rate is 68%, and the
number of patent dispute cases handled by SIPO reached 27,305 in 2017.
Figure 3.4: Number of patent dispute cases received by SIPO from 1997-2017.
Source: SIPO, (1998-2016). White Papers on China's Intellectual Property Rights
Protection, Beijing: SIPO.
0
5,000
10,000
15,000
20,000
25,000
30,000
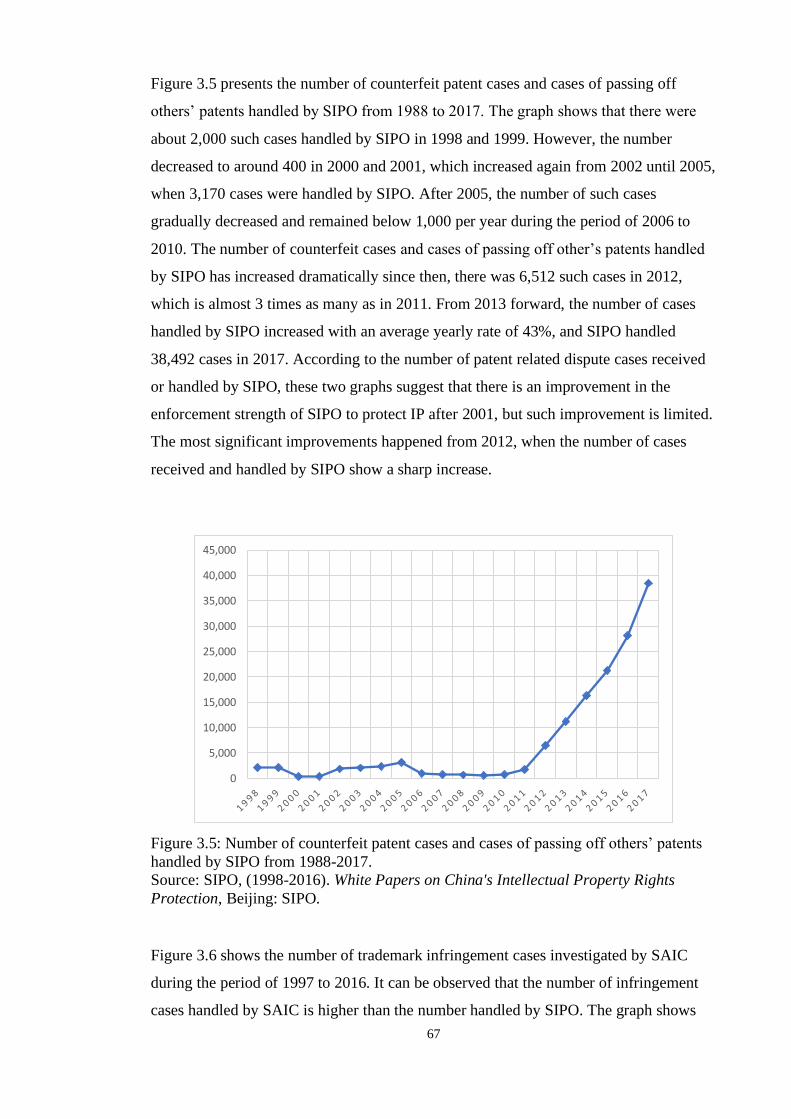
67
Figure 3.5 presents the number of counterfeit patent cases and cases of passing off
others’ patents handled by SIPO from 1988 to 2017. The graph shows that there were
about 2,000 such cases handled by SIPO in 1998 and 1999. However, the number
decreased to around 400 in 2000 and 2001, which increased again from 2002 until 2005,
when 3,170 cases were handled by SIPO. After 2005, the number of such cases
gradually decreased and remained below 1,000 per year during the period of 2006 to
2010. The number of counterfeit cases and cases of passing off other’s patents handled
by SIPO has increased dramatically since then, there was 6,512 such cases in 2012,
which is almost 3 times as many as in 2011. From 2013 forward, the number of cases
handled by SIPO increased with an average yearly rate of 43%, and SIPO handled
38,492 cases in 2017. According to the number of patent related dispute cases received
or handled by SIPO, these two graphs suggest that there is an improvement in the
enforcement strength of SIPO to protect IP after 2001, but such improvement is limited.
The most significant improvements happened from 2012, when the number of cases
received and handled by SIPO show a sharp increase.
Figure 3.5: Number of counterfeit patent cases and cases of passing off others’ patents
handled by SIPO from 1988-2017.
Source: SIPO, (1998-2016). White Papers on China's Intellectual Property Rights
Protection, Beijing: SIPO.
Figure 3.6 shows the number of trademark infringement cases investigated by SAIC
during the period of 1997 to 2016. It can be observed that the number of infringement
cases handled by SAIC is higher than the number handled by SIPO. The graph shows
0
5,000
10,000
15,000
20,000
25,000
30,000
35,000
40,000
45,000
68
that the first wave of increasing of both the total number of cases and the number of
infringement and counterfeiting cases happened during 1997-2003, after notable
increase in 2004, the number of such cases increased slowly during the period of 2005-
2010. There was a substantive increase in 2011 in the total number of cases investigated
by SAIC, from 56,034 in 2010 to 79,021 in 2011, while the number of infringement and
counterfeiting cases investigated increased from 48,548 in 2010 to 68,836 in 2011.
Different from the situation in Figures 3.4 and 3.5, the number of such cases handled by
SAIC started decreasing after 2011 and reached a number of 31,754 and 28,189 for total
number of infringement cases and number of infringement and counterfeiting cases in
2016, respectively. The number of general violation cases investigated by SAIC
fluctuated during the selected period, but the overall trend of such type of cases is
gradually decreasing from over 15,000 cases in late 1990s and early 2000 to less than
4,000 in 2015 and 2016. With regard to the number of infringement cases that involved
foreign trademark holders, the graph shows that a notable increase in the amount started
from 2004, although the data of 2000 to 2002 is missing. The figure increased from
2,130 in 2003 to 5,494 in 2004, meaning that the rate of increase was almost 160%.
Such amount of cases kept increasing from 2004 to 2008, when there was about 11,000
cases handled by SAIC that involved foreign trademark holders. After the last notable
increase in 2011 about 17,000 cases were investigated by SAIC. The amount of
infringement cases started decreasing, and there were 6,214 cases in 2016.

69
Figure 3.6: Number of trademark infringement cases investigated by SAIC from 1997-
2016.
Source: SIPO, (1998-2016). White Papers on China's Intellectual Property Rights
Protection, Beijing: SIPO; Trademark Office,(2008-2017). Annual Development Report
on China’s Trademark Strategy, Beijing: China Industry & Commerce Press.
Figure 3.7 shows the total value of fines that are imposed by SAIC on trademark
infringement cases from 1997-2016, it can be noted that it follows a similar pattern of
changes as the total number of trademark infringement cases, which means that the total
value of fines per year is gradually increasing from 1997 and peaked in 2011. From then
the value started to decrease. Figure 3.8 presents the average value of fines imposed on
one trademark infringement case per year. It can be noted that the value also started to
increase gradually from 1997 to 2011 (except in 2004, when the average value of fines
declined from £665 in 2003 to £532 in 2004). However, from 2011 forward, the average
value of fines imposed on one trademark infringement case increased notable from
2012, when an average of £817 was imposed per infringement case, which increased to
£1,339 in 2016. These graphs show that both the number of cases handled and the total
amount of fines imposed by SAIC kept increasing from 1997 to 2011, and since then
the number of cases started to decrease, but the average value of fines imposed per case
kept increasing. The results suggest that the IP protection enforcement of SAIC was
gradually enhancing through the selected period, although the number of cases
investigated was decreasing after 2011, the increasing average value of fines imposed
indicates that the Trademark law enforcement is still strengthening.
0
10,000
20,000
30,000
40,000
50,000
60,000
70,000
80,000
90,000
19
97
19
98
19
99
20
00
20
01
20
02
20
03
20
04
20
05
20
06
20
07
20
08
20
09
20
10
20
11
20
12
20
13
20
14
20
15
20
16
Total
Infringement andcounterfeiting
Cases involvedforeign trademark holders
General violation

70
Figure 3.7: Total value of fines imposed by SAIC on trademark infringement cases from
1997-2016 (in million £).
Source: SIPO, (1998-2016). White Papers on China's Intellectual Property Rights
Protection, Beijing: SIPO; Trademark Office,(2008-2017). Annual Development Report
on China’s Trademark Strategy, Beijing: China Industry & Commerce Press.
Figure 3.8: Average value of fines imposed by SAIC on trademark infringement case
from 1997-2016 (in £).
Source: SIPO, (1998-2016). White Papers on China's Intellectual Property Rights
Protection, Beijing: SIPO; Trademark Office,(2008-2017). Annual Development Report
on China’s Trademark Strategy, Beijing: China Industry & Commerce Press.
0
10
20
30
40
50
60
70
0
200
400
600
800
1000
1200
1400

71
Figure 3.9 shows the number of new IPR-related civil cases of first instance accepted by
local people’s courts from 2004 to 2016. It can be noted that copyright is involved in the
largest amount of such cases, followed by trademark and then patent (except in 2004,
2005 and 2006, when there are more cases related to patent than to trademark). The
graph shows that the number of civil cases of first instance accepted for these three
types of IPR kept increasing from 2004 to 2016, and the rate of increase was higher
during the period of 2004 to 2012, after which the rate of increase slowed down. Figure
3.10 shows the number of new IPR-related civil cases of first instance concluded by
local people’s courts during 2004-2016. The total number of cases concluded follows a
similar pattern of change as shown in Figure 3.9, but it can be noted that the number of
cases involving foreign interested parties only constitutes a small proportion, which is
shown in more detail in Figure 3.11. The number of IPR-related civil cases of first
instance involving foreign interested parties (excluding Hong Kong, Macao, and
Taiwan) increased greatly from 2004 to 2009, when there were 1,361 cases concluded
by local people’s courts. From 2009 forward, the number of cases concluded per year
fluctuated, but there are no radical changes during this period.
Figure 3.9: Number of new IPR-related civil cases of first instance accepted by local
people’s courts from 2004-2016.
Source: SIPO, White Papers on China's Intellectual Property Rights Protection (1998-
2016).
0
10,000
20,000
30,000
40,000
50,000
60,000
70,000
80,000
90,000
100,000
Copyright
Trademark
Patent
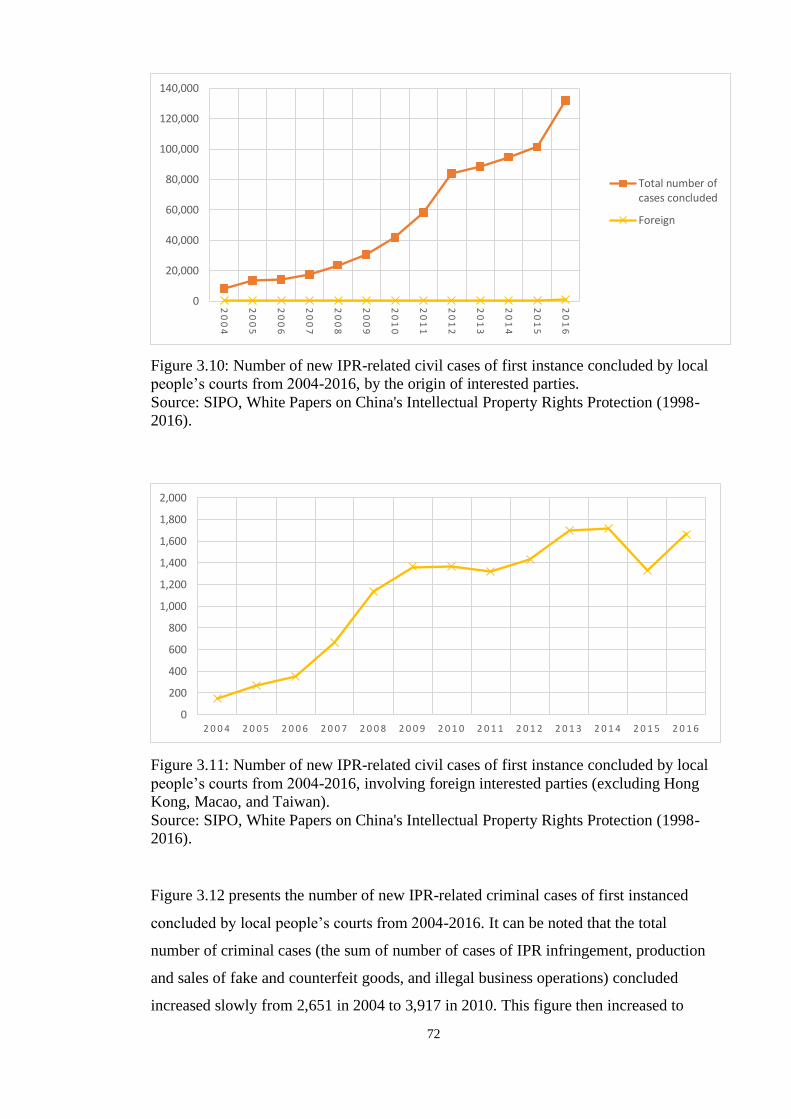
72
Figure 3.10: Number of new IPR-related civil cases of first instance concluded by local
people’s courts from 2004-2016, by the origin of interested parties.
Source: SIPO, White Papers on China's Intellectual Property Rights Protection (1998-
2016).
Figure 3.11: Number of new IPR-related civil cases of first instance concluded by local
people’s courts from 2004-2016, involving foreign interested parties (excluding Hong
Kong, Macao, and Taiwan).
Source: SIPO, White Papers on China's Intellectual Property Rights Protection (1998-
2016).
Figure 3.12 presents the number of new IPR-related criminal cases of first instanced
concluded by local people’s courts from 2004-2016. It can be noted that the total
number of criminal cases (the sum of number of cases of IPR infringement, production
and sales of fake and counterfeit goods, and illegal business operations) concluded
increased slowly from 2,651 in 2004 to 3,917 in 2010. This figure then increased to
0
20,000
40,000
60,000
80,000
100,000
120,000
140,000
20
04
20
05
20
06
20
07
20
08
20
09
20
10
20
11
20
12
20
13
20
14
20
15
20
16
Total number ofcases concluded
Foreign
0
200
400
600
800
1,000
1,200
1,400
1,600
1,800
2,000
2 0 0 4 2 0 0 5 2 0 0 6 2 0 0 7 2 0 0 8 2 0 0 9 2 0 1 0 2 0 1 1 2 0 1 2 2 0 1 3 2 0 1 4 2 0 1 5 2 0 1 6

73
5,452 in 2011, and there is a tremendous increase in 2012 to 12,723 criminal cases that
were concluded that year. After that, the number of criminal cases concluded decreased
to less than 9,000 in 2013 and remained around this number during this period. The
amount of criminal cases related to IPR infringement followed a similar trend, while the
other two types of criminal cases were slightly different. The number of cases related to
producing and selling fake and counterfeit goods (involving IPR infringement) was
higher than the number of cases of IPR infringement in 2004 and 2005, the amount
decreased in 2006 and kept at less than 1,000 cases per year during 2006 to 2011, after
which it increased to over 2,000 criminal cases per year. Regarding the number of
criminal cases related to illegal business operations (involving IPR infringement), it was
consistently higher than the number of cases related to IPR infringement from 2004 to
2010. It can be noted that the number of criminal cases in this field fluctuated during
2004-2012, the average amount during this period is about 1,740 per year, while the
average amount decreased to 1,450 during the period 2013-2016.
Figure 3.13 presents the number of suspects that were sentenced in the new IPR-related
criminal cases of first instance concluded by local people’s courts in the same period.
The graph shows that the number of suspects sentenced followed the same pattern of
changes as shown in Figure 3.12, but it can be noted that there were more than 10,000
suspects sentenced each year since 2011, and the figure even reached 15,423 in 2012.
The results indicate that the number of IPR-related criminal cases concluded by local
people’s courts is gradually increasing, as well as the number of suspects sentenced in
such cases. Although the number of cases and the number of suspects sentenced have
decreased since the great increase in 2012, the amount is still higher than what it was
before 2012. We can conclude that the enforcement of protecting IPR from the aspect of
people’s court is also strengthening through time.
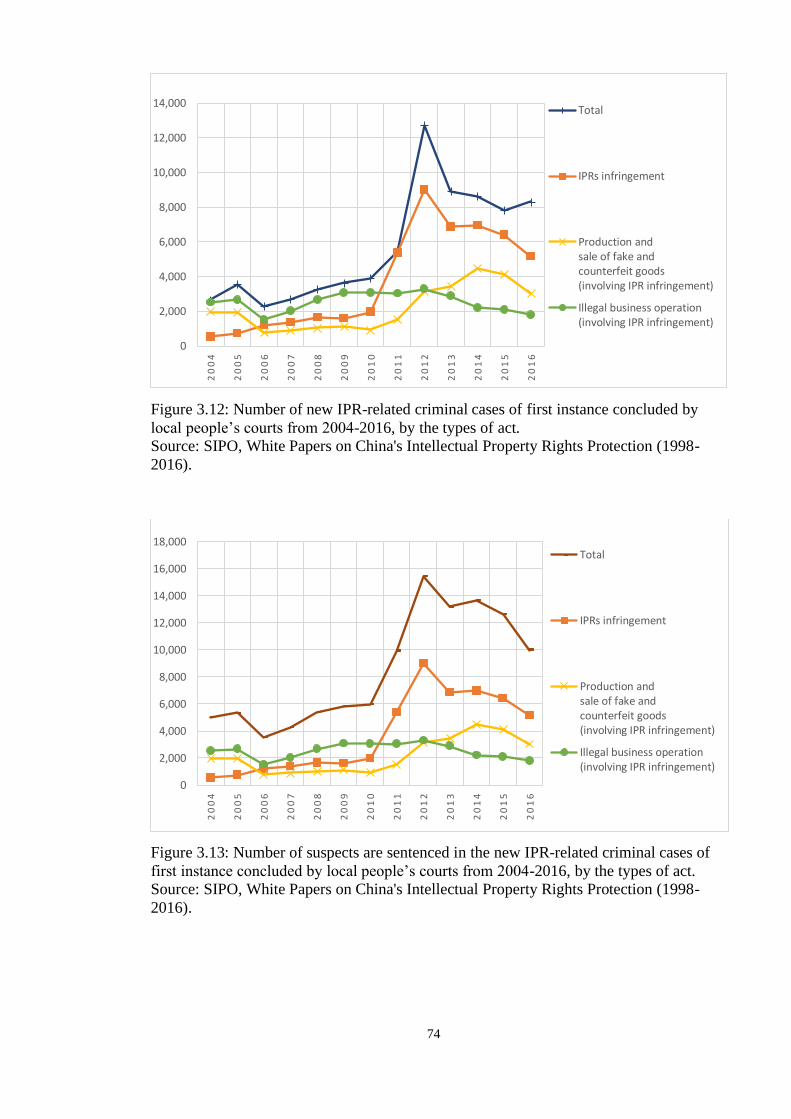
74
Figure 3.12: Number of new IPR-related criminal cases of first instance concluded by
local people’s courts from 2004-2016, by the types of act.
Source: SIPO, White Papers on China's Intellectual Property Rights Protection (1998-
2016).
Figure 3.13: Number of suspects are sentenced in the new IPR-related criminal cases of
first instance concluded by local people’s courts from 2004-2016, by the types of act.
Source: SIPO, White Papers on China's Intellectual Property Rights Protection (1998-
2016).
0
2,000
4,000
6,000
8,000
10,000
12,000
14,000
20
04
20
05
20
06
20
07
20
08
20
09
20
10
20
11
20
12
20
13
20
14
20
15
20
16
Total
IPRs infringement
Production andsale of fake andcounterfeit goods(involving IPR infringement)
Illegal business operation(involving IPR infringement)
0
2,000
4,000
6,000
8,000
10,000
12,000
14,000
16,000
18,000
20
04
20
05
20
06
20
07
20
08
20
09
20
10
20
11
20
12
20
13
20
14
20
15
20
16
Total
IPRs infringement
Production andsale of fake andcounterfeit goods(involving IPR infringement)
Illegal business operation(involving IPR infringement)

75
To summarise the results in this section, first of all, the number of patent related dispute
cases received and handled by SIPO kept increasing, especially that the increasing
speed enhanced greatly since 2012. Second, the number of cases handled and the total
amount of fines imposed by SAIC kept increasing from 1997 to 2011, however, the
number of cases started decreasing from then, which is different from the situation for
the cases handled by SIPO. By calculating the average value of fine per case, the results
suggest that the average value of fines kept increasing. This could indicate that the
strength of enforcement is still improving, although the number of cases handled by
SAIC is decreasing. Such decline could be because the trademark infringement situation
in China has improved after years of IPR protection development. Third, among the
three types of IPR-related civil cases of first instance accepted and concluded by local
people’s court, copyright cases constitute the bigger amount of such cases, followed by
trademark and then patent (except in 2004, 2005 and 2006). The number of all three
types of IP cases kept increasing from 2004 to 2016, however, the speed slows down
after 2012. We note that the number of such cases involving foreigner(s) or foreign
enterprise(s) only constitutes a small proportion, and the amount increased greatly from
2004 to 2009. From then the number of cases concluded fluctuated with no radical
change. Regarding the number of IPR-related criminal cases concluded and the number
of suspects sentenced in such cases show that they are increasing gradually. The amount
for both number of cases and number of suspects sentenced started decreasing soon
after they peaked in 2012, however, such amounts are still higher than in the years
before 2012.
3.4.2 IP activities in China: patent application and grant, trademark registration
Having discussed the evolution of IP enforcement in China, this section examines trends
of applications/grants/registrations for patents and trademarks, distinguishing between
domestic and foreign applicants in order to assess whether in parallel to changes in IP
law and their enforcement, there has been a change in the actual use of IPR in China.
With regard to the invention patents application, Figure 3.14 shows that the number of
invention patents applied for by both domestic and foreign applicants remained at a low
level from 1995 to 2002. During this period the number of invention patents applied for
by foreign applicants is higher than the amount applied for by domestic applicants.
From 2003, the amount of invention patents applied for by domestic applicants

76
exceeded those of foreign applicants, and the gap between them has increased
dramatically since then. There were 56,769 invention patents applied for by domestic
applicants in 2003 and 48,549 invention patents applied by foreign applicants. While
the number of invention patent applied for by domestic applicants increased to around
0.2 million in 2008, the number was 95,259 for foreign applicants. In 2016, there were
1.2 million invention patents filed by domestic applicants, which is almost 9 times as
many as the number of invention patents filed by foreign applicants.
Figure 3.15 focused on the number of invention patents applied for by foreign
applicants. It can be noted that the amount of invention patents was at a low level before
2000, the rate of increase was high in 1996 and 1997 but then decreased quickly, and
the number of invention patents applied for in 1999 was even less than the amount
applied for in 1998. From 2000 to 2008, the amount increased quickly, especially from
2000 to 2005 when the rate of increase was over 20% per year. The number of invention
patents decreased in 2009, and since then there is another wave of increase. In order to
further analyse foreign applicants’ invention patent application in China, Figure 3.16
shows the number of invention patents applied for by applicants from four varied
countries and regions (Japan, South Korea, Europe, and US) which all followed a
similar trend as seen in Figure 3.15. It can still be noted that among the applicants from
these four varied countries and regions, Japanese applicants applied for the highest
number of invention patents most of the time during the period, followed by applicants
from Europe, US and South Korea, respectively.
Figure 3.14: Total number of invention patents applications from 1995-2016 in China.
Source: National Bureau of Statistics of China
0
200,000
400,000
600,000
800,000
1,000,000
1,200,000
1,400,000
19
95
19
96
19
97
19
98
19
99
20
00
20
01
20
02
20
03
20
04
20
05
20
06
20
07
20
08
20
09
20
10
20
11
20
12
20
13
20
14
20
15
20
16
Domestic Foreign

77
Figure 3.15: Total number of invention patents applications by foreign applicants from
1995-2016 in China.
Source: National Bureau of Statistics of China
Figure 3.16: Number of invention patents applications by foreign applicants from four
different countries and regions from 1995-2016 in China.
Source: National Bureau of Statistics of China
The number of invention patents granted shows a different picture. Figure 3.17 shows
that the number of invention patents granted to foreign applicants was higher than the
number granted to domestic applicants from 1995 to 2008. The gaps between domestic
applicants and foreign applicants expanded quickly right after 2000, and the amount of
invention patents granted to foreign applicants could be 2 to 3 times as many as the
0
20,000
40,000
60,000
80,000
100,000
120,000
140,000
160,000
19
95
19
96
19
97
19
98
19
99
20
00
20
01
20
02
20
03
20
04
20
05
20
06
20
07
20
08
20
09
20
10
20
11
20
12
20
13
20
14
20
15
2016
0
5,000
10,000
15,000
20,000
25,000
30,000
35,000
40,000
45,000
19
95
19
96
19
97
19
98
19
99
20
00
20
01
20
02
20
03
20
04
20
05
20
06
20
07
20
08
20
09
20
10
20
11
20
12
20
13
20
14
20
15
20
16
Japan
EU
USA
South Korea

78
amount granted to domestic applicants during 2001-2004. This gap was gradually
narrowed down by domestic applicants, who finally exceeded foreign applicants from
2009 and forward. Figure 3.18 also focuses on the foreign applicants, which shows that
the number of invention patents granted remained low and gradually increasing. From
2000 to 2004, the number of invention patents granted increased quickly. There were
6,506 invention patents granted to foreign applicants in 2000, and this number increased
to 31,119 in 2004, which is almost 4 times higher. From then, the number of invention
patents granted to foreign applicants fluctuated, but the general trend was still
increasing, and the number reached 102,072 in 2016. Figure 3.19 shows the number of
invention patents granted to foreign applicants from Japan, Europe, South Korea, and
US. The graph also follows the changes shown in Figure 3.18, and the highest number
of invention patents was also granted to Japanese applicants, followed by applicants
from Europe, US, and South Korea most of the years during this period. The only
exception is that during the period of 1995 to 1999 when there are more invention
patents granted to European applicants (in 1995 and 1996, the US applicants were also
granted more invention patents than Japanese applicants), followed by applicants from
Japan, US and South Korea.
Figure 3.17: Total number of invention patents granted from 1995-2016 in China.
Source: National Bureau of Statistics of China
0
50,000
100,000
150,000
200,000
250,000
300,000
350,000
19
95
19
96
19
97
19
98
19
99
20
00
20
01
20
02
20
03
20
04
20
05
20
06
20
07
20
08
20
09
20
10
20
11
20
12
20
13
20
14
20
15
20
16
Domestic
Foreign

79
Figure 3.18: Total number of invention patents granted to foreign applicants from 1995-
2016 in China.
Source: National Bureau of Statistics of China
Figure 3.19: Number of invention patents granted to foreign applicants from four
different countries and regions from 1995-2016 in China.
Source: National Bureau of Statistics of China
The utility model patent applications and granting (as shown in Appendix A2), as well
as design patent applications and granting, both showed similar trends of change as
invention patents83. As shown in Figures 3.20 and 3.21, the number of utility model
83 For example, the notable changes all happened after 2000. Therefore, they will not be analysed in detail
in this section. Some differences also exist, for example, the number of applications and granting of these
0
20,000
40,000
60,000
80,000
100,000
120,000
19
95
19
96
19
97
19
98
19
99
20
00
20
01
20
02
20
03
20
04
20
05
20
06
20
07
20
08
20
09
20
10
20
11
20
12
20
13
20
14
20
15
2016
0
5,000
10,000
15,000
20,000
25,000
30,000
35,000
40,000
Japan
EU
USA
South Korea

80
patents and design patents applied for and granted by domestic applicants is higher than
those for invention patents (except that the number of design patents applied is lower
than invention patents from 2013 to 2016). This could be because there is a lower
requirement in terms of creativity for utility model than for invention, and the reviewing
and examination process is also simpler and faster for utility model as well.
Figure 3.20: Total number of three types of patents applied by domestic applicants from
1995-2016 in China.
Source: National Bureau of Statistics of China
Figure 3.21: Total number of three types of patents granted by domestic applicants from
1995-2016 in China.
Source: National Bureau of Statistics of China
two types of patents of domestic applicants are higher than foreign applicants through the whole period of
1995-2016.
0
200,000
400,000
600,000
800,000
1,000,000
1,200,000
1,400,000
1,600,0001
99
5
19
96
19
97
19
98
19
99
20
00
20
01
20
02
20
03
20
04
20
05
20
06
20
07
20
08
20
09
20
10
20
11
20
12
20
13
20
14
20
15
20
16
Utility model
Invention
Design
0
100,000
200,000
300,000
400,000
500,000
600,000
700,000
800,000
900,000
1,000,000
19
95
19
96
19
97
19
98
19
99
20
00
20
01
20
02
20
03
20
04
20
05
20
06
20
07
20
08
20
09
20
10
20
11
20
12
20
13
20
14
20
15
20
16
Utility model
Design
Invention
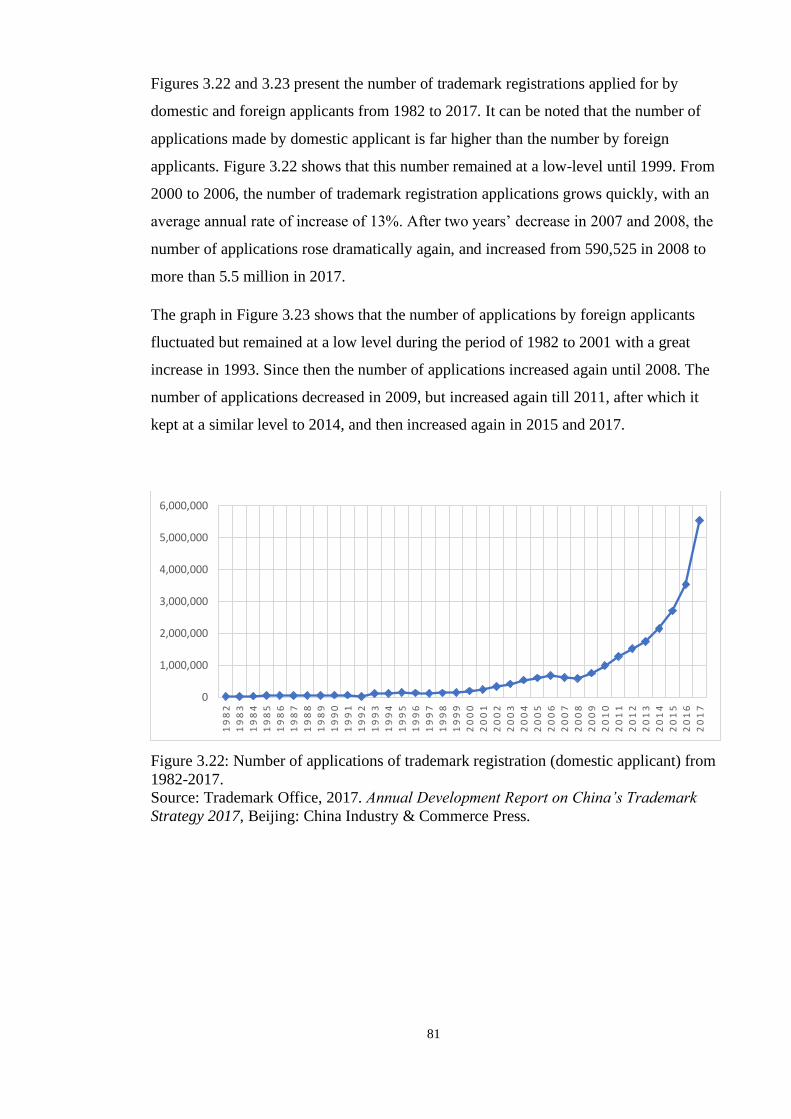
81
Figures 3.22 and 3.23 present the number of trademark registrations applied for by
domestic and foreign applicants from 1982 to 2017. It can be noted that the number of
applications made by domestic applicant is far higher than the number by foreign
applicants. Figure 3.22 shows that this number remained at a low-level until 1999. From
2000 to 2006, the number of trademark registration applications grows quickly, with an
average annual rate of increase of 13%. After two years’ decrease in 2007 and 2008, the
number of applications rose dramatically again, and increased from 590,525 in 2008 to
more than 5.5 million in 2017.
The graph in Figure 3.23 shows that the number of applications by foreign applicants
fluctuated but remained at a low level during the period of 1982 to 2001 with a great
increase in 1993. Since then the number of applications increased again until 2008. The
number of applications decreased in 2009, but increased again till 2011, after which it
kept at a similar level to 2014, and then increased again in 2015 and 2017.
Figure 3.22: Number of applications of trademark registration (domestic applicant) from
1982-2017.
Source: Trademark Office, 2017. Annual Development Report on China’s Trademark
Strategy 2017, Beijing: China Industry & Commerce Press.
0
1,000,000
2,000,000
3,000,000
4,000,000
5,000,000
6,000,000
19
82
19
83
19
84
19
85
19
86
19
87
19
88
19
89
19
90
19
91
19
92
19
93
19
94
19
95
19
96
19
97
19
98
19
99
20
00
20
01
20
02
20
03
20
04
20
05
20
06
20
07
20
08
20
09
20
10
20
11
20
12
20
13
20
14
20
15
20
16
20
17
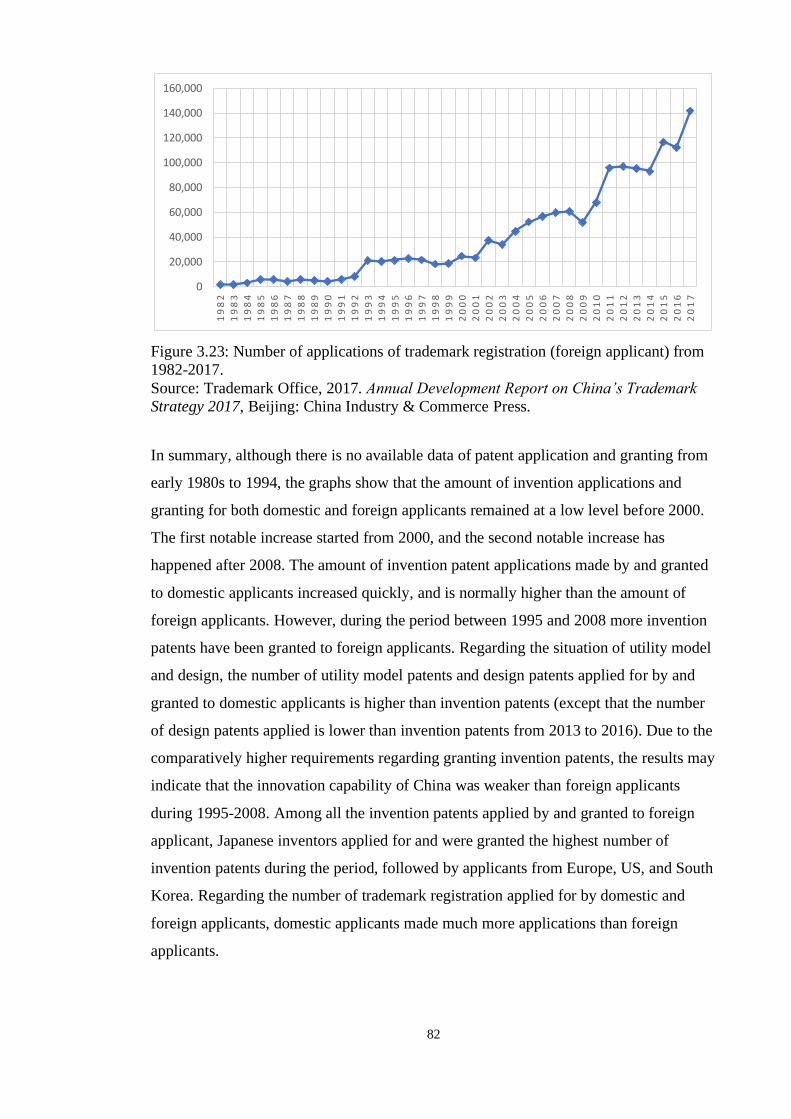
82
Figure 3.23: Number of applications of trademark registration (foreign applicant) from
1982-2017.
Source: Trademark Office, 2017. Annual Development Report on China’s Trademark
Strategy 2017, Beijing: China Industry & Commerce Press.
In summary, although there is no available data of patent application and granting from
early 1980s to 1994, the graphs show that the amount of invention applications and
granting for both domestic and foreign applicants remained at a low level before 2000.
The first notable increase started from 2000, and the second notable increase has
happened after 2008. The amount of invention patent applications made by and granted
to domestic applicants increased quickly, and is normally higher than the amount of
foreign applicants. However, during the period between 1995 and 2008 more invention
patents have been granted to foreign applicants. Regarding the situation of utility model
and design, the number of utility model patents and design patents applied for by and
granted to domestic applicants is higher than invention patents (except that the number
of design patents applied is lower than invention patents from 2013 to 2016). Due to the
comparatively higher requirements regarding granting invention patents, the results may
indicate that the innovation capability of China was weaker than foreign applicants
during 1995-2008. Among all the invention patents applied by and granted to foreign
applicant, Japanese inventors applied for and were granted the highest number of
invention patents during the period, followed by applicants from Europe, US, and South
Korea. Regarding the number of trademark registration applied for by domestic and
foreign applicants, domestic applicants made much more applications than foreign
applicants.
0
20,000
40,000
60,000
80,000
100,000
120,000
140,000
160,000
19
82
19
83
19
84
19
85
19
86
19
87
19
88
19
89
19
90
19
91
19
92
19
93
19
94
19
95
19
96
19
97
19
98
19
99
20
00
20
01
20
02
20
03
20
04
20
05
20
06
20
07
20
08
20
09
20
10
20
11
20
12
20
13
20
14
20
15
20
16
20
17
83
The amount of trademark registration applications remained at low level during period
of 1982 to 1992, but a notable increase happened in 1993. However, the number of
applications made by domestic applicants continued to increase after 1993, but still
remained at a low level until 2000. As for foreign applicants, there were no big changes
from 1993 to 2000. After 2000, however, both domestic and foreign applications have
increased until 2008, when another wave of increases happened. In short, domestic
applicants contribute to the major part of IP activities, and they are becoming
increasingly active since 2000 especially. The dramatic increase of number of patents
applied for and granted to domestic applicants indicates that the innovation capabilities
of China are strengthening.
3.5. Discussion and Conclusion
This paper analyses the evolution of the IP system in China from IP law revisions, IP
enforcement, and innovation activities. The main contributions of this paper are
twofold: First, this study discusses the changes of IP law and enforcement over a period
of 20 years, using a novel five-dimensional assessment scheme and, in doing so, we
provide a comprehensive understanding of the Chinese IP laws and practice. Second,
our results show that the IP enforcement in China is improving significantly. Our results
show that joining WTO has provided a solid foundation for China to improve its IP
system.
Grounded on the institutional-based view, Peng and colleagues (Peng, 2013; Peng, et
al., 2017) claimed that the IPR protection in China will become better once the Chinese
economy and technology developed to a certain level in the future. However, this view
is opposed by Brander and colleagues (2017), who stated that “China has a weak
internal rule of law, a fragmented governance system, and cultural traditions that favour
collective over individual rights”. In this paper, we find agreement with Peng and
colleagues’ conclusions based on our analysis of the Chinese IP system from both
written IP laws and IP laws in practice aspects, as well as their impacts on the IP
activities in China. With regard to the quality of Chinese IP laws, we developed a five-
dimensional assessment scheme to analyse the changes that have been brought via each
amendment. Our analysis shows that the revisions made around the year 2000 for the
purpose of complying with the minimum requirements of TRIPS have brought the most
tremendous improvement to the Chinese IP laws. It not only offered opportunities for

84
China to be part of the global economy, but also established a strong foundation for the
future development of Chinese IP system. The changes made during this period also
covered almost all 5 aspects, they expanded the scope of protection by including more
objects or acts that can be protected by law, simplified the procedures related to
application, approval, re-examination and dispute solving, increased the amount of
compensation, authorised more power to both administrative and judiciary authorities
for stronger IP enforcement, and also perfected the provision related to IP rights
restrictions. The revisions made after 2008 were mainly introduced for the purpose of
improving China’s innovations ability and economy transformation, the amendments
further enhanced the quality of Chinese IP laws after analysing the revisions made on
all five aspects of both Patent law and Trademark law.
Different from scholars who claim that IPR enforcement in China is weak (Hu &
Jefferson, 2009; Greguras, 2007; Cao, 2014; Liu, 2005), our study shows that the IP
enforcement in China overall has been improving, especially after 2008. Admittedly
most of those earlier studies were conducted prior to the last IP law revisions, but this
supports the need and value of our study. As for the IP protection enforcement of
administrative authorities, the results of our descriptive data analysis show that the
number of patent related dispute cases received and handled by SIPO kept increasing,
and that the increasing rate of the amount of cases processed improved greatly since
2012 especially, four years after the third amendment of Patent law. Such increase could
be attributed to the fact that the third amendment substantially strengthened the
administrative enforcement of patent protection. At the same time, the number of cases
handled and the total amount of fines imposed by SAIC kept increasing from 1997 to
2011. However, the number of cases started decreasing from then, which could be
because trademark infringements in China have reduced after years of improvement in
IPR protection. It can be noted that the average value of fines imposed on each
trademark infringement case has been continuously increasing and the number of cases
handled by SAIC is becoming smaller, which could indicate that the enforcement is
actually become stronger.
From the perspective of judicial authorities regarding IP protection enforcement, among
the three types of IPR-related civil cases of first instance accepted and concluded by
local people’s court, the number of all three types of IP cases has increased from 2004
to 2016, although the increasing speed slows down after 2012. It is interesting to note
that the number of such cases involving foreigner or foreign enterprise constitutes only

85
a small proportion, but the amount increased greatly from 2004 to 2009. From then the
number of cases concluded has fluctuated, with no radical changes. This could be
attributed to the fact that foreign enterprises prefer not to file law suits to solve IP
related disputes, or that the IP infringement problems they encountered in China are not
as severe as stated in other reports or studies. The number of IPR-related criminal cases
concluded and the number of suspects sentenced in such cases are increasing gradually.
The number of cases and number of suspects sentenced started decreasing soon after
2012. Some scholars argue that China lacks criminal convictions for IP infringement
(Greguras, 2007; Yang, et al., 2004). However, our analysis shows that after the last
round of revisions both the number of IP-related criminal cases and the number of
suspects sentenced have increased greatly after 2008. This indicates that the criminal
convictions for IP infringement are becoming more significant.
Brander and colleagues (2017) interpret these trends as an indication that IP
infringement in China is severe. However, we hold the different view that the results
indicate that the IP protection enforcement in China is becoming stronger in both
administrative and judicial track. These results could also mean that Chinese people or
enterprises are becoming more aware of the importance of protecting IPR, and they are
becoming more used to pursue either administrative or judicial ways to protect their IP
rights, which is reflected by the number of cases handled by SIPO, SAIC, and courts.
Previous studies stated that authority overlapping and IP protection enforcement
inconsistency also exist among central government, local governments and individual
ministries (Brander, et al., 2017). However, our analysis shows a different picture. First,
the restructuring of SIPO by incorporating part of functions of the SAIC, and the
General Administration of Quality Supervision, Inspection and Quarantine shows that
the authority overlapping problem could be improved. Second, the IP law revisions
regarding enforcement mechanism aspect show that different power granted to
administrative authorities and judicial authorities is becoming increasingly clear via
each revision, which is different from what Brander and colleagues claimed (Brander, et
al., 2017). It has also been affirmed that the important position of people’s court
regarding making the final decision of the decisions made by the administrative
authorities. Third, researchers posit that the IP protection enforcement inconsistency
between central and local governments is attributed by different priorities for local
governments, which may have little concern regarding IP infringement for protecting
local industries (Brander, et al., 2017). Studies found that areas with better economy

86
development such as Beijing, Shanghai and Guangzhou have better IPR protection
(Berrell & Wrathall, 2006). It can be assumed that such inconsistency is due to the
economic development level in China not being even among different regions, once the
economy in all areas developed to a certain level, the situation of IP enforcement
inconsistency will be reduced.
Some researchers have claimed that Chinese people are culturally conditioned to engage
in a high level of IPR violation (Zimmerman, 2013). The case of Taiwan, where it is
argued that IPR protection is not a concern but shares similar culture as mainland China,
could indicate that culture’s influence on IPR violation can be changed. This is further
supported by the fast development of the digital music industry in China, which
previously had severe piracy problems (Swike, et al., 2008). It can be noted that the fees
digital music users paid to the online music platform increased from £16.48 million in
2012 to £206 million in 2016 (iResearch, 2018).
Patent law and Trademark/Copyright law not only cover different aspects of IP rights,
but also protect different phases of the innovation process and activities, i.e., Patent law
protects innovations/inventions from early innovative/inventive stage,
Trademark/Copyright law mainly protect trademark/creator’s work (e.g., music,
painting, book, website) in the commercialisation and diffusion stage. After reviewing
the changes that have been made to the Chinese IP system, it can be claimed that China
has taken a holistic approach in developing its innovative environment by enhancing IP
protection from the inception of innovation to commercialisation.
The analysis of IP activities in China shows that they share a similar development
pattern to the IP laws development in China. This indicates that the number of patent
applications and granted, and the number of applications of trademark registration all
remained at a low level before 2000, when a radical change/development started, which
further increased after 2008. In particular, the number of invention patents granted to
domestic inventors finally exceeded the foreign applicants in 2008, and keeps at a sharp
increase since then. It can be assumed that as a consequence of openness to global trade
and membership of WTO to comply with TRIPS, coevolution of formal (law) and
informal (culture, people’s perception of IP) institutions result in a dramatic increase in
innovation activities in China, especially by domestic innovators.
Our findings show that the IP laws and their enforcement have been greatly enhanced,
especially since 2000. Defects in Chinese IP system that have been discussed in
87
previous studies are being addressed, for example, authority overlapping, IP protection
enforcement inconsistency, and the influences Chinese culture have on people’s opinion
of IPR. However, the IP system in China needs to be further improved to perfect the IP
laws and further strengthening the IP enforcement. We understand that new revisions of
both Patent law and Copyright law are currently under discussion. This suggests that the
Chinese government has a strong willingness to improve its IP system further.
In conclusion, our findings provide the basis to investigate how those changes in IP
laws and enforcement impacted upon and coevolved with the technological and
economic development in China, including the innovation and activities of foreign
companies.

88
References
Berrell, M. & Wrathall, J., 2006. Between Chinese culture and the rule of law: What
foreign managers in China should know about intellectual property rights. Management
Research News, 30(1), pp. 57-76.
Bosworth, D. & Yang, D., 2000. Intellectual property law, technology flow and
licensing opportunities in the People's Republic of China. International Business
Review, 9(4), pp. 453-477.
Brander, J. A., Cui, V. & Vertinsky, I., 2017. China and intellectual property rights: A
challenge to the rule of law. Journal of International Business Studies, 48(7), pp. 908-
921.
Cao, Q., 2014. Insight into weak enforcement of intellectual property rights in China.
Technology in Society, Volume 38, pp. 40-47.
China and United States, 1979. Sino-US Trade Agreement, s.l.: s.n.
China and United States, 1992. Memorandum of Understanding on The Protection of
Intellectual Property, s.l.: s.n.
Cox, A. J. & Sepetys, K., 2009. Intellectual Property Rights Protection in China:
Trends in Litigation and Economic Damages. [Online]
Available at: https://ssrn.com/abstract=1330619
[Accessed 22 September 2018].
CPCC, C. P. C. o. C., 2017. Copyright Protection Center of China (Copyright Agency
Center of China) Overview. [Online]
Available at: http://www.ccopyright.com/en/index.php?optionid=978
[Accessed 28 10 2018].
Gao, L., 2002. Preliminary analysis on the amendment of Chinese Copyright law.
Intellectual Property, Volume 3, pp. 3-8.
Gao, L., 2008. China's Patent System and Globalization. Research Technology
Management, 51(6), pp. 34-37.
Ginarte, J. C. & Park, W. G., 1997. Determinants of patent rights: A cross-national
study. Research Policy, 26(3), pp. 283-301.
Greguras, F., 2007. Intellectual property strategy and best practices for R&D services in
China. Computer Law & Security Review, 23(5), pp. 449-452.
Guo, H., 2009. Innovation is the fundamental force for driving social progress: Review
of the third revision of the patent law. Electronics Intellectual Property, Volume 3, pp.
11-15.
He, P., 2013. Brief description of the third amendment to the trademark law. China
Trademark, Volume 10, pp. 11-16.
Hou, J. W., 2011. Economic reform of China: Cause and effects. The Social Science
Journal, 48(3), pp. 419-434.
Hu, A. G. & Jefferson, G. H., 2009. A great wall of patents: What is behind China's
recent patent explosion?. Journal of Development Economics, 90(1), pp. 57-68.

89
iResearch, 2018. Digital music consumption research report of China, Beijing:
iResearch.
Jin, W., 2013. Review and summary of the third revision of Trademark law. Intellectual
Property, Volume 10, pp. 3-12.
Keupp, M. M., Beckenbauer, A. & Gassmann, O., 2009. How managers protect
intellectual property rights in China using de facto strategies. R&D Management, 39(2),
p. 211/224.
Kshetri, N., 2009. Institutionalization of intellectual property rights in China. European
Management Journal, 27(3), pp. 155-164.
Liu, C., 2015. Introduction to intellectual property law. In: C. Liu, ed. The Intellectual
Property Law. Beijing: China Renmin University Press, pp. 36-37.
Liu, W., 2005. Intellectual property protection related to technology in China.
Technological Forecasting and Social Change, 72(3), pp. 339-348.
Liu, Y., 2002. Synthetical Reviews on Differences between TRIPS Agreements and
Chinese Laws of Intellectual Property Rights and Perfection. Heibei Law Science,
20(6), pp. 29-36.
Li, W. & Yu, X., 2015. China’s intellectual property protection strength and its
evaluation – based on the accession to TRIPS Agreement (Agreement On Trade-related
Aspects of Intellectual Property Rights). R&D Management, 45(4), pp. 397-410.
Long, C. X. & Wang, J., 2015. Judicial local protectionism in China: An empirical
study of IP cases. International Review of Law and Economics, Volume 42, pp. 48-59.
NCAC, N. C. A. o. P. R. o. C., 2017. Main Functions. [Online]
Available at: http://en.ncac.gov.cn/copyright/contents/10357/332362.shtml
[Accessed 12 11 2018].
NPC, N. P. C., 2015. The Legislation Law of The People’s Republic of China, s.l.: s.n.
Papageorgiadis, N. & McDonald, F., 2018. Defining and Measuring the Institutional
Context of National Intellectual Property Systems in a post-TRIPS world. Journal of
International Management.
Peng, M. W., 2013. An institution-based view of IPR protection. Business Horizons,
56(2), pp. 135-139.
Peng, M. W., Ahlstrom, D., Carraher, S. M. & Shi, W. (., 2017. An institution-based
view of global IPR history. Journal of International Business Studies, 48(7), pp. 893-
907.
SAIC, S. A. f. I. a. C., 2009. Our organizational set-up. [Online]
Available at: http://home.saic.gov.cn/english/aboutus/Departments/index.html
[Accessed 29 10 2018].
SIPO, 2002. White Paper on the Intellectual Property Rights Protection in China in
1998. [Online]
Available at:
http://english.sipo.gov.cn/laws/whitepapers/200804/t20080416_380349.html
[Accessed 07 11 2018].

90
Standing Committee of the NPC, 2018. Decision of the Standing Committee of the
National People’s Congress on Several Issues Concerning Litigation Procedures of
Patent and Other Intellectual Property Cases, s.l.: s.n.
State Council, 2008. Outline of the National Intellectual Property Strategy, s.l.: s.n.
Swike, E., Thompson, S. & Vasquez, C., 2008. Piracy in China. Business Horizons,
51(6), pp. 493-500.
The People's Republic of China, 2012. The Civil Procedure Law of People's Republic of
China, s.l.: s.n.
The Standing Committee of the NPC, 2014. Decision of the Standing Committee of the
National People's Congress on Establishing Intellectual Property Right Courts in
Beijing, Shanghai and Guangzhou, s.l.: s.n.
The Supreme People's Court of China, 2015. Interpretation of the Supreme People's
Court on the Application of the Civil Procedure Law of the PRC, s.l.: s.n.
The Supreme People's Court of China, 2015. The status of intellectual property judicial
protection in Chinese courts, s.l.: s.n.
USTR, 1989. Special 301 Report, s.l.: USTR.
USTR, 1990. Speical 301 Report, s.l.: USTR.
USTR, 1991. Special 301 Report, s.l.: USTR.
Wang, L., 2004. Intellectual property protection in China. The International Information
& Library Review, 36(3), pp. 253-261.
Wei, X., 2012. The Gap between the Chinese Trademark Law System and TRIPS and
Measures. Science & Technology Vision, Volume 26, pp. 483-484.
Wu, H., 2009. Evaluation and reflection on China's intellectual property legal
construction. China Legal Science, Issue 1, pp. 51-68.
Xiao, L., 2007. Review and prospect of the revision of Trademark law. China
Trademark, Volume 5, pp. 49-52.
Xinhua, 2018. The State Council of P.R.C.. [Online]
Available at:
http://english.gov.cn/state_council/ministries/2018/03/13/content_281476076446534.ht
m
[Accessed 25 10 2018].
Yang, D., 2003. The development of intellectual property in China. World Patent
Information , 25(2), pp. 131-142.
Yang, D. & Clarke, P., 2005. Globalisation and intellectual property in China.
Technovation, 25(5), pp. 545-555.
Yang, D., Sonmez, M. & Bosworth, D., 2004. Intellectual Property Abuses: How should
Multinationals Respond?. Long Range Planning, 37(5), pp. 459-475.
Yang, W.-N. & Yen, A. Y., 2009. The Dragon Gets New IP Claws: The Latest
Amendments to the Chinese Patent Law, s.l.: IPO Articles and Reports..

91
Zimmerman, A., 2013. Contending with Chinese counterfeits: Culture, growth, and
management responses. Business Horizons, 56(2), pp. 141-148.

92
Appendix A1 A brief summary of the key aspects of IP law have been revised
Table A1: A brief summary of the key aspects of IP law have been revised
Patent law Trademark law Copyright law
~1990s The main aspects of patent law revised in 1992 generally meet requirements of the Memorandum
of Understanding on The Protection of Intellectual Property (i.e., to include chemical inventions
as patentable subject matters, and provided requirements regarding term of protection,
compulsory licenses and rights conferred which should be included in patent law)
• Expanded patentable subject matter by including “Food, beverage and condiment; Drugs and
substances obtained by chemical means”
• Extended the duration of patent protection from 15 to 20 years for invention patents, and the
duration of utility model patent and design patent was extended from 5 to 10 years
• Strengthened the patent rights protection by: (1) extended the protection of patented method
by including “use, sell the products that are developed directly through the use of the patented
method” instead of “using this method”; (2) granted a new right to the patentee that he/it can
“prevent others from importing the patented products or products that are developed directly
through the use of the patented method after the patent right is granted, unless otherwise
provided for in this Law”; (3) Changed the conditions for compulsory licensing for
exploitation of a patent so that first of all, the unit that request for exploitation of an invention
patent or utility model patent need to have reasonable terms. Secondly, instead of requiring
the patentee to produce the patented product or use patented method within 3 years, the unit
should request the patentee first but not granted the right within reasonable time. Thirdly, the
amendment also provides that the patent office may grant a compulsory license for
exploitation of an invention patent or utility model patent if a national emergency or any
extraordinary state of affairs occurs, or public interests so require. The revised provisions put
more restriction on the administrative department to grant a compulsory license for
exploitation of a patent.; (4) Added a provision that is related to punishment of counterfeits.
Article 63 of the 1992 amendment provides that the patent administration department shall
order the suspension of counterfeiting the patented product or the patented method, making
public corrections as ordered, and impose a fine.
• Perfected the procedure provision of patent application, examination and approval of patent
application, e.g., added that the foreign applicant enjoys the same right of priority as the
Chinese applicant; Further clarified the scope of patent application documents that can be
modified; The 1992 amendment added more detailed provisions that are related to declaring a
patent right invalid; The time limit for revoking a patent right changed from “within three
months since the date the patent office announces the patent application” to “within six
months since the date that the patent office announced the grant of patent right”.
Yang and Clarke (2005) stated that the 1993 amendment of Trademark law in
China is based on the Madrid Agreement.
• Included service trademarks in the law in addition to trademarks for goods.
• Perfect the procedures for Trademark Registration, which include (1) Added
“geographical names of an administrative division at or above the county
level and the foreign geographical names which are well known to the
public” to be the signs that can not be used as trademarks. (2) Simplified the
procedure “Where same applicant for registration of a trademark intends to
use the same trademark for goods in different classes” by only filing an
application for registration in respect of each class of the prescribed
classification of goods, but not filing the applications in respect of different
classes of goods. (3) Added a new provision in article 27 which provides
that the trademark office shall cancel the registered trademark if “the
registration of a trademark was acquired by fraud or any other unfair
means”.
• Strengthened the protection of trademarks by enlarging the scope of acts
that shall be considered infringement of registered trademarks. The 1993
amendment enlarged the scope of acts that shall be considered infringement
of registered trademarks by adding “sell goods that he knows bear a
counterfeited registered trademark” and “to counterfeit and to sell such
representations of a registered trademark as were counterfeited”. The
amendment also made more detailed provisions regarding counterfeiting a
registered trademark by dividing it into three different types of acts, which
include “counterfeit a registered trademark of another person”,
“counterfeits, or makes representations of a registered trademark of another
person without his/its authorization, or sells such representations of a
registered trademark as were counterfeited, or made without authorization”,
and “sells goods that he knows bear a counterfeited registered trademark”.
In addition, the 1993 amendment specified that when the case is serious
enough to constitute a crime, the party shall be prosecuted according to the
law.
The Copyright law was first
enacted in 1990, so the first wave
of revision only involved Patent
law and Trademark Law
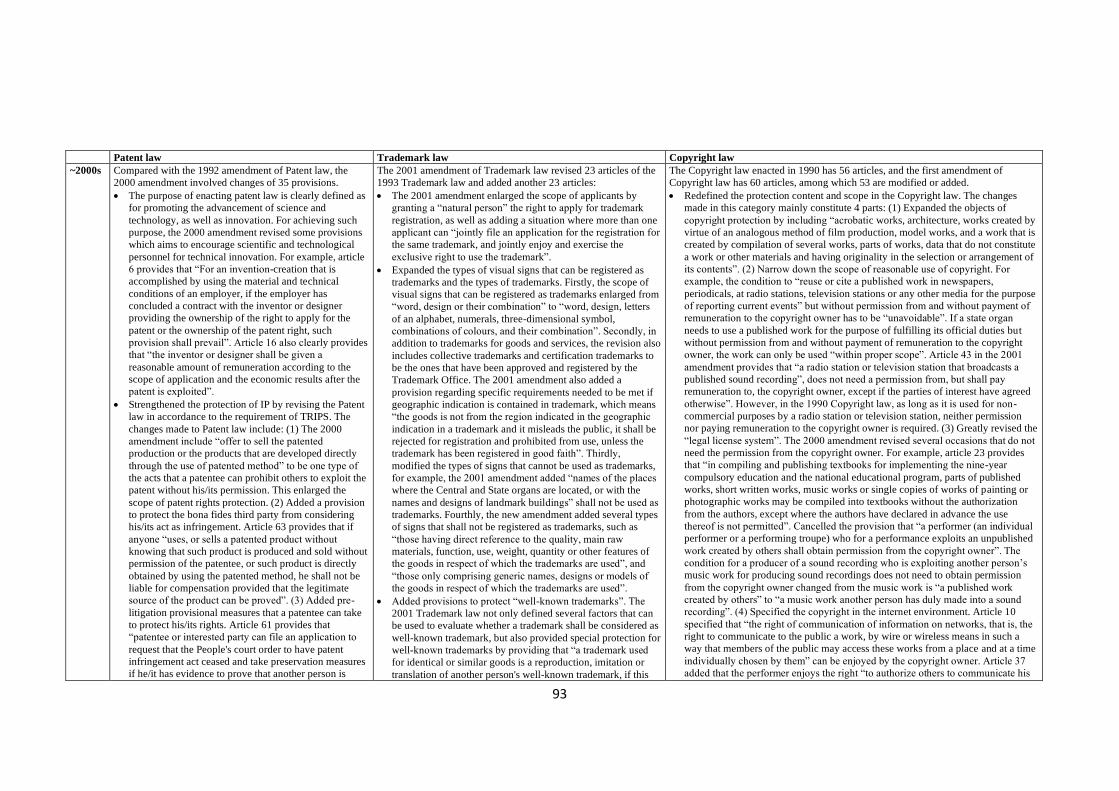
93
Patent law Trademark law Copyright law
~2000s Compared with the 1992 amendment of Patent law, the
2000 amendment involved changes of 35 provisions.
• The purpose of enacting patent law is clearly defined as
for promoting the advancement of science and
technology, as well as innovation. For achieving such
purpose, the 2000 amendment revised some provisions
which aims to encourage scientific and technological
personnel for technical innovation. For example, article
6 provides that “For an invention-creation that is
accomplished by using the material and technical
conditions of an employer, if the employer has
concluded a contract with the inventor or designer
providing the ownership of the right to apply for the
patent or the ownership of the patent right, such
provision shall prevail”. Article 16 also clearly provides
that “the inventor or designer shall be given a
reasonable amount of remuneration according to the
scope of application and the economic results after the
patent is exploited”.
• Strengthened the protection of IP by revising the Patent
law in accordance to the requirement of TRIPS. The
changes made to Patent law include: (1) The 2000
amendment include “offer to sell the patented
production or the products that are developed directly
through the use of patented method” to be one type of
the acts that a patentee can prohibit others to exploit the
patent without his/its permission. This enlarged the
scope of patent rights protection. (2) Added a provision
to protect the bona fides third party from considering
his/its act as infringement. Article 63 provides that if
anyone “uses, or sells a patented product without
knowing that such product is produced and sold without
permission of the patentee, or such product is directly
obtained by using the patented method, he shall not be
liable for compensation provided that the legitimate
source of the product can be proved”. (3) Added pre-
litigation provisional measures that a patentee can take
to protect his/its rights. Article 61 provides that
“patentee or interested party can file an application to
request that the People's court order to have patent
infringement act ceased and take preservation measures
if he/it has evidence to prove that another person is
The 2001 amendment of Trademark law revised 23 articles of the
1993 Trademark law and added another 23 articles:
• The 2001 amendment enlarged the scope of applicants by
granting a “natural person” the right to apply for trademark
registration, as well as adding a situation where more than one
applicant can “jointly file an application for the registration for
the same trademark, and jointly enjoy and exercise the
exclusive right to use the trademark”.
• Expanded the types of visual signs that can be registered as
trademarks and the types of trademarks. Firstly, the scope of
visual signs that can be registered as trademarks enlarged from
“word, design or their combination” to “word, design, letters
of an alphabet, numerals, three-dimensional symbol,
combinations of colours, and their combination”. Secondly, in
addition to trademarks for goods and services, the revision also
includes collective trademarks and certification trademarks to
be the ones that have been approved and registered by the
Trademark Office. The 2001 amendment also added a
provision regarding specific requirements needed to be met if
geographic indication is contained in trademark, which means
“the goods is not from the region indicated in the geographic
indication in a trademark and it misleads the public, it shall be
rejected for registration and prohibited from use, unless the
trademark has been registered in good faith”. Thirdly,
modified the types of signs that cannot be used as trademarks,
for example, the 2001 amendment added “names of the places
where the Central and State organs are located, or with the
names and designs of landmark buildings” shall not be used as
trademarks. Fourthly, the new amendment added several types
of signs that shall not be registered as trademarks, such as
“those having direct reference to the quality, main raw
materials, function, use, weight, quantity or other features of
the goods in respect of which the trademarks are used”, and
“those only comprising generic names, designs or models of
the goods in respect of which the trademarks are used”.
• Added provisions to protect “well-known trademarks”. The
2001 Trademark law not only defined several factors that can
be used to evaluate whether a trademark shall be considered as
well-known trademark, but also provided special protection for
well-known trademarks by providing that “a trademark used
for identical or similar goods is a reproduction, imitation or
translation of another person's well-known trademark, if this
The Copyright law enacted in 1990 has 56 articles, and the first amendment of
Copyright law has 60 articles, among which 53 are modified or added.
• Redefined the protection content and scope in the Copyright law. The changes
made in this category mainly constitute 4 parts: (1) Expanded the objects of
copyright protection by including “acrobatic works, architecture, works created by
virtue of an analogous method of film production, model works, and a work that is
created by compilation of several works, parts of works, data that do not constitute
a work or other materials and having originality in the selection or arrangement of
its contents”. (2) Narrow down the scope of reasonable use of copyright. For
example, the condition to “reuse or cite a published work in newspapers,
periodicals, at radio stations, television stations or any other media for the purpose
of reporting current events” but without permission from and without payment of
remuneration to the copyright owner has to be “unavoidable”. If a state organ
needs to use a published work for the purpose of fulfilling its official duties but
without permission from and without payment of remuneration to the copyright
owner, the work can only be used “within proper scope”. Article 43 in the 2001
amendment provides that “a radio station or television station that broadcasts a
published sound recording”, does not need a permission from, but shall pay
remuneration to, the copyright owner, except if the parties of interest have agreed
otherwise”. However, in the 1990 Copyright law, as long as it is used for non-
commercial purposes by a radio station or television station, neither permission
nor paying remuneration to the copyright owner is required. (3) Greatly revised the
“legal license system”. The 2000 amendment revised several occasions that do not
need the permission from the copyright owner. For example, article 23 provides
that “in compiling and publishing textbooks for implementing the nine-year
compulsory education and the national educational program, parts of published
works, short written works, music works or single copies of works of painting or
photographic works may be compiled into textbooks without the authorization
from the authors, except where the authors have declared in advance the use
thereof is not permitted”. Cancelled the provision that “a performer (an individual
performer or a performing troupe) who for a performance exploits an unpublished
work created by others shall obtain permission from the copyright owner”. The
condition for a producer of a sound recording who is exploiting another person’s
music work for producing sound recordings does not need to obtain permission
from the copyright owner changed from the music work is “a published work
created by others” to “a music work another person has duly made into a sound
recording”. (4) Specified the copyright in the internet environment. Article 10
specified that “the right of communication of information on networks, that is, the
right to communicate to the public a work, by wire or wireless means in such a
way that members of the public may access these works from a place and at a time
individually chosen by them” can be enjoyed by the copyright owner. Article 37
added that the performer enjoys the right “to authorize others to communicate his

94
committing or is about to commit a patent infringement
which may cause irreparable harm to his lawful rights
and interests unless being ceased in time”. (4) The
amendment provides that an application for a patent for
utility model or design or a patent reexamination or
invalidation shall finally be examined by the court,
while such final decisions in the 1992 amendment are
made by the Patent review board.
• Modified the conditions for granting a compulsory
license. For example, article 51 provides that the
exploitation of an invention or utility model which has
been obtained the patent right relies on an earlier
invention or utility model which also has obtained the
patent right, the condition for granting a compulsory
license to exploit the earlier invention or utility model is
that the later invention or utility model “represents a
major technological advancement of remarkable
economic significance” in the 2000 amendment, while
the 1992 amendment only requires it to have
“technological advancement”. Article 52 added a
provision which specifies that the “decision on granting
of the compulsory license shall be specified the scope
and duration for exploitation according to the reasons
justifying the compulsory license”, and also added a
situation “when such reasons cease to exist and are
unlikely to recur”, to what actions a patentee can take so
that his/its patent rights can be protected
• Clarified, simplified, and perfected the procedures
regarding examination and approval of patent
applications, as well as patent protection and
punishment. First of all, the amendment clarified the
way to calculate the amount of compensation by
providing that it “shall be determined according to the
patentee's losses caused by the infringement, or
according to the benefits acquired by the infringer
through the infringement. If it is hard to determine the,
the amount of compensation may be determined
according to the reasonably multiplied amount of the
royalties of that patent”. Secondly, the 2000 amendment
delete all the provisions related to revoking patent
rights, and only kept the provisions related to declaring
a patent right invalid. Since there are many overlaps
between the procedure of revoking patent rights and
well-known trademark not registered in China, the trademark
shall be rejected for registration and prohibited from use if it is
likely to cause confusion. While if this well-known trademark
has been registered in China, and it is likely to mislead the
public, it shall be rejected for registration and prohibited from
use as well”. Furthermore, other trademarks can only file a
request with the Trademark Review and Adjudication Board
for adjudication to cancel the registered trademark within five
years from the date of the registration of the trademark if it
shall not be registered in accordance with the provision.
However, if a well-known trademark is registered in bad faith,
the genuine owner can file such request but without the
restriction of a five-year limitation.
• The new amendment perfects the procedures that are related to
application of trademark registration and assignment of
registered trademarks, as well as the procedures related to
requiring the Trademark Review and Adjudication Board for
adjudication of trademarks with disputes. First of all, the 2001
Trademark law added 2 articles which are related to the right
of priority for registering a trademark in China by providing
the requirements and procedures of obtaining the right of
priority. For example, Article 24 provides that “any applicant
for the registration of a trademark who files an application for
registration of the same trademark for identical goods in China
within six months from the date of filing the first application
for the trademark registration overseas may enjoy the right of
priority in accordance with any bilateral agreement, or
international treaties both countries joined”, and “Anyone
claiming the right of priority shall make a statement in writing
when it or he files the application for the trademark
registration, and submit a copy of the application documents it
or he first filed for the registration of the trademark within
three months”. Secondly, the 2001 amendment made specific
requirement that “the assignor and assignee shall conclude a
contract for the assignment of a registered trademark” when
“jointly file an application with the trademark Office regarding
trademark assignment”. Thirdly, if any person disputing a
registered trademark can apply to the Trademark Review and
Adjudication Board for adjudication, the time limit for filing
such application extended from one year to five years in the
2001 amendment. As stated in the previous paragraph, the
2001 amendment added provisions regarding requesting
performance to the public on information network, and to receive remuneration
therefore.” Article 41 also provides that a producer of sound recordings or video
recordings have the right to authorize others to “communicate to the public on an
information network”
• The 2001 Copyright law redefined the types of copyrights that can be enjoyed by a
copyright owner or other relevant parties. The revisions mainly include: (1) New
types of personality rights and property rights included in copyrights include: the
right of rental, the right of showing, and the right of communication of information
on networks. It also expanded the types of acts that right owners can use to
exercise their right of performance and the right of broadcast. (2) The 2001
amendment added a requirement that a producer of sound recordings or video
recording shall obtain permission from “the owner of the copyright in the work
created by adaptation, translation, annotation or arrangement and to the owner of
the copyright in the original work” for exploiting its/his work. “When publishing
works created by adaptation, translation, annotation, arrangement or compilation
of pre-existing works, the publisher shall both have the permission from the
owners of the copyright in the works created by means of adaptation, translation,
annotation, arrangement or compilation and the owners of the copyright in the
original works” as well. (3) Modified and strengthened the rights of the owner of
“neighbouring rights ” can enjoy. First of all, the 2001 amendment added that “a
publisher has the right to license or prohibit any other person to use the
typographical arrangement of books or periodicals he has published, the term of
protection for such right is 10 years”. Secondly, revised the types of rights that a
performer can enjoy, for example, modified the right “to authorize others to make
live broadcasts” to “to authorize others to make live broadcasts and public
transmission of its or his performance and to receive remuneration”. Revoked the
requirement of “for commercial purposes” for “to authorize others to make sound
recordings and video recordings, and to receive remuneration therefore”. The new
amendment also added two more types of right that a performer can enjoy, which
include “to authorize others to reproduce or distribute sound recordings and video
recordings incorporating his performance, and to receive remuneration therefore”
and “to authorize others to communicate his performance to the public on
information network, and to receive remuneration therefore”. The term of
protection for the related rights is 50 years. Thirdly, the types of rights a producer
of sound recordings or video recordings can enjoy expanded from “to authorize
others to reproduce“ to “reproduce, distribute, rent and communicate to the public
on an information network”. “The term of protection of such rights expires on 31st
December of the fiftieth year after the recording was first produced” instead of
published for the first time as provided in 1990. Finally, the 2001 amendment
provided new types of acts that can be prohibited by a radio station or television
station, which include “to rebroadcast its broadcast radio or television program,
and to fix its broadcast radio or television program on a sound recording or video
recording carrier and to reproduce the sound recording or video recording carrier.”
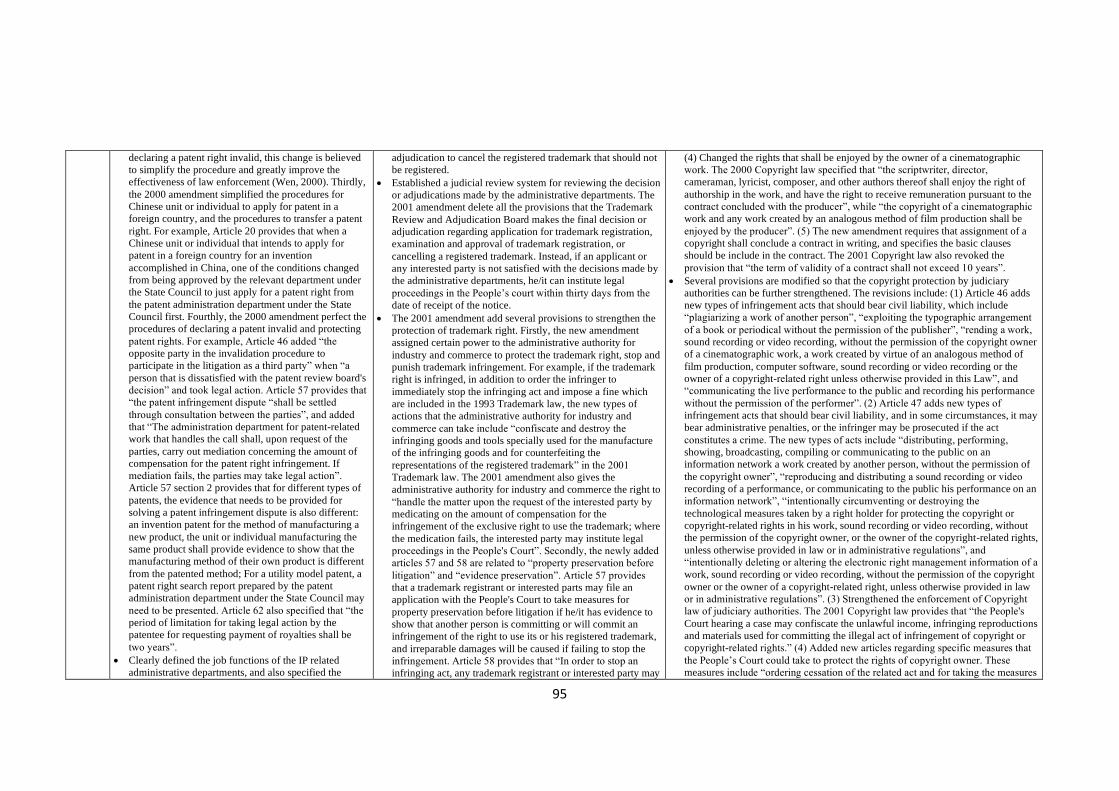
95
declaring a patent right invalid, this change is believed
to simplify the procedure and greatly improve the
effectiveness of law enforcement (Wen, 2000). Thirdly,
the 2000 amendment simplified the procedures for
Chinese unit or individual to apply for patent in a
foreign country, and the procedures to transfer a patent
right. For example, Article 20 provides that when a
Chinese unit or individual that intends to apply for
patent in a foreign country for an invention
accomplished in China, one of the conditions changed
from being approved by the relevant department under
the State Council to just apply for a patent right from
the patent administration department under the State
Council first. Fourthly, the 2000 amendment perfect the
procedures of declaring a patent invalid and protecting
patent rights. For example, Article 46 added “the
opposite party in the invalidation procedure to
participate in the litigation as a third party” when “a
person that is dissatisfied with the patent review board's
decision” and took legal action. Article 57 provides that
“the patent infringement dispute “shall be settled
through consultation between the parties”, and added
that “The administration department for patent-related
work that handles the call shall, upon request of the
parties, carry out mediation concerning the amount of
compensation for the patent right infringement. If
mediation fails, the parties may take legal action”.
Article 57 section 2 provides that for different types of
patents, the evidence that needs to be provided for
solving a patent infringement dispute is also different:
an invention patent for the method of manufacturing a
new product, the unit or individual manufacturing the
same product shall provide evidence to show that the
manufacturing method of their own product is different
from the patented method; For a utility model patent, a
patent right search report prepared by the patent
administration department under the State Council may
need to be presented. Article 62 also specified that “the
period of limitation for taking legal action by the
patentee for requesting payment of royalties shall be
two years”.
• Clearly defined the job functions of the IP related
administrative departments, and also specified the
adjudication to cancel the registered trademark that should not
be registered.
• Established a judicial review system for reviewing the decision
or adjudications made by the administrative departments. The
2001 amendment delete all the provisions that the Trademark
Review and Adjudication Board makes the final decision or
adjudication regarding application for trademark registration,
examination and approval of trademark registration, or
cancelling a registered trademark. Instead, if an applicant or
any interested party is not satisfied with the decisions made by
the administrative departments, he/it can institute legal
proceedings in the People’s court within thirty days from the
date of receipt of the notice.
• The 2001 amendment add several provisions to strengthen the
protection of trademark right. Firstly, the new amendment
assigned certain power to the administrative authority for
industry and commerce to protect the trademark right, stop and
punish trademark infringement. For example, if the trademark
right is infringed, in addition to order the infringer to
immediately stop the infringing act and impose a fine which
are included in the 1993 Trademark law, the new types of
actions that the administrative authority for industry and
commerce can take include “confiscate and destroy the
infringing goods and tools specially used for the manufacture
of the infringing goods and for counterfeiting the
representations of the registered trademark” in the 2001
Trademark law. The 2001 amendment also gives the
administrative authority for industry and commerce the right to
“handle the matter upon the request of the interested party by
medicating on the amount of compensation for the
infringement of the exclusive right to use the trademark; where
the medication fails, the interested party may institute legal
proceedings in the People's Court”. Secondly, the newly added
articles 57 and 58 are related to “property preservation before
litigation” and “evidence preservation”. Article 57 provides
that a trademark registrant or interested parts may file an
application with the People's Court to take measures for
property preservation before litigation if he/it has evidence to
show that another person is committing or will commit an
infringement of the right to use its or his registered trademark,
and irreparable damages will be caused if failing to stop the
infringement. Article 58 provides that “In order to stop an
infringing act, any trademark registrant or interested party may
(4) Changed the rights that shall be enjoyed by the owner of a cinematographic
work. The 2000 Copyright law specified that “the scriptwriter, director,
cameraman, lyricist, composer, and other authors thereof shall enjoy the right of
authorship in the work, and have the right to receive remuneration pursuant to the
contract concluded with the producer”, while “the copyright of a cinematographic
work and any work created by an analogous method of film production shall be
enjoyed by the producer”. (5) The new amendment requires that assignment of a
copyright shall conclude a contract in writing, and specifies the basic clauses
should be include in the contract. The 2001 Copyright law also revoked the
provision that “the term of validity of a contract shall not exceed 10 years”.
• Several provisions are modified so that the copyright protection by judiciary
authorities can be further strengthened. The revisions include: (1) Article 46 adds
new types of infringement acts that should bear civil liability, which include
“plagiarizing a work of another person”, “exploiting the typographic arrangement
of a book or periodical without the permission of the publisher”, “rending a work,
sound recording or video recording, without the permission of the copyright owner
of a cinematographic work, a work created by virtue of an analogous method of
film production, computer software, sound recording or video recording or the
owner of a copyright-related right unless otherwise provided in this Law”, and
“communicating the live performance to the public and recording his performance
without the permission of the performer”. (2) Article 47 adds new types of
infringement acts that should bear civil liability, and in some circumstances, it may
bear administrative penalties, or the infringer may be prosecuted if the act
constitutes a crime. The new types of acts include “distributing, performing,
showing, broadcasting, compiling or communicating to the public on an
information network a work created by another person, without the permission of
the copyright owner”, “reproducing and distributing a sound recording or video
recording of a performance, or communicating to the public his performance on an
information network”, “intentionally circumventing or destroying the
technological measures taken by a right holder for protecting the copyright or
copyright-related rights in his work, sound recording or video recording, without
the permission of the copyright owner, or the owner of the copyright-related rights,
unless otherwise provided in law or in administrative regulations”, and
“intentionally deleting or altering the electronic right management information of a
work, sound recording or video recording, without the permission of the copyright
owner or the owner of a copyright-related right, unless otherwise provided in law
or in administrative regulations”. (3) Strengthened the enforcement of Copyright
law of judiciary authorities. The 2001 Copyright law provides that “the People's
Court hearing a case may confiscate the unlawful income, infringing reproductions
and materials used for committing the illegal act of infringement of copyright or
copyright-related rights.” (4) Added new articles regarding specific measures that
the People’s Court could take to protect the rights of copyright owner. These
measures include “ordering cessation of the related act and for taking the measures

96
obligations of the relevant administration department.
For example, Article 2 specially stated that “the
departments in charge of patent-related work of the
people's governments of provinces, autonomous regions
and municipalities directly under the Central
Government shall be responsible for patent
administration within their respective administrative
areas”. Article 21 requires that the patent administration
department under the State Council and its Patent
Review Board shall handle patent applications and
requests objectively, fairly, accurately and timely.
Articles 66 specified that “the administration
department for patent-related work shall not be involved
in recommending patented products to the public or
engage in any other similar business activities”,
otherwise, it will receive certain punishment.
Furthermore, article 67 expanded the types of acts of
staff member of the government department engaged in
administration of patent-related work can constitutes a
crime, in addition to committing irregularities for
personal gain, neglects his duty and abuses his power
are the ones newly added in the amendment.
file an application with the People's Court for evidence
preservation before instituting legal proceedings where the
evidence will possibly be destroyed or lost or difficult to be
obtained again in the future”. Thirdly, the 2001 amendment
increased the amount of compensation. The 2001 Trademark
law not only added “the appropriate expenses that infringee for
stopping the infringement” to be part of the compensation, but
also confirmed that “the People's Court shall impose an
amount of damages of no more than RMB 500, 000 yuan
according to the circumstances of the infringement if it is
difficult to determine the profit that the infringer has earned or
the injury that the infringee has suffered”.
• Added the obligations of the staff member who works in
relevant administrative departments. For example, article 60
provides that “The State functionaries for the registration,
administration and reexamination of trademarks must handle
cases according to law, be incorruptible and disciplined,
devoted to their duties and courteous and honest in their
provision of service.” Article 62 provides that “Where any
State functionary for the registration, administration and
reexamination of trademarks neglects his duty, abuses his
power, engages in malpractice for personal gain, handles the
registration, administration and reexamination of trademarks in
violation of law, accepts money or material wealth from any
interested party or seeks illicit interest, which constitutes a
crime, he or she shall be prosecuted for his or her criminal
liability. If the case is not serious enough to constitute a crime,
he or she shall be given disciplinary sanction according to
law.”
for property preservation before instituting legal proceedings if copyright owner or
owner of a copyright-related right who has evidence to establish that another
person is committing or will commit an act of infringing his right, which could
cause irreparable injury to his legitimate rights and interests if the act is not
stopped immediately”, and preserve evidence before initiating legal proceedings if
the evidence could be lost or are difficult to obtain afterwards for the purpose of
preventing an infringing act”. Furthermore, the amendment also specifies that the
court should make a decision within 48 hours. (5) Clarified how to calculate and
decide the amount of compensation. Articles 48 provides the amount of
compensation shall be “the actual injury suffered by the right holder, where the
actual injury is difficult to compute, the damages shall be paid on the basis of the
unlawful income of the infringer. The amount of damages shall also include the
appropriate fees paid by the right holder to stop the infringing act”. It also specifies
that if “the right holder's actual injury or infringer's Unlawful income cannot be
determined, the People's Court shall Judge the damages not exceeding RMB 500,
000 depending on the circumstances of the infringing act”. (6) Added a new article
which provides that the publisher or producer of a reproduction, the distributor of a
reproduction, and the renter of the reproduction of a cinematographic work has the
obligation to provide evidence to prove that his/its distributed or rented
reproduction has been from a lawful source.
• The strength of copyright protection provided by the relevant administrative
departments is enhanced. The new amendment not only clearly defined the legal
status of the organisation for collective administration of copyright, but also
expanded the administrative penalties that the copyright administration department
may impose to deal with the infringement. Article 47 provides that if the
infringement is harming the public interest at the same time, “a copyright
administration department may order to cease the infringing act, confiscate
unlawful income from the act, confiscate and destroy infringing reproductions and
impose a fine. where the circumstances are serious, the copyright administration
department may also confiscate the materials, tools, and equipment mainly used
for making the infringing reproductions”.
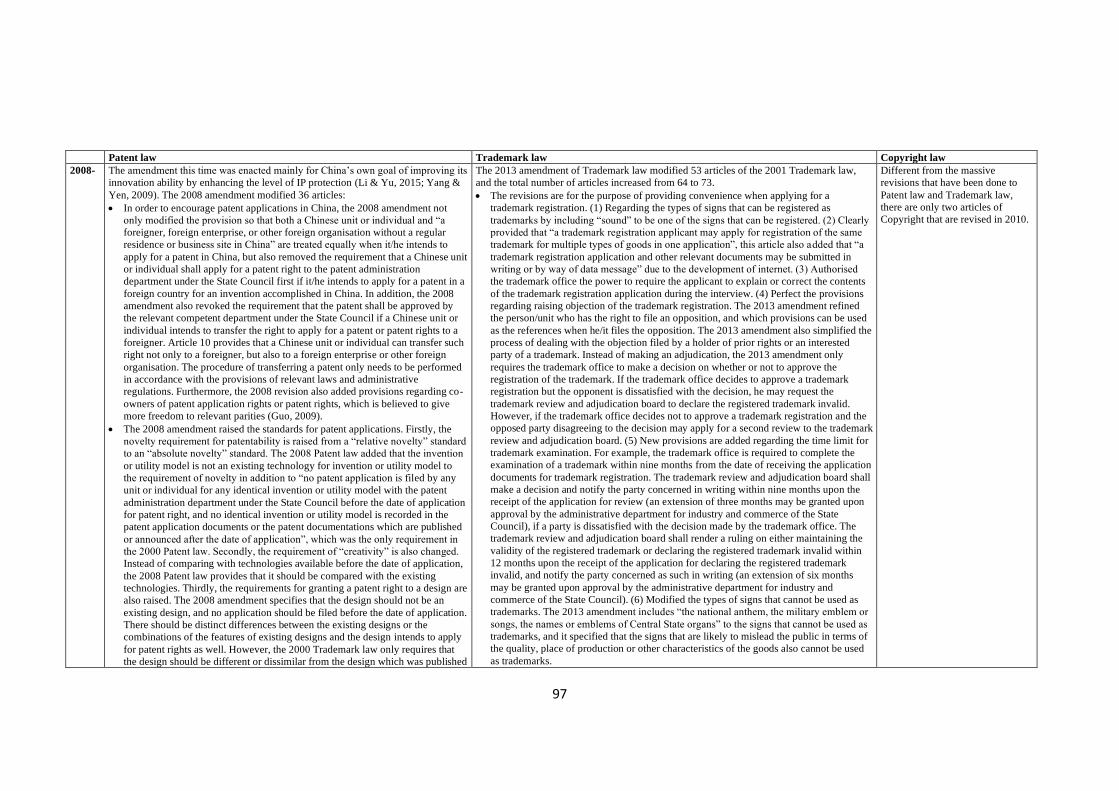
97
Patent law Trademark law Copyright law
2008- The amendment this time was enacted mainly for China’s own goal of improving its
innovation ability by enhancing the level of IP protection (Li & Yu, 2015; Yang &
Yen, 2009). The 2008 amendment modified 36 articles:
• In order to encourage patent applications in China, the 2008 amendment not
only modified the provision so that both a Chinese unit or individual and “a
foreigner, foreign enterprise, or other foreign organisation without a regular
residence or business site in China” are treated equally when it/he intends to
apply for a patent in China, but also removed the requirement that a Chinese unit
or individual shall apply for a patent right to the patent administration
department under the State Council first if it/he intends to apply for a patent in a
foreign country for an invention accomplished in China. In addition, the 2008
amendment also revoked the requirement that the patent shall be approved by
the relevant competent department under the State Council if a Chinese unit or
individual intends to transfer the right to apply for a patent or patent rights to a
foreigner. Article 10 provides that a Chinese unit or individual can transfer such
right not only to a foreigner, but also to a foreign enterprise or other foreign
organisation. The procedure of transferring a patent only needs to be performed
in accordance with the provisions of relevant laws and administrative
regulations. Furthermore, the 2008 revision also added provisions regarding co-
owners of patent application rights or patent rights, which is believed to give
more freedom to relevant parities (Guo, 2009).
• The 2008 amendment raised the standards for patent applications. Firstly, the
novelty requirement for patentability is raised from a “relative novelty” standard
to an “absolute novelty” standard. The 2008 Patent law added that the invention
or utility model is not an existing technology for invention or utility model to
the requirement of novelty in addition to “no patent application is filed by any
unit or individual for any identical invention or utility model with the patent
administration department under the State Council before the date of application
for patent right, and no identical invention or utility model is recorded in the
patent application documents or the patent documentations which are published
or announced after the date of application”, which was the only requirement in
the 2000 Patent law. Secondly, the requirement of “creativity” is also changed.
Instead of comparing with technologies available before the date of application,
the 2008 Patent law provides that it should be compared with the existing
technologies. Thirdly, the requirements for granting a patent right to a design are
also raised. The 2008 amendment specifies that the design should not be an
existing design, and no application should be filed before the date of application.
There should be distinct differences between the existing designs or the
combinations of the features of existing designs and the design intends to apply
for patent rights as well. However, the 2000 Trademark law only requires that
the design should be different or dissimilar from the design which was published
The 2013 amendment of Trademark law modified 53 articles of the 2001 Trademark law,
and the total number of articles increased from 64 to 73.
• The revisions are for the purpose of providing convenience when applying for a
trademark registration. (1) Regarding the types of signs that can be registered as
trademarks by including “sound” to be one of the signs that can be registered. (2) Clearly
provided that “a trademark registration applicant may apply for registration of the same
trademark for multiple types of goods in one application”, this article also added that “a
trademark registration application and other relevant documents may be submitted in
writing or by way of data message” due to the development of internet. (3) Authorised
the trademark office the power to require the applicant to explain or correct the contents
of the trademark registration application during the interview. (4) Perfect the provisions
regarding raising objection of the trademark registration. The 2013 amendment refined
the person/unit who has the right to file an opposition, and which provisions can be used
as the references when he/it files the opposition. The 2013 amendment also simplified the
process of dealing with the objection filed by a holder of prior rights or an interested
party of a trademark. Instead of making an adjudication, the 2013 amendment only
requires the trademark office to make a decision on whether or not to approve the
registration of the trademark. If the trademark office decides to approve a trademark
registration but the opponent is dissatisfied with the decision, he may request the
trademark review and adjudication board to declare the registered trademark invalid.
However, if the trademark office decides not to approve a trademark registration and the
opposed party disagreeing to the decision may apply for a second review to the trademark
review and adjudication board. (5) New provisions are added regarding the time limit for
trademark examination. For example, the trademark office is required to complete the
examination of a trademark within nine months from the date of receiving the application
documents for trademark registration. The trademark review and adjudication board shall
make a decision and notify the party concerned in writing within nine months upon the
receipt of the application for review (an extension of three months may be granted upon
approval by the administrative department for industry and commerce of the State
Council), if a party is dissatisfied with the decision made by the trademark office. The
trademark review and adjudication board shall render a ruling on either maintaining the
validity of the registered trademark or declaring the registered trademark invalid within
12 months upon the receipt of the application for declaring the registered trademark
invalid, and notify the party concerned as such in writing (an extension of six months
may be granted upon approval by the administrative department for industry and
commerce of the State Council). (6) Modified the types of signs that cannot be used as
trademarks. The 2013 amendment includes “the national anthem, the military emblem or
songs, the names or emblems of Central State organs” to the signs that cannot be used as
trademarks, and it specified that the signs that are likely to mislead the public in terms of
the quality, place of production or other characteristics of the goods also cannot be used
as trademarks.
Different from the massive
revisions that have been done to
Patent law and Trademark law,
there are only two articles of
Copyright that are revised in 2010.

98
in the domestic or foreign publications or publicly used domestically before the
date of application.
• Restrictions have been put on the patent right in 2008 amendment, which
provides that only one patent can be granted for the same invention. More
importantly, the 2008 Patent law add provisions of generic resources by
providing that “Patent rights shall not be granted for inventions that are
accomplished by relying on genetic resources which are obtained or used in
violation of the provisions of laws and administrative regulations” in article 5.
Article 26 specifies that “the patent application documents shall indicate the
direct and original source of the genetic resources if the invention-creation
accomplished by relying on genetic resources”.
• Enlarged the scope of patent protection by adding “offer to sell” to be the type
of acts which requires permission of the patentee if a unit or individual intends
to exploit a design patent.
• Strengthening patent protection is one of the aspects that the 2008 amendment
focused on. The revisions of this aspect are constituted by perfecting provisions
of compulsory licence, revising the situations that are not considered as
infringement, perfecting the provisions regarding compensation for
infringement, and specifying special measures that can be taken to protect patent
rights. (1) Perfect provision of compulsory licence. Article 48 in the 2008
amendment specifies the circumstances under which a compulsory license for
exploitation of an invention patent or utility model patent can be granted, which
are “a. When it has been three years since the date the patent right is granted and
four years since the date the patent application is submitted, the patentee,
without legitimate reasons, fails to have the patent exploited or fully exploited;
or b. The patentee's exercise of the patent right is in accordance with law,
confirmed as monopoly and its negative impact on competition needs to be
eliminated or reduced”. The requirements are vague in the 2000 Patent law. The
newly-added article 50 provides that a compulsory license for manufacturing a
drug which is protected by patent rights can be granted for the benefit of public
health, and article 52 provides that “if an invention involved in a compulsory
license is a semi-conductor technology, the exploitation thereof shall be limited
to the purpose of public interests and to the circumstances listed in article 48”.
(2) Revised the situations which are not considered infringement. The 2008
amendment added that “if the accused infringer has evidence to prove that the
technology or design exploited is an existing technology or design”, and “any
person produces, uses, or imports patented drugs or patented medical apparatus
and instruments, for the purpose of providing information required for
administrative examination and approval, or produces or any other person
imports patented drugs or patented medical apparatus and instruments especially
for that person”, will not be deemed to be patent right infringement. The 2008
amendment also specifies that “for the purpose of production and business
operation, offers to sell a patent-infringing product without knowing that such
• The provisions are modified for maintaining a good market order of fair competition, (1)
Established that “good faith” should be the fundamental principle that should be upheld
in the application for trademark registration and in the use of trademarks. (2) The 2013
Trademark law perfect the rules to protect well-known trademark by providing that “a
well-known trademark shall be recognized as a fact that needs to be ascertained in
dealing with a trademark-related case upon request by the party concerned”, and also
specifies that according to the claims of the party, relevant authorities can decide whether
or not to recognise the relevant trademark as a well-known one under varied
circumstances (e.g., during the trademark registration review, or handling of a trademark
dispute, or the hearing of a civil or administrative case). (3) Strengthened the protection
of unregistered trademarks by adding a new paragraph to article 15 that provides that “an
application for registering a trademark for the same kind of goods, or similar goods shall
not be approved if the trademark under application is identical with or similar to an
unregistered trademark already used by another party, the applicant is clearly aware of
the existence of the trademark of such another party due to contractual, business or other
relationships with the latter other than those prescribed in the preceding paragraph, and
such another party raises objections to the trademark registration application in question”.
(4) Specified a situation where using a registered trademark or an unregistered well-
known trademark of another party as the trade name in its enterprise name and mislead
the public constitutes unfair competition. This new provision connected Trademark law
and Anti-unfair Competition law.
• Strengthened the protection of trademark rights. (1) Expanded the type of acts that will
be considered infringement acts by including “using a trademark that is identical with or
similar to the registered trademark on similar goods without obtaining licensing from the
registrant of the registered trademark, and is likely to cause confusion” and “providing,
intentionally, convenience for such acts as infringe upon others' exclusive right of
trademark use, to facilitate others to commit infringement on the exclusive right of
trademark use”. (2) Added restrictions on the exclusive rights of registered trademark.
For example, article 59 provides that “the holder of the exclusive right to use a registered
trademark shall have no right to prohibit others from properly using the generic name,
graphics or models of a commodity contained in the registered trademark, or such
information as directly indicates the quality, main raw materials, functions, purposes,
weight, quantity or other features of the commodity, or the names of the geographical
locations as contained therein”. (3) Strengthened the law enforcement of administrative
departments. Firstly, the 2013 amendment specified that the fine that the local
administrative department for industry and commerce can impose, for example, “if the
illegal business revenue is RMB 50,000 yuan or more, a fine of up to 20% of the illegal
business revenue may be imposed; if there is no illegal business revenue or the illegal
revenue is less than RMB 50,000 yuan, a fine of up to RMB 10,000 yuan may be
imposed”. “Where a party passes off an unregistered trademark as a registered trademark
or uses an unregistered trademark in violation of Article 10 of this Law, if the illegal
business revenue is RMB 50,000 yuan or more, a fine of up to 20% of the illegal business
revenue may be imposed; if there is no illegal business revenue or the illegal business

99
product is produced and sold without permission of the patentee, if can prove the
legitimate source of the product, he shall not be liable for compensation”. (3)
Perfect the provisions regarding compensation for infringement. First of all, the
fine imposed on the patent infringer increased from no more than 3 times of the
unlawful gains in addition to confiscate the unlawful gains to no more than 4
times. Secondly, the fine imposed on the patent infringer increased from no
more than RMB 50,000 to RMB 200,000 if there are no unlawful gains. Thirdly,
the 2008 Patent law provides that “The amount of compensation shall include
the reasonable expenses paid by the patentee for putting an end to the
infringement”, which is not provided in 2000 Patent law. Fourthly, article 65 is
added which provides that “if the losses of the patentee, benefits of the infringer,
or royalties of the patent are all hard to determine, the people's court may, on the
basis of the factors such as the type of patent right, nature of the infringement,
and seriousness of the case, determine the amount of compensation within the
range from 10,000 yuan to 1,000,000 yuan.” (4) Revised provisions regarding
pre-litigation provisional measures and pre-litigation evidence preservation. In
order to be consistent with relevant provisions with Trademark law and
Copyright law, the 2008 amendment firstly added the provisions of a pre-
litigation provisional measure by citing relevant provisions from the Civil
Procedure law in article 66. For example, “the people's court shall make a ruling
within 48 hours from the time of its acceptance of the application. If an
extension is needed under special circumstances, a 48-hour extension may be
allowed. If a ruling is made to order to have the relevant act ceased, it shall be
enforced immediately. The party that is dissatisfied with the ruling may file once
for review, and the enforcement shall not be suspended during the period of
review. If the applicant does not take legal action within 15 days from the date
the people's court takes measures to have the relevant act ceased, the people's
court shall lift such measures.” Secondly, the newly enacted article 67 which
relates to filing an application with the People’s court for evidence preservation,
such as the conditions for making such application, the requirements to the
People’s court when making decisions of the such application, and what the
applicant should do regarding filing such application.
• Strengthened the administrative enforcement of patent protection. For example,
the revisions include increasing the administrative penalty standards from
imposing a fine of no more than three times the unlawful gain to four times to a
person who counterfeits the patent of another person, and a fine of no more than
RMB 50,000 increased to 200,000 which may be imposed on him if there are no
unlawful gains. The 2008 Patent law added provision of the power that the IP
related administrative department has when dealing with patent infringement.
Article 64 provides that “when the administration department for patent-related
work investigates and handles the suspected counterfeiting of a patent, it may,
based on evidence obtained, inquire the parties concerned, and investigate the
circumstances related to the suspected illegal act; it may conduct on-the-spot
revenue is less than RMB 50,000 yuan, a fine of up to RMB 10,000 yuan may be
imposed”. “Where the illegal business revenue is RMB 50,000 yuan or more, a fine of up
to five times the illegal business revenue may be imposed thereon; where there is no
illegal business revenue or the illegal business revenue is less than RMB 50,000 yuan, a
fine of up to RMB 250,000 yuan may be imposed thereon. If a party has committed
trademark infringement on two or more occasions within five years or falls under any
other serious circumstances, it shall be subject to a heavier punishment”. Secondly, the
2013 Trademark law also specified that “an administrative department for industry and
commerce may suspend the investigation and handling of the case if disputes arise over
the ownership of the trademark or if the right holders simultaneously bring a trademark
infringement lawsuit to the people's courts”. (4) Increased the legal compensation for
infringement. The 2013 Trademark law not only provided a clear procedure of how to
decide the amount of compensation that the infringer should pay, but also increased the
amount of compensation from RMB 500,000 yuan in 2000 to RMB 3 million yuan in
2013 if “it is difficult to determine the actual loss suffered by the right holder as a result
of the infringement, the profits gained by the infringer from the infringement or the
royalties of the registered trademark concerned.” Furthermore, if “an infringer
maliciously infringes upon another party's exclusive right to use a trademark and falls
under serious circumstances, the amount of damages may be determined as not less than
one time but not more than three times the amount that is determined according to the
aforesaid methods”. In addition, the 2013 amendment also take “the royalties of the
registered trademark” into consideration when deciding the amount of compensation. (5)
Reduced the burden of right holders to provide evidence. Article 63 provides that “where
the right holder has exhausted its efforts in discharging the obligation of burden of proof,
but the account books and materials related to the infringing acts are mainly controlled by
the infringer, the people's court may, for the purpose of determining the amount of
damages, order the infringer to submit account books and materials related to the
infringing acts”.
• Revised the provision of renewal, transfer and licensing of registered trademarks. (1) The
2013 Trademark law provides that “where a trademark registrant intends to continue
using the registered trademark upon expiry of the validity period of registration, the
trademark registrant shall go through the renewal procedure within 12 months prior to the
expiry date”, while the 2001 Trademark law requires to file “an application for renewal
of the registration shall be made within six months before the expiry date”. (2) The 2013
Trademark law added new provisions regarding when transferring a registered mark, the
trademark registrant shall transfer “other similar trademarks he has registered for the
same kind of goods, and other identical and similar trademarks he has registered for
similar goods” along with it. It also specified that “the trademark licensing shall not be
used against a bona fide third party”.
• In order to reduce the confusion among “revoking a registered trademark”,
“disputes/opposition”, and “declare a registered trademark invalid”, the 2013 amendment
changed Chapter 5 from “Adjudication of disputes concerning registered trademarks” to
“Declaration of the invalidity of registered trademarks”. The 2013 Trademark law not

100
inspection of the places where the suspected illegal act is committed; consult
and duplicate the relevant contracts, invoices, account books and other related
materials; and check the products related to the suspected illegal act and seal or
detain the products that are proved to be produced by the counterfeited patent.”
It also specified the obligations of relevant parties by providing that “when the
administration department for patent-related work performs its duties as
prescribed in the preceding paragraph, the parties concerned shall provide
assistance and cooperation, instead of refusing to do so or creating obstacles.”
only changed “revoke a registered trademark” into “declare the registered trademark
invalid” of all the provisions in Chapter 5, but also added relevant provisions regarding
declaring the registered trademark invalid. For example, article 47 specified that for a
registered trademark that is declared invalid, the exclusive right to use the registered
trademark thereof shall be deemed as non-existent ab initio.
• Specified the activities of trademark agency. Articles 19, 20, and 21 are the new
provisions enacted in 2013 amendment for regulating the activities of trademark agency,
these three articles provided the principles trademark agencies should uphold, the
obligations and certain rules they should follow when conducting their activities. Article
68 is also newly added and provides what punishments the trademark agency will receive
if it committed the acts listed in this article.
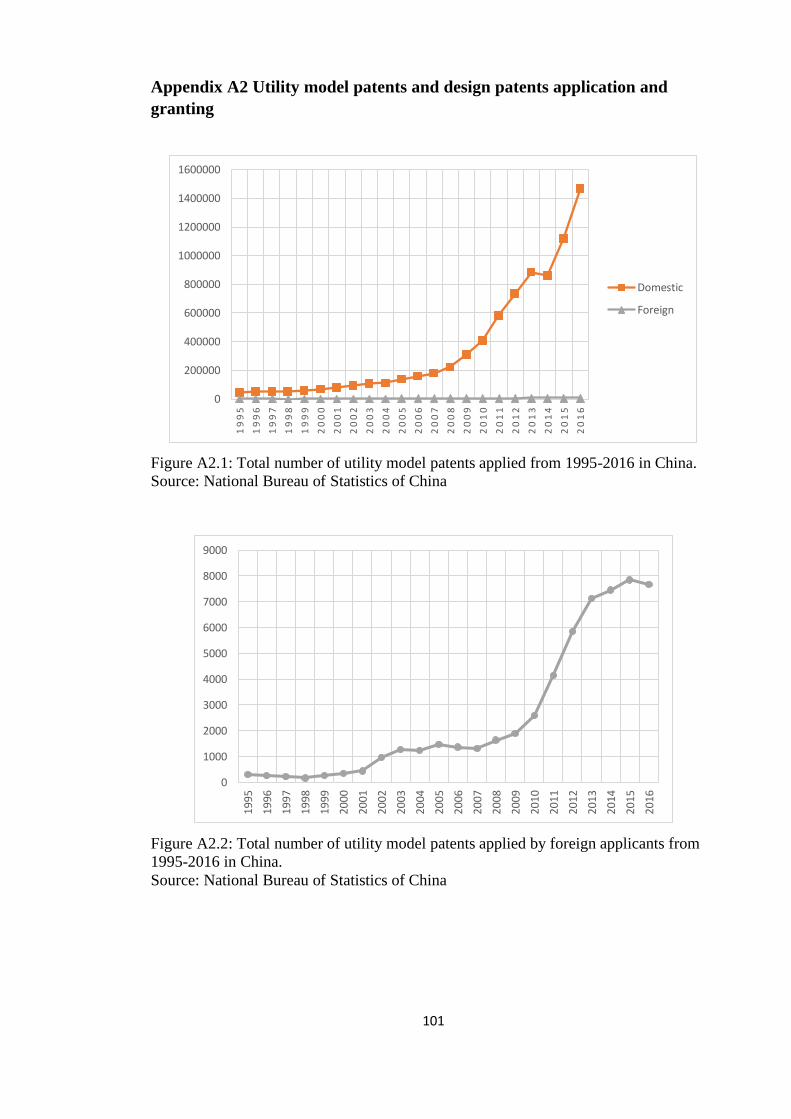
101
Appendix A2 Utility model patents and design patents application and
granting
Figure A2.1: Total number of utility model patents applied from 1995-2016 in China.
Source: National Bureau of Statistics of China
Figure A2.2: Total number of utility model patents applied by foreign applicants from
1995-2016 in China.
Source: National Bureau of Statistics of China
0
200000
400000
600000
800000
1000000
1200000
1400000
1600000
19
95
19
96
19
97
19
98
19
99
20
00
20
01
20
02
20
03
20
04
20
05
20
06
20
07
20
08
20
09
20
10
20
11
20
12
20
13
20
14
20
15
20
16
Domestic
Foreign
0
1000
2000
3000
4000
5000
6000
7000
8000
9000
199
5
199
6
199
7
1998
199
9
200
0
200
1
200
2
200
3
200
4
2005
200
6
200
7
200
8
200
9
201
0
201
1
201
2
201
3
2014
201
5
201
6
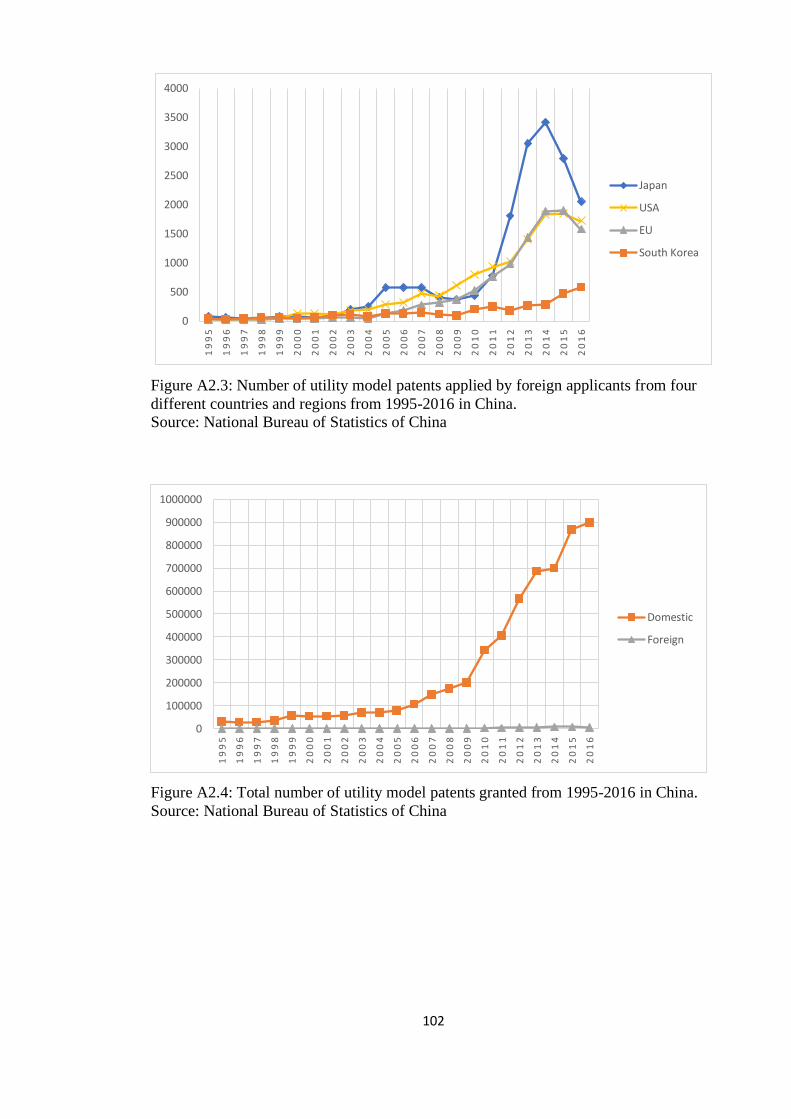
102
Figure A2.3: Number of utility model patents applied by foreign applicants from four
different countries and regions from 1995-2016 in China.
Source: National Bureau of Statistics of China
Figure A2.4: Total number of utility model patents granted from 1995-2016 in China.
Source: National Bureau of Statistics of China
0
500
1000
1500
2000
2500
3000
3500
4000
19
95
19
96
19
97
19
98
19
99
20
00
20
01
20
02
20
03
20
04
20
05
20
06
20
07
20
08
20
09
20
10
20
11
20
12
20
13
20
14
20
15
20
16
Japan
USA
EU
South Korea
0
100000
200000
300000
400000
500000
600000
700000
800000
900000
1000000
19
95
19
96
19
97
19
98
19
99
20
00
20
01
20
02
20
03
20
04
20
05
20
06
20
07
20
08
20
09
20
10
20
11
20
12
20
13
20
14
20
15
20
16
Domestic
Foreign

103
Figure A2.5: Total number of utility model patents granted to foreign applicants from
1995-2016 in China.
Source: National Bureau of Statistics of China
Figure A2.6: Number of utility model patents granted to foreign applicants from four
different countries and regions from 1995-2016 in China.
Source: National Bureau of Statistics of China
0
1000
2000
3000
4000
5000
6000
7000
8000
9000
19
95
19
96
19
97
1998
19
99
20
00
20
01
20
02
20
03
20
04
2005
20
06
20
07
20
08
20
09
20
10
20
11
20
12
20
13
2014
20
15
20
16
0
500
1000
1500
2000
2500
3000
3500
19
95
19
96
19
97
19
98
19
99
20
00
20
01
20
02
20
03
20
04
20
05
20
06
20
07
20
08
20
09
20
10
20
11
20
12
20
13
20
14
20
15
20
16
Japan
USA
EU
South Korea
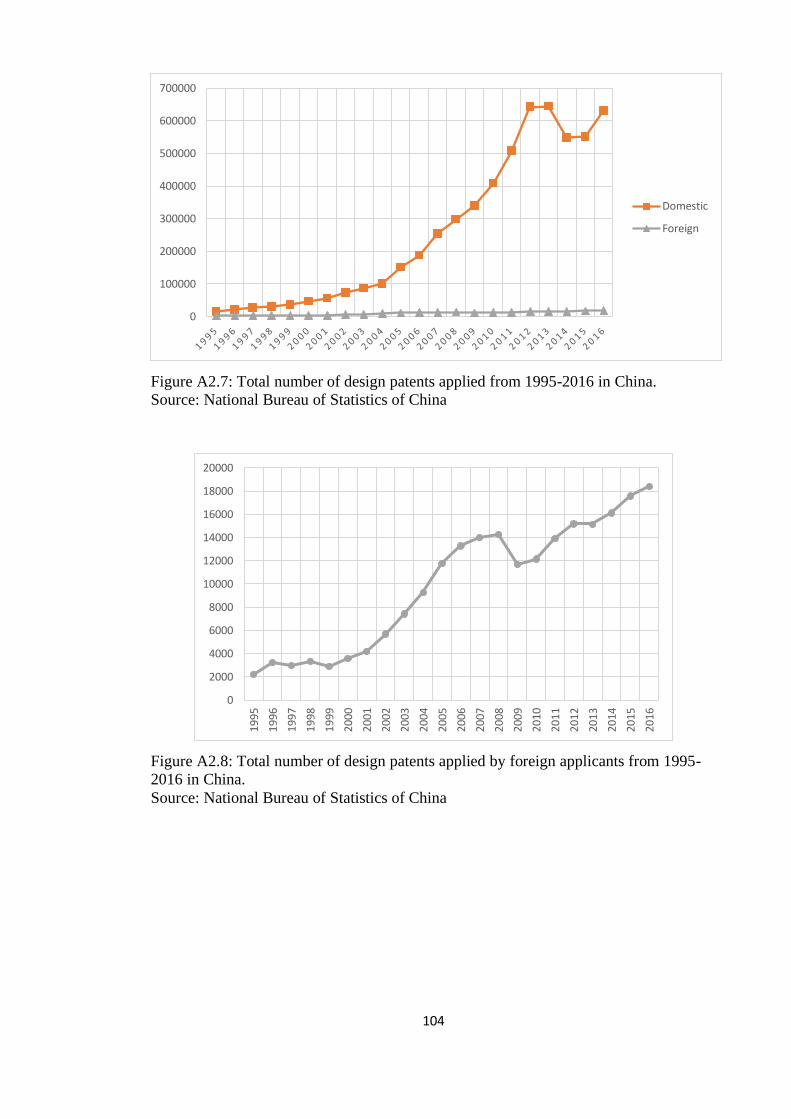
104
Figure A2.7: Total number of design patents applied from 1995-2016 in China.
Source: National Bureau of Statistics of China
Figure A2.8: Total number of design patents applied by foreign applicants from 1995-
2016 in China.
Source: National Bureau of Statistics of China
0
100000
200000
300000
400000
500000
600000
700000
Domestic
Foreign
0
2000
4000
6000
8000
10000
12000
14000
16000
18000
20000
1995
1996
19
97
19
98
19
99
20
00
20
01
20
02
20
03
20
04
20
05
20
06
20
07
20
08
2009
2010
20
11
20
12
20
13
20
14
20
15
20
16
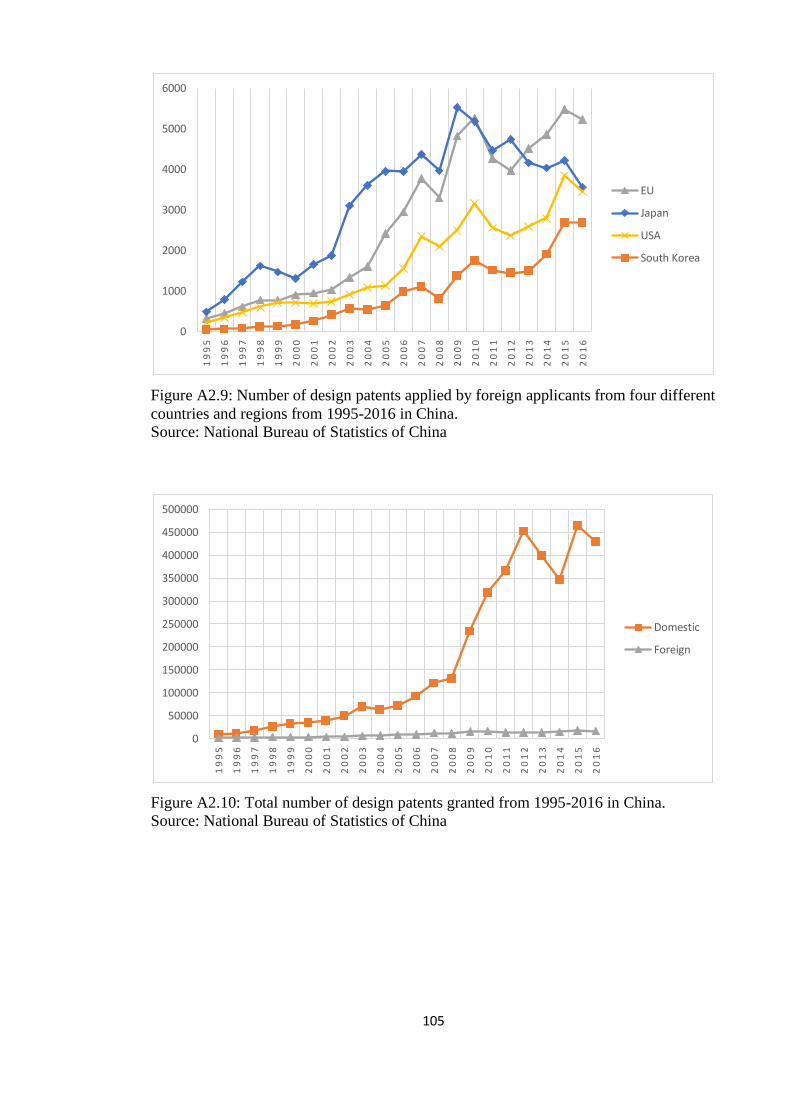
105
Figure A2.9: Number of design patents applied by foreign applicants from four different
countries and regions from 1995-2016 in China.
Source: National Bureau of Statistics of China
Figure A2.10: Total number of design patents granted from 1995-2016 in China.
Source: National Bureau of Statistics of China
0
1000
2000
3000
4000
5000
6000
19
95
19
96
19
97
19
98
19
99
20
00
20
01
20
02
20
03
20
04
20
05
20
06
20
07
20
08
20
09
20
10
20
11
20
12
20
13
20
14
20
15
20
16
EU
Japan
USA
South Korea
0
50000
100000
150000
200000
250000
300000
350000
400000
450000
500000
19
95
19
96
19
97
19
98
19
99
20
00
20
01
20
02
20
03
20
04
20
05
20
06
20
07
20
08
20
09
20
10
20
11
20
12
20
13
20
14
20
15
20
16
Domestic
Foreign

106
Figure A2.11: Total number of design patents granted to foreign applicants from 1995-
2016 in China.
Source: National Bureau of Statistics of China
Figure A2.12: Number of design patents granted to foreign applicants from four
different countries and regions from 1995-2016 in China.
Source: National Bureau of Statistics of China
0
2000
4000
6000
8000
10000
12000
14000
16000
18000
20000
1995
1996
19
97
19
98
19
99
20
00
20
01
20
02
20
03
20
04
20
05
20
06
20
07
20
08
2009
2010
20
11
20
12
20
13
20
14
20
15
20
16
0
1000
2000
3000
4000
5000
6000
7000
19
95
19
96
19
97
19
98
19
99
20
00
20
01
20
02
20
03
20
04
20
05
20
06
20
07
20
08
20
09
20
10
20
11
20
12
20
13
20
14
20
15
20
16
EU
Japan
USA
South Korea

107
Chapter 4: The influence of the institutional environment in
host countries on innovation offshore governance choice and
business outcomes
Abstract
In this paper, we analyse the effect of institutional factors (rule of law and IPR) on
governance choices when offshoring innovation and whether certain business outcomes
are achieved via offshoring innovation activities. Using survey data from the ORN
database, the regression results suggest that different governance modes are preferred in
different institutional environments: offshore outsourcing is preferred when IPR
protection in host countries is strong, while captive mode is more likely to be adopted in
host countries with good quality of rule of law. Further analysis of failure to select the
predicted governance mode shows that failure to select captive mode has positive
impact on firm performance, such as organisational flexibility, firm’s overall
competitiveness, and productivity. However, failure to select outsourcing mode is
negatively related to the probability of achieving outcomes such as focus on core
competencies, access to qualified personnel, organisational flexibility and firm’s overall
competitiveness. We find a negative relationship between the IPR protection strength in
host countries and the probability of focusing on core competencies, and accessing to
qualified personnel; rule of law in host countries is positively related to the probability
of focusing on core competencies, but negatively related to the probability of increasing
firm’s overall competitiveness, service quality, accessing to new markets, and
breakthrough process improvement(s).
4.1 Introduction
Over the past years, multinational companies have adopted different approaches (fully
owned and offshore outsourcing) towards managing their business activities overseas.
Firms within the same industry may adopt varied strategies to develop new products or
technologies. For example, Apple (1976), Microsoft (1975) and Samsung Electronics
(1969) which were all founded at about the same time (Apple, 2018; Microsoft, 2018;

108
Samsung, 2018), have chosen different routes to expand their innovation activities
abroad. Apple and Microsoft established their first overseas research institute in Europe
in 1988 and 1997, respectively, and Samsung Electronics established its first research
institute in US in 1990, and then in Europe in 1996 (Dow Jones News Service, 1988;
Newswire, 2001; PR Newswire, 1996; Korea Economic Weekly, 1990). However,
Microsoft and Samsung also established R&D centres in other countries such as China
and India around early 2000s. Apple established R&D centres offshore only in recent
years (Xinhua News Agency, 1998; The Times of India, 1998; The Korea Herald, 2001;
The Economic Times, 2000; Si, 2016; Vietnam News Summary, 2017). Firms may
adopt both types of governance mode to manage their R&D activities in the same
country, for example, in the pharmaceutical industry, Wuxi Apptec is one of the leading
contract research organisations in China, serving the top 20 pharmaceutical companies
in the world (Wuxi Apptec, 2018). At the same time, most of these top 20
pharmaceutical companies also have established their own R&D centres in China. These
examples raise an important question: why do companies adopt different offshore
governance mode strategies for their R&D activities in different countries and even in
the same country? In order to answer this question, it is important to identify and
evaluate the factors behind offshore governance choices, as well as the factors behind
the achievement of certain business outcomes from offshoring.
Previous studies have identified institutional factors influencing offshore governance
choices for innovation, namely intellectual property rights (IPR) protection strength in
host countries (Oxley, 1999), however, even for offshoring innovation activities, IPR is
not the only institutional factors that can affect a firm’s offshoring decisions
(Hutzschenreuter, et al., 2011; Gooris & Peeters, 2014). The role of rule of law (and
IPR protection strength) in host countries on offshore governance choices, as well as
whether they will affect a firm’s satisfaction regarding offshoring, have not been
analysed extensively and need further analysis, especially for offshoring innovation
activities. Extant literature has also highlighted that firms are able to select their
governance modes based on their purpose of maximising their performance (Shavers,
1998; Brouthers, 2002). Therefore, that it is the alignment between governance and the
prediction of governance based on conceptual framework that affects performance, but
not the direct effect that governance choice has on performance, and this requires
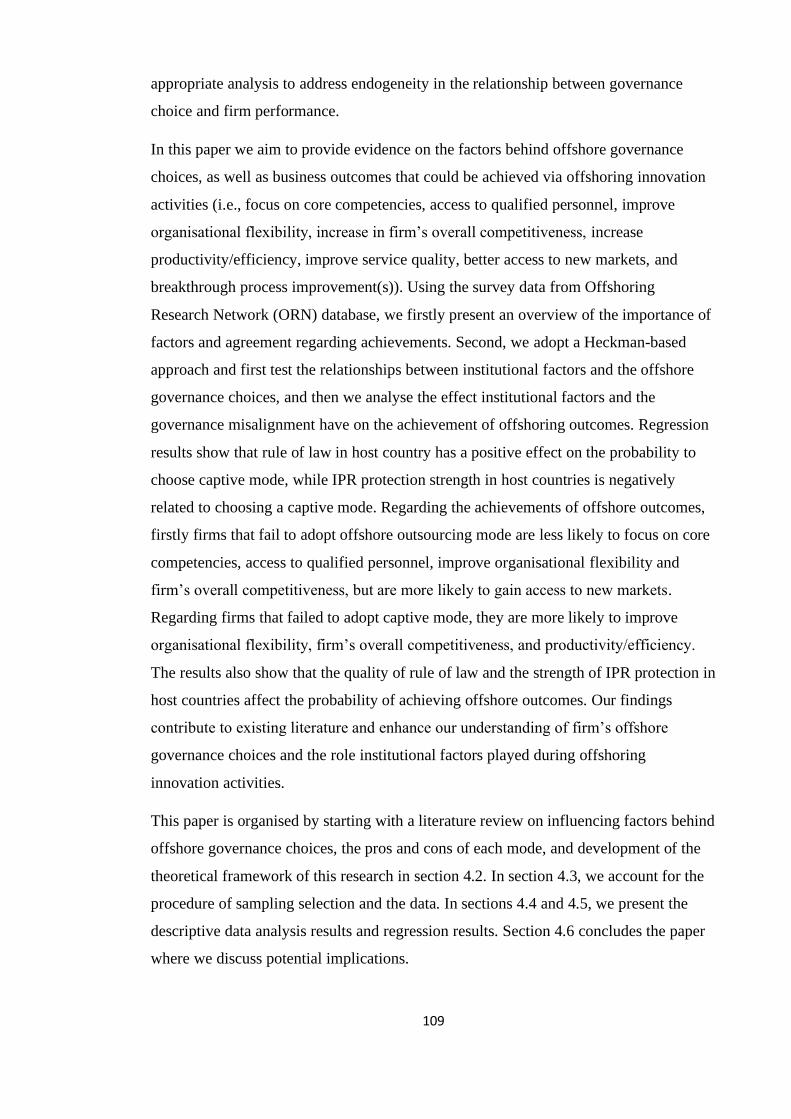
109
appropriate analysis to address endogeneity in the relationship between governance
choice and firm performance.
In this paper we aim to provide evidence on the factors behind offshore governance
choices, as well as business outcomes that could be achieved via offshoring innovation
activities (i.e., focus on core competencies, access to qualified personnel, improve
organisational flexibility, increase in firm’s overall competitiveness, increase
productivity/efficiency, improve service quality, better access to new markets, and
breakthrough process improvement(s)). Using the survey data from Offshoring
Research Network (ORN) database, we firstly present an overview of the importance of
factors and agreement regarding achievements. Second, we adopt a Heckman-based
approach and first test the relationships between institutional factors and the offshore
governance choices, and then we analyse the effect institutional factors and the
governance misalignment have on the achievement of offshoring outcomes. Regression
results show that rule of law in host country has a positive effect on the probability to
choose captive mode, while IPR protection strength in host countries is negatively
related to choosing a captive mode. Regarding the achievements of offshore outcomes,
firstly firms that fail to adopt offshore outsourcing mode are less likely to focus on core
competencies, access to qualified personnel, improve organisational flexibility and
firm’s overall competitiveness, but are more likely to gain access to new markets.
Regarding firms that failed to adopt captive mode, they are more likely to improve
organisational flexibility, firm’s overall competitiveness, and productivity/efficiency.
The results also show that the quality of rule of law and the strength of IPR protection in
host countries affect the probability of achieving offshore outcomes. Our findings
contribute to existing literature and enhance our understanding of firm’s offshore
governance choices and the role institutional factors played during offshoring
innovation activities.
This paper is organised by starting with a literature review on influencing factors behind
offshore governance choices, the pros and cons of each mode, and development of the
theoretical framework of this research in section 4.2. In section 4.3, we account for the
procedure of sampling selection and the data. In sections 4.4 and 4.5, we present the
descriptive data analysis results and regression results. Section 4.6 concludes the paper
where we discuss potential implications.

110
4.2 Offshoring business services and governance choices
The international business (IB) literature has long investigated firms’ international
strategies and operations, and identified three main offshoring governance modes:
dominant equity mode (also referred to as captive offshoring), balanced mode (joint-
ventures), and external governance (offshore outsourcing) (Anderson & Gatignon,
1986). Captive offshoring refers to setting up a wholly owned subsidiary or new unit
abroad in order to fully control its business activities and take advantage of locational
resources (Javalgi, et al., 2009; Kedia & Lahiri, 2007; Lewin & Volberda, 2011).
Offshore outsourcing refers to demand side firms sourcing specific functions and
processes to a third-party (or vendor) in a foreign country, so that it can create value
primarily through low cost (Javalgi, et al., 2009; Manning, et al., 2008). Joint ventures
refers to a situation where an organisation partners with a local company in the host
country, e.g. by forming a new separate company to which they both contribute
resources, or build up equity based collaboration (Luo, et al., 2013; Anderson &
Gatignon, 1986). Lewin and Couto (2007) argue that joint ventures are rarely used for
offshoring, and that the equity holders in these cases can exert influence over the
foreign entity that is similar to that exerted in dominant equity mode. Therefore, the
discussion that follow will focus on the polar modes of captive and outsourcing, and
only captive offshoring and offshore outsourcing will be analysed later in the empirical
section.
With regard to service offshoring, researchers have found a shift of preference of
governance mode choices over time. Lewin and Volberda (2011) stated that captive
offshoring mode was preferred over the outsource mode by firms in early years, but this
has changed more recently, indicating that companies’ preference has been shifted to
the outsource mode regardless of nationality or functions. Due to the important role that
governance mode has played in global sourcing, and also because of increase in number
of service providers, in this section, the factors behind the governance mode decisions
will be discussed, followed by introducing the pros and cons of each type.

111
4.2.1 Factors influencing offshore governance choices
Transaction Cost Economics (TCE) address a central strategic issue, namely the
boundary of the firm, and argues that the attributes of a transaction influence the
governance decision, i.e., whether the transaction should be undertaken inside the firm
or contracted to an external supplier (Jensen & Pedersen, 2012). The focus of TCE
theory is to minimise the combination costs involved in transactions, which refer to the
costs of negotiating a contract, monitoring firm’s performance, and tracking the
performance of the partners which the contract was signed with (Williamson, 1985).
According to the TCE perspective, transactions which require low asset specificity and
for which there is high number of suppliers will occur in the market, while those with
high asset specificity within the hierarchy form (Williamson, 1991). Researchers
suggest that captive mode (within the hierarchy form) can help to avoid the risks
inherent in transferring valuable, firm-specific knowledge to suppliers of the outsourced
services when offshoring innovation activities (Kinkel & Maloca, 2009; Caniato, et al.,
2015). Studies have also stated that captive offshoring provides an opportunity for firms
to reduce overall costs, since wages in host countries normally are lower than in the
home country (Youngdahl & Ramaswamy, 2008), but this is also true for outsourcing.
There is some consensus that the most common reason to adopt offshore outsourcing
mode is cost reduction (Farrell, 2005; Lewin & Couto, 2007). Besides the savings from
labour arbitrage (Gupta, et al., 2007), scholars argue that to offshore outsource some
peripheral activities to suppliers who have more specialised knowledge and expertise in
a given area and may be able to operate on a larger scale, may result in significant cost
advantages for the firm (Hutzschenreuter, et al., 2011). Furthermore, offshore
outsourcing helps reduce fixed investments required by captive operations (Kotabe &
Murray, 2004). However, scholars argue that firms should not only consider the cost
reduction during the process of offshoring. As the scale and scope of business being
offshored gradually grow, they may find that the labour arbitrage advantages, as well as
their core competences may reduce. In addition, lack of organisation capabilities to
coordinate and manage various offshore activities is also typically exposed (Lewin &
Volberda, 2011).
Resource-Based-View (RBV) scholars argue that TCE over-emphasises the cost
minimisation and neglects the value creation aspect of a transaction, while RBV
assumes that firms try to maximise long-run profits through exploiting and developing

112
resources for competitive advantage (Javalgi, et al., 2009). Scholars have claimed that
offshoring decisions are driven by more strategic reasons, such as accessing high-level
human capital, building organisational flexibility, increasing local absorptive capacity,
sourcing of innovation, accessing talent with specialised capabilities around the world
(which directly relates to the decline in young adults selecting S&E careers in the
West), as well as seeking new markets (Lewin, et al., 2009; Massini & Lewin, 2012). It
has been argued that captive offshoring could provide a chance for firms to access
skilled and qualified personnel and resources in host countries, as well as expand and
enter new markets (Kotlarsky & Oshri, 2008).
Some scholars have also stated that offshore outsourcing can offer firms access to new
resources and market knowledge to be integrated into firms’ own knowledge base
(Grimpe & Kaiser, 2010; Bertrand, 2011). With regard to offshoring innovation
activities, several studies have suggested that innovation activities constitute the core of
a firm’s competitive advantage, which is why decisions about these activities require
special strategic considerations. Therefore, a hierarchical governance mode should be
adopted (Lewin, et al., 2009; Barney, 1991; Grant, 1996). Other scholars argue that
some innovation activities (such as R&D and product development) have utilised
offshore outsourcing strategy by using suppliers to develop and deliver particular
technologies for use in the client's (i.e., the outsourcing firm's) new products. However,
suppliers are commonly only involved in part of the development process (Carson, et
al., 2006).
Williamson suggests that “the institutions of governance (firms, markets, hybrids,
bureaus) are embedded in the institutional environment" (Williamson, 1992), and the
institutional environment can affect the exchange costs. Furthermore, resources are
context based, their values depend on the characteristics of the given environment,
because resources also are relatively stickier than their environment, resource changes
and adaptations often lag behind environmental changes (Teece, et al., 1997). As
resource-based advantages tend to be viewed from a particular institutional context,
institutional factors can influence the perceptions and actions of consumers, employees,
and regulators in specific country markets resulting in habitual, historically value-laden
decisions (Oliver, 1997). Therefore, institutional theory should be utilised to analyse the
governance choices. Indeed, from the institutional theory perspective, the legal system
of a country has the potential to affect several economic and social activities, such as
113
business practices, compliance with the law, degree of protection of minority
shareholders, tax regimes, financial market regulations and corporate control
mechanisms (Flores & Aguilera, 2007). Previous studies have shown that the global
expansion of MNCs can be deeply affected by the host country legal system with regard
to the company’s foreign operations (Flores & Aguilera, 2007; Gooris & Peeters, 2016).
The legal system in host country and its enforcement is an important factor that firms
need to consider when they are making offshoring decisions (Javalgi, et al., 2009;
Gooris & Peeters, 2016). Some scholars found that firms often adopt captive mode in
countries with weak legal systems (Kshetri, 2007). With regard to innovation activities
offshoring, studies have argued that offshore outsourcing can increase the risk of
knowledge leakage (Mudambi & Tallman, 2010), as firms may have to share sensitive
information with foreign suppliers. This is a particularly serious issue when it comes to
offshore outsourcing innovation activities, because intellectual property (IP) leakage can
erode firm’s competitive advantages (Hutzschenreuter, et al., 2011). Researchers also
demonstrated that home-host country’ cultural distance influences the governance
choices in service offshoring, and that firms are more likely to adopt captive mode to
respond to internal uncertainties caused by geographic and cultural distance (Gooris &
Peeters, 2014; Hutzschenreuter, et al., 2011).
Finally, firm characteristics and capabilities have been identified as significant in firms’
boundary decisions (Leiblein & Miller, 2003). Scholars have found that both the
sourcing history of the firm and technological context significantly influence the
governance choices (Hutzschenreuter, et al., 2011; Steensma & Fairbank, 1999;
Manning, et al., 2018). In addition, firm size can affect offshoring decisions, and some
scholars also argue that the size of the company can affect the governance choices, as
captive offshoring requires the investments of more capital and resources, it is more
likely to be the major mode for larger companies (Hutzschenreuter, et al., 2011).
However, there is contradicting evidence on the role firm size has on governance
choices as Roza and colleagues find that the choices of governance mode are not
affected by firm size (Roza, et al., 2011).
In summary, the discussion above shows that TCE and RBV complement each other to
analyse the governance choice together with its underlying motives of cost efficiency
and value creation (Meyer, et al., 2009), and that institutional environments affect the
performance of both TCE and RBV. Studies have also suggested that firms are required

114
to adopt a suitable governance mode that is in line with firm’s resources, transaction
characteristics, and local context (Leiblein, et al., 2002; Brouthers, 2002; Mudambi &
Tallman, 2010). Therefore, the conceptual framework of this paper is shown in Figure
4.1.
Figure 4.1: Conceptual framework.
4.2.2 The pros and cons of different offshore governance modes
In the previous section we discussed the choices of both types of offshore governance
mode and how they are affected by different influencing factors. Studies have also
identified several outcomes regarding the offshore governance choices, which we
discuss in this section.
First, with regard to the benefits of offshore outsourcing mode, scholars argue that by
offshore outsourcing peripheral activities, they can free limited resources and give
companies a chance to focus more on their core businesses (Quinn & Hilmer, 1994;
Javalgi, et al., 2009). Second, if some of the business processes or functions have been
offshore outsourced, potential risks could be shared with suppliers, the focal firm’s
presence in overseas markets may increase, and perhaps most important, the offshoring
firm’s flexibility can also be enhanced through cooperation with suppliers (Bertrand,
2011; Kedia & Lahiri, 2007; Contractor, et al., 2010). Third, offshore outsourcing parts
of new product development activities to foreign suppliers, can increase product variety
Offshore governance mode
Captive offshoring Offshore outsourcing
Transaction cost economics (Williamson, 1985; Coase, 1937)
Transaction cost
minimisation
Degree of asset specificity
Transaction uncertainty (e.g., external environment)
Access to talent pools
Access to new market
Building organisational flexibility
Increase speed to market
Previous offshoring experiences
Resource-based view (Barney, 1991; Penrose, 1959)
Institutional theory(North, 1990; Scott, 1995)
Rule of law in host countries
IPRs protection in host countries
Culture and languageAvailability of suppliers
115
and speed up the introduction of innovative products (Griffith, et al., 2009). Fourth,
researchers argue that offshore outsourcing can improve a firm’s innovation
performance by cooperating with suppliers (Griffith, et al., 2009), but some researchers
have found empirical support that captive offshoring has a stronger positive impact on
innovation outcomes than offshore outsourcing (Nieto & Rodríguez, 2011; Jensen,
2009).
Offshore outsourcing innovation activities may lead to the risk of loss of competitive
edge and increase dependency on providers (Paju, 2007). Excessive offshore
outsourcing of advanced activities (such as R&D) may hollow out firms’ competitive
bases, since over-dependency on suppliers can cause firms to lose their capacities to
respond to emerging new technologies in the medium to long term – which could erode
their innovation capabilities (Grimpe & Kaiser, 2010; Kotabe, et al., 2008; Paju, 2007).
Furthermore, over-dependency on suppliers may also lead to a loss of control, and
opens the door to opportunism and abuse (Quinn & Hilmer, 1994).
With regard to the benefits of captive offshoring mode, a captive offshoring mode
enables firms to leverage learning and knowledge from various nodes within the
network to elevate the overall capabilities of the organisation (Youngdahl &
Ramaswamy, 2008). Researchers argue that captive offshoring can let firms gain
experience of local labour market, specific laws, cultural values and behavioural
patterns, as well as skilled and qualified personnel, which may become the basis for
future growth in host country as well as home country (Hutzschenreuter, et al., 2011;
Kotlarsky & Oshri, 2008).
4.2.3 Contribution to the literature and research questions
Much research has been performed regarding the choice of offshore governance mode,
but most studies have only focused on a few selected factors. Even though the
importance of institutional factors on offshore governance mode choices has been
recognised by scholars (Flores & Aguilera, 2007; Javalgi, et al., 2009; Oxley, 1999;
Hutzschenreuter, et al., 2011), very few studies have comprehensively researched the
effect institutional factors have on offshore governance mode choices, in particular, it
remains unclear whether the quality of rule of law in host countries affects firm’s
choices. Furthermore, studies have stated that both captive offshoring and offshore

116
outsourcing increase the risk of IP losses, which may be caused by weak IPR protection
in the host country (Razzaque & Sheng, 1998; Griffith, et al., 2009). It is also not clear
whether a firm’s concern about the IPR regime in host countries and the IPR protection
strength in host countries will affect governance mode decisions.
Studies have found that the institutional environment (including quality of legal system
and IPR protection strength) in host country has impacts on firm performance (Peng,
2004; Chadee & Roxas, 2013; Bardhan & Jaffee, 2005). However, it is not clear
whether the institutional environment in the host country will affect the achievements of
certain offshore outcomes. It can be noted from the literature that it is the alignment
between firm’s governance choice and the recommendation of the theories which are
normally used to study governance choices (e.g., TCE, transaction cost entry mode
theory, RBV, etc.) that impact on firm performance (Brouthers, 2002; Shavers, 1998).
However, those studies are not specifically focused on offshoring innovation activities
for which firm’s knowledge is particularly important. In this paper, we test the
relationships between institutional factors in the host country (rule of law and IPR
protection strength) and the offshore governance choices, and the effects governance
misalignment and the institutional factors have on the achievement of offshore
outcomes. In short, the research questions of this paper are:
1. Do institutions such as rule of law and IPR regime in host countries affect a
firm’s offshore governance choices when offshoring innovation activities?
2. Do governance misalignment and institutions affect achieving business
outcomes when offshoring innovation activities?
4.3 Data
The data used in this paper comes from the ORN database. ORN was launched in 2004
at Duke University Centre for International Business Education and Research (CIBER),
The Fuqua School of Business (Lewin, et al., 2009). It comprises international and
longitudinal survey (conducted at 2005, 2006, 2007, 2009, and 2011) among companies
and is focussed on surveying offshore project implementations. This has resulted in a
database available to academics to analyse the dynamics across various administrative
and technical functions located in a wide range of countries or regions of the world,
across industries, and across types of delivery model (captive, third party or hybrid)
117
(Lewin, et al., 2009). Data in the ORN is collected by academic partners in various
countries, predominantly the United States, Australia, and European countries. This data
differs from typical collection sets by focussing on specific offshore implementations,
instead of general experience of responding companies. The ORN treats each offshored
operation, and the year it was offshored, as a separate observation, which means that the
individual offshoring initiative is the unit of analysis and a single company may appear
as multiple unique entries in the data set (Lewin, et al., 2009).
The functions firms offshored are categorised into 13 different types in the ORN
database, namely analytical/knowledge services, call centre/customer contact,
engineering services, finance/accounting, human resources, IT infrastructure, legal
services, marketing and sales, product design, research and development, software
development, supply chain and facilities, and a category “others”. In this paper, we
select product design, research and development, software development, and
engineering services to represent innovation functions. The remaining functions are
included in the analysis as “other business services”.
There are 513 implementations in our sample which includes data in survey years 2007,
2009 and 2011, 202 implementations are about innovation functions84. Tables 4.1 and
4.2 show the number of implementations of both captive and outsourcing mode in
different locations (Table 4.1) and in different industries (Table 4.2) in our sample. It
can be noted that offshore outsourcing mode is slightly preferred for offshoring both
business services and innovation functions. It can also be noted that the choices of
governance mode are varied among different locations firms choose to offshore. The
proportion of implementations that adopt captive governance mode is higher than the
ones that adopt offshore outsourcing mode for firms that have offshored business
services and innovation functions to China, Western developed countries and Far East
developed countries (Australia, Japan, Korea, Singapore), while the situation is the
opposite for the activities offshored to India, South East Asia (Philippine and Malaysia),
Eastern Europe85 (Poland, Russia, Slovakia, Ukraine), and Latin America (Argentina,
Brazil, Colombia, Mexico), where the offshore outsourcing mode is preferred.
84 The headquarters of all the firms in our sample are located in Europe and United States.
85 The proportion of implementations that adopt both types of governance mode is almost evenly
distributed when all business functions are considered, while the share of implementations with offshore
outsourcing mode is higher than the ones that adopt offshore outsourcing mode for firms that have
offshored innovation functions.

118
Differences also exist by industry, Table 4.2 shows that firms that operate in
Financial/insurance/banking services, Professional services, and Software and
programming/business/IT services/telecommunication/electronics industries prefer
outsourcing when offshoring any functions in our sample, while captive offshoring
mode is chosen by a higher proportion of firms which in
Health/biotech/pharma/chemical, Manufacturing (the captive offshoring mode is only
slightly preferred when offshoring innovation functions), and High tech and technical
services industries.
Table 4.1: Number of implementations of each governance mode regarding different
functions by location.
Country
All business services Innovation functions
Outsourcing Captive Total Outsourcing Captive Total
China No. 27 45 72 17 21 38
% 37.5% 62.5%
44.7% 55.3%
India No. 126 65 191 58 28 86
% 66.0% 34.0%
67.4% 32.6%
Western developed
countries
No. 30 49 79 14 19 33
% 38.0% 62.0% 42.4% 57.6%
South East Asia No. 41 24 65 6 5 11
% 63.1% 36.9%
54.5% 45.5%
Far East developed
countries
No. 5 13 18 1 2 3
% 27.8% 72.2%
33.3% 66.7%
Eastern Europe No. 22 21 43 13 9 22
% 51.2% 48.8%
59.1% 40.9%
Latin America No. 36 9 45 8 1 9
% 80.0% 20.0%
88.9% 11.1%
Total No. 287 226 513 117 85 202
% 56.0% 44.0% 57.9% 42.1%
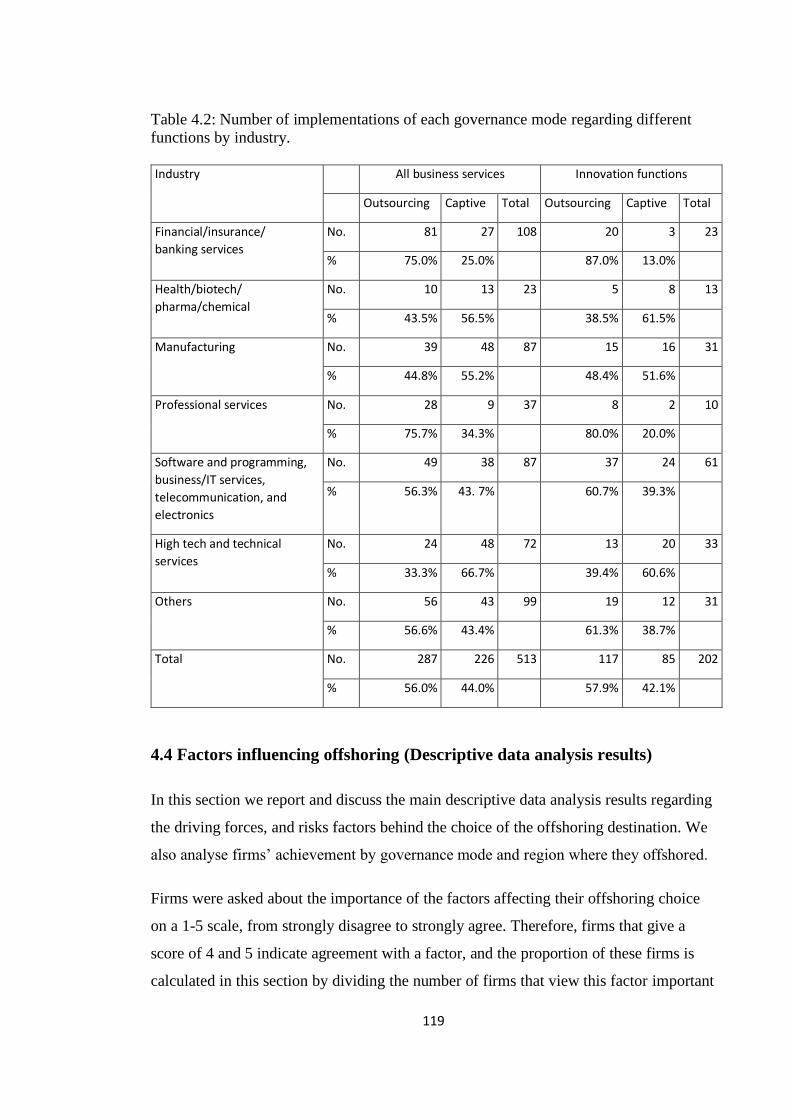
119
Table 4.2: Number of implementations of each governance mode regarding different
functions by industry.
Industry
All business services Innovation functions
Outsourcing Captive Total Outsourcing Captive Total
Financial/insurance/
banking services
No. 81 27 108 20 3 23
% 75.0% 25.0%
87.0% 13.0%
Health/biotech/
pharma/chemical
No. 10 13 23 5 8 13
% 43.5% 56.5%
38.5% 61.5%
Manufacturing No. 39 48 87 15 16 31
% 44.8% 55.2%
48.4% 51.6%
Professional services No. 28 9 37 8 2 10
% 75.7% 34.3%
80.0% 20.0%
Software and programming,
business/IT services,
telecommunication, and
electronics
No. 49 38 87 37 24 61
% 56.3% 43. 7%
60.7% 39.3%
High tech and technical
services
No. 24 48 72 13 20 33
% 33.3% 66.7%
39.4% 60.6%
Others No. 56 43 99 19 12 31
% 56.6% 43.4% 61.3% 38.7%
Total No. 287 226 513 117 85 202
% 56.0% 44.0% 57.9% 42.1%
4.4 Factors influencing offshoring (Descriptive data analysis results)
In this section we report and discuss the main descriptive data analysis results regarding
the driving forces, and risks factors behind the choice of the offshoring destination. We
also analyse firms’ achievement by governance mode and region where they offshored.
Firms were asked about the importance of the factors affecting their offshoring choice
on a 1-5 scale, from strongly disagree to strongly agree. Therefore, firms that give a
score of 4 and 5 indicate agreement with a factor, and the proportion of these firms is
calculated in this section by dividing the number of firms that view this factor important
120
with the total number of firms that answered this question. We compare firms’
preferences for these factors by offshoring locations, different functions, and the
different governance modes.
4.4.1 Factors driving offshoring
Figure 4.2 shows firms’ responses to the importance of the driving factors behind
different types of offshoring activities (other business services and innovation activities)
with different offshore governance modes (captive and offshore outsourcing) in
different locations (China, India, and developed countries). It can be noted that different
governance modes are adopted by firms that have offshored to different regions with
diverse offshoring activities, and they have varied preferences for different driving
factors over the time period of analysis.
There is a higher share of firms with offshore outsourcing mode that offshore both types
of activities to almost all these locations that view “labour cost savings” and “other cost
savings” as important than the share of firms with captive mode. The proportion of
firms with offshore outsourcing mode that offshore both types of activities to India and
developed countries that view “growth strategy” as an important factor is higher than
the proportion of firms with captive mode. However, the share of firms that offshored
innovation activities to China with offshore outsourcing mode almost equals the share
of firms with captive mode, and there is a higher share of firms with captive mode that
offshored other business services to China that view this factor important than the share
of firms with offshore outsourcing mode doing so.
Regarding “access to qualified personnel”, there is a higher proportion of firms with
offshore outsourcing mode that offshored innovation activities to all three locations that
view this factor important than the proportion of firms with captive mode that do so.
When considering offshoring other business services, the share of firms with offshore
outsourcing mode that rate this factor important is higher for firms choosing captive
mode in developed countries, while the opposite happens for firms that offshored to
China. There is a higher share of firms outsourcing both types of business activities to
all three locations that view “increase speed to market” important than the share of firms
with captive mode. However, the share of firms that offshore innovation activities to
China with captive operations that view this factor as an important driving force is

121
slightly higher than the share of firms outsourcing. For firms that view offshoring a
“part of a global strategy”, the share of firms choosing captive mode is higher than the
share of firms choosing outsourcing. If firms are driven by “competitive pressure”, the
proportion of firms with captive mode is higher than the proportion of firms outsourcing
both types of activities to China and India.
Figure 4.2: Firms’ preference for driving factors behind offshoring decision of
innovation and other business services, by different governance mode in varied
locations.
0% 20% 40% 60% 80% 100%0% 20% 40% 60% 80% 100%
Exploit location-specific advantages
Increasing speed to market
Part of a global strategy
Access to new markets forproducts and services
Accepted industry practice
Competitive pressure(e.g., competitors' margin)
Need to improve service levels
Domestic shortage ofqualified personnel
Access to qualified personneloffshore
Growth strategy
Other cost savings
Labor cost savings
Enhancing efficiency throughbusiness process redesign
1234
1234
1234
1234
1234
1234
1234
1234
1234
1234
1234
1234
1234
Innovation Other business services
Captive mode
Offshore outsourcing
1: All countries 2: China 3: India 4: Developed countries
“What is the importance of each of the following drivers in considering offshoring this function?”1234
1234
1234
1234
1234
1234
1234
1234
1234
1234
1234
1234
1234
122
4.4.2 Risk factors affecting offshoring
Figure 4.3 shows firms’ responses to the importance of selected risk factors among
different types of offshoring activities (all business services and innovation activities)
with different offshore governance modes (captive and offshore outsourcing) in
different locations. It can be noted that there is a higher proportion of firms that adopted
offshore outsourcing mode that are concerned about data security, service quality,
operational efficiency, cultural differences with employees in offshore location, political
instability in offshore location, lack of IPR protection, and legal/contractual risks when
offshoring business services and innovation functions to all three regions. With regard
to captive mode, there is a higher share of firms that offshored innovation functions to
the three regions that are concerned about a lack of acceptance from customers, while
firms that offshored other business services to all three regions are more concerned
about a loss of managerial control. The share of firms that offshored other business
services and innovation functions to China and India that view the risk factor “high
employee turnover” as important is higher than the share with offshore outsourcing
mode doing so. In addition, there is a higher proportion of firms that offshored
innovation functions with captive mode to China and India that are concerned about
“Increasing difficulty in finding qualified personnel” than the proportion of firms with
outsourcing.
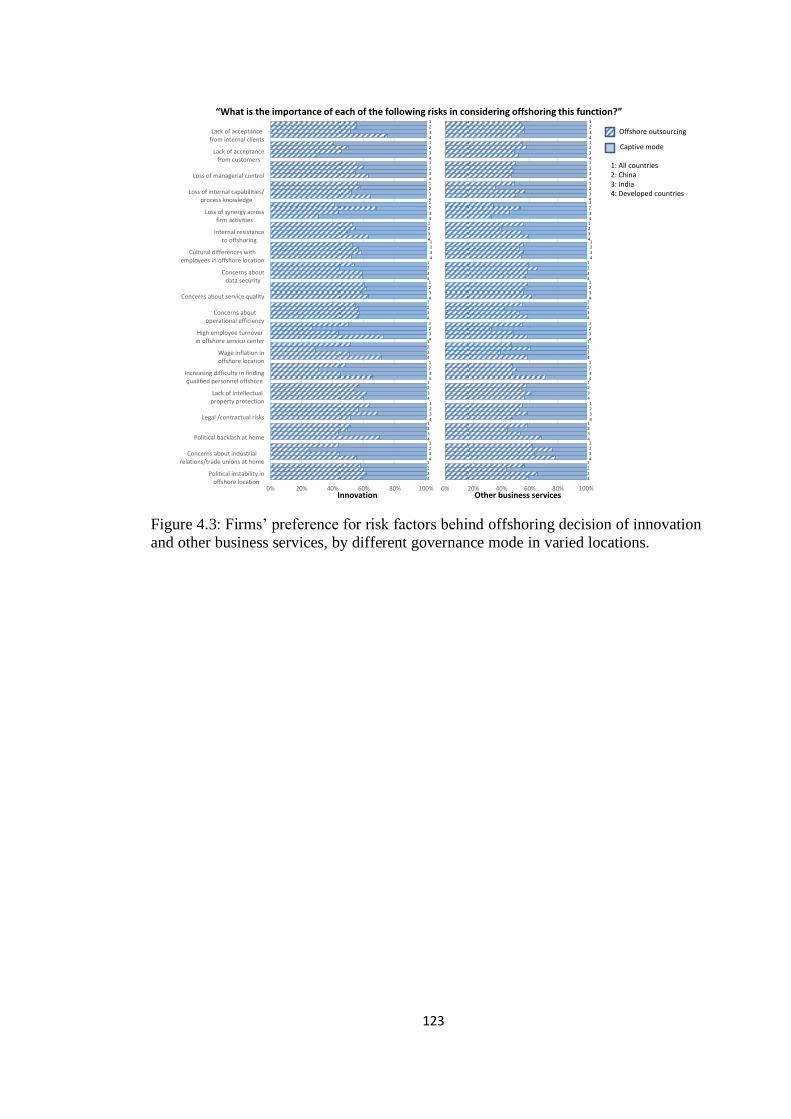
123
Figure 4.3: Firms’ preference for risk factors behind offshoring decision of innovation
and other business services, by different governance mode in varied locations.
0% 20% 40% 60% 80% 100%0% 20% 40% 60% 80% 100%
Political instability inoffshore location
Concerns about industrialrelations/trade unions at home
Political backlash at home
Legal /contractual risks
Lack of intellectualproperty protection
Increasing difficulty in findingqualified personnel offshore
Wage inflation inoffshore location
High employee turnoverin offshore service center
Concerns aboutoperational efficiency
Concerns about service quality
Concerns aboutdata security
Cultural differences withemployees in offshore location
Internal resistanceto offshoring
Loss of synergy acrossfirm activities
Loss of internal capabilities/process knowledge
Loss of managerial control
Lack of acceptancefrom customers
Lack of acceptancefrom internal clients
Innovation Other business services
12341234
1234
1234
123412341234
12341234
12341234
12341234
1234
1234
12341234
1234
“What is the importance of each of the following risks in considering offshoring this function?”12341234
1234
1234
123412341234
12341234
12341234
12341234
1234
1234
12341234
1234
Captive mode
Offshore outsourcing
1: All countries 2: China 3: India 4: Developed countries

124
4.4.3 Outcomes achieved via offshoring
The ORN survey also asks about outcomes of offshoring, such as “increased
productivity/efficiency”, “better focus on core competencies”, “better access to qualified
personnel”, “improved organisational flexibility”, “improved service quality”, “better
access to new market”, “breakthrough process improvement(s)”, and “increase in firm’s
overall competitiveness”. Figure 4.4 reports the proportion of firms by different
governance mode, who agreed that the different outcomes have been achieved. It can be
noted that “better focus on core competencies”, “improve organisational flexibility” and
“better access to qualified personnel” are the most important outcomes agreed by firms
with an outsourcing mode that offshored innovation functions to all three regions is
higher than the share of firms with captive mode. “Improved service quality” is
achieved by a higher share of firms with captive mode that offshored innovation and
other business services to all three regions, except for firms that offshored other
business services to China. Regarding the outcome “increased productivity/efficiency”,
the proportion of firms that offshore innovation function to China and India with captive
mode and achieved this outcome is higher than the proportion among firms with
outsourcing mode. However, the result is the opposite for firms that offshored other
business services to China. “Increase in firm's overall competitiveness” is another
outcome achieved by many firms, and it can be noted that the share of firms with
captive mode that offshore innovation functions to India and developed countries
achieving this is higher than the share of firms outsourcing, while firms that offshored
to China indicate the opposite. For firms that offshored other business services to all
three regions, the share of firms with captive mode is higher than the share of firms
outsourcing. A higher share of firms that offshore outsourced innovation functions to
China and India achieved outcome of “better access to new market”, while the
proportion is higher for firms with captive mode that offshored other business services
to all three regions. “Breakthrough process improvement(s)” is achieved by a higher
proportion of firms that offshore outsourced innovation functions to China and
developed countries, and the share of firms that offshore outsourced other business
services to developed countries that achieved this outcome is higher than among firms
that offshored to China and India.
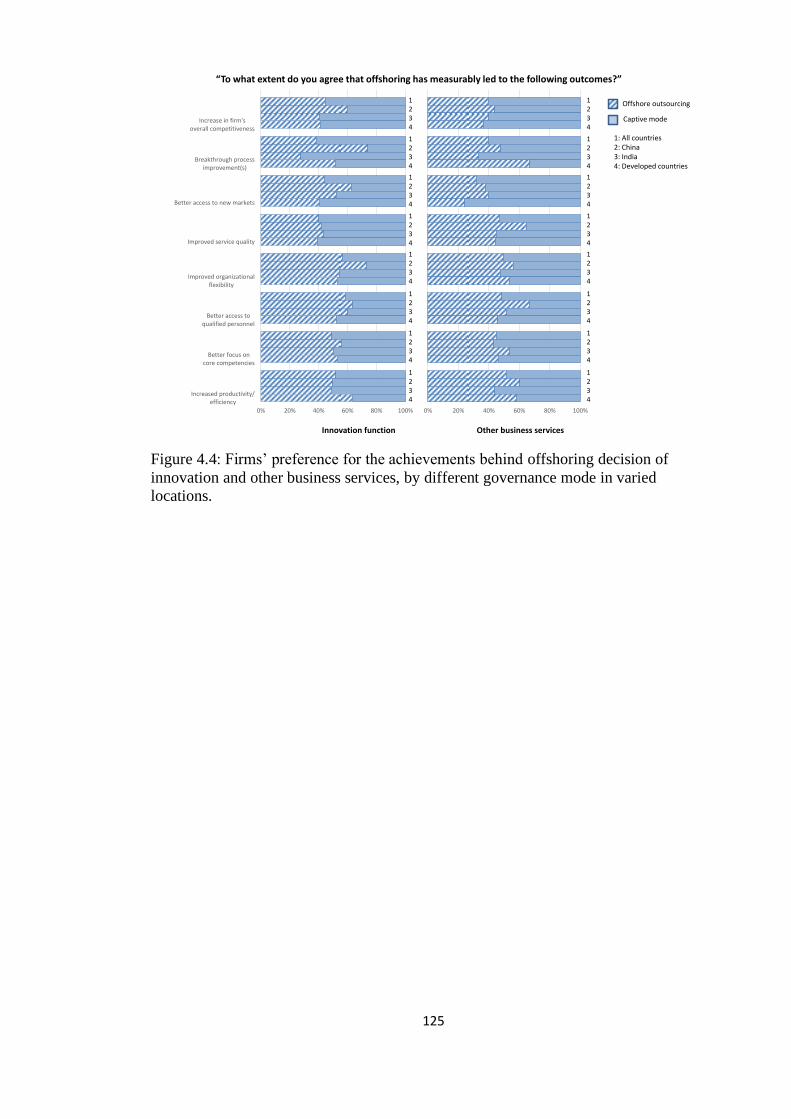
125
Figure 4.4: Firms’ preference for the achievements behind offshoring decision of
innovation and other business services, by different governance mode in varied
locations.
0% 20% 40% 60% 80% 100%
Increased productivity/efficiency
Better focus oncore competencies
Better access toqualified personnel
Improved organizationalflexibility
Improved service quality
Better access to new markets
Breakthrough processimprovement(s)
Increase in firm'soverall competitiveness
Innovation function Other business services
“To what extent do you agree that offshoring has measurably led to the following outcomes?”
1234
1234
1234
1234
1234
1234
1234
1234
0% 20% 40% 60% 80% 100%
1234
1234
1234
1234
1234
1234
1234
1234
Captive mode
Offshore outsourcing
1: All countries 2: China 3: India 4: Developed countries

126
4.5 Regression results
From the discussion above, it can be noted that there is heterogeneity in the driving
factors, perception of risks, and outcome by offshoring mode, business function and
location. In this section, we focus on firms that offshored innovation functions, and the
ORN survey has categorised all the functions that firms have offshored to other
countries into 12 different types of functions86. We selected firms that offshored
software development, product design, engineering services, and R&D functions as the
ones that offshored innovation activities. We analyse the relationships between
influencing factors and offshoring outcomes; in particular, we test the role of
institutional factors in these relationships, i.e., IPR protection strength and the rule of
law in host countries, and whether governance misalignment could affect the probability
to achieve certain outcomes.
Previous studies have indicated that expectations of future performance are what drives
firms to select an offshoring governance mode. This, in turn, results in a form of self-
selection bias where the observed level of performance depends on unobserved factors
that influence the firms’ governance choices. In addition, there is a potential for
endogeneity problems to affect results when using governance mode as the explicative
variable of firm performance, as the former is also affected by the expected level of the
latter (Shavers, 1998; Brouthers, 2002). In this paper, we follow Elia et al. (2014),
Leiblein et al. (2002) and Shaver (1998), and adopt a two-stage approach as described
by Heckman (Heckman, 1979) to control for the potential endogeneity problem arising
from the self-selection bias.
In the first stage, we estimate a probit model in which the governance mode
(outsourcing versus captive) is the dependent variable, and it is regressed against a set
of variables capturing influencing factors behind offshore governance choices. The first
stage allows us to calculate the inverse Mills ratio λ (as in Leiblein et al., 2002 and Elia
et al., 2014), to be used as a control variable in the second stage, thus providing
consistent and unbiased coefficients (Greene, 1997). The first stage is also employed to
estimate the misalignment between the governance mode predicted by the model and
86 The 12 functions include: Call Center/Customer contact, Engineering Services, Finance/Accounting,
Human Resources, IT Infrastructure, Legal Services, Marketing and Sales, Product Design, Research and
Development, Software Development, Supply Chain and Facilities, and Other.

127
the one actually adopted by each firm in our sample by comparing the estimated
governance choice and the actual governance choice.
In the second stage, we adopted an ordered probit model to estimate the performance by
including the governance choice, the inverse Mills ratio, the governance misalignment,
and the institutional factors (i.e., rule of law and quality of IPR protection in host
countries). In the following sections, we present the models and the variables employed
in the two stages.
4.5.1 First stage: governance choice
4.5.1.1 Dependent variables
The ORN survey categorised the service model of the implementation offshored to host
countries as offshore outsourcing mode and captive mode. We build a binary variable
“governance mode” that take value “1” if captive mode is chosen and value “0” if
offshore outsourcing mode is chosen. This is our dependent variable “captive_mode”.
4.5.1.2 Explanatory variables
This paper aims to test the relationships between firm’s concerns about IPR in host
countries and firm’s offshore governance choices, as well as the relationships between
the institutional factors (rule of law and IPR protection strength) in host countries and
firm’s governance choices. The variable regarding concern about risk of IP loss is
obtained from the ORN survey, firms are asked of their degree of agreement regarding
the importance of each risk factors, “risk_iploss” represents concern about lack of
intellectual property protection. The original score ranged from 1 (strongly disagree) to
5 (strongly agree). In order to test the role of the quality of rule of law in host countries,
we used the International Property Rights Index (IPRI) as developed by Property Rights
Alliance as a proxy for measuring the quality of host country’s legal system, and we
calculated the average score 3 years prior to the survey year. This variable measures the
protection strength of property rights of a country from three aspects (and each aspect is
constituted by 3-4 sub-aspects): country’s Legal and Political environment (LP: judicial
independence, rule of law, political stability, and control of corruption), Physical
Property Rights (PPR: protection of physical property rights, registering property, and

128
access to loans) and Intellectual Property Rights (IPR: protection of intellectual property
rights, patent protection, and copyright piracy).
The United States Trade Representative’s Special 301 report87 is adopted to indicate the
IPR protection strength of host countries (Zhao, 2006). The strength of IPR protection is
weighted by whether the host country is on the Special 301 Watch list 3 years before the
survey year. If a host country is on the Priority Foreign Country List or under Section
306 Monitoring88, the IPR protection strength is assigned value -3. If host country is on
the Priority Watch List, it is assigned value -2, and if the country is on the Watch List, it
is assigned value -1. If a host country does not appear in the US Special 301 report, the
IPR protection strength is assigned value 0. We calculate the average value of 3 years
IPR protection strength before the survey year of each host country, and this is the
variable included in the analysis as “host_ipr”. Therefore, “risk_iploss”, “host_ipri”,
and “host_ipr” are adopted to be the explanatory variables.
4.5.1.3 Control variables
We include factors which are identified from previous studies that can affect the choice
of offshore governance mode in the control variables, such as cost reduction, access to
talent, firm size, and characteristics of host countries (e.g., number of R&D
researchers). Cost reduction is the typical reason to drive firms offshore, and is
especially important for offshore outsourcing (Farrell, 2005; Lewin & Couto, 2007).
Therefore, “driv_cost” is adopted to be the control variables by calculating the mean
value of driving factors “labour cost savings” and “other cost savings” in the ORN
survey. Offshoring decisions are driven by strategic reasons, which include access to
talent, market seeking, increasing competitive pressure in the global market, and
increase time-to-market for new products (Holcomb & Hitt, 2007; Massini & Lewin,
2012; Kotlarsky & Oshri, 2008). “driv_aqp”, “driv_newmark”, “driv_globstr”, and
“driv_speed2m” are therefore also used as the control variables. Size of the company
can affect the choices of the governance mode (Hutzschenreuter, et al., 2011), so firm
size is considered to be a control variable (emp_world), and the number of employees is
also log transformed and used to represent the firm size in this paper.
87 Special 301 report “reflects the outcome of a Congressionally-mandated annual review of the global
state of intellectual property rights (IPR) protection and enforcement” (USTR, 1997). 88 “This means that USTR will be in a position to move directly to trade sanctions if there is slippage in
the country’s enforcement of bilateral IPR agreements” (USTR, 1997).

129
Firms prefer to locate business activities to countries with similar culture as in the home
country (Bunyaratavej, et al., 2007), we include cultural distance to be another control
variable, which is calculated by using the Kogut and Singh (1988) index to the items
provided by Hofstede (2001). Finally, the ORN survey data reveals differences of the
choice of governance modes across countries and industries, which are also controlled
in the regressions by using 6 country dummies (host_country_dummy) and 6 industry
dummies (industry_dummy). Detailed variable descriptions are shown in Table 4.3.
Table 4.3: Variable description (first stage)
Variable name Value Data source
Dependent
variable
captive_mode 1 = captive mode; 0 = offshore outsourcing mode ORN survey
Explanatory
variables
host_ipri Reflects each country’s Legal and Political environment (LP:
judicial independence, rule of law, political stability, and control
of corruption), Physical Property Rights (PPR: protection of
physical property rights, registering property, and access to
loans) and Intellectual Property Rights (IPR: protection of
intellectual property rights, patent protection, and copyright
piracy). The overall grading scale of IPRI ranges from 0
(representing non-existence of secure property rights in a
country) to 10 (representing the strongest level of property
rights protection).
IPRI index by
Property
Rights
Alliance
host_ipr 0 = not on the list; -1 = on the watch list; -2 = on the priority
watch list; -3 = on the priority foreign country list or under
Section 306 Monitoring
USTR’s
Special 301
report
risk_iploss 1--("important or very important" 4,5) -- Lack of intellectual
property protection
ORN survey
Control
variables
driv_cost 1--("important or very important" 4,5) -- Cost savings ORN survey
driv_newmark 1--("important or very important" 4,5) -- Access to new markets
for products and services
ORN survey
driv_aqp 1--("important or very important" 4,5) -- Access to qualified
personnel offshore
ORN survey
driv_globstr 1--("important or very important" 4,5) -- Part of a global
strategy
ORN survey
driv_speed2m 1--("important or very important" 4,5) -- Increasing speed to
market
ORN survey
cul_dis Hofstede's cultural dimensions: Computed by applying the
Kogut and Singh (1988) index to the items provided by
Hofstede (2001).
Hofstede’s
index
emp_world log transformed from variable "emp_world", which indicates the
number of employees Worldwide (including domestic). For the
observations which answered the number of employees is 0,
they all treated as missing value
ORN survey
host_country_
dummy
China; India; Western developed countries (Austria, Canada,
Finland, France, Germany, Greece, Ireland, Italy, Luxembourg,
Netherlands, Norway, Portugal, Spain, Sweden, Switzerland,
United Kingdom, US); South East Asia (Malaysia, Philippine);
Other developed regions (Australia, Japan, Korea, Singapore);
Latin America (Argentina, Brazil, Colombia, Mexico); Eastern
Europe (Poland, Russia, Slovakia, Ukraine) (reference variable).
ORN survey

130
Industry_dummy financial/insurance/banking services;
health/biotech/pharma/chemical; manufacturing; professional
services; software and programming, business/IT services,
telecommunication, and electronics; high tech and technical
services; other industries (aerospace, agriculture, automotive,
retail, utilities, transportation, etc.) (reference variable).
ORN survey
Table 4.4 shows the descriptive statistics and the correlation matrix of the explicative
variables included in first stage analysis. All correlation coefficients are below 0.6, and
no strong correlations are observed between variables. The variance inflation factor
(VIF) is also calculated to further check the collinearly among variables. We found that
the range of VIF scores of the independent variables is between 1.11 and 2.16, which
indicates absence of collinearity (lower than 10) (Wooldridge, 2012).
Table 4.4: Descriptive statistics and correlations for explanatory and control variables
(first stage)
Variable 1 2 3 4 5 6 7 8 9 10 11
1 captive_mode 1.000
2 risk_iploss -0.037 1.000
3 host_ipri 0.166 0.092 1.000
4 host_ipr 0.041 -0.010 0.334* 1.000
5 driv_cost -0.147 0.195* -0.181 -0.172 1.000
6 driv_newmark 0.135 0.090 0.335* 0.127 0.035 1.000
7 driv_aqp -0.178 0.144 -0.065 -0.008 0.088 -0.013 1.000
8 driv_globstr 0.222* 0.293* 0.224* -0.008 0.147 0.459* 0.076 1.000
9 driv_speed2m -0.188* 0.138 0.023 -0.039 0.084 0.346 0.237* 0.256* 1.000
10 cul_dis 0.009 0.030 -0.587* 0.027 0.081 -0.231* -0.013 -0.184* -0.161 1.000
11 emp_world 0.149 0.179 -0.035 -0.066 0.085 -0.044 -0.080 0.166 -0.086 -0.040 1.000
Obs . 202 202 202 202 202 202 202 202 202 202 202
Mean 0.421 3.045 5.240 -1.417 3.958 2.475 3.797 3.441 3.545 2.670 7.074
Std. Dev. 0.495 1.313 1.258 1.021 0.921 1.383 1.283 1.385 1.297 1.468 3.014
Min 0 1 3.2 -2.667 1 1 1 1 1 0.024 0
Max 1 5 8.3 0 5 5 5 5 5 7.086 13.122
Note: * p<.01

131
4.5.2 Second stage: offshore outcomes
4.5.2.1 Dependent variables
In the ORN survey, firms are asked “To what extent do you agree that offshoring has
measurably led to the following outcomes?”, using the original score (ranging from 1 to
5, which represent strongly disagree to strongly agree). The outcomes include “better
focus on core competencies” (out_corecmpt), “better access to qualified personnel”
(out_aqp), “improved organisational flexibility” (out_orgflex), “increase in firm's
overall competitiveness” (out_compete), “increased productivity/efficiency”
(out_prodeff), “improved service quality” (out_servqual), “better access to new
markets” (out_newmark), and “breakthrough process improvement(s)” (out_ procimpr).
4.5.2.2 Explanatory variables
One of the aims of this paper is to test the effect institutional factors of firm’s host
countries have on achieving certain offshore outcomes. Therefore, variables that reflect
the quality of host country’s legal system and IPR protection (i.e., host_ipri and
host_ipr) which are adopted in first stage test are also included in second stage tests.
The other aim of this paper is to test whether the governance misalignment affects the
achievement of certain outcomes, therefore, we created two dummy variables which
represent the governance misalignment which are included in the explanatory variables.
Following Elia et al. (2014) and Leiblein et al. (2002), we first calculated the predicted
governance misalignment from the first‐stage probit regression as a continuous variable
(which ranges from 0 to 1), equal to Φ in the case of outsourcing and to 1 − Φ in the
case of captive, where Φ is the standard normal cumulative distribution function defined
as follows:
Prob(Yi=1)=Φ(β′Xi)
Two dummy variables are then created: failure to select outsourcing (fail_out), equal to
‘1’ when the predicted mode was outsourcing and the actual one captive (i.e., 1-
Φ > 0.5), and ‘0’ otherwise; Failure to select captive (fail_cap), equal to ‘1’ when the
predicted mode was captive and the actual one outsourcing (i.e., Φ > 0.5). and ‘0’
otherwise.)
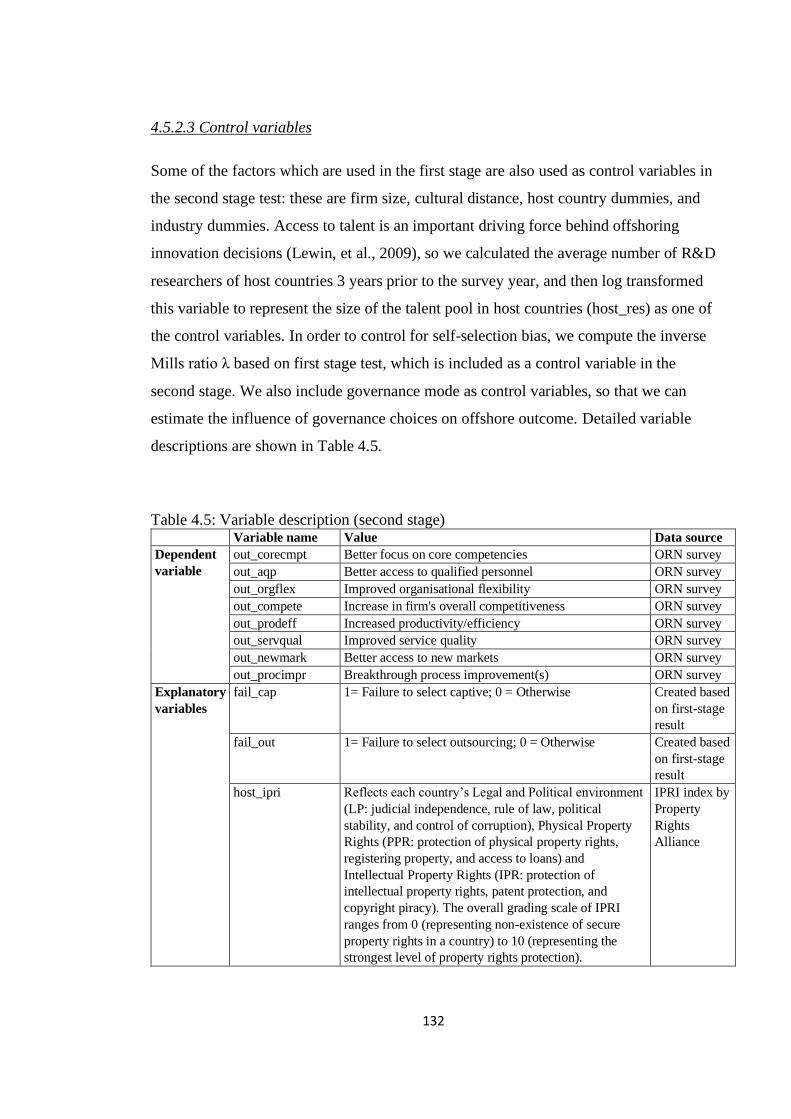
132
4.5.2.3 Control variables
Some of the factors which are used in the first stage are also used as control variables in
the second stage test: these are firm size, cultural distance, host country dummies, and
industry dummies. Access to talent is an important driving force behind offshoring
innovation decisions (Lewin, et al., 2009), so we calculated the average number of R&D
researchers of host countries 3 years prior to the survey year, and then log transformed
this variable to represent the size of the talent pool in host countries (host_res) as one of
the control variables. In order to control for self-selection bias, we compute the inverse
Mills ratio λ based on first stage test, which is included as a control variable in the
second stage. We also include governance mode as control variables, so that we can
estimate the influence of governance choices on offshore outcome. Detailed variable
descriptions are shown in Table 4.5.
Table 4.5: Variable description (second stage) Variable name Value Data source
Dependent
variable
out_corecmpt Better focus on core competencies ORN survey
out_aqp Better access to qualified personnel ORN survey
out_orgflex Improved organisational flexibility ORN survey
out_compete Increase in firm's overall competitiveness ORN survey
out_prodeff Increased productivity/efficiency ORN survey
out_servqual Improved service quality ORN survey
out_newmark Better access to new markets ORN survey
out_procimpr Breakthrough process improvement(s) ORN survey
Explanatory
variables
fail_cap 1= Failure to select captive; 0 = Otherwise Created based
on first-stage
result
fail_out 1= Failure to select outsourcing; 0 = Otherwise Created based
on first-stage
result
host_ipri Reflects each country’s Legal and Political environment
(LP: judicial independence, rule of law, political
stability, and control of corruption), Physical Property
Rights (PPR: protection of physical property rights,
registering property, and access to loans) and
Intellectual Property Rights (IPR: protection of
intellectual property rights, patent protection, and
copyright piracy). The overall grading scale of IPRI
ranges from 0 (representing non-existence of secure
property rights in a country) to 10 (representing the
strongest level of property rights protection).
IPRI index by
Property
Rights
Alliance

133
host_ipr 0 = not on the list; -1 = on the watch list; -2 = on the
priority watch list; -3 = on the priority foreign country
list or under Section 306 Monitoring
USTR’s
Special 301
report
Control
variables
captive_mode 1 = captive mode; 0 = offshore outsourcing mode ORN survey
cul_dis Hofstede's cultural dimensions: Computed by applying
the Kogut and Singh (1988) index to the items provided
by Hofstede (2001).
Hofstede’s
index
emp_world log transformed from variable "emp_world", which
indicates the number of employees Worldwide
(including domestic). For the observations which
answered the number of employees is 0, they all treated
as missing value
ORN survey
host_res Natural log of the total number of researchers in R&D in
host countries
World Bank
database
host_country_
dummy
China; India; Western developed countries (Austria,
Canada, Finland, France, Germany, Greece, Ireland,
Italy, Luxembourg, Netherlands, Norway, Portugal,
Spain, Sweden, Switzerland, United Kingdom, US);
South East Asia (Malaysia, Philippine); Other developed
regions (Australia, Japan, Korea, Singapore); Latin
America (Argentina, Brazil, Colombia, Mexico);
Eastern Europe (Poland, Russia, Slovakia, Ukraine)
(reference variable).
ORN survey
Industry_dummy financial/insurance/banking services;
health/biotech/pharma/chemical; manufacturing;
professional services; software and programming,
business/IT services, telecommunication, and
electronics; high tech and technical services; other
industries (aerospace, agriculture, automotive, retail,
utilities, transportation, etc.) (reference variable).
ORN survey
The descriptive statistics and the correlation matrix of the variables included in second
stage analysis are presented in Table 4.6. All correlation coefficients are below 0.6, and
no strong correlations are observed between variables. We also computed the VIF to
check the potential multicollinearity problems. The range of VIF scores of the
independent variables is between 1.26 and 3.61 (governance mode), which indicates
absence of collinearity (lower than 10) (Wooldridge, 2012).
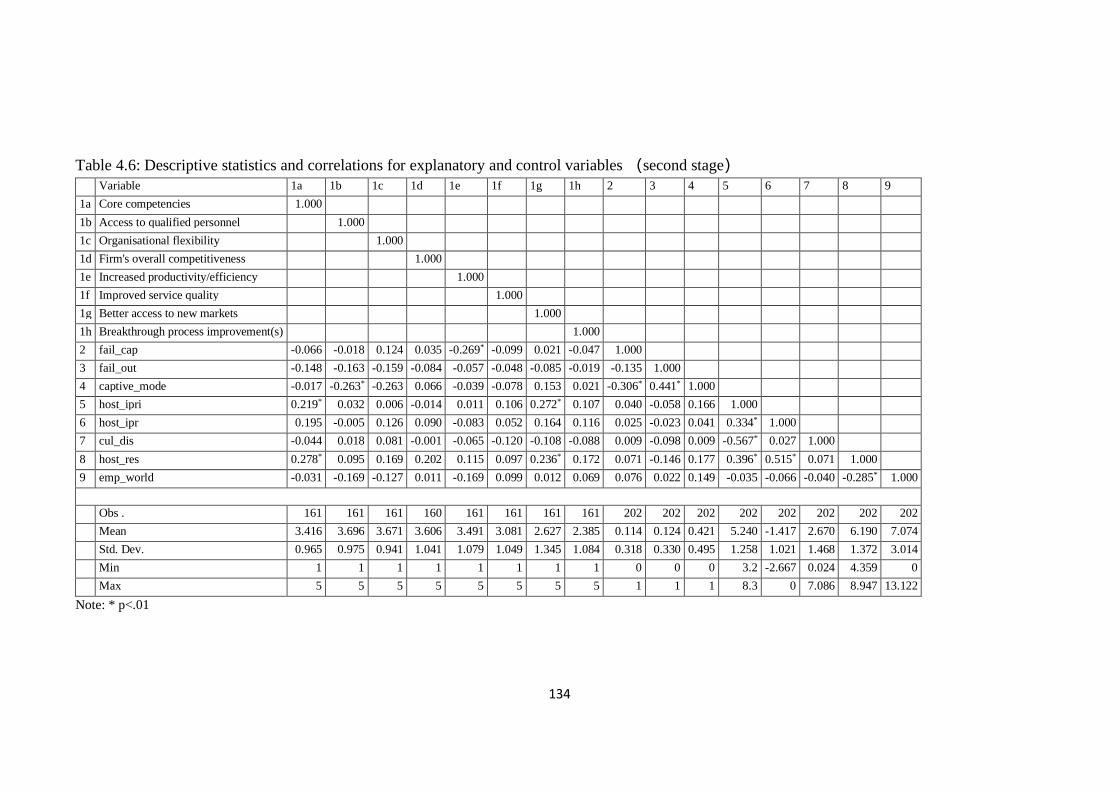
134
Table 4.6: Descriptive statistics and correlations for explanatory and control variables (second stage)
Variable 1a 1b 1c 1d 1e 1f 1g 1h 2 3 4 5 6 7 8 9
1a Core competencies 1.000
1b Access to qualified personnel 1.000
1c Organisational flexibility 1.000
1d Firm's overall competitiveness 1.000
1e Increased productivity/efficiency 1.000
1f Improved service quality 1.000
1g Better access to new markets 1.000
1h Breakthrough process improvement(s) 1.000
2 fail_cap -0.066 -0.018 0.124 0.035 -0.269* -0.099 0.021 -0.047 1.000
3 fail_out -0.148 -0.163 -0.159 -0.084 -0.057 -0.048 -0.085 -0.019 -0.135 1.000
4 captive_mode -0.017 -0.263* -0.263 0.066 -0.039 -0.078 0.153 0.021 -0.306* 0.441* 1.000
5 host_ipri 0.219* 0.032 0.006 -0.014 0.011 0.106 0.272* 0.107 0.040 -0.058 0.166 1.000
6 host_ipr 0.195 -0.005 0.126 0.090 -0.083 0.052 0.164 0.116 0.025 -0.023 0.041 0.334* 1.000
7 cul_dis -0.044 0.018 0.081 -0.001 -0.065 -0.120 -0.108 -0.088 0.009 -0.098 0.009 -0.567* 0.027 1.000
8 host_res 0.278* 0.095 0.169 0.202 0.115 0.097 0.236* 0.172 0.071 -0.146 0.177 0.396* 0.515* 0.071 1.000
9 emp_world -0.031 -0.169 -0.127 0.011 -0.169 0.099 0.012 0.069 0.076 0.022 0.149 -0.035 -0.066 -0.040 -0.285* 1.000
Obs . 161 161 161 160 161 161 161 161 202 202 202 202 202 202 202 202
Mean 3.416 3.696 3.671 3.606 3.491 3.081 2.627 2.385 0.114 0.124 0.421 5.240 -1.417 2.670 6.190 7.074
Std. Dev. 0.965 0.975 0.941 1.041 1.079 1.049 1.345 1.084 0.318 0.330 0.495 1.258 1.021 1.468 1.372 3.014
Min 1 1 1 1 1 1 1 1 0 0 0 3.2 -2.667 0.024 4.359 0
Max 5 5 5 5 5 5 5 5 1 1 1 8.3 0 7.086 8.947 13.122
Note: * p<.01

135
4.5.3 First stage results: Factors behind offshore governance choices
In this section, we focus on innovation activities, and estimate the effects institutional
factors (i.e., IPR protection strength and the quality of rule of law in host countries) and
concern about IPR protection in host countries have on offshore governance choices.
Since the dependent variable is a binary variable, the probit model is adopted to
estimate these relationships.
Model 1 in Table 4.7 shows the first-stage probit regression results. It can be noted that
the quality of rule of law in host countries is positively related to the probability of
choosing captive mode, while the IPR protection strength in host countries is negatively
related to captive mode. With regard to the influences of control variables, firms
offshoring innovation as part of a global strategy are more likely to choose captive
mode. Firm size is also positively related to the probability of choosing captive mode.
However, increasing speed to market increases the probability of choosing offshore
outsourcing. In addition, firms that operate in financial services/insurance/banking
services industries, the probability of choosing offshore outsourcing mode is higher,
while firms that operate in health/biotech/pharma/chemical and high tech and technical
services industries are more likely to adopt captive mode.
In summary, the regression results show that the quality of rule of law in host countries
is positively related to the probability of choosing captive, while the IPR protection
strength in host countries is negatively related to choosing captive. It can be noted that
if firms offshore for increasing speed to market, there is a higher probability that firms
will choose outsourcing. Larger firms offshoring innovation as part of a global strategy,
are more likely to choose captive. In addition, firms that operate in industries like
health/biotech/pharma/chemical and high tech and technical services are more likely to
choose captive.
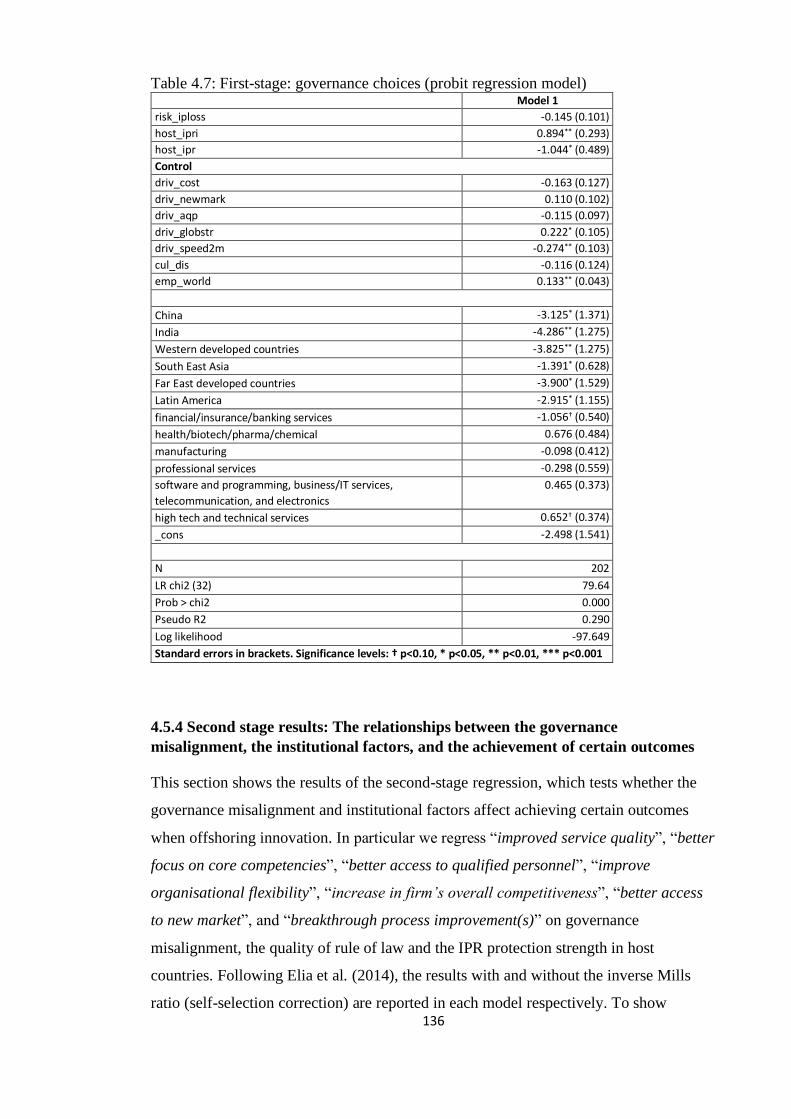
136
Table 4.7: First-stage: governance choices (probit regression model) Model 1
risk_iploss -0.145 (0.101)
host_ipri 0.894** (0.293)
host_ipr -1.044* (0.489)
Control
driv_cost -0.163 (0.127)
driv_newmark 0.110 (0.102)
driv_aqp -0.115 (0.097)
driv_globstr 0.222* (0.105)
driv_speed2m -0.274** (0.103)
cul_dis -0.116 (0.124)
emp_world 0.133** (0.043)
China -3.125* (1.371)
India -4.286** (1.275)
Western developed countries -3.825** (1.275)
South East Asia -1.391* (0.628)
Far East developed countries -3.900* (1.529)
Latin America -2.915* (1.155)
financial/insurance/banking services -1.056† (0.540)
health/biotech/pharma/chemical 0.676 (0.484)
manufacturing -0.098 (0.412)
professional services -0.298 (0.559)
software and programming, business/IT services,
telecommunication, and electronics
0.465 (0.373)
high tech and technical services 0.652† (0.374)
_cons -2.498 (1.541)
N 202
LR chi2 (32) 79.64
Prob > chi2 0.000
Pseudo R2 0.290
Log likelihood -97.649
Standard errors in brackets. Significance levels: † p<0.10, * p<0.05, ** p<0.01, *** p<0.001
4.5.4 Second stage results: The relationships between the governance
misalignment, the institutional factors, and the achievement of certain outcomes
This section shows the results of the second-stage regression, which tests whether the
governance misalignment and institutional factors affect achieving certain outcomes
when offshoring innovation. In particular we regress “improved service quality”, “better
focus on core competencies”, “better access to qualified personnel”, “improve
organisational flexibility”, “increase in firm’s overall competitiveness”, “better access
to new market”, and “breakthrough process improvement(s)” on governance
misalignment, the quality of rule of law and the IPR protection strength in host
countries. Following Elia et al. (2014), the results with and without the inverse Mills
ratio (self-selection correction) are reported in each model respectively. To show
137
whether unobserved firm characteristics affect governance choice and performance. It
can be noted that in some models the inverse Mills ratio has significant effect.
Therefore, the discussion of regression results of each outcome will be focused on the
models with inverse Mills ratio in below.
Outcomes: “better focus on core competencies” and “better access to qualified
personnel”
Table 4.8 shows the regression results regarding the relationships between the
influencing factors and the achievement of “better focus on core competencies” (Model
2) and “better access to qualified personnel” (Model 3). It can be noted that “failure to
select outsourcing mode” has a significant negative impact on the probability of
achieving the outcome of focusing on core competencies. Regarding the influences of
institutional factors, Model 2 shows that the quality of rule of law in host countries is
positively related to the probability of achieving the outcome of focusing on core
competencies, while the IPR protection strength in host countries is negatively related to
this outcome. The regression results also show that the bigger the firm size, the higher
the probability to achieve “better focus on core competencies”. In addition, firms that
offshore innovation activities to China, Western developed countries, Far East
developed countries, Latin America, and firms that operate in
financial/insurance/banking services industries are less likely to achieve this outcome,
while firms that operate in professional services are more likely to do so.
Model 3 shows that “failure to select outsourcing model” and the IPR protection
strength in host countries have a negative effect on the probability of achieving the
outcome “better access to qualified personnel”. It can be noted that firms that operate in
professional services and “software and programming, business/IT services,
telecommunication, and electronics” industries are more likely to achieve this outcome.
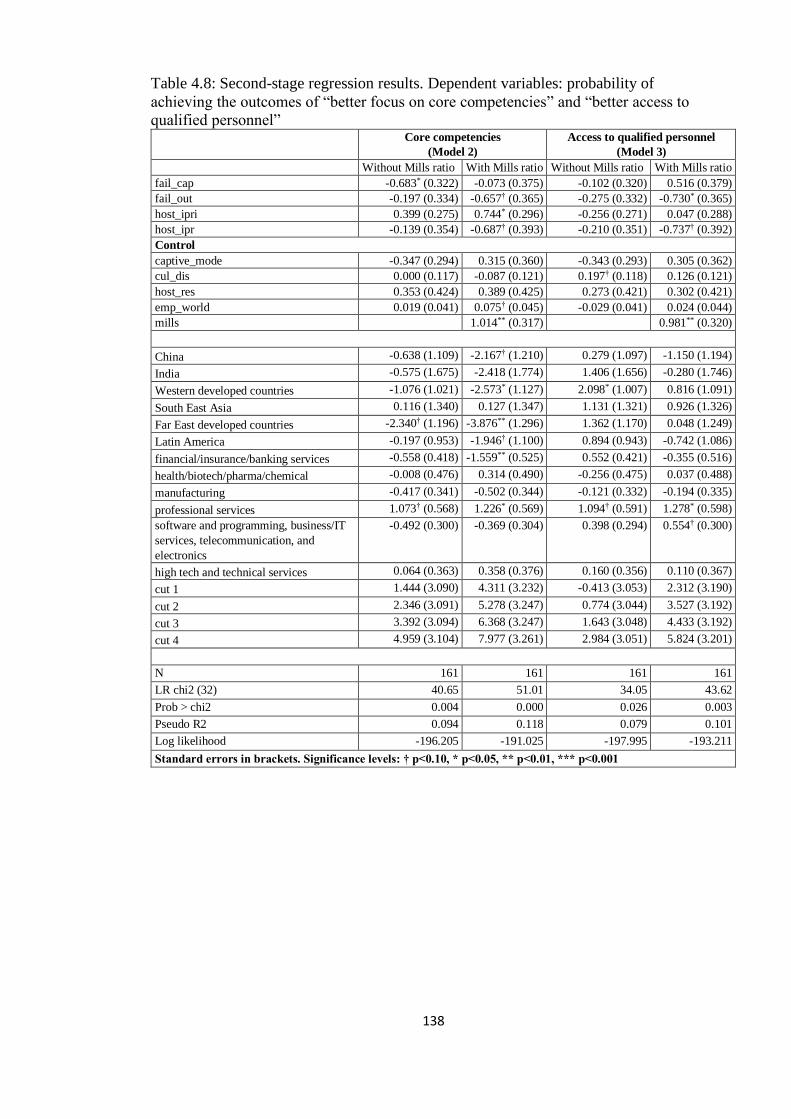
138
Table 4.8: Second-stage regression results. Dependent variables: probability of
achieving the outcomes of “better focus on core competencies” and “better access to
qualified personnel” Core competencies
(Model 2)
Access to qualified personnel
(Model 3)
Without Mills ratio With Mills ratio Without Mills ratio With Mills ratio
fail_cap -0.683* (0.322) -0.073 (0.375) -0.102 (0.320) 0.516 (0.379)
fail_out -0.197 (0.334) -0.657† (0.365) -0.275 (0.332) -0.730* (0.365)
host_ipri 0.399 (0.275) 0.744* (0.296) -0.256 (0.271) 0.047 (0.288)
host_ipr -0.139 (0.354) -0.687† (0.393) -0.210 (0.351) -0.737† (0.392)
Control
captive_mode -0.347 (0.294) 0.315 (0.360) -0.343 (0.293) 0.305 (0.362)
cul_dis 0.000 (0.117) -0.087 (0.121) 0.197† (0.118) 0.126 (0.121)
host_res 0.353 (0.424) 0.389 (0.425) 0.273 (0.421) 0.302 (0.421)
emp_world 0.019 (0.041) 0.075† (0.045) -0.029 (0.041) 0.024 (0.044)
mills 1.014** (0.317) 0.981** (0.320)
China -0.638 (1.109) -2.167† (1.210) 0.279 (1.097) -1.150 (1.194)
India -0.575 (1.675) -2.418 (1.774) 1.406 (1.656) -0.280 (1.746)
Western developed countries -1.076 (1.021) -2.573* (1.127) 2.098* (1.007) 0.816 (1.091)
South East Asia 0.116 (1.340) 0.127 (1.347) 1.131 (1.321) 0.926 (1.326)
Far East developed countries -2.340† (1.196) -3.876** (1.296) 1.362 (1.170) 0.048 (1.249)
Latin America -0.197 (0.953) -1.946† (1.100) 0.894 (0.943) -0.742 (1.086)
financial/insurance/banking services -0.558 (0.418) -1.559** (0.525) 0.552 (0.421) -0.355 (0.516)
health/biotech/pharma/chemical -0.008 (0.476) 0.314 (0.490) -0.256 (0.475) 0.037 (0.488)
manufacturing -0.417 (0.341) -0.502 (0.344) -0.121 (0.332) -0.194 (0.335)
professional services 1.073† (0.568) 1.226* (0.569) 1.094† (0.591) 1.278* (0.598)
software and programming, business/IT
services, telecommunication, and
electronics
-0.492 (0.300) -0.369 (0.304) 0.398 (0.294) 0.554† (0.300)
high tech and technical services 0.064 (0.363) 0.358 (0.376) 0.160 (0.356) 0.110 (0.367)
cut 1 1.444 (3.090) 4.311 (3.232) -0.413 (3.053) 2.312 (3.190)
cut 2 2.346 (3.091) 5.278 (3.247) 0.774 (3.044) 3.527 (3.192)
cut 3 3.392 (3.094) 6.368 (3.247) 1.643 (3.048) 4.433 (3.192)
cut 4 4.959 (3.104) 7.977 (3.261) 2.984 (3.051) 5.824 (3.201)
N 161 161 161 161
LR chi2 (32) 40.65 51.01 34.05 43.62
Prob > chi2 0.004 0.000 0.026 0.003
Pseudo R2 0.094 0.118 0.079 0.101
Log likelihood -196.205 -191.025 -197.995 -193.211
Standard errors in brackets. Significance levels: † p<0.10, * p<0.05, ** p<0.01, *** p<0.001
139
Outcomes: “improved organisational flexibility” and “increase in firm's overall
competitiveness”
Model 4 in Table 4.9 tests the relationships between the influencing factors and the
achievement of “improved organisational flexibility”. The results show that “failure to
select captive model” is positively related to the probability of achieving the outcome of
improving organisational flexibility, while “failure to select outsourcing mode” has a
negative effect. It can also be noted that the institutional factors have no significant
effect on achieving this outcome, but the number of R&D researchers in host countries
is positively related to the probability of achieving this outcome. In addition, firms that
offshore innovation activities to South East Asia, and firms that operate in
manufacturing and professional services industries are more likely to improve
organisational flexibility.
The regression results in Model 5 shows that “failure to select outsourcing mode” and
the quality of rule of law in host countries are negatively related to the probability of
achieving the outcome of increasing firm’s overall competitiveness. However, “failure
to select captive mode” has positive effect on achieving this outcome. The IPR
protection strength in host countries has no significant effect on this achievement.
About the control variables, the results show that firms that choose captive mode are
more likely to achieving this outcome. Furthermore, firms offshoring innovation to
China, India, Western developed countries, and Latin America are more likely to
achieve this outcome. However, firms that operate in “financial/insurance/banking
services”, “manufacturing”, “health/biotech/pharma/chemical”, and “high tech and
technical services” industries are less likely to achieve this outcome.
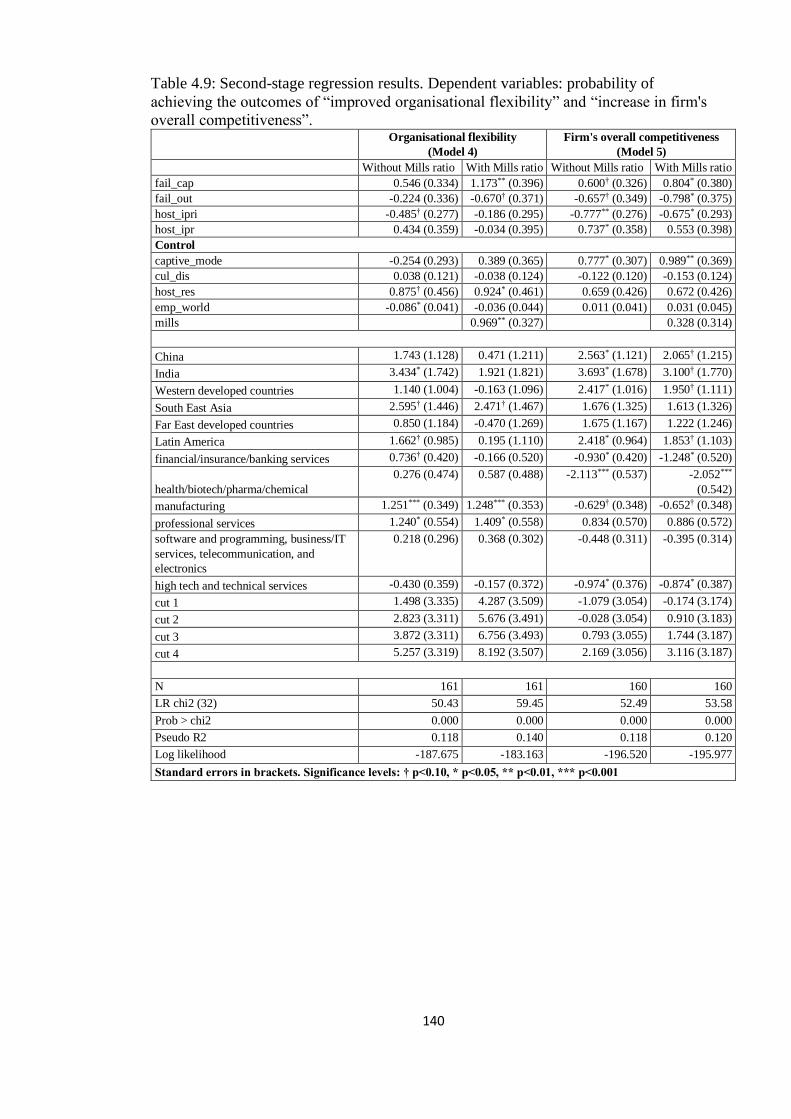
140
Table 4.9: Second-stage regression results. Dependent variables: probability of
achieving the outcomes of “improved organisational flexibility” and “increase in firm's
overall competitiveness”. Organisational flexibility
(Model 4)
Firm's overall competitiveness
(Model 5)
Without Mills ratio With Mills ratio Without Mills ratio With Mills ratio
fail_cap 0.546 (0.334) 1.173** (0.396) 0.600† (0.326) 0.804* (0.380)
fail_out -0.224 (0.336) -0.670† (0.371) -0.657† (0.349) -0.798* (0.375)
host_ipri -0.485† (0.277) -0.186 (0.295) -0.777** (0.276) -0.675* (0.293)
host_ipr 0.434 (0.359) -0.034 (0.395) 0.737* (0.358) 0.553 (0.398)
Control
captive_mode -0.254 (0.293) 0.389 (0.365) 0.777* (0.307) 0.989** (0.369)
cul_dis 0.038 (0.121) -0.038 (0.124) -0.122 (0.120) -0.153 (0.124)
host_res 0.875† (0.456) 0.924* (0.461) 0.659 (0.426) 0.672 (0.426)
emp_world -0.086* (0.041) -0.036 (0.044) 0.011 (0.041) 0.031 (0.045)
mills 0.969** (0.327) 0.328 (0.314)
China 1.743 (1.128) 0.471 (1.211) 2.563* (1.121) 2.065† (1.215)
India 3.434* (1.742) 1.921 (1.821) 3.693* (1.678) 3.100† (1.770)
Western developed countries 1.140 (1.004) -0.163 (1.096) 2.417* (1.016) 1.950† (1.111)
South East Asia 2.595† (1.446) 2.471† (1.467) 1.676 (1.325) 1.613 (1.326)
Far East developed countries 0.850 (1.184) -0.470 (1.269) 1.675 (1.167) 1.222 (1.246)
Latin America 1.662† (0.985) 0.195 (1.110) 2.418* (0.964) 1.853† (1.103)
financial/insurance/banking services 0.736† (0.420) -0.166 (0.520) -0.930* (0.420) -1.248* (0.520)
health/biotech/pharma/chemical
0.276 (0.474) 0.587 (0.488) -2.113*** (0.537) -2.052***
(0.542)
manufacturing 1.251*** (0.349) 1.248*** (0.353) -0.629† (0.348) -0.652† (0.348)
professional services 1.240* (0.554) 1.409* (0.558) 0.834 (0.570) 0.886 (0.572)
software and programming, business/IT
services, telecommunication, and
electronics
0.218 (0.296) 0.368 (0.302) -0.448 (0.311) -0.395 (0.314)
high tech and technical services -0.430 (0.359) -0.157 (0.372) -0.974* (0.376) -0.874* (0.387)
cut 1 1.498 (3.335) 4.287 (3.509) -1.079 (3.054) -0.174 (3.174)
cut 2 2.823 (3.311) 5.676 (3.491) -0.028 (3.054) 0.910 (3.183)
cut 3 3.872 (3.311) 6.756 (3.493) 0.793 (3.055) 1.744 (3.187)
cut 4 5.257 (3.319) 8.192 (3.507) 2.169 (3.056) 3.116 (3.187)
N 161 161 160 160
LR chi2 (32) 50.43 59.45 52.49 53.58
Prob > chi2 0.000 0.000 0.000 0.000
Pseudo R2 0.118 0.140 0.118 0.120
Log likelihood -187.675 -183.163 -196.520 -195.977
Standard errors in brackets. Significance levels: † p<0.10, * p<0.05, ** p<0.01, *** p<0.001

141
Outcomes: “Increased productivity/efficiency” and “Improved service quality”
Model 6 in Table 4.10 presents the regression results for the achievement of increasing
productivity/efficiency via offshoring innovation activities. It can be noted that “failure
to select captive mode” is negatively related to the probability of achieving this
outcome, while the number of R&D researchers in host countries is positively related to
this outcome. Other explanatory variables do not have significant effects.
Results for Model 7 show that when the quality of rule of in host countries is better, the
probability of achieving the outcome of improving service quality will be lower. Failure
to select captive mode, failure to select outsourcing mode, and the IPR protection
strength of host countries do not have significant effects on achieving this outcome.
Regarding the control variables, the regression results show that the number of R&D
researchers in host countries is positively related to the probability of achieving the
outcome improving service quality. In addition, firms that offshored innovation
functions to India, Western developed countries, South East Asia, Far East developed
countries, Latin America, and firms that operate in manufacturing and professional
services industries are more likely to achieve such outcome.

142
Table 4.10: Second-stage regression results. Dependent variables: probability of
achieving the outcomes of “increased productivity/efficiency” and “improved service
quality”.
Increased productivity/efficiency
(Model 6)
Improved service quality
(Model 7)
Without Mills ratio With Mills ratio Without Mills ratio With Mills ratio
fail_cap -1.097** (0.324) -0.745* (0.372) -0.443 (0.319) -0.284 (0.370)
fail_out -0.056 (0.333) -0.325 (0.361) -0.070 (0.336) -0.187 (0.363)
host_ipri -0.381 (0.267) -0.195 (0.284) -0.981** (0.289) -0.897** (0.304)
host_ipr -0.179 (0.349) -0.497 (0.386) -0.189 (0.353) -0.327 (0.388)
Control
captive_mode -0.369 (0.291) 0.022 (0.354) -0.221 (0.291) -0.049 (0.355)
cul_dis -0.124 (0.116) -0.178 (0.120) -0.097 (0.116) -0.120 (0.119)
host_res 0.783† (0.422) 0.808† (0.422) 1.421** (0.429) 1.429** (0.429)
emp_world -0.025 (0.040) 0.008 (0.044) 0.016 (0.040) 0.030 (0.043)
mills 0.596† (0.307) 0.257 (0.304)
China 0.652 (1.095) -0.205 (1.182) 1.027 (1.128) 0.643 (1.213)
India 1.876 (1.645) 0.851 (1.728) 4.434* (1.718) 3.975* (1.796)
Western developed countries 0.938 (0.981) 0.126 (1.069) 2.886** (1.070) 2.515* (1.151)
South East Asia 1.933 (1.311) 1.829 (1.314) 4.487** (1.359) 4.428** (1.359)
Far East developed countries 0.651 (1.146) -0.160 (1.223) 3.151* (1.225) 2.784* (1.296)
Latin America 0.927 (0.932) -0.072 (1.066) 2.273* (0.971) 1.832† (1.100)
financial/insurance/banking services 0.150 (0.409) -0.409 (0.501) 0.455 (0.410) 0.210 (0.502)
health/biotech/pharma/chemical -0.329 (0.476) -0.148 (0.486) -0.218 (0.471) -0.142 (0.480)
manufacturing -0.016 (0.334) -0.051 (0.335) 0.739* (0.335) 0.722* (0.336)
professional services 0.812 (0.555) 0.910 (0.556) 1.929** (0.591) 1.966** (0.593)
software and programming, business/IT
services, telecommunication, and
electronics
0.297 (0.298) 0.399 (0.303) -0.072 (0.293) -0.037 (0.296)
high tech and technical services 0.334 (0.362) 0.518 (0.375) 0.263 (0.355) 0.340 (0.367)
cut 1 1.819 (3.056) 3.511 (3.184) 4.808 (3.026) 5.534 (3.156)
cut 2 2.551 (2.060) 4.270 (3.193) 6.169 (3.033) 6.902 (3.154)
cut 3 3.590 (3.068) 5.326 (3.202) 7.351 (3.046) 8.089 (3.169)
cut 4 4.705 (3.071) 6.447 (3.206) 8.291 (3.053) 9.028 (3.176)
N 161 161 161 161
LR chi2 (32) 39.99 43.77 54.79 55.5
Prob > chi2 0.005 0.003 0.000 0.000
Pseudo R2 0.086 0.095 0.119 0.121
Log likelihood -211.499 -209.611 -202.863 -202.506
Standard errors in brackets. Significance levels: † p<0.10, * p<0.05, ** p<0.01, *** p<0.001
Outcomes: “Better access to new markets” and “Breakthrough process improvement(s)”
Model 8 focuses on analysing the influencing factors behind the achievement of “better
access to new markets”. It can be noted that “failure to select outsourcing” and the
quality of rule of law in host countries are negatively related to probability of achieving
the outcome. As for control variables, the regression results show that firms that choose

143
captive mode are more likely to achieve this outcome. Firms that offshored innovation
activities to China, India, Western developed countries, Far East developed countries
and Latin America, as well as firms that operate in manufacturing and professional
services industries are more likely to achieve this outcome, while firms that operate in
health/biotech/pharma/chemical industries are less likely to achieve the outcome.
The regression results in Model 9 show that the quality of rule of law in host countries
is negatively related to the probability of achieving the outcome “breakthrough process
improvement(s)”. Regarding the control variables, it can be noted that the number of
R&D researchers in host countries is positively related to achieving this outcome, as
well as firms that offshored innovation activities to India, South East Asia, and Latin
America, and firms that operate in professional services industries are also more likely
to achieve this outcome.

144
Table 4.11: Second-stage regression results. Dependent variables: probability of
achieving the outcomes of “Better access to new markets” and “Breakthrough process
improvement(s)”.
Better access to new markets
(Model 8)
Breakthrough process
improvement(s)
(Model 9)
Without Mills ratio With Mills ratio Without Mills ratio With Mills ratio
fail_cap 0.641* (0.319) 0.562 (0.373) -0.103 (0.320) 0.308 (0.375)
fail_out -0.721* (0.336) -0.665† (0.363) -0.076 (0.340) -0.373 (0.369)
host_ipri -0.536† (0.288) -0.581† (0.308) -0.826** (0.310) -0.609† (0.320)
host_ipr 0.531 (0.353) 0.601 (0.392) 0.456 (0.351) 0.110 (0.387)
Control
captive_mode 0.863** (0.298) 0.780* (0.361) 0.095 (0.299) 0.542 (0.368)
cul_dis -0.019 (0.118) -0.010 (0.120) -0.114 (0.117) -0.174 (0.120)
host_res 0.292 (0.421) 0.292 (0.422) 1.164** (0.432) 1.187** (0.431)
emp_world -0.063 (0.041) -0.070 (0.045) -0.003 (0.041) 0.033 (0.045)
mills -0.129 (0.317) 0.657* (0.312)
China 2.442* (1.128) 2.643* (1.233) 2.568* (1.166) 1.600 (1.240)
India 3.242† (1.710) 3.488† (1.816) 4.698** (1.796) 3.521† (1.857)
Western developed countries 3.246** (1.086) 3.436** (1.185) 2.688* (1.175) 1.709 (1.235)
South East Asia 2.142 (1.342) 2.190 (1.349) 3.843** (1.408) 3.673** (1.396)
Far East developed countries 3.337** (1.244) 3.527** (1.331) 1.845 (1.303) 0.859 (1.360)
Latin America 2.643** (0.982) 2.866* (1.126) 3.051** (1.018) 1.942† (1.134)
financial/insurance/banking services -0.274 (0.429) -0.146 (0.531) -0.117 (0.420) -0.754 (0.518)
health/biotech/pharma/chemical -1.058* (0.508) -1.088* (0.512) -0.718 (0.501) -0.563 (0.512)
manufacturing 0.974** (0.340) 0.984** (0.341) 0.390 (0.336) 0.344 (0.338)
professional services 1.091* (0.553) 1.076† (0.555) 1.744** (0.573) 1.851** (0.575)
software and programming, business/IT
services, telecommunication, and
electronics
-0.138 (0.293) -0.155 (0.296) -0.447 (0.296) -0.366 (0.298)
high tech and technical services -0.167 (0.355) -0.203 (0.367) 0.127 (0.358) 0.315 (0.369)
cut 1 0.065 (3.008) -0.281 (3.126) 4.396 (3.055) 6.263 (3.185)
cut 2 0.734 (3.010) 0.390 (3.126) 5.159 (3.059) 7.042 (3.191)
cut 3 1.544 (3.011) 1.200 (3.126) 6.268 (3.069) 8.181 (3.206)
cut 4 2.250 (3.011) 1.904 (3.128) 8.038 (3.101) 9.842 (3.234)
N 161 161 161 161
LR chi2 (32) 62.59 62.76 50.39 54.84
Prob > chi2 0.000 0.000 0.000 0.000
Pseudo R2 0.125 0.125 0.111 0.121
Log likelihood -220.133 -220.049 -201.393 -199.165
Standard errors in brackets. Significance levels: † p<0.10, * p<0.05, ** p<0.01, *** p<0.001
To summarise the regression results (Table 4.12), we found that failing to select captive
mode increase the probability to achieve the outcomes of improving organisational
flexibility, increasing firm’s overall competitiveness and productivity/efficiency. For
firms that fail to select outsourcing mode, the probability of achieving the outcomes of
better focusing on core competencies, accessing to qualified personnel, improving
145
organisational flexibility, and firm’s overall competitiveness is lower, while the
probability of achieving the outcome of better accessing to new markets is higher. The
quality of rule of law in host countries is positively related to the probability of
achieving the outcome of focusing on core competencies, while it is negatively related
to the probability of achieving an outcome of increasing firm’s overall competitiveness,
service quality, better accessing to new markets, and breakthrough process
improvement(s). The IPR protection strength is negatively related to the probability of
achieving the outcome of better focusing on core competencies and accessing to
qualified personnel. The results also show that bigger firms are more likely to achieve
the outcome of better focusing on core competencies. The number of R&D researchers
in host countries is also positively related to the probability of achieving the outcomes
of improving organisational flexibility, productivity/efficiency, service quality and
breakthrough process improvement(s). Firms choosing captive mode are more likely to
achieve the outcome of increasing firm’s overall competitiveness and better accessing to
new markets.
Last but not least, offshoring destinations and the industries firms operate matter when
innovation functions are offshored. For example, firms that offshored to China are more
likely to increase firm’s overall competitiveness and access to new markets, while are
less likely to focus on core competencies. Firms that offshored to India and Latin
America are more likely to achieve the outcomes of increasing firm’s overall
competitiveness, improved service quality, better access to new markets, and
breakthrough process improvement(s), but less likely to better focus on core
competencies. As for firms that offshored innovation activities to Western developed
countries and Far East developed countries, they are more likely to achieve the
outcomes of improving service quality and accessing to new markets, and firms that
offshored to Western developed countries are also more likely to increase firm’s overall
competitiveness. However, they are less likely to focus on core competencies. Firms
that operate in health/biotech/pharma/chemical are less likely to achieve the outcomes
of increasing firm’s overall competitiveness and accessing to new markets , and firms
who operate in financial/insurance/banking services are less likely to increase firm’s
overall competitiveness and focus on core competencies. Firms in manufacturing
industries are more likely to achieve the outcomes of improving organisational
flexibility, service quality and accessing to new markets, but less likely to increase

146
firm’s overall competitiveness. Firms in professional services industries are more likely
to achieve all these outcomes except increasing firm’s overall competitiveness and
productivity/efficiency. Firms in software and programming/business/IT
services/telecommunication/electronics industries are more likely to access to qualified
personnel, but firms in high-tech and technical services are less likely to increase firm’s
overall competitiveness.
Table 4.12: Summary of the regression results.
Dependent variables
Core
competencies
Access to
qualified
personnel Organisa-
tional
flexibility
Firm's
overall
competitive-
ness
Increased
productivity
/efficiency
Improved
service
quality
Better
access to
new
markets
Break-
through
process
improve-
ment(s)
fail_cap + + + fail_out - - - - + host_ipri + - - - -
host_ipr - - Control
captive_ mode + + cul_dis host_res + + + +
emp_world + mills + + + + +
+: positively related; ‒: negatively related
4.5.5 Robustness Checks
We conducted robustness checks by adopting an indicator developed by Park (2008)
which measures the strength of IPR protection of firm’s home country and host country,
which is available only for the years 1960-1990 (average), 1995, 2000, and 2005. Since
the surveys covered in our sample range from 2007 to 2011, we used the 2005 value of
this indicator in the tests. Regarding the variable that measures the quality of rule of law
of host country, we adopt the variable defined by Kaufmann et al., which reflects
agents’ degree of confidence in and abide by the rules of society, and which mainly
refers to quality of contract enforcement, property rights, the police, and the courts, as
well as the likelihood of crime and violence (Kaufmann, et al., 2003). The results
reported in Appendix B1 show that most of the findings are supported, except that the
effects IPR protection strength of host country has on achieving the outcomes changed
from negative to not significant (e.g., better focus on core competencies, and better

147
access to qualified personnel), and from not significant to negative (e.g., improved
organisational flexibility, better access to new markets, and breakthrough process
improvement(s)). The effects quality of rule of law has on achieving the outcomes of
increasing firm’s overall competitiveness, improving service quality, better accessing to
new markets and breakthrough process improvement(s) changed from negative to not
significant, and the effect on achieving the outcome of increasing
productivity/efficiency changed from not significantly related to positively related. This
could be attributed to the fact that different aspects of the IPR regime and legal system
may be captured by different proxies. For example, the IPR protection variable used in
the main test in this section reflects US government’s view about the IPR regime of
other countries, while the indicator developed by Park are mostly focused on aspects of
IP law (Brander, et al., 2017). The rule of law variable developed by Kaufmann and
colleagues mainly reflects agent’s perception of the country’s legal system with regard
to contract enforcement, property rights, police and courts, while the rule of law
variable used in the main test not only include the Kaufmann index, but also include
varied indicators which reflects the quality of rule of law from three main aspects (legal
and political environment, physical property rights, and IPR). Indeed, we selected these
variables for our main regression because they cover a longer time period (IPR), include
a longer number of indicators (rule of law), and the IPRI index provided better fit in
terms of R-square. We conclude that the results of our main regression models need to
be interpreted with a full understanding of the dimensions captured by the two
institutional variables.
4.6 Discussion and conclusion
This paper analyses the relationships between factors that affect governance choices
when firms offshore innovation activities. Previous studies have stated that poor legal
protection strength in host countries represents one of the most severe risks that firms
need to consider when making offshoring decisions (Nassimbeni, et al., 2012). Some
researchers have observed that firms prefer a more hierarchical governance mode when
the legal protection is weak, while offshore outsourcing is preferred when IPR
protection strength in host countries is strong, especially when offshoring innovation
activities (Kshetri, 2007; Oxley, 1999). Our regression results support the results of
previous studies, such as outsourcing being preferred when the IPR protection strength

148
in host countries is stronger for innovation activities. However, our results also revealed
something different, such as that the quality of rule of law in host countries is positively
related to the probability of choosing captive mode.
The rule of law (legal protection) in host countries protects both property rights89 and
contract enforcement (Jain, et al., 2008). Strategic investment in assets, such as
machinery or brands, is at risk where rule of law is weak (Levie & Autio, 2011). Since
captive mode requires heavy investments of financial and managerial resources, which
in turn increases the price firms need to pay if they fail (Hutzschenreuter, et al., 2011), a
weak legal protection system in host countries could increase the risks firms face when
choosing a captive mode to operate innovation functions. This could be an explanation
for our results, and also supports the integration of TCE and institutional theory to
analyse the choices of firm boundaries. It can also be noted that increasing speed to
market is negatively related to the probability of choosing captive mode, while the
importance of being part of firm’s global strategy is positively related to choosing
captive. The results justified our conceptual framework that TCE, RBV, and
institutional theory should be integrated when analysing the firm’s offshore governance
choices.
After identifying the factors behind the governance choices, we further tested the
influence of governance misalignment and institutional factors on achieving certain
outcomes when offshoring innovation activities. Previous studies have stated that firms
need to adopt the suitable governance mode that is contingent with firms’ resources,
transaction characteristics, and local context (Brouthers, 2002; Leiblein, et al., 2002).
However, our analysis show that the governance misfit does not always hurt firm’s
performance, i.e., failure to select captive mode is positively related to the probability of
achieving the outcomes of improving organisational flexibility, increasing firm’s overall
competitiveness and productivity/efficiency”. Elia and colleagues (2014) stated that
governance misalignment has an asymmetric impact on performance, and our results
support their findings. Indeed, while failing to select captive mode may damage internal
knowledge protection, selecting outsourcing instead does improve organisational
flexibility and offers opportunities for efficiencies.
89 “As the set of economic and social relations defining the position of each individual with respect to the
utilization of scarce resource” as property rights, and it is stated that both trade of property rights and
production involve contractual arrangements (Furubotn & Pejovich, 1972).

149
Our results show that failure to select outsourcing mode mostly has negative effect
(except the outcome of better accessing to new markets), while failure to select captive
mode has positive firm performance. Scholars have stated that collaborations with
suppliers via offshore outsourcing can offer firms access to new resources (which
include the talent resources and technological resources from suppliers in host
countries), better focusing on core competencies by outsourcing peripheral business
activities, as well as enhancing focal firms’ flexibility (Bertrand, 2011; Kedia & Lahiri,
2007; Contractor, et al., 2010; Javalgi, et al., 2009). Our results support these statements
by showing that firms who fail to adopt outsourcing are less likely to achieve the
outcome of better focus on core competencies, better access to personnel, improving
organisational flexibility, and increase firm’s overall competitiveness. When the firm
establishes a wholly owned subsidiary, its presence in that country could still help the
firm to gain better access to this market even though our model recommends
outsourcing mode to this implementation. This could explain why failure to select
outsourcing mode is positively related to achieving the outcome of better access to new
markets.
Regarding failure to select captive mode, our results show that the probability of
achieving the outcomes of improving organisational flexibility, increasing firm’s overall
competitiveness, and productivity/efficiency will be higher. We do not know if firms in
our sample have experience of outsourcing or not, but we do know that the outsourcing
industry has developed tremendously, and service providers have become more
competitive and experienced (Lacity, et al., 2009). Therefore, selecting outsourcing
when the model predicted to select captive may still deliver some efficiencies and allow
to achieve certain performance outcomes (Quinn, 2000). This may explain why failure
to select captive mode can still increase the probability of achieving such outcomes,
which is consistent with the TCE theory. In addition, previous studies have stated that
excessive offshore outsourcing of advanced activities may hollow out firms’
competitive bases and increase dependency on providers (Paju, 2007; Grimpe & Kaiser,
2010; Kotabe, et al., 2008). However, if the innovation activities offshored to other
countries are not firms’ core technologies, failure to select captive mode may not
necessarily bring losses to firms; instead, firms may achieve the benefits that
outsourcing can bring.

150
The relationships between failure to select outsourcing mode, failure to select captive
mode and the firm performance may also indicate that it is comparatively more
important to choose outsourcing mode as the model predicted, since failure to select
outsourcing mode is mostly negatively related to the achievement of varied outcomes,
while failure to select captive mode can still bring certain types of benefits.
Our regression results show that if the rule of law in host countries is better, firms are
more likely to achieve the outcome of focusing on core competencies, but less likely to
achieve the outcomes of improving firm’s overall competitiveness, service quality,
accessing to new markets, and breakthrough process improvement(s). Previous studies
also identified a positive relationship between the economic performance and quality of
rule of law (especially property rights protection) (Barro, 2000). Countries with good
quality rule of law are normally the ones with advanced economies (Rigobon & Rodrik,
2005). Important high-end product development and engineering activities would still
be carried out in the developed economies (Manning, et al., 2008; Doh, et al., 2009),
and offshoring innovation activities to such countries could help firms to utilise the
technological resources and strengthen their core competencies, which explains the
relationship between the rule of law and the probability of better focusing on core
competencies.
Researchers argue that offshoring also provide MNEs an access to knowledge in
multiple markets and can benefit from increased diversity and heterogeneity in their
knowledge bases (Nieto & Rodríguez, 2011). Offshoring R&D activities to countries
with more specialised knowledge provides firms with location-specific resourcing and
specialisation advantages, firms can obtain better innovation inputs and enhance
innovation capabilities (Chung & Alcácer, 2002). It has also been stated that firms now
routinely adopt offshoring strategy in order to utilise time-zone differences to provide a
24-hour knowledge factory model, as well as provide “round-the-clock” support for
customers (Siems & Ratner, 2003; Bryson, 2007). At the same time, the choices of
destinations for advanced activities offshoring have also evolved from developed
countries to developing countries (Massini & Lewin, 2012). Among the different
offshoring destinations, it is argued that Asia has been playing a central role in the
growing global innovation networks (Ernst, 2006), and researchers have also identified
that emerging economies have taken a leading position in attracting global service
offshoring and innovation offshoring. Offshoring innovation activities to the emerging

151
countries not only provides firms “round-the-clock” services to its product development
and customer services, opening new markets to firms, but it also offers firms the
specific locational resources and enhanced innovation capabilities. However, these
countries normally do not possess strong and complete legal systems, which could
explain why the quality of rule of law in host countries is negatively related to the
probability of increasing firm’s overall competitiveness, improving service quality,
accessing to new markets, and achieving breakthrough process improvement(s).
Our results also show that IPR protection strength in host countries is negatively related
to the probability of achieving outcomes of better accessing to qualified personnel and
focusing on core competencies. Firms are seeking talent in emerging countries because
developed countries lack enough science and engineering graduates (Massini & Lewin,
2012; Lewin, et al., 2009), and this is an important driver behind offshoring innovation
activities. Weak intellectual protection regimes are a concern in many emerging
economies (Bardhan & Jaffee, 2005), which may explain why IPR protection strength
in host countries is negatively related to the probability of achieving an outcome of
better accessing to qualified personnel. Although firms will face the risk that
competitors may steal their intellectual property and proprietary processes if they
offshore innovation activities to countries with weak IPR protection (Aron & Singh,
2005), firms also gain the opportunities to learn about their competitors’ technologies in
such countries. This could explain why the quality of IPR protection in host countries is
negatively related to achieving the outcome of better focusing on core competencies. In
addition, the cheap labour and availability of talent in countries with weak IPR
protection may attract firms to offshore non-core innovation activities to these
countries, which, on the other hand, can also help firms to better focus on core
competencies.
Scholars argue that offshoring of higher skilled functions is mainly driven by
availability of qualified personnel (Bunyaratavej, et al., 2007), which can give firms of
all sizes the opportunity to source this talent which are located globally instead of
having to rely solely on domestic resources (Nieto & Rodríguez, 2011). Firms can
utilise the available pool of resources overseas and are able to improve their innovation
capabilities (Nieto & Rodríguez, 2011), which could explain that the number of R&D
researchers in host countries has positive effect on achieving the outcome of
152
breakthrough process improvement(s). Furthermore, our results also show that when
offshoring innovation activities to countries with higher number of R&D researchers,
firms are more likely to improve organisational flexibility, productivity/efficiency, and
service quality.
This study has focused on analysing the influence of institutional factors (rule of law
and IPR protection in host countries) on the offshore governance choices, especially the
influence the institutional factors and governance misalignment have on the outcomes
which can be achieved via offshoring. We believe this paper contributes to a better
understanding of offshore governance choices and the roles that institutional factors
play during offshoring, and have extended previous work regarding the relationship
between governance choices and firm performance by focusing on innovation
offshoring. The results support our conceptual framework that TCE, RBV, and
institutional theory should be integrated when analysing firm’s offshore governance
choices and the achievement of their outcomes.
The findings of this paper can provide guidance to decision makers in corporations
regarding what needs to be considered when choosing a certain governance mode, and
the role of the institutional environment of the countries they plan to offshore to. It
could also give insight to policy makers in host countries for attracting offshoring
activities by reinforcing its institutional regimes, in particular IPR and rule of law.
Regarding the limitations of this paper, although the ORN database contains
comprehensive information of offshoring, the latest survey was conducted in 2011, due
to the fast development and changes in the real business world, new updated surveys
could be designed and conducted in the future. Furthermore, the empirical analysis
treats governance choices as dichotomous, but firms may select varied governance
solutions to deal with different tasks in practice and engage in collaborations, joint
ventures, so that governance choices in reality appear as a spectrum in between the two
extremes considered in this study. However, in the ORN database there are only few
cases of such intermediate governance modes which would have not allowed for robust
analyses. In-depth interviews could also be conducted in future research to test the
validity of our findings, and filling the gaps which cannot be addressed in empirical
analysis, as well as learning how MNCs manage and coordinate their R&D activities
offshore and onshore.

153
References
Anderson, E. & Gatignon, H., 1986. Modes of Foreign Entry: A Transaction Cost
Analysis and Propositions. Journal of International Business Studies, 17(3), pp. 1-26.
Apple, 2018. Apple. [Online]
Available at: www.apple.com
[Accessed 20 08 2018].
Aron, R. & Singh, J. V., 2005. Get offshoring right. Harvard Business Review, 83(12),
pp. 135-143.
Bardhan, A. D. & Jaffee, D. M., 2005. Innovation, R&D and offshoring. Fisher Center
for Real Estate & Urban Economics.
Barney, J., 1991. Firm Resources and Sustained Competitive Advantage. Journal of
Management, 17(1), pp. 99-120.
Barro, R. J., 2000. Rule of law, democracy and economic performance. In: Index of
economic freedom. New York: Heritage Foundation, pp. 31-51.
Bertrand, O., 2011. What goes around, comes around: Effects of offshore outsourcing
on the export performance of firms. Journal of International Business Studies, 42(2),
pp. 334-344.
Brander, J. A., Cui, V. & Vertinsky, I., 2017. China and intellectual property rights: A
challenge to the rule of law. Journal of International Business Studies, 48(7), pp. 908-
921.
Brouthers, K. D., 2002. Institutional, Cultural and Transaction Cost Influences on Entry
Mode Choice and Performance. Journal of International Business Studies, 33(2), pp.
203-221.
Bryson, J. R., 2007. The 'second'global shift: The offshoring or global sourcing of
corporate services and the rise of distanciated emotional labour. Geografiska Annaler:
Series B, Human Geography, 89(Supplement s1), pp. 31-43.
Bunyaratavej, K., Hahn, E. D. & Doh, J. P., 2007. International offshoring of services:
A parity study. Journal of International Management, 13(1), pp. 7-21.
Caniato, F. et al., 2015. Location drivers, governance model and performance in service
offshoring. International Journal of Production Economics, Volume 163, pp. 189-199.
Carson, S. J., Madhok, A. & Wu, T., 2006. Uncertainty, Opportunism, and Governance:
The Effects of Volatility and Ambiguity on Formal and Relational Contracting. The
Academy of Management Journal, 49(5), pp. 1058-1077.
Chadee, D. & Roxas, B., 2013. Institutional environment, innovation capacity and firm
performance. Critical perspectives on international business, 9(1/2), pp. 19-39.
Chung, W. & Alcácer, J., 2002. Knowledge Seeking and Location Choice of Foreign
Direct Investment in the United States. Management Science, 48(12), pp. 1534-1554.

154
Contractor, F. J., Kumar, V., Kundu, S. K. & Pedersen, T., 2010. Reconceptualizing the
firm in a world of outsourcing and offshoring: The organizational and geographical
relocation of high‐value company functions. Journal of management studies, 47(8), pp.
1417-1433.
Doh, J. P., Bunyaratavej, K. & Hahn, E. D., 2009. Separable but Not Equal: The
Location Determinants of Discrete Services Offshoring Activities. Journal of
International Business Studies, 40(6), pp. 926-943.
Dow Jones News Service, 1988. Apple Computer Revamps Sales, Marketing Areas.
[Online]
Available at: https://global-factiva-com
[Accessed 20 08 2018].
Elia, S., Caniato, F., Luzzini, D. & Piscitello, L., 2014. Governance choice in global
sourcing of services: The impact on service quality and cost saving performance. Global
Strategy Journal, 4(3), pp. 181-199.
Ernst, D., 2006. Innovation offshoring: Asia’s emerging role in global innovation
networks, Honolulu: East-West Center.
Farrell, D. D., 2005. Offshoring: Value creation through economic change. Journal of
management studies, 42(3), pp. 675-683.
Flores, R. G. & Aguilera, R. V., 2007. Globalization and location choice: an analysis of
US multinational firms in 1980 and 2000. Journal of International Business Studies,
38(7), pp. 1187-1210.
Gooris, J. & Peeters, C., 2014. Home–Host Country Distance in Offshore Governance
Choices. Journal of International Management, 20(1), pp. 73-86.
Gooris, J. & Peeters, C., 2016. Fragmenting global business processes: A protection for
proprietary information. Journal of International Business Studies, 47(5), pp. 535-562.
Grant, R. M., 1996. Toward a knowledge-based theory of the firm. Strategic
Management Journal, 17(S2), pp. 109-122.
Griffith, D. A., Harmancioglu, N. & Droge, C., 2009. Governance decisions for the
offshore outsourcing of new product development in technology intensive markets.
Journal of World Business, 44(3), pp. 217-224.
Grimpe, C. & Kaiser, U., 2010. Balancing internal and external knowledge acquisition:
The gains and pain from R&D outsourcing. Journal of Management Studies, 47(8), pp.
1483-1509.
Gupta, A., Seshasai, S., Mukherji, S. & Ganguly, A., 2007. Offshoring: The transition
from economic drivers toward strategic global partnership and 24-hour knowledge
factory. Journal of Electronic Commerce in Organizations, 5(2), pp. 1-23.
Heckman, J. J., 1979. Sample Selection Bias as a Specification Error. Econometrica,
47(1), pp. 153-161.
155
Hofstede, G., 2001. Culture's consequences: Comparing values, behaviors, institutions
and organizations across nations. CA: Sage Publications.
Holcomb, T. R. & Hitt, M. A., 2007. Toward a model of strategic outsourcing. Journal
of Operation Management, 25(2), pp. 464-481.
Hutzschenreuter, T., Lewin, A. Y. & Dresel, S., 2011. Governance modes for offshoring
activities: a comparison of US and German firms. International Business Review, 20(3),
pp. 291-313.
Jain, N. K., Kundu, S. K. & Niederman, F. A., 2008. Offshoring Propensity in
Information Technology Services: A Firm and Country Level Analysis. Management
International Review, 48(4), pp. 447-461.
Javalgi, R. G., Dixit, A. & Scherer, R. F., 2009. Outsourcing to emerging markets:
Theoretical perspectives and policy implications. Journal of International Management,
15(2), pp. 156-168.
Jensen, P. D. Ø., 2009. A learning perspective on the offshoring of advanced services.
Journal of International Management, 15(2), pp. 181-193.
Jensen, P. D. Ø. & Pedersen, T., 2012. Offshoring and international competitiveness:
antecedents of offshoring advanced tasks. Journal of the Academy of Marketing
Science, 40(2), pp. 313-328.
Kaufmann, D., Kraay, A. & Mastruzzi, M., 2003. Governance Matters Iii: Governance
Indicators for 1996-2002. World Bank Policy Research Working Paper No. 3106.
Kedia, B. L. & Lahiri, S., 2007. International outsourcing of services: A partnership
model. Journal of International Management , 13(1), pp. 22-37.
Kinkel, S. & Maloca, S., 2009. Drivers and antecedents of manufacturing offshoring
and backshoring – a German perspective. Journal of Purchasing & Supply
Management, 15(3), pp. 154-165.
Kogut, B. & Singh, H., 1988. The Effect of National Culture on the Choice of Entry
Mode. Journal of International Business Studies, 19(3), pp. 411-432.
Korea Economic Weekly, 1990. RCA, Samsung set up HDTV research center in US..
[Online]
Available at: https://global-factiva-com
[Accessed 20 08 2018].
Kotabe, M., Mol, M. J. & Murray, J. U., 2008. Outsourcing, performance, and the role
of e-commerce: A dynamic perspective. Industrial Marketing Management, 37(1), pp.
37-45.
Kotabe, M. & Murray, J. Y., 2004. Global sourcing strategy and sustainable competitive
advantage. Industrial Marketing Management, 33(1), pp. 7-14.
Kotlarsky, J. & Oshri, I., 2008. Country attractiveness for offshoring and offshore
outsourcing: additional considerations. Journal of Information Technology, 23(4), pp.
228-231.

156
Kshetri, N., 2007. Institutional factors affecting offshore business process and
information technology outsourcing. Journal of International Management, 13(1), pp.
38-56.
Lacity, M. C., Khan, S. A. & Willcocks, L. P., 2009. A review of the IT outsourcing
literature: Insights for practice. The Journal of Strategic Information Systems, 18(3), pp.
130-146.
Leiblein, M. J. & Miller, D. J., 2003. An Empirical Examination of Transaction- and
Firm-Level Influences on the Vertical Boundaries of the Firm. Strategic Management
Journal, 24(9), pp. 839-859.
Leiblein, M. J., Reuer, J. J. & Dalsace, F., 2002. Do make or buy decisions matter? The
influence of organizational governance on technological performance. Strategic
Management Journal, 23(9), pp. 817-833.
Levie, J. & Autio, E., 2011. Regulatory Burden, Rule of Law, and Entry of Strategic
Entrepreneurs: An International Panel Study. Journal of Management Studies, 48(6),
pp. 1392-1419.
Lewin, A. & Couto, V., 2007. Next generation offshoring: the globalization of
innovation. Durham: Duke Center for International Business Education and Research
(CIBER).
Lewin, A. Y., Massini, S. & Peeters, C., 2009. Why Are Companies Offshoring
Innovation? The Emerging Global Race for Talent. Journal of International Business
Studies, 40(6), pp. 901-925.
Lewin, A. Y. & Volberda, H. W., 2011. Co-evolution of global sourcing: The need to
understand the underlying mechanisms of firm-decisions to offshore. International
Business Review, 20(3), pp. 241-251.
Luo, Y., Wang, S. L., Jayaraman, V. & Zheng , Q., 2013. Governing business process
offshoring: Properties, processes, and preferred modes. Journal of World Business,
48(3), pp. 407-419.
Manning, S., Massini, S. & Lewin, A. Y., 2008. A dynamic perspective on next-
generation offshoring: the global sourcing of science and engineering talent. Academy of
Management Perspectives, 22(3), pp. 35-54.
Manning, S., Massini, S. & Lewin, A. Y., 2008. A dynamic perspective on next-
generation offshoring: The global sourcing of science and engineering talent. The
Academy of Management Perspectives, 22(3), pp. 35-54.
Manning, S., Massini, S., Peeters, C. & Lewin, A. Y., 2018. The changing rationale for
governance choices: Early vs. late adopters of global services sourcing. Strategic
Management Journal, 39(8), pp. 2303-2334.
Massini, S. & Lewin, A. Y., 2012. Global Sourcing of Business Services: A
Coevolutionary Analysis. In: C. L. Wang, D. J. Ketchen & D. D. Bergh, eds. West
Meets East: Building Theoretical Bridges. Bingley: Emerald Group Publishing Limited,
pp. 323-355.
157
Meyer, K. E., Wright, M. & Pruthi, S., 2009. Managing Knowledge in Foreign Entry
Strategies: A Resource-Based Analysis. Strategic Management Journal, 30(5), pp. 557-
574.
Microsoft, 2018. Microsoft. [Online]
Available at: www.microsoft.com
[Accessed 20 08 2018].
Mudambi, S. M. & Tallman, S., 2010. Make, buy or ally? Theoretical perspectives on
knowledge process outsourcing through alliances. Journal of Management Studies,
47(8), pp. 1434-1456.
Nassimbeni, G., Sartor, M. & Dus, D., 2012. Security risks in service offshoring and
outsourcing. Industrial Management & Data Systems, 112(3), pp. 405-440.
Newswire, 2001. MS backs Britain's budding businesses. [Online]
Available at: https://global-factiva-com
[Accessed 20 08 2018].
Nieto, M. J. & Rodríguez, A., 2011. Offshoring of R&D: Looking abroad to improve
innovation performance. Journal of International Business Studies , 42(3), pp. 345-361.
Oliver, C., 1997. Sustainable competitive advantage: combining institutional and
resource-based views. Strategic Management Journal, 18(9), pp. 697-713.
Oxley, J. E., 1999. Institutional environment and the mechanisms of governance: the
impact of intellectual property protection on the structure of inter-firm alliances.
Journal of Economic Behavior & Organization, 38(3), pp. 283-309.
Paju, T., 2007. Conceptual model of R&D offshore outsourcing. Journal of Global
Business and Technology, 3(1), pp. 49-61.
Park, W. G., 2008. International patent protection: 1960–2005. Research Policy, 37(4),
pp. 761-766.
Peng, M. W., 2004. Outside directors and firm performance during institutional
transitions. Strategic Management Journal, 25(5), pp. 453-471.
PR Newswire, 1996. Samsung Electronics Opens US$30.2 Million Research Institute In
The United Kingdom. [Online]
Available at: https://global-factiva-com
[Accessed 20 08 2018].
Quinn, J., 2000. Outsourcing Innovation: The New Engine of Growth. Sloan
Management Review, 41(4), p. 13.
Quinn, J. B. & Hilmer, F. G., 1994. Strategic Outsourcing. Sloan Management Review,
35(4), pp. 43-55.
Razzaque, M. A. & Sheng, C. C., 1998. Outsourcing of logistics functions: a literature
survey. International Journal of Physical Distribution & Logistics Management, 28(2),
pp. 89-107.

158
Rigobon, R. & Rodrik, D., 2005. Rule of law, democracy, openness, and income:
Estimating the interrelationships. Economics of Transition, 13(3), pp. 533-564.
Roza, M., Bosch, F. A. V. d. & Volberda, H. W., 2011. Offshoring strategy: Motives,
functions, locations, and governance modes of small, medium-sized and large firms.
International Business Review, 20(3), pp. 314-323.
Samsung, 2018. Samsung. [Online]
Available at: https://www.samsung.com/uk/aboutsamsung/company/history/
[Accessed 20 08 2018].
Shavers, J. M., 1998. Accounting for Endogeneity When Assessing Strategy
Performance: Does Entry Mode Choice Affect FDI Survival?. Management Science,
44(4), pp. 571-585.
Siems, T. F. & Ratner, A. S., 2003. Do What You Do Best, Outsource the Rest?.
Southwest Economy, Volume 6, pp. 13-14.
Si, M., 2016. Apple sets up its first R&D center in China. [Online]
Available at: https://global-factiva-com
[Accessed 20 08 2018].
Steensma, H. K. & Fairbank, J. F., 1999. Internalizing external technology: a model of
governance mode choice and an empirical assessment. The Journal of High Technology
Management Research, 10(1), pp. 1-35.
Teece, D. J., Pisano, G. & Shuen, A., 1997. Dynamic Capabilities and Strategic
Management. Strategic Management Journal, 18(7), pp. 509-533.
The Economic Times, 2000. Samsung to put $10m in India R&D unit Our Bureau.
[Online]
Available at: https://global-factiva-com
[Accessed 20 08 2018].
The Korea Herald, 2001. Samsung resolves to meet Chinese challenge. [Online]
Available at: https://global-factiva-com
[Accessed 20 08 2018].
The Times of India, 1998. Microsoft to set up shop in Hyderabad The Times of India
News Service.. [Online]
Available at: https://global-factiva-com
[Accessed 20 08 2018].
Vietnam News Summary, 2017. Apple Chooses India over Vietnam to Build $1 Billion
R&D Center: JLL. [Online]
Available at: https://global-factiva-com
[Accessed 20 08 2018].
Williamson, O. E., 1985. The Economic Institutions of Capitalism. 1 ed. New York:
Free Press.
Williamson, O. E., 1991. Comparative Economic Organization: The Analysis of
Discrete Structural Alternatives. Administrative Science Quarterly,, 36(2), pp. 269-296.

159
Williamson, O. E., 1992. Markets, hierarchies, and the modern corporation: An
unfolding perspective. Journal of Economic Behavior & Organization, 17(3), pp. 335-
352.
Wooldridge, J. M., 2012. Introductory Econometric: A Modern Approach. 5 ed. Mason:
CENGAGE Learning.
Wuxi Apptec, 2018. Wuxi Apptec. [Online]
Available at: https://www.wuxiapptec.com.cn/investor.html
[Accessed 20 08 2018].
Xinhua News Agency, 1998. China Becomes Important Microsoft Research Base..
[Online]
Available at: https://global-factiva-com
[Accessed 20 08 2018].
Youngdahl, W. & Ramaswamy, K., 2008. Exploring new research frontiers in
offshoring knowledge and service processes. Journal of Operations Management,
26(2), pp. 135-140.
Zhao, M., 2006. Conducting R&D in Countries with Weak Intellectual Property Rights
Protection. Management Science, 52(8), pp. 1185-1199.
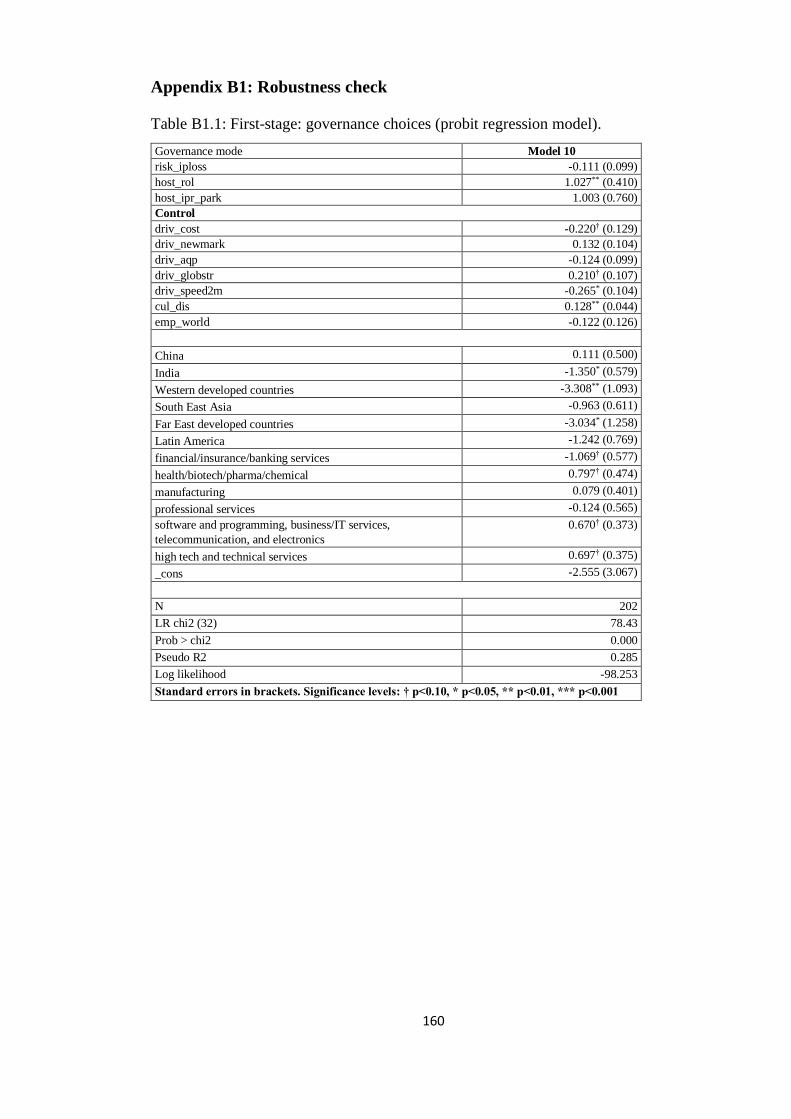
160
Appendix B1: Robustness check
Table B1.1: First-stage: governance choices (probit regression model).
Governance mode Model 10
risk_iploss -0.111 (0.099)
host_rol 1.027** (0.410)
host_ipr_park 1.003 (0.760)
Control
driv_cost -0.220† (0.129)
driv_newmark 0.132 (0.104)
driv_aqp -0.124 (0.099)
driv_globstr 0.210† (0.107)
driv_speed2m -0.265* (0.104)
cul_dis 0.128** (0.044)
emp_world -0.122 (0.126)
China 0.111 (0.500)
India -1.350* (0.579)
Western developed countries -3.308** (1.093)
South East Asia -0.963 (0.611)
Far East developed countries -3.034* (1.258)
Latin America -1.242 (0.769)
financial/insurance/banking services -1.069† (0.577)
health/biotech/pharma/chemical 0.797† (0.474)
manufacturing 0.079 (0.401)
professional services -0.124 (0.565)
software and programming, business/IT services,
telecommunication, and electronics
0.670† (0.373)
high tech and technical services 0.697† (0.375)
_cons -2.555 (3.067)
N 202
LR chi2 (32) 78.43
Prob > chi2 0.000
Pseudo R2 0.285
Log likelihood -98.253
Standard errors in brackets. Significance levels: † p<0.10, * p<0.05, ** p<0.01, *** p<0.001

161
Table B1.2: Second-stage regression results. Dependent variables: probability of
achieving the outcomes of “better focus on core competencies” and “better access to
qualified personnel”.
Core competencies
(Model 11)
Access to qualified personnel
(Model 12)
Without Mills ratio With Mills ratio Without Mills ratio With Mills ratio
fail_cap -0.384 (0.332) 0.291 (0.376) -0.003 (0.331) 0.599 (0.381)
fail_out -0.305 (0.315) -0.751* (0.337) -0.323 (0.312) -0.712* (0.336)
host_rol 0.581 (0.398) 1.553** (0.472) -0.525 (0.395) 0.234 (0.458)
host_ipr_park -0.340 (0.748) -0.669 (0.761) -0.217 (0.727) -0.483 (0.738)
Control
captive_mode -0.149 (0.292) 0.569 (0.347) -0.252 (0.291) 0.364 (0.348)
cul_dis 0.005 (0.118) -0.089 (0.121) 0.159 (0.118) 0.097 (0.121)
host_res 0.193 (0.431) 0.019 (0.435) 0.226 (0.427) 0.078 (0.431)
emp_world 0.013 (0.042) 0.098* (0.047) -0.037 (0.041) 0.031 (0.047)
mills 1.266** (0.326) 1.074** (0.328)
China 0.059 (0.479) 0.298 (0.487) 0.583 (0.476) 0.798† (0.484)
India -0.353 (1.366) -1.744 (1.421) 1.544 (1.347) 0.470 (1.395)
Western developed countries -0.288 (0.989) -1.786† (1.070) 2.332* (0.973) 1.227 (1.033)
South East Asia 0.014 (1.285) -0.663 (1.305) 0.935 (1.268) 0.395 (1.287)
Far East developed countries -1.517 (1.090) -3.143** (1.177) 1.458 (1.067) 0.245 (1.133)
Latin America -0.059 (0.846) -1.453 (0.923) 1.072 (0.846) -0.045 (0.920)
financial/insurance/banking services -0.356 (0.405) -1.763** (0.546) 0.556 (0.410) -0.577 (0.537)
health/biotech/pharma/chemical -0.001 (0.484) 0.481 (0.503) -0.318 (0.483) -0.065 (0.501)
manufacturing -0.272 (0.332) -0.356 (0.336) -0.125 (0.324) -0.193 (0.327)
professional services 1.079† (0.570) 1.205* (0.572) 1.302* (0.589) 1.451* (0.597)
software and programming, business/IT
services, telecommunication, and
electronics
-0.403 (0.302) -0.144 (0.312) 0.388 (0.298) 0.645* (0.309)
high tech and technical services 0.037 (0.370) 0.487 (0.391) -0.185 (0.364) 0.174 (0.381)
cut 1 -2.555 (5.291) -3.710 (5.343) -0.568 (5.192) -1.359 (5.236)
cut 2 -1.658 (5.288) -2.731 (5.338) 0.603 (5.181) -0.157 (5.225)
cut 3 -0.628 (5.287) -1.638 (5.338) 1.478 (5.187) 0.760 (5.230)
cut 4 0.928 (5.290) -0.011 (5.339) 2.819 (5.189) 2.162 (5.231)
N 161 161 161 161
LR chi2 (32) 38.37 53.79 33.81 44.76
Prob > chi2 0.008 0.000 0.027 0.002
Pseudo R2 0.089 0.124 0.079 0.104
Log likelihood -197.349 -189.637 -198.114 -192.641
Standard errors in brackets. Significance levels: † p<0.10, * p<0.05, ** p<0.01, *** p<0.001

162
Table B1.3:Second-stage regression results. Dependent variables: probability of
achieving the outcomes of “improved organisational flexibility.
Organizational flexibility
(Model 13)
Firm's overall competitiveness
(Model 14)
Without Mills ratio With Mills ratio Without Mills ratio With Mills ratio
fail_cap 0.517 (0.343) 1.063** (0.390) 0.159 (0.332) 0.253 (0.375)
fail_out -0.168 (0.315) -0.502 (0.335) -0.496 (0.327) -0.550 (0.342)
host_rol -0.068 (0.401) 0.665 (0.471) -0.456 (0.406) -0.323 (0.474)
host_ipr_park -1.407† (0.747) -1.716* (0.765) -0.658 (0.746) -0.703 (0.751)
Control
captive_mode -0.370 (0.293) 0.177 (0.346) 0.441 (0.304) 0.535 (0.350)
cul_dis 0.053 (0.121) -0.014 (0.125) -0.105 (0.120) -0.120 (0.123)
host_res 0.370 (0.453) 0.278 (0.465) 0.271 (0.436) 0.244 (0.428)
emp_world -0.064 (0.041) -0.000 (0.047) 0.038 (0.042) 0.050 (0.048)
mills 0.982** (0.328) 0.173 (0.320)
China 0.266 (0.507) 0.511 (0.526) 0.135 (0.476) 0.171 (0.480)
India 0.441 (1.413) -0.473 (1.471) 0.319 (1.380) 0.122 (1.427)
Western developed countries 0.722 (0.970) -0.387 (1.040) 1.211 (0.991) 1.002 (1.064)
South East Asia 1.048 (1.399) 0.728 (1.455) 0.266 (1.281) 0.171 (1.293)
Far East developed countries 0.176 (1.096) -1.004 (1.174) 0.286 (1.069) 0.074 (1.139)
Latin America 0.282 (0.874) -0.680 (0.944) 0.863 (0.875) 0.669 (0.944)
financial/insurance/banking services 0.600 (0.408) -0.441 (0.537) -1.136** (0.411) 1.327* (0.541)
health/biotech/pharma/chemical 0.261 (0.482) 0.649 (0.503) -2.031*** (0.537) -1.987*** (0.544)
manufacturing 1.080** (0.339) 1.086** (0.342) -0.851* (0.341) -0.860 (0.342)
professional services 0.978† (0.556) 1.086† (0.561) 0.517 (0.567) 0.532 (0.567)
software and programming, business/IT
services, telecommunication, and
electronics
0.217 (0.300) 0.459 (0.314) -0.470 (0.312) -0.427 (0.321)
high tech and technical services -0.375 (0.368) -0.022 (0.388) -0.870* (0.380) -0.803* (0.399)
cut 1 -5.747 (5.304) -6.425 (5.355) -3.249 (5.334) -3.420 (5.343)
cut 2 -4.432 (5.281) -5.068 (5.329) -2.245 (5.327) -2.402 (5.334)
cut 3 -3.383 (5.279) -3.993 (5.327) -1.446 (5.328) -1.598 (5.334)
cut 4 -2.005 (5.276) -2.558 (5.322) -0.106 (5.330) -0.262 (5.336)
N 161 161 160 160
LR chi2 (32) 50.53 59.64 44.48 44.78
Prob > chi2 0.000 0.000 0.001 0.002
Pseudo R2 0.119 0.140 0.100 0.101
Log likelihood -187.626 -183.069 -200.524 -200.378
Standard errors in brackets. Significance levels: † p<0.10, * p<0.05, ** p<0.01, *** p<0.001

163
Table B1.4: Second-stage regression results. Dependent variables: probability of
achieving the outcomes of “increased productivity/efficiency” and “improved service
quality”.
Increased productivity/efficiency
(Model 15)
Improved service quality
(Model 16)
Without Mills ratio With Mills ratio Without Mills ratio With Mills ratio
fail_cap -0.720* (0.329) -0.227 (0.370) -0.580† (0.330) -0.413 (0.370)
fail_out 0.067 (0.311) -0.252 (0.330) 0.003 (0.312) -0.103 (0.330)
host_rol 0.220 (0.395) 0.900* (0.466) -0.794* (0.396) -0.571 (0.456)
host_ipr_park -0.497 (0.727) -0.711 (0.734) -0.387 (0.716) -0.450 (0.719)
Control
captive_mode -0.338 (0.288) 0.194 (0.341) -0.369 (0.289) -0.193 (0.339)
cul_dis -0.108 (0.115) -0.179 (0.118) -0.145 (0.116) -0.167 (0.118)
host_res 0.038 (0.423) -0.082 (0.425) 0.797† (0.423) 0.759† (0.425)
emp_world -0.021 (0.040) 0.041 (0.045) 0.023 (0.041) 0.043 (0.045)
mills 0.931** (0.315) 0.305 (0.308)
China 0.666 (0.475) 0.878† (0.483) 0.571 (0.471) 0.632 (0.476)
India -0.130 (1.339) -1.072 (1.379) 2.221† (1.329) 1.915 (1.364)
Western developed countries 0.261 (0.965) -0.787 (1.032) 1.633† (0.969) 1.277 (1.033)
South East Asia -0.108 (1.255) -0.553 (1.267) 2.381† (1.252) 2.236† (1.261)
Far East developed countries -0.187 (1.059) -1.289 (1.126) 1.633 (1.064) 1.264 (1.127)
Latin America 0.217 (0.833) -0.754 (0.898) 1.479† (0.841) 1.161 (0.900)
financial/insurance/banking services 0.183 (0.398) -0.803 (0.520) 0.243 (0.399) -0.084 (0.518)
health/biotech/pharma/chemical -0.402 (0.483) -0.067 (0.499) -0.214 (0.476) -0.104 (0.489)
manufacturing 0.029 (0.325) -0.009 (0.327) 0.652* (0.328) 0.637† (0.328)
professional services 0.816 (0.555) 0.929† (0.557) -2.048*** (0.586) 2.078*** (0.586)
software and programming, business/IT
services, telecommunication, and
electronics
0.391 (0.299) 0.633* (0.312) -0.034 (0.295) 0.034 (0.303)
high tech and technical services 0.366 (0.366) 0.714† (0.386) 0.370 (0.362) 0.482 (0.379)
cut 1 -3.815 (5.176) -4.408 (5.197) 2.666 (5.089) 2.518 (5.092)
cut 2 -3.117 (5.176) -3.659 (5.197) 3.994 (5.083) 3.851 (5.087)
cut 3 -2.129 (5.176) -2.635 (5.196) 5.128 (5.091) 4.994 (5.094)
cut 4 -1.056 (5.175) -1.511 (5.194) 6.028 (5.097) 5.893 (5.101)
N 161 161 161 161
LR chi2 (32) 28.10 36.91 43.11 44.09
Prob > chi2 0.107 0.017 0.002 0.002
Pseudo R2 0.061 0.080 0.094 0.096
Log likelihood -217.445 -213.041 -208.701 -208.211
Standard errors in brackets. Significance levels: † p<0.10, * p<0.05, ** p<0.01, *** p<0.001
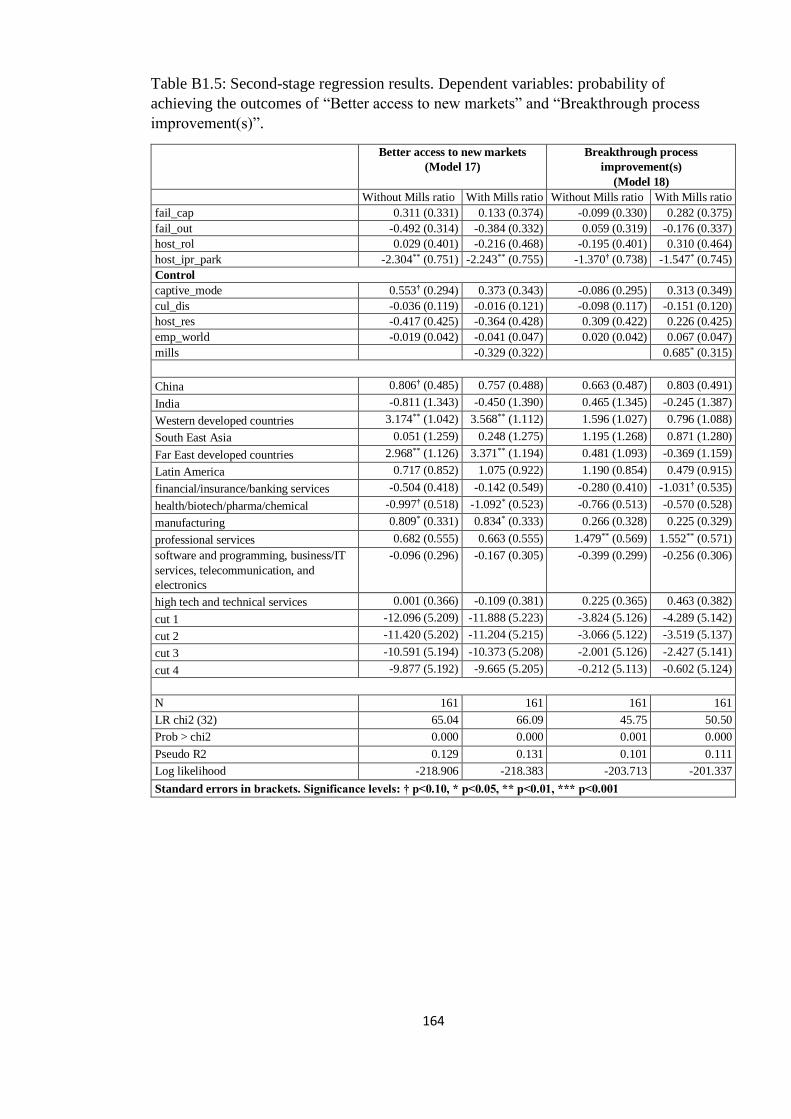
164
Table B1.5: Second-stage regression results. Dependent variables: probability of
achieving the outcomes of “Better access to new markets” and “Breakthrough process
improvement(s)”.
Better access to new markets
(Model 17)
Breakthrough process
improvement(s)
(Model 18)
Without Mills ratio With Mills ratio Without Mills ratio With Mills ratio
fail_cap 0.311 (0.331) 0.133 (0.374) -0.099 (0.330) 0.282 (0.375)
fail_out -0.492 (0.314) -0.384 (0.332) 0.059 (0.319) -0.176 (0.337)
host_rol 0.029 (0.401) -0.216 (0.468) -0.195 (0.401) 0.310 (0.464)
host_ipr_park -2.304** (0.751) -2.243** (0.755) -1.370† (0.738) -1.547* (0.745)
Control
captive_mode 0.553† (0.294) 0.373 (0.343) -0.086 (0.295) 0.313 (0.349)
cul_dis -0.036 (0.119) -0.016 (0.121) -0.098 (0.117) -0.151 (0.120)
host_res -0.417 (0.425) -0.364 (0.428) 0.309 (0.422) 0.226 (0.425)
emp_world -0.019 (0.042) -0.041 (0.047) 0.020 (0.042) 0.067 (0.047)
mills -0.329 (0.322) 0.685* (0.315)
China 0.806† (0.485) 0.757 (0.488) 0.663 (0.487) 0.803 (0.491)
India -0.811 (1.343) -0.450 (1.390) 0.465 (1.345) -0.245 (1.387)
Western developed countries 3.174** (1.042) 3.568** (1.112) 1.596 (1.027) 0.796 (1.088)
South East Asia 0.051 (1.259) 0.248 (1.275) 1.195 (1.268) 0.871 (1.280)
Far East developed countries 2.968** (1.126) 3.371** (1.194) 0.481 (1.093) -0.369 (1.159)
Latin America 0.717 (0.852) 1.075 (0.922) 1.190 (0.854) 0.479 (0.915)
financial/insurance/banking services -0.504 (0.418) -0.142 (0.549) -0.280 (0.410) -1.031† (0.535)
health/biotech/pharma/chemical -0.997† (0.518) -1.092* (0.523) -0.766 (0.513) -0.570 (0.528)
manufacturing 0.809* (0.331) 0.834* (0.333) 0.266 (0.328) 0.225 (0.329)
professional services 0.682 (0.555) 0.663 (0.555) 1.479** (0.569) 1.552** (0.571)
software and programming, business/IT
services, telecommunication, and
electronics
-0.096 (0.296) -0.167 (0.305) -0.399 (0.299) -0.256 (0.306)
high tech and technical services 0.001 (0.366) -0.109 (0.381) 0.225 (0.365) 0.463 (0.382)
cut 1 -12.096 (5.209) -11.888 (5.223) -3.824 (5.126) -4.289 (5.142)
cut 2 -11.420 (5.202) -11.204 (5.215) -3.066 (5.122) -3.519 (5.137)
cut 3 -10.591 (5.194) -10.373 (5.208) -2.001 (5.126) -2.427 (5.141)
cut 4 -9.877 (5.192) -9.665 (5.205) -0.212 (5.113) -0.602 (5.124)
N 161 161 161 161
LR chi2 (32) 65.04 66.09 45.75 50.50
Prob > chi2 0.000 0.000 0.001 0.000
Pseudo R2 0.129 0.131 0.101 0.111
Log likelihood -218.906 -218.383 -203.713 -201.337
Standard errors in brackets. Significance levels: † p<0.10, * p<0.05, ** p<0.01, *** p<0.001

165
Chapter 5: Why do multinational firms locate R&D to China?
An analysis of the determinants of location strategies
Abstract
In this paper, we use patent data to examine the proportion of four strategies that
multinationals have adopted to offshore R&D activities to China, i.e., Technology
Building (TB), Market Seeking (MS), Technology Augmenting (TA), and Technology
Exploiting (TE) in the pharmaceutical industry and in the computer and electronics
industry. Our results show that TB and TA were the two most important location
strategies adopted by firms before 2000, but since then the importance of MS and TE
has been gradually increasing, especially for firms in computer and electronics industry.
In particular, the regression results suggest that IPR protection strength in China is
positively associated to MS and TE, but negatively associated to TB and TA. This
indicates that when the IPR protection in China is stronger, firms are more willing to
locate technologies that China is not specialised in there. We also find support for the
role that institutional factors (i.e., institutional distance, IPR protection of firm’s home
country, and the rule of law in host country) play on the choice of location strategies
MNCs adopted in China. These findings are somewhat in contrast to previous studies
which indicate that TE is the leading motive for FDI of R&D in China since China is a
manufacturing base with a large internal market and weak IPR protection.
5.1 Introduction
The Chinese government adopted an “open-door” policy in 1978 to attract Foreign
direct investments (FDI). Since then, an increasing number of Multinational
Corporations (MNCs) have located labour-intensive manufacturing activities to China,
initially very standardised activities, they are gradually becoming increasingly advanced
in nature (Manning, et al., 2008). China is emerging as a research and development
(R&D) hub, possibly because of the government push to promote science and
innovation and a race by Chinese companies to catch up with Western competitors
(Fingar, 2015). According to a report in the Financial Times, between January 2010 and
166
December 2014, China attracted 88 greenfield R&D projects from foreign firms, which
involved a remarkable 5.5 billion USD capital investment (Fingar, 2015).
Previous studies have identified that the two main motives that drive MNCs to
internationalise their R&D activities are exploiting a firm’s technology advantages that
are developed at home, and augmenting a firm’s existing technology advantages by
utilising new knowledge resources in a firm’s overseas R&D sites (Kuemmerle, 1999).
With regard to China as host country of R&D activities, scholars argue that the former
motive is the one that MNCs initially pursued before early 2000s, and the importance of
the latter one is gradually increasing due to the growing domestic market size, potential,
and increasing subsidiary capabilities (Bruche, 2009; Motohashi, 2012). However, the
empirical basis for this is scarce and needs further analysis.
In this paper we are interested in the motives, strategies and factors affecting R&D
activities of MNCs in China. We first present an overview of MNCs’ strategies for
conducting innovation activities in China through their subsidiaries, and how the
strategies have evolved over time. Second, we identify what factors affect the different
strategies (i.e., efficiency seeking strategies, including market seeking and technology
exploiting; technology exploring strategies, including technology building and
technology augmenting) for foreign MNCs to conduct innovation activities in China,
with a focus on institutional factors (i.e. the IPR protection strength of firm’s home
country and China, the quality of rule of law in China, and the institutional distance
between firm’s home country and China).
We select the 79 top performing multinational firms by sales revenue that have
established wholly owned labs in China from two knowledge intensive industries ─
pharmaceutical industry and computer and electronics industry. By analysing the patent
data, we conclude that locating R&D activities to China are motivated not only by
efficiency seeking, but also by exploring the technology areas where China has an
advantage. We also find that institutional factors affect MNC’s motives for offshoring
R&D activities to China. Our findings contribute to existing literature and enhance our
understanding of modern innovation offshoring and multinationals’ R&D activities in
China.
This paper is organised by starting with a literature review on location strategies
(motives) and developing the conceptual framework of this research in section 5.2. In
167
section 5.3, we explain the procedure of sampling selection and present the data. In
sections 5.4 and 5.5, we report the descriptive data analysis results and regression
results. Section 6 concludes the paper and discusses the potential implications.
5.2 Developing a conceptual framework for MNCs location strategies
In this section, we start with reviewing previous studies regarding MNCs location
strategies, then building on relevant theories and frameworks, namely, the resource
based view (RBV) and institutional theory, we develop the conceptual framework of
this paper, and we identify the research gaps from which we derive the research
questions of this paper.
5.2.1 Location strategies
In this section, we review location strategies that MNCs have adopted when offshoring
R&D activities to different countries. Kuemmerle (1999) identified two main motives
that drive MNCs to offshore R&D activities: home-base-exploiting (HBE) and home-
base-augmenting (HBA). The former refers to exploiting advantages which are
developed at the firm’s home base, which include adapting products, services, and
production processes to meet the needs in overseas markets (Ernst, 2006; Kuemmerle,
1999). The latter means that the firm establish R&D sites overseas with the aim to
augment firm’s existing knowledge by transferring the new knowledge existing in its
overseas R&D sites back to its home base and integrate this knowledge for developing
new products or services (Ernst, 2006; Kuemmerle, 1999). In the international business
literature, HBE is also known as competence-creating subsidiary mandate, and HBA is
known as competence-exploiting subsidiary mandate or market-servicing investment
(Cantwell & Mudambi, 2005). Researchers have argued that the purposes for MNCs to
locate R&D abroad has evolved from adapting products to the local needs (HBE) to
gradually generating new technologies by utilising the resources and advantages in
some host countries (HBA) (Pearce, 1999; Kuemmerle, 1999; Cantwell & Piscitello,
2005).
Previous studies have stated that the R&D sites offshored to developed economies are
more likely to be driven by HBA because of the sufficient science and technology
168
resources that exist in those countries, but R&D activities offshored to developing
economies are more focused on product commercialisation and adaption (HBE) (Liu &
Chen, 2012). Kuemmerle (1999) argued that R&D in host countries that have a relative
attractive market will be more likely to be HBE driven, while R&D in host countries
that have a strong knowledge base and big pool of talent will be likely to be HBA.
However, it has been observed that this phenomenon is changing, since some
developing host countries now possess specific resources which can be used to
supplement the resources in firm’s home base, such as a great pool of qualified but
relative cheap talent available in China (Liu & Chen, 2012; Picci, 2010). In particular,
researchers found that the R&D activities conducted in China initially focused on HBE,
but gradually include HBA and HBE simultaneously (Bruche, 2009; Ernst, 2006).
The revealed technology advantage (RTA) index provides an indication of a firm’s
relative specialisation in terms of patents in selected technological domains (Patel &
Vega, 1999), e.g., an RTA index higher than one in a technology field in a firm’s
home/host country indicates that the firm has comparative advantage in that technology
field in its home/host country. An RTA index lower than one in a technology field in
firm’s home/host country indicates that the firm is comparatively weak in that
technology field in its home/host country. By comparing RTA index of a firm’s home
country and host country, using patent data granted by the United States Patent and
Trademark Office (USPTO) of 220 firms from 1990 to 1996, Patel and Vega (1999)
further categorised the drivers of MNCs to establish R&D overseas into 4 different
types of location strategies in R&D: Technology Seeking (TS), Market Seeking (MS),
HBA, and HBE. Patel and Vega (1999) found that HBA and HBE are the two main
motives that drive MNCs to establish R&D centres overseas, and limited evidence
suggesting that firms offshore R&D activities for the purpose of compensating the
technologies that are weak at home. They also found that firms in the electronics
industry show a higher share of cases that are driven by HBE, while pharmaceutical
firms present a higher share of cases that are driven by HBA (Patel & Vega, 1999). This
result is confirmed by Le Bas and Sierra (2002), who found that the location strategies
HBA and HBE represent the majority of cases. However, their findings also suggest that
HBA outperform HBE, and TS plays a slightly more important role than in Patel and
Vega’s study.

169
Laurens et al. (2015) used patent data from 2003 to 2005, and the findings are consistent
with previous studies, but also noted that the importance of HBA slightly decreased
while it increased for HBE. However, since MS and HBE indicate that the technology a
firm offshored is comparatively weak in its host country, while TS and HBA indicate
that the technology a firm offshored is comparative strong in its host country, it is
difficult to identify more fundamental differences between MS and HBE from the labels
of the location strategies, which is the same for TS and HBE location strategies.
Therefore, in order to better capture key differences between these four location
strategies, we change the name of TS, MS, HBA and HBE strategies to Technology
Building (TB), Market seeking (MS), Technology Augmenting (TA), and Technology
Exploiting (TE), respectively, on the basis of the relationship between RTA in home
and host country, as illustrated in Figure 5.1.
Figure 5.1: 4 types of location strategies of FDI in R&D.
5.2.2 The role of resources and institutions in locations strategies: a conceptual
framework
The RBV holds that firms’ resources can help them achieve sustained competitive
advantages if they have four attributes: valuable, rare, imperfectly imitable and
nonsubstitutable (Barney, 1991). Resources play an important role in strategic
Host country
Home country
Market Seeking (MS)This strategy indicates that the motivation behind such choices are not technology-oriented. As Le Bas and Sierra (2002) suggest, such FDI in R&D are mainly for the purpose of international expansion, via the mergers and acquisition (M&A) activities to gain access to the market.
Technology Building (TB)Aims to counteract home country weaknesses in a given technological field by offshoring R&D activities in such technology field to a host country with proven strength in that fields.
Technology exploiting (TE)Patel and Vega (1999) suggest, this strategy is very close to adaption/technical support function. Le Bas and Sierra (2002) labelled this strategy as “efficiency-oriented FDI in R&D”.
Technology augmenting (TA)This strategy can be adopted by a firm to strengthen its competitive advantage by closely monitoring the very sophisticated technology and improving its technological learning capability.
Home RTA>1Home RTA<1
Host RTA>1
Host RTA<1

170
management (Wu, 2010), as well as on the decisions of the firms’ boundaries (Teece, et
al., 1997). Obtaining access to resources that are not available in the home country is
one of the key driving forces for MNCs to locate R&D abroad (Manning, et al., 2008;
Schmeisser, 2013; Stringfellow, et al., 2008). Companies have faced increasing
difficulty of recruiting S&E talent with advanced degrees in the last two decades, and
have been searching for highly skilled S&E talent to support domestic innovation
activities (Farrell, 2005; Manning, et al., 2008; Lewin, et al., 2009; Demirbag &
Glaister, 2010). Countries with more specialised knowledge could provide firms with
location-specific advantages, and firms locating in these countries can obtain better
innovation inputs, greater flexibility, and thus enhanced innovation capabilities (Nieto
& Rodríguez, 2011). Offshoring can also increase diversity and heterogeneity in the
knowledge bases by gaining knowledge from multiple markets where MNCs are
operating (Nieto & Rodríguez, 2011; Gerybadze & Reger, 1999) and help MNCs to
improve their abilities to combine knowledge for innovation (D’Agostino, et al., 2013).
With regard to the four different location strategies, TB and TA refer to technologies in
which host countries are specialised (Patel & Vega, 1999), and accessing technological
resources in host countries is one of the main motives for MNCs to adopt such
strategies. Therefore, RBV is relevant to analyse these two location strategies.
Since resources are context based, their value depends on the characteristics of a given
environment (Teece, et al., 1997). More concretely, if MNCs intend to expand abroad
successfully, they need to balance the benefits of exploitation of resource-based
advantage with the costs of not being isomorphic with the institutional environment of
the host market (Brouthers, et al., 2008). Therefore, when analysing MNCs decisions
regarding locating R&D in China, institutional theory should also be adopted in addition
to RBV to provide a more comprehensive framework.
Firms offshoring innovation need to protect proprietary knowledge and technology
transferred across national borders, and face a complex variety of legal rules and
procedures (Oxley, 1999). Therefore, from the institutional theory perspective, the legal
system and its enforcement in a host country, which include rule of law and IPR
protection (Nassimbeni, et al., 2012), are important factors that firms need to consider
when they are making offshoring decisions (Javalgi, et al., 2009). Weak intellectual
protection regimes in many emerging economies may constitute a major concern, and
serve as a deterrent for offshoring innovation work (Bardhan & Jaffee, 2005), since

171
firms will face the risk that competitors may steal their intellectual property and
proprietary processes (Aron & Singh, 2005). Researchers have stated that firms’
decisions to offshore R&D services are also conditioned by firms’ home country IPR
system (Lewin & Volberda, 2011), and that weak IPR protection in home countries can
prevent firms from outsourcing in their domestic market (Martínez-Noya & García-
Canal, 2011). In addition, Flores and Aguilera (2007) found that MNCs prefer to locate
facilities to countries with similar institutional environment to their home countries, in
terms of legal, political and cultural dimensions. Therefore, the institutional distance
between a firm’s home country and the host country may affect decisions to offshore
R&D.
Historically, the weak intellectual property protection in China has been a serious
concern among foreign companies (Huang & Khanna, 2003). Studies have suggested
that firms offshore R&D activities with lower technological value-added or the lower-
end R&D value chain to countries with weak IPR protection such as China (Grimes &
Miozzo, 2015; Bruche, 2009; Zhao, 2006), and argue that strategically important R&D
activities will not be offshored or special methods will be adopted if MNCs offshore
innovation activities to China (Quan & Chesbrough, 2010; Zhao, 2006). However,
China amended its patent law in 2000 and its copyright and trademark laws in 2001 to
ensure that its IP system complied with the standards of the TRIPS Agreement, enabling
the country to join the WTO. China further amended the patent law for a third time in
2008 (Yu, 2018). It is claimed that the IPR regime in China is now improving
(Awokuse & Yin, 2010), but whether the improvement of the IPR protection in China
will strengthen firms’ commitment regarding offshoring valuable innovation activities is
still unknown.
The main purpose of MS strategy is to expand internationally to gain access to new
markets (Le Bas & Sierra, 2002), and this is affected by the regulations and policies
issued by host countries (Hoekman & Nicita, 2011). TE strategy refers to technologies
which a firm’s home country is strong, but the host country is not (Patel & Vega, 1999).
It can be proposed that this strategy may lead to higher risk of IP leakage, and the
choice of such strategy should be sensitive to the strength of IPR protection in the host
country. Therefore, institutional theory is expected to directly affect the choice of these
two strategies. RBV should also be considered since MS and TE strategies also involve
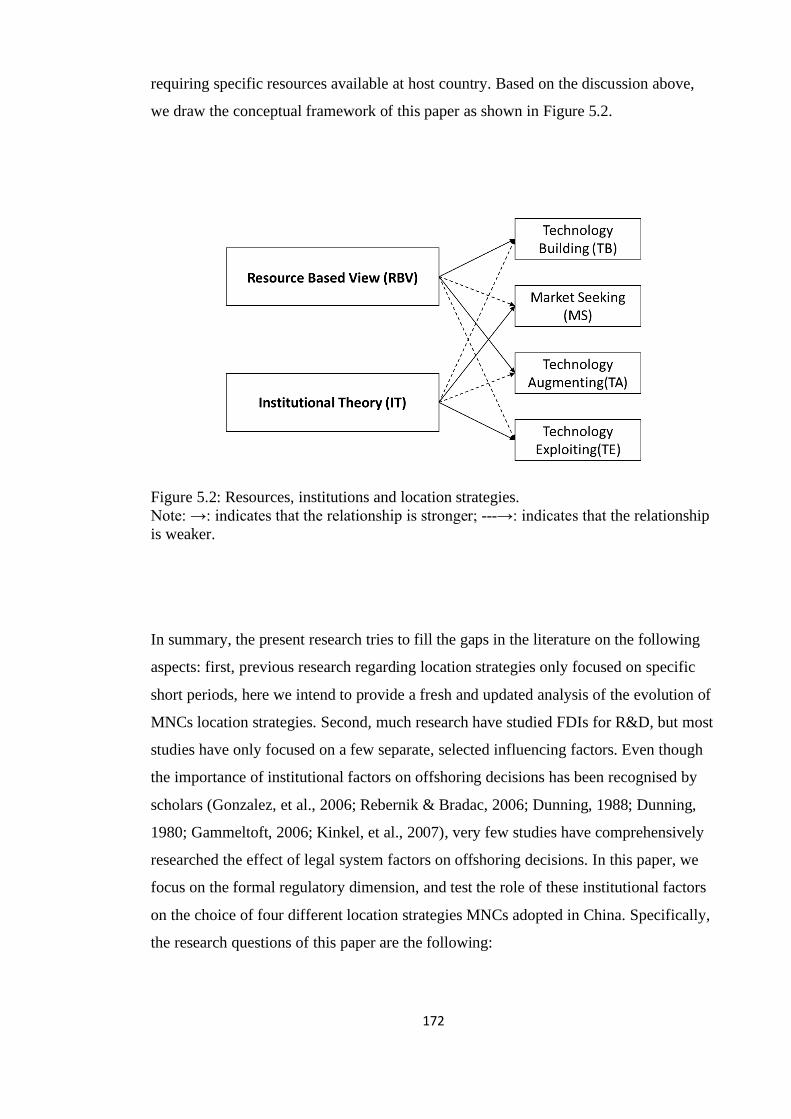
172
requiring specific resources available at host country. Based on the discussion above,
we draw the conceptual framework of this paper as shown in Figure 5.2.
Figure 5.2: Resources, institutions and location strategies.
Note: →: indicates that the relationship is stronger; ---→: indicates that the relationship
is weaker.
In summary, the present research tries to fill the gaps in the literature on the following
aspects: first, previous research regarding location strategies only focused on specific
short periods, here we intend to provide a fresh and updated analysis of the evolution of
MNCs location strategies. Second, much research have studied FDIs for R&D, but most
studies have only focused on a few separate, selected influencing factors. Even though
the importance of institutional factors on offshoring decisions has been recognised by
scholars (Gonzalez, et al., 2006; Rebernik & Bradac, 2006; Dunning, 1988; Dunning,
1980; Gammeltoft, 2006; Kinkel, et al., 2007), very few studies have comprehensively
researched the effect of legal system factors on offshoring decisions. In this paper, we
focus on the formal regulatory dimension, and test the role of these institutional factors
on the choice of four different location strategies MNCs adopted in China. Specifically,
the research questions of this paper are the following:
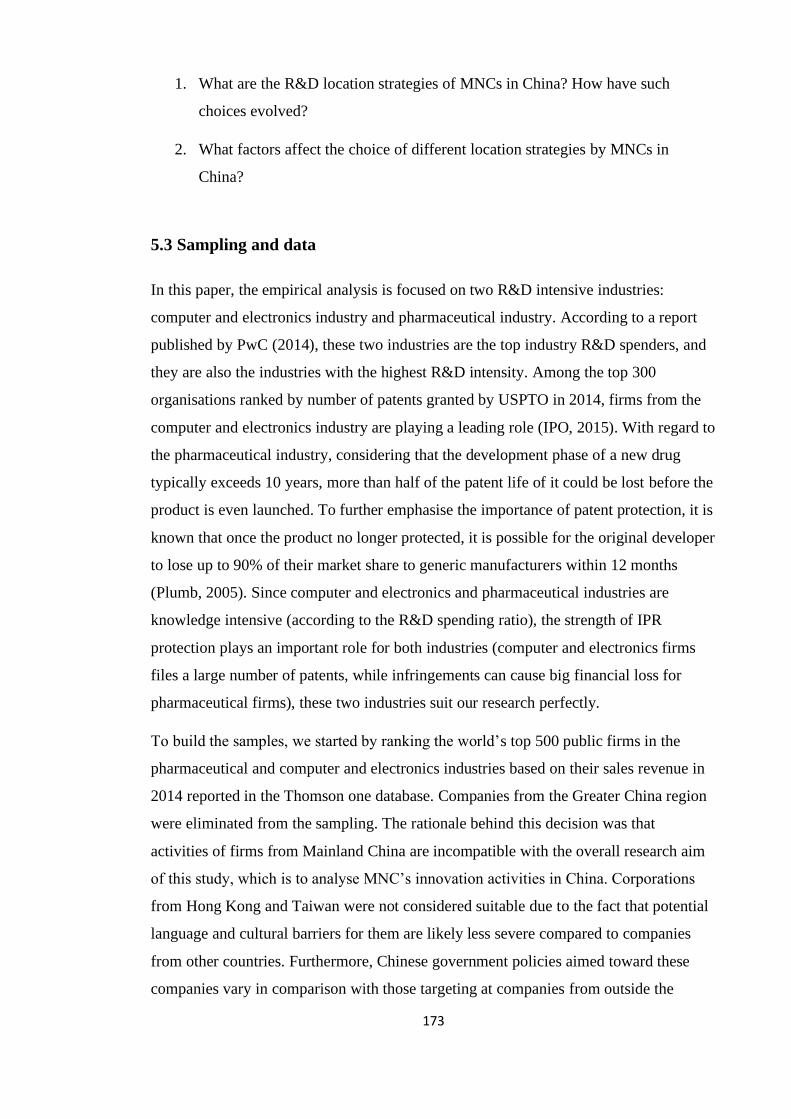
173
1. What are the R&D location strategies of MNCs in China? How have such
choices evolved?
2. What factors affect the choice of different location strategies by MNCs in
China?
5.3 Sampling and data
In this paper, the empirical analysis is focused on two R&D intensive industries:
computer and electronics industry and pharmaceutical industry. According to a report
published by PwC (2014), these two industries are the top industry R&D spenders, and
they are also the industries with the highest R&D intensity. Among the top 300
organisations ranked by number of patents granted by USPTO in 2014, firms from the
computer and electronics industry are playing a leading role (IPO, 2015). With regard to
the pharmaceutical industry, considering that the development phase of a new drug
typically exceeds 10 years, more than half of the patent life of it could be lost before the
product is even launched. To further emphasise the importance of patent protection, it is
known that once the product no longer protected, it is possible for the original developer
to lose up to 90% of their market share to generic manufacturers within 12 months
(Plumb, 2005). Since computer and electronics and pharmaceutical industries are
knowledge intensive (according to the R&D spending ratio), the strength of IPR
protection plays an important role for both industries (computer and electronics firms
files a large number of patents, while infringements can cause big financial loss for
pharmaceutical firms), these two industries suit our research perfectly.
To build the samples, we started by ranking the world’s top 500 public firms in the
pharmaceutical and computer and electronics industries based on their sales revenue in
2014 reported in the Thomson one database. Companies from the Greater China region
were eliminated from the sampling. The rationale behind this decision was that
activities of firms from Mainland China are incompatible with the overall research aim
of this study, which is to analyse MNC’s innovation activities in China. Corporations
from Hong Kong and Taiwan were not considered suitable due to the fact that potential
language and cultural barriers for them are likely less severe compared to companies
from other countries. Furthermore, Chinese government policies aimed toward these
companies vary in comparison with those targeting at companies from outside the

174
Greater China region, making industry-wide comparisons including these companies
misleading. After reviewing the top 500 firms from each industry, based on their sales
revenue and origin, 322 firms in the electronics industry and 317 firms in the
pharmaceutical industry were identified.
As the main focus of this research is to analyse firms which have offshored innovation
activities to China, firms which do not operate in China were carefully considered
whether to be included in the sample. This was done in a two-step approach. First we
filtered out all firms for which we found no indication of any foreign direct investment
or business activities in China (including direct sales, manufacturing, and R&D), based
on an analysis of each company’s official website (by identifying whether they have
contact information in China or if they have Chinese language option on website, and
using “China” as keyword to search in their website), and their latest 3 years annual
report (by checking whether “China” is mentioned anywhere in their annual report).
Second, we identified R&D activities in China through the existence of an R&D centre
in the country. To do so, we reviewed each company’s official website and their latest 3
years annual report as well as information from the FACTIVA database to identify if
and when the firm established an R&D centre in China. As a result, our sample of
companies with a clearly identifiable R&D centre in China consists of 33
pharmaceutical firms and 98 computer and electronics firm. Out of those, we have data
for the year of establishment of the R&D centre in China for 21 firms in the
pharmaceuticals sector and 63 firms in the computer and electronics sector, and these
firms constitute our database.
Economists have suggested that patents are regarded as a good indicator of innovation
activities (Griliches, 1990; Griliches, et al., 1987; Nagaoka, et al., 2010). By using
firm’s patent information, we can access what innovation activities are conducted where
by whom (Kang, 2015). It is widely acknowledged that using patent information to
analyse innovation activities has several advantages: First, patent documents contain
rich information, which covers information on inventors and assignee, the description of
the invention, citations, the timing of the invention, the technological classification and
coverage of protection (Braun, et al., 2011; Hall, et al., 2001). Second, patent data can
be easily accessed via different patent databases (Nelson, 2009), e.g., USPTO, National
Bureau of Economic Research (NBER), The Lens, etc. Third, patent data are
consistently reported, and often available in long historical time series (Hall, et al.,
175
2001). Finally, patent data is a comparatively cheap source to learn firm’s innovation
activities (Sharma, et al., 2016).
While patent data to analyse firm’s innovation activities are widely used, the limitations
regarding patent data should still be kept in mind. First, patenting is not the only way to
protect inventions, some firms may choose a secrecy strategy or other ways of
appropriability instead (Hall, et al., 2001; Braun, et al., 2011; Basberg, 1987). Second,
not all innovations are patentable since patenting requires meeting the patentability
criteria according to patent law (Hall, et al., 2001). Therefore, researchers should avoid
inaccurate conclusions regarding the nature of firm’s R&D activities if using patent
data. Third, the propensity to patent might vary, other things being equal, from country
to country, over time or across sectors (Bronzini & Piselli, 2016). Instead of using
patent data from one application authority, researchers should extract the patent data
from multi-country databases or countries which would attract a high number of
applicants, e.g., USPTO, European Patent Office (EPO), worldwide Patent Statistical
Database (PATSTAT).
We use PATSTAT which contains bibliographical data relating to more than 100
million patent documents from 90 patent authorities (PATSTAT, 2017). By using the
company name (also including subsidiary name(s) according to each company’s official
website) as the key word to search in the PATSTAT database (2017 spring edition), the
patent filing information of the selected firms are identified. There are some firms
which do not have available patent information from the database, and these are
eliminated from the sample. Since the patent reviewing process takes on average 2 years
from the time of application, in order to reduce truncation bias, previous studies have
suggested excluding patent filed at least 3 years prior to the end date of the patent
database (Dass, et al., 2017; Hall, et al., 2001). In addition, applicants have up to 30
months to file patent applications worldwide after the first patent filing according to the
Patent Cooperation Treaty (PCT) (Lanjouw & Schankerman, 2004). Therefore, we have
only included patents which were applied for before the end of 2014, this is also
consistent with the company search on Thomson one database (2014). The firm level
financial data is extracted from Datastream and Compustat by using the firm ID. Firm’s
patent information is then matched with firm’s financial data. There are data of 21
pharmaceutical firms and 58 computer and electronics firms from 1990 to 2014 which
are kept in the final sample.

176
Detailed information of the sample is shown in Table 5.1, 36% of the computer and
electronics firms established R&D centres during 1997 to 2002, while approximately
50% of the firms established R&D centres in China during the interval of 2003 to 2008,
which indicates that about half of our sample firms in the pharmaceutical industry
established R&D centres in China during 2003-2008. In addition, over 80% of the
pharmaceutical firms in the sample are from the United States (38.1%) and Europe
(42.86%), while the major share of computer and electronics firms in the sample
originate from the United States (43.10%) and Japan & South Korea (32.76%). It is
noted that 58 firms (out of 76) have patents with Chinese inventor participation before
the R&D centre was established. However, this only constitutes a small proportion of
patents. Of the 19,873 patents, 7.8% were filed before the official R&D centre was
established, which only constitutes a small part of the total patents with Chinese
inventors. This may indicate that most firms had some minor innovation activities
conducted in China before they chose to increase its investment.
Table 5.1: An overview of the sample. Industry Year of first R&D
operation
Year of first business
activities in China
Origin
Pharma Before 1990 0 Before1990 8 (38.10%) Europe 9 (42.86%)
1990-1996 2 (9.09%) 1990-1996 10 (47.62%) Japan &
Korea
4 (19.05%)
1997-2002 4 (18.18%) 1997-2002 1 (4.76%) United
States
8 (38.10%)
2003-2008 10 (45.45%) 2003-2008 1 (4.76%)
2009-2014 5 (22.73%) 2009-2014 1 (4.76%)
Total 21 21 21
Electronics Before 1990 1 (1.72%) Before1990 18 (31.03%) Europe 11 (18.97%)
1990-1996 2 (3.45%) 1990-1996 16 (27.59%) Japan &
Korea
19 (32.76%)
1997-2002 21 (36.21%) 1997-2002 18 (31.03%) North
America
28 (48.28%)
2003-2008 28 (48.28%) 2003-2008 6 (10.34%)
2009-2014 6 (10.34%) 2009-2014 0
Total 58 58 58

177
5.4 The evolution of the choices of different location strategies MNCs have
adopted in China
To identify motives for establishing R&D activities in China, we apply the framework
of the four different location strategies introduced above. In this section, we identified
the proportion of these four different location strategies that MNCs have adopted in
China, and how they have evolved. The patents in the PATSTAT database are classified
into 35 technology fields grouped by 5 technology sectors according to the International
Patent Classification (IPC) code. Following the research methods adopted by Patel and
Vega (1999) and Le Bas and Sierra (2002), firm’s homeRTAij90, the RTA of China
(hostRTAij(C)91) and the RTA of other host countries (hostRTAij(other)92) have been
calculated separately. As shown in the formula (1) below, Pij indicates the number of
patents granted to firm i in technological field j. A value of RTA above 1 indicates a
relative specialisation in that technology field, while a value less than 1 indicates
relative weakness in that technology field (Patel & Vega, 1999).
𝑅𝑇𝐴𝑖𝑗 =(𝑃𝑖𝑗 ∑ 𝑃𝑖𝑗𝑖⁄ )
∑ 𝑃𝑖𝑗𝑗 ∑ 𝑃𝑖𝑗𝑖𝑗⁄ (1)
Therefore, by comparing the RTA value of a firm’s home and host countries, the
strengths and weaknesses in varied technology fields of firm’s home country and host
country can be identified. In addition, by comparing the RTA of China with the RTA of
other host countries, we can identify the specific technological attraction of China as
host. The number of cases of each location strategy below represents the total number of
that location strategy in all technology fields of the sample firms (number of technology
fields × number of firms).
90 homeRTAij: by using firm’s home country’s (inventors from firm’s home country) share of all patents
in that technology field, divided by its share of all patents in all fields. When homeRTAij >1, it indicates
that firm i is relatively specialised in technology field j in its home country. On the other hand, if the
RTAij <1, it indicates that firm i is relatively weaker in technology field j in its home country. 91 hostRTAij(C): by using firm’s host country ‒ China’s (inventors from China) share of all patents in that
technology field, divided by its share of all patents in all fields. When hostRTAij(C) >1, it indicates that
firm i is relatively specialised in technology field j in its host country ‒ China. on the other hand, if the
hostRTAij(C) <1, it indicates that firm i is relatively de-specialised in technology field j in China. 92 hostRTAij(other): by using firm’s all other host country’s (inventors from all the other countries except
China and firm’s home country) share of all patents in that technology field, divided by its share of all
patents in all fields. When hostRTAij(other) >1, it indicates that firm i is relatively specialised in
technology field j in all other host countries. On the other hand, if the hostRTAij(other) <1, it indicates
that firm i is relatively de-specialised in technology field j in all other host countries.
178
For the analysis in this section, we used the number of patents (by counting the distinct
DOCDB family ID93) of inventors from firm’s home/host country in each technology
field divided by the total number of patents of the firm in each technology field for the
numerator, and use the sum of the number of patents (by counting the distinct DOCDB
family id) of inventors from firm’s home/host country in each technology field divided
by the sum of the number of patents of the firm in each technology field for the
denominator (as shown in formula 1).
Using patent data of selected firms from 1990 to 2014 and comparing the RTA value of
a firm’s home and host countries as done in previous studies (Le Bas & Sierra, 2002;
Patel & Vega, 1999; Laurens, et al., 2015), we have analysed the location strategies
behind a firm’s choices regarding offshoring innovation activities to China (the sum of
the share of four location strategies is 100%) and we have done this for four sub
periods: 1990-96, 1997-02, 2003-08, 2009-14. The rationale behind this decision is that
first, between 1990 and 1996, the share of patents with inventors from China remains at
a very low level, but started to increase from 1997 (Figure 5.3). Second, China has been
a member of WTO since 11th December 2001, and radically revised its IP laws to
comply with the minimum standards of the Agreement on Trade-Related Aspects of
Intellectual Property Rights (TRIPS) around 2000 (Li & Yu, 2015; Keupp, et al., 2009).
Chinese IP laws are further enhanced after 2008, which were arguably motivated by the
need to improve China’s innovation ability and transformation of the economy (Wu,
2009). Therefore, considering two intervals of 1997-2002 and 2003-2008 can provide
some evidence on whether joining the WTO and revising IP law affected firm’s choices
of offshoring innovation activities to China. We note that the share of patents and the
share of valuable patents (evaluated by the patent family size and number of citations)
with inventors in China increased from 2000 (Figures 5.3, 5.4 and 5.5). Third, referring
to the intervals of 2003-2008 and 2009-2014 can also help to identify whether the
financial crisis and the revision of patent law in 2008 have influenced firm’s choices of
offshoring innovation activities in China. It can be noted that the share of patents with
inventors from China peaked in 2008 and slightly fluctuated since then for computer
and electronics firms, while the share of valuable patents reached its peak in 2011 and
started decreasing after that (Figures 5.3, 5.4 and 5.5). However, the share of patents
93 DOCDB is “the EPO's master documentation database with worldwide coverage”, a single family ID
“is a collection of patent documents that are considered to cover a single invention” (EPO, 2017).

179
and the share of valuable patents with inventors from China keep increasing for
pharmaceutical firms (Figures 5.3, 5.4 and 5.5).
Figure 5.3: The share of patents that include inventors in China based on patents filed
from 1990-2014 in both computer and electronics industry and pharmaceutical industry.
Figure 5.4: The share of family size of patents that include inventors in China based on
patents filed from 1990-2014 in both computer and electronics industry and
pharmaceutical industry.
0.00%
1.00%
2.00%
3.00%
4.00%
5.00%
6.00%
7.00%
8.00%
9.00%
10.00%
19
90
19
91
19
92
19
93
19
94
19
95
19
96
19
97
19
98
19
99
20
00
20
01
20
02
20
03
20
04
20
05
20
06
20
07
20
08
20
09
20
10
20
11
20
12
20
13
20
14
Inventors in China(pharmaceutical)
Inventors in China(electronics)
0.00%
2.00%
4.00%
6.00%
8.00%
10.00%
12.00%
19
90
19
91
19
92
19
93
19
94
19
95
19
96
19
97
19
98
19
99
20
00
20
01
20
02
20
03
20
04
20
05
20
06
20
07
20
08
20
09
20
10
20
11
20
12
20
13
20
14
Inventors in China(pharmaceutical)
Inventors in China(electronics)

180
Figure 5.5: The share of citations of patents that include inventors in China based on
patents filed from 1990-2014 in both computer and electronics industry and
pharmaceutical industry.
From Figures 5.6 and 5.7, it can be noted that TB and TA strategies play leading roles
for both pharmaceutical firms and computer and electronics firms when conducting
R&D activities in China, which constitute over 80% of the cases during 1990 to 1996.
However, the share of companies which employ either of these two location strategies
gradually decrease in both industries.
The share of TB and TA as for firms in computer and electronics industry decreased in
both intervals of 1997-2002 and 2003-2008. The shares of TB and TA remain at a
similar level during 2009-2014 as during 2003-2008. It can also be noted that the share
of cases that involved MS and TE strategies are increasing while TB and TA are
decreasing. The share of TB and TA remains at approximately 50% during the period of
2003 to 2008 and 2009 to 2014. This may indicate that after China joined WTO, for
computer and electronics firms, about half of the cases are driven to offshore by seeking
China’s technology advantages, while the other half of the cases are driven by
increasing efficiency and gaining access to the Chinese market.
As for pharmaceutical firms, although the shares of TB and TA strategies are gradually
decreasing, they still appear to be more important strategies than TE and MS during the
whole time period, which is different from the situation of firms in computer and
electronics industry. The graph shows a clear increasing importance of efficiency
0.00%
2.00%
4.00%
6.00%
8.00%
10.00%
12.00%
14.00%
16.00%
18.00%
20.00%
19
90
19
91
19
92
19
93
19
94
19
95
19
96
19
97
19
98
19
99
20
00
20
01
20
02
20
03
20
04
20
05
20
06
20
07
20
08
20
09
20
10
20
11
20
12
20
13
20
14
Inventors in China(pharmaceutical)
Inventors in China(electronics)

181
seeking strategies, although technology resources seeking still plays a more dominant
role for pharmaceutical firms than for computer and electronics firms.
Figure 5.6: The evolution of the share of each location strategies of electronics firms
(host country: China).
Figure 5.7: The evolution of the share of each location strategies of pharmaceutical
firms (host country: China).
4.29%
17.12%
26.13%27.17%
48.57%
37.84%
27.16%
26.63%
35.71%
26.13%
22.84%
23.19%
11.43%
18.92%23.87% 23.01%
0.00%
10.00%
20.00%
30.00%
40.00%
50.00%
60.00%
9 0 - 9 6 9 7 - 0 2 0 3 - 0 8 0 9 - 1 4
TE
TA
TB
MS
43.48%
38.64%
29.13%31.88%
34.78% 36.36%
28.35% 30.43%
8.70%
15.91%25.20%
18.84%
13.04%
9.09%
17.32%18.84%
0.00%
5.00%
10.00%
15.00%
20.00%
25.00%
30.00%
35.00%
40.00%
45.00%
50.00%
9 0 - 9 6 9 7 - 0 2 0 3 - 0 8 0 9 - 1 4
TA
TB
MS
TE

182
Pharmaceutical firms that choose all the other locations other than China (Figure 5.8)
have a higher share of TE but lower share of TA compared with choosing China as the
offshoring destination for R&D. For electronics firms that choose to offshore R&D
activities to all the other locations other than China (Figure 5.9), TB and TE account for
the larger share of cases, especially TE strategy. Compared with firms choosing China
to be the R&D offshoring destination, TA is less important to firms that choose all the
other countries, although for both China and all other countries, the importance of MS is
gradually increasing, and it became more important for choosing China as the host
country after 2002. Further details can be found in Appendix C1. In addition, the share
of these four location strategies in five intervals (90-94, 95-99, 00-04, 05-09, 10-14) and
in each year94 (from 1990 to 2014) are also calculated, which are shown in Appendix C2
and Appendix C3, respectively. The results in these different intervals are consistent
with those discussed earlier on how the shares of these four location strategies have
evolved.
Figure 5.8: The evolution of the share of each location strategies of pharmaceutical
firms (host country: other).
94 Years with less than 30 cases are not shown in the graph.
32.33% 33.45%
30.09% 29.37%
13.36%
17.06%
20.69% 19.84%
26.29%20.14% 20.69% 20.63%
28.02%29.35%
28.53% 30.16%
0.00%
5.00%
10.00%
15.00%
20.00%
25.00%
30.00%
35.00%
40.00%
9 0 - 9 6 9 7 - 0 2 0 3 - 0 8 0 9 - 1 4
TB
MS
TA
TE

183
Figure 5.9: The evolution of the share of each location strategies of electronics firms
(host country: other).
In summary, seeking technology resources (TA and TB) are the main motives that drive
MNCs to offshore R&D activities to China for firms in both industries, and especially
for pharmaceutical firms. MS and TE only constitute a small proportion of all the
strategies that MNCs adopted during the early period of time, however, their importance
is gradually increasing, especially after 2002, when China joined WTO and
substantially improved its IPR protection. In the following section, we analyse the
factors affecting the choice of these four location strategies.
5.5 Influencing factors and location strategies
In this section, we test what institutional factors affect each of the strategies for locating
R&D to China.
5.5.1 Variables
5.5.1.1 Dependent variables
As we investigate the factors affecting the choices of different location strategies, the
shares of TB (TB_r), MS (MS_r), TA (TA_r) and TE (TE_R) strategy are used as
dependent variables in separate analyses.
30.94%
34.84% 35.72% 35.58%
32.14%
32.64%26.31%
29.04%
19.96%17.90% 18.83% 19.43%
16.97%14.62%
19.14%15.96%
0.00%
5.00%
10.00%
15.00%
20.00%
25.00%
30.00%
35.00%
40.00%
9 0 - 9 6 9 7 - 0 2 0 3 - 0 8 0 9 - 1 4
TE
TB
TA
MS
184
5.5.1.2 Independent variables
IPR protection and quality of rule of law in host countries are important factors that
firms consider when they are making decisions of offshoring innovation activities
(Javalgi, et al., 2009; Nassimbeni, et al., 2012; Oxley, 1999), especially for firms that
adopted MS and TE strategies to manage their R&D activities. The United Stated Trade
Representative’s Special 301 report95 has been adopted to indicate the IPR protection
strength of China and firm’s home country (Zhao, 2006). The value of IPR protection
depends on whether the firm’s country of origin is on the Special 301 Watch list in a
certain year (the previous year as the patent filed). If China and firm’s home country are
on the priority foreign country list or under Section 306 Monitoring96, the IPR
protection strength will take value -3; if China and firm’s home country are on the
priority watch list, it will take value -2; if the country is on the watch list, it will take
value -1; otherwise, if a country does not appear in any watch list, the IPR protection
strength will take value 097. In addition to the IPR protection strength of China and
firm’s home country, we also used “rule of law” as defined by Kaufmann et al. (2003)
as a proxy for measuring the quality of rule of law in China.
Since firms tend to respond to external uncertainties resulting from institutional distance
by limiting their foreign commitment (e.g., Gooris & Peeters, 2014), we include an
institutional distance variable which represent the cumulative institutional difference
between host and home country of firms according to Kaufmann institutional indicators:
voice and accountability, political stability, government effectiveness, regulatory
quality, rule of law, and control of corruption (Manning, et al., 2018). According to the
discussion we provided in previous section, these institutional factors are adopted as
explanatory variables for testing the relationships between influencing factors and the
choices of MS and TE strategies. However, regarding the choices of TB and TA
strategies, these institutional factors are adopted as control variables.
95 Special 301 report “reflects the outcome of a Congressionally-mandated annual review of the global
state of intellectual property rights (IPR) protection and enforcement” (USTR, 2017). 96 “This means that USTR will be in a position to move directly to trade sanctions if there is slippage in
the country’s enforcement of bilateral IPR agreements” (USTR, 1997). 97 For example, if a firm is from Canada, in the 2006 special 301 report, China is on the priority watch list
and Canada is on the watch list, so the value of home_ip of this firm in 2007 is -1 and the value of host_ip
is -2.

185
Regarding influences of the characteristics that the patent may have to the choice of
varied location strategies, following Brav et al. (2017) and Lin et al. (2016), we
construct variables which can be used to measure whether the patent filed is exploitative
or explorative. According to Brav et al. (2017) and Lin et al. (2016), a patent filed by
inventors in China is considered an explorative patent if at least 70% of its citations are
not from existing knowledge, which includes patents that the firm produced or were
cited by patents filed by the firm during the previous five years (cn_explor_r). In
contrast, a patent is considered exploitative if a minimum of 80% of its citations are
from existing knowledge, which includes patents that the firm produced itself or were
cited by patents filed by the firm during the previous five years (cn_exploi_r). The
descriptive results of the share of explorative and exploitative patents filed by sample
firms are reported in Appendix C4, and show that the share of explorative patents filed
with Chinese inventors is higher than the share of exploitative patents.
After reviewing a firm’s official website, its annual report, and the Factiva database, the
year when a firm established its official R&D centre is confirmed. In order to deal with
the potential effects of outliers, variable “ln_rnd_year” is obtained by a log
transformation of one plus the number of years that firm has R&D centre established in
China. We control for company size as larger firms are more readily to offshoring
advanced activities (Bardhan & Jaffee, 2005). We also log transform the number of
employees because it is highly skewed to represent the firm size in this paper. Scholars
have long highlighted that R&D intensity indicates the strategic importance of
innovation to a firm (O'Brien, 2003), which could affect a firm’s R&D strategies,
therefore we controlled for a firm’s R&D spending by using R&D intensity as a control
variable (Salomon & Shaver, 2005). R&D intensity is calculated by using the R&D
expenditure divided by the sales revenue in the same year. We used Return on Assets
(ROA) to control for the potential influence that firm’s performance may have on
innovation activities (Lee, et al., 2014). Since a time lag exists to turn investment
(R&D) into output (patent application) (Kondo, 1999; Bolívar-Ramos, 2017), we use
the previous year’s data of firm size, R&D intensity and ROA to match the patent data
consistently with methods used in previous studies (Lee, et al., 2014; Artz, et al., 2010).
The patent characteristic variable and firm characteristic variables are used as
explanatory variables for analysing their influences on the choices of TB and TA

186
strategies, while they are used as control variables for testing the influencing factors
behind the choices of MS and TE strategies. Table 5.2 presents a summary of the
definition and operationalisation of the variables used in the regression models.
Table 5.2: Variables definition and operationalisation. Variable
name
Value Notes
Dependent
variable
TB_r The share of cases that adopted “technology building” strategy: The number of cases of strategy “technology building” divided by the total number of cases of all location strategies.
MS_r The share of cases that adopted “market seeking” strategy: The number of cases of strategy “market seeking” divided by the total number of cases of all location strategies.
TA_r The share of cases that adopted “technology augmenting” strategy: The number of cases of strategy “technology augmenting” divided by the total number of cases of all location strategies.
TE_r The share of cases that adopted “technology exploiting” strategy: The number of cases of strategy “technology exploiting” divided by the total number of cases of all location strategies.
Independent
variables
home_ip 0 = not on the list; -1 = on the watch list; -2 = on the priority watch list; -3 = on the priority foreign country list or under Section 306 Monitoring.
Control variables for dependent variables TB_r and TA_r; Explanatory variables for dependent
variables MS_r and TE_r
host_ip 0 = not on the list; -1 = on the watch list; -2 = on the priority watch
list; -3 = on the priority foreign country list or under Section 306 Monitoring.
host_rol Reflects perceptions of the extent to which agents have confidence in and abide by the rules of society, and in particular the quality of contract enforcement, property rights, the police, and the courts, as well as the likelihood of crime and violence. Estimate of governance (ranges from approximately -2.5 (weak) to 2.5 (strong) governance performance).
institu_dis Sum of differences between Kaufmann institutional indicators of host country and home country of sourcing firm (indicators: voice and accountability, political stability, government effectiveness, regulatory quality, rule of law, control of corruption).
cn_explor_r The share of explorative patents filed by inventors in China: a patent is considered an explorative patent if a minimum of 70% of the citations it refers are not from existing knowledge, which includes patents that
the firm produced or were cited by patents filed by the firm during the previous five .
Explanatory variables for dependent variables TB_r and
TA_r; Control variables for dependent variables MS_r and TE_r
cn_exploi_r The share of exploitative patents filed by inventors in China: a patent is considered exploitative if a minimum of 80% of the citations it refers are from existing knowledge, which includes patents that the firm produced itself or were cited by patents filed by the firm during the previous five years.
ln_rnd_year Natural log of one plus the number of years that firm has R&D centre established in China.
rrnd R&D intensity= R&D spending / sales revenue
ln_emp Natural log of the total number of employees
roa Return on assets
Note: “_r” after the name indicates the variable is a ratio.

187
5.5.2 What factors affect the location strategies that firms adopted in China?
In this section we present the results of the regression models which test the effect of
the IPR protection strength of firm’s home country and China, the quality of rule of law
of China, and the institutional distance between firm’s home country and China on the
choice of location strategies. Since the dataset in this section is longitudinal, in order to
control for bias which may be caused by unobserved characteristics of the individual
firms, we adopt a fixed effects regression model (Allison, 2009). The IPR protection
strength of our sample pharmaceutical firms after R&D centres established in China
stays at a constant level (i.e. none of the firm’s home country is on the Watch List of
special 301 report), so this variable is omitted from the regression test because of
invariability. Therefore, the influence that the IPR protection strength of firm’s home
country has on the choices of location strategies can only be tested for firms in the
computer and electronics industry. Tables 5.3 and 5.4 report the descriptive statistics
and the correlation matrix of the explicative variables included in the analysis, no
correlation is higher than 0.5, except that the correlation between TA and TE strategies
for electronics firms is -0.648. Variance inflation factor (VIF) test is also calculated to
further check the collinearly among variables, we found that the range of VIF scores of
the independent variables is between 1.05 and 1.5098, which indicates absence of
collinearity (lower than 10) (Wooldridge, 2012).
98 The correlation between TE and TA of computer and electronics industry is -0.648, which could be
indicative of some collinearity between these two variables. However, after including all the dependent
variables in one OLS model, the VIF scores of all the variables are between 1.06 to 2.83, which indicates
absence of collinearity.

188
Table 5.3: Descriptive statistics and correlations for explanatory and control variables: the share of four location strategies that firms adopted in China
in electronics industry.
Variable Obs . Mean Std.
Dev.
Min Max 1a 1b 1c 1d 2 3 4 5a 5b 6 7 8 9 10
1a TB_r 622 0.279 0.024 0 0.333 1.000
1b MS_r 622 0.181 0.029 0 0.210 0.112* 1.000
1c TA_r 622 0.329 0.054 0 0.493 -0.043 -0.285* 1.000
1d TE_r 622 0.208 0.040 0 0.270 0.342* 0.102 -0.648* 1.000
2 host_ip 622 -2.151 0.358 -3 -2 0.167* 0.244* -0.672* 0.600* 1.000
3 host_rol 622 -0.504 0.070 -0.639 -0.407 -0.074 -0.246* 0.225* 0.016 0.062 1.0000
4 home_ip 622 -0.092 0.358 -2 0 0.088 0.169* 0.002 0.028 0.017 -0.070 1.000
5a cn_explor_r 622 0.399 0.361 0 1 0.080 -0.113* 0.123* 0.064 0.104* 1.000
5b cn_exploi_r 622 0.052 0.131 0 1 0.074 -0.010 -0.023 -0.059 0.045 1.000
6 ln_rnd_year 622 1.818 0.727 0 3.367 0.155* 0.169* -0.411* 0.378* 0.394* 0.157* 0.152* 0.165* 0.164* 1.000
7 Institu_dis 622 11.263 1.352 6.375 15.215 -0.043 -0.016 -0.044 -0.017 -0.032 -0.083 -0.091 0.070 -0.053 0.041 1.000
8 rrnd 622 0.105 0.076 0.000 0.779 0.053 0.051 0.039 -0.015 -0.052 0.006 0.208* 0.144* 0.042 0.114* 0.086 1.000
9 ln_emp 622 3.174 1.180 0.247 5.891 0.032 -0.040 0.039 -0.021 -0.060 -0.007 -0.031 0.119* 0.023 0.261* -0.047 -0.211* 1.000
10 roa 622 4.511 10.340 -79.92 33.8 0.049 0.010 -0.025 0.070 0.044 -0.139* -0.056 0.047 0.054 0.067 0.045 -0.179* -0.024 1.000
Note: * p<.01
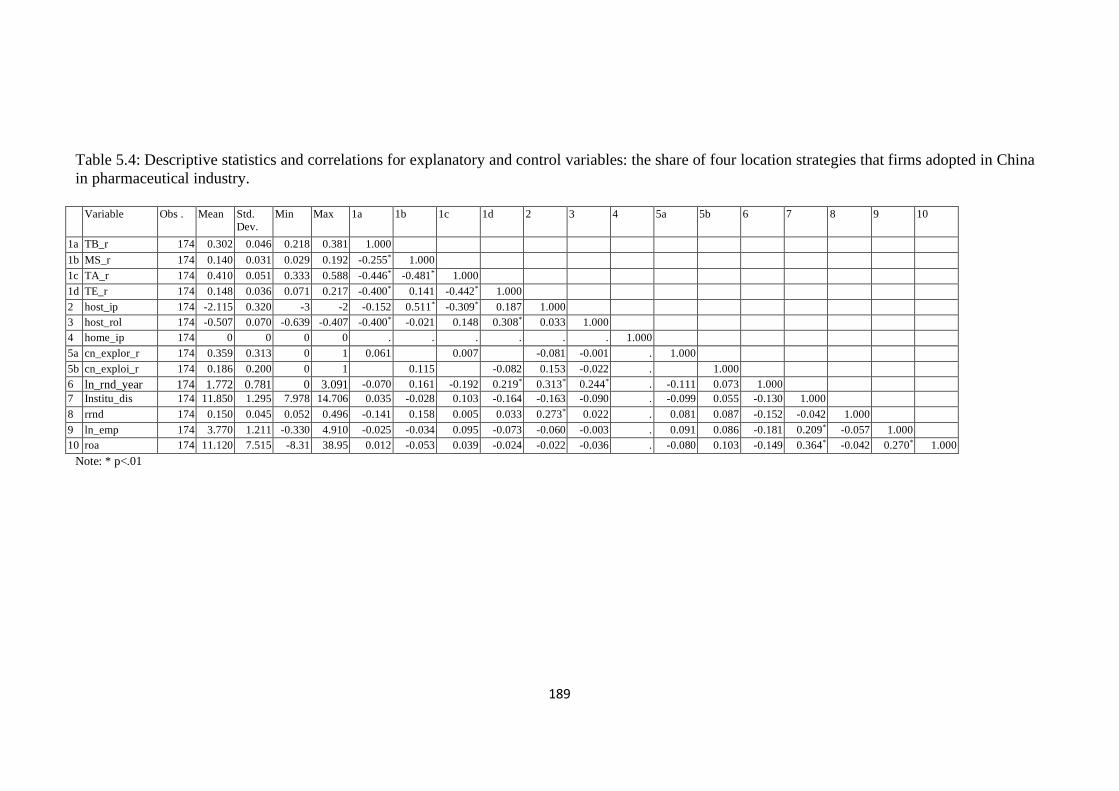
189
Table 5.4: Descriptive statistics and correlations for explanatory and control variables: the share of four location strategies that firms adopted in China
in pharmaceutical industry.
Variable Obs . Mean Std.
Dev.
Min Max 1a 1b 1c 1d 2 3 4 5a 5b 6 7 8 9 10
1a TB_r 174 0.302 0.046 0.218 0.381 1.000
1b MS_r 174 0.140 0.031 0.029 0.192 -0.255* 1.000
1c TA_r 174 0.410 0.051 0.333 0.588 -0.446* -0.481* 1.000
1d TE_r 174 0.148 0.036 0.071 0.217 -0.400* 0.141 -0.442* 1.000
2 host_ip 174 -2.115 0.320 -3 -2 -0.152 0.511* -0.309* 0.187 1.000
3 host_rol 174 -0.507 0.070 -0.639 -0.407 -0.400* -0.021 0.148 0.308* 0.033 1.000
4 home_ip 174 0 0 0 0 . . . . . . 1.000
5a cn_explor_r 174 0.359 0.313 0 1 0.061 0.007 -0.081 -0.001 . 1.000
5b cn_exploi_r 174 0.186 0.200 0 1 0.115 -0.082 0.153 -0.022 . 1.000
6 ln_rnd_year 174 1.772 0.781 0 3.091 -0.070 0.161 -0.192 0.219* 0.313* 0.244* . -0.111 0.073 1.000
7 Institu_dis 174 11.850 1.295 7.978 14.706 0.035 -0.028 0.103 -0.164 -0.163 -0.090 . -0.099 0.055 -0.130 1.000
8 rrnd 174 0.150 0.045 0.052 0.496 -0.141 0.158 0.005 0.033 0.273* 0.022 . 0.081 0.087 -0.152 -0.042 1.000
9 ln_emp 174 3.770 1.211 -0.330 4.910 -0.025 -0.034 0.095 -0.073 -0.060 -0.003 . 0.091 0.086 -0.181 0.209* -0.057 1.000
10 roa 174 11.120 7.515 -8.31 38.95 0.012 -0.053 0.039 -0.024 -0.022 -0.036 . -0.080 0.103 -0.149 0.364* -0.042 0.270* 1.000
Note: * p<.01

190
Tables 5.5 and 5.6 shows the baseline models testing the effects of the control variables
on the share of different location strategies that MNCs adopted in China. The main
results of the fixed effects regression in Table 5.5 show that the IPR protection strength
in China is negatively related to the share of TB and TA strategies for firms in both
industries, except that it has a significant positive effect on TB strategy for electronics
firms. The IPR protection strength in firm’s home country negatively impacts the share
of TB and TA strategies. The quality of rule of law in China has a positive effect on the
share of TA strategy, but a negative effect on the share of TB strategy for firms in both
industries. The longer the institutional distance between firm’s home country and China,
the higher the share of TA strategy for pharmaceutical firms, but the lower the share of
TA strategy for electronics firms. The results in Table 5.6 show that the longer the
experience in conducting R&D activities in China, the higher the share of MS strategy
and TE strategy for firms in both industries. In addition, firm size has a significant
positive effect on TE strategy, but negative effect on MS strategy for computer and
electronics firms.
Table 5.5: Fixed effects regression results of pharmaceutical industry and electronics
industry respectively. Dependent variable: the share of technology building and
technology augmenting strategies adopted in China (baseline).
Technology building Technology augmenting
Model 1a
(electronics
industry)
Model 1b
(pharma
industry)
Model 2a
(electronics
industry)
Model 2b
(pharma
industry)
cn_explor_r
cn_exploi_r
ln_rnd_year
rrnd
ln_emp
roa
Control
host_ip 0.014*** (0.003) -0.026* (0.013) -0.098*** (0.004) -0.027† (0.014)
host_rol -0.025† (0.014) -0.283*** (0.055) 0.196*** (0.023) 0.189** (0.063)
home_ip -0.021*** (0.005) 0 (omitted) -0.027** (0.008) 0 (omitted)
Institu_dis 0.002 (0.029) -0.010 (0.014) -0.014** (0.004) 0.037* (0.016)
-cons 0.268 (0.029) 0.219 (0.143) 0.369*** (0.047) 0.014 (0.163)
n (obs) 622 174 622 174
N (groups) 58 21 58 21
F stat 10.76*** 11.69*** 153.29*** 6.78***
Standard errors in brackets. Significance levels: † p<0.10, * p<0.05, ** p<0.01, *** p<0.001
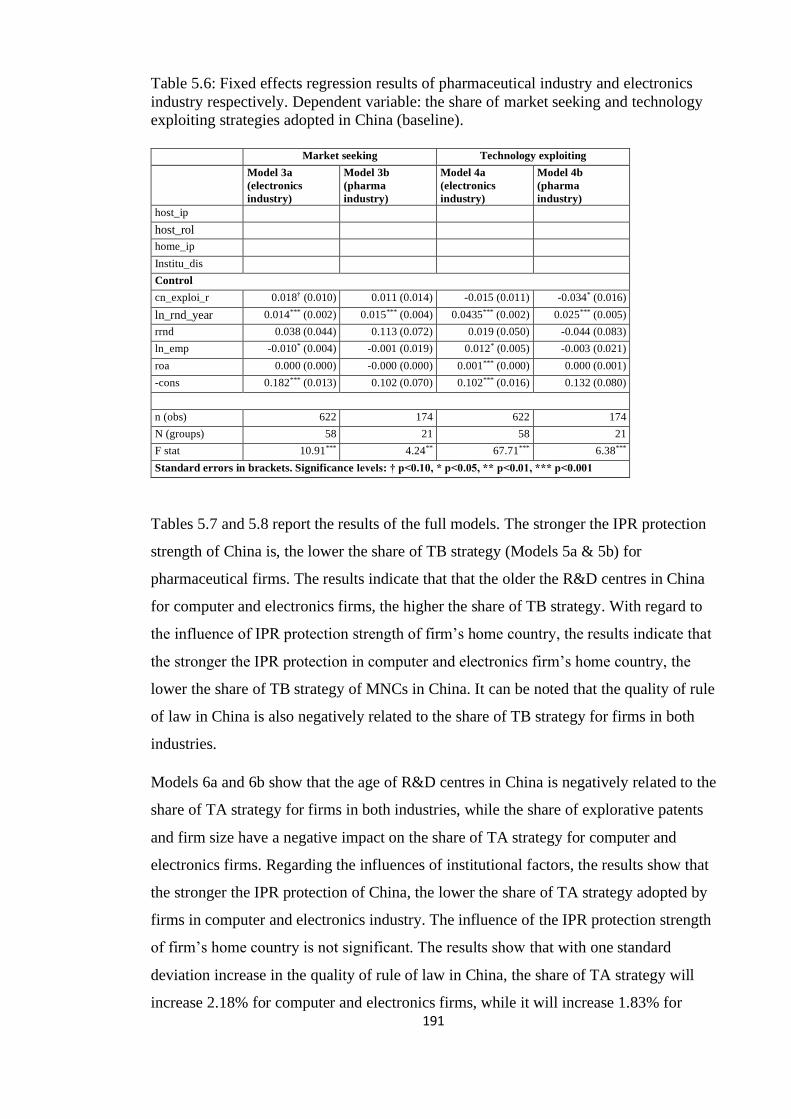
191
Table 5.6: Fixed effects regression results of pharmaceutical industry and electronics
industry respectively. Dependent variable: the share of market seeking and technology
exploiting strategies adopted in China (baseline). Market seeking Technology exploiting
Model 3a
(electronics
industry)
Model 3b
(pharma
industry)
Model 4a
(electronics
industry)
Model 4b
(pharma
industry)
host_ip
host_rol
home_ip
Institu_dis
Control
cn_exploi_r 0.018† (0.010) 0.011 (0.014) -0.015 (0.011) -0.034* (0.016)
ln_rnd_year 0.014*** (0.002) 0.015*** (0.004) 0.0435*** (0.002) 0.025*** (0.005)
rrnd 0.038 (0.044) 0.113 (0.072) 0.019 (0.050) -0.044 (0.083)
ln_emp -0.010* (0.004) -0.001 (0.019) 0.012* (0.005) -0.003 (0.021)
roa 0.000 (0.000) -0.000 (0.000) 0.001*** (0.000) 0.000 (0.001)
-cons 0.182*** (0.013) 0.102 (0.070) 0.102*** (0.016) 0.132 (0.080)
n (obs) 622 174 622 174
N (groups) 58 21 58 21
F stat 10.91*** 4.24** 67.71*** 6.38***
Standard errors in brackets. Significance levels: † p<0.10, * p<0.05, ** p<0.01, *** p<0.001
Tables 5.7 and 5.8 report the results of the full models. The stronger the IPR protection
strength of China is, the lower the share of TB strategy (Models 5a & 5b) for
pharmaceutical firms. The results indicate that that the older the R&D centres in China
for computer and electronics firms, the higher the share of TB strategy. With regard to
the influence of IPR protection strength of firm’s home country, the results indicate that
the stronger the IPR protection in computer and electronics firm’s home country, the
lower the share of TB strategy of MNCs in China. It can be noted that the quality of rule
of law in China is also negatively related to the share of TB strategy for firms in both
industries.
Models 6a and 6b show that the age of R&D centres in China is negatively related to the
share of TA strategy for firms in both industries, while the share of explorative patents
and firm size have a negative impact on the share of TA strategy for computer and
electronics firms. Regarding the influences of institutional factors, the results show that
the stronger the IPR protection of China, the lower the share of TA strategy adopted by
firms in computer and electronics industry. The influence of the IPR protection strength
of firm’s home country is not significant. The results show that with one standard
deviation increase in the quality of rule of law in China, the share of TA strategy will
increase 2.18% for computer and electronics firms, while it will increase 1.83% for

192
pharmaceutical firms. In addition, the institutional distance between a firm’s home
country and China can drive the choice of TA strategy for firms in pharmaceutical
industry.
Regarding the factors influencing the choice of MS strategy (Models 7a and 7b), the
stronger the IPR protection strength in China, the higher the share of MS strategy of
MNCs in China for pharmaceutical firms. The quality of rule of law in China negatively
impacts the share of MS strategy for computer and electronics firms. The results also
show that the bigger the institutional distance between firm’s home country and China,
the higher the share of MS strategy for firms in pharmaceutical industry. The age of the
R&D centres in China has significant effect on the choice of MS strategy for firms in
computer and electronics industry, while firm size shows negative effect.
The fixed effects regression results also show that TE strategy (Models 8a and 8b) is
motivated by the IPR protection strength of China and the institutional distance between
firm’s home country and China for computer and electronics firms, while the IPR
protection strength of firm’s home country and the quality of rule of law in China are
negatively related to the share of TE strategy for firms in computer and electronics
industry. As for pharmaceutical firms, the results show that the share of TE strategy will
be higher if the institutional distance between firm’s home country and China is smaller.
IPR protection strength of China has a negative effect on the share of TE strategy,
although with lower significance level. The results indicate that the age of R&D centres
in China in both industries has positive effect on the share of TE strategy, while firm
size and firm performance has positive impact on computer and electronics firm’s TE
strategy.
To summarise the results from the fixed effects regressions above, stronger IPR
protection in China has positive effect on the share of TE strategy for firms in computer
and electronics industry, while having a negative effect on the share of TA strategy. The
strength of IPR protection in China also has a positive effect on the share of MS
strategy for pharmaceutical firms, but a negative effect on the share of TB strategy. The
better the quality of rule of law in China is, the higher the share of TA strategy, but the
lower the share of TB strategy for firms in both industries. The quality of rule of law
also has a negative effect on the share of MS strategy and TE strategy for computer and
electronics firms. For computer and electronics firms, the IPR protection strength of
firm’s home country has a negative effect on the share of TB strategy and TE strategy.
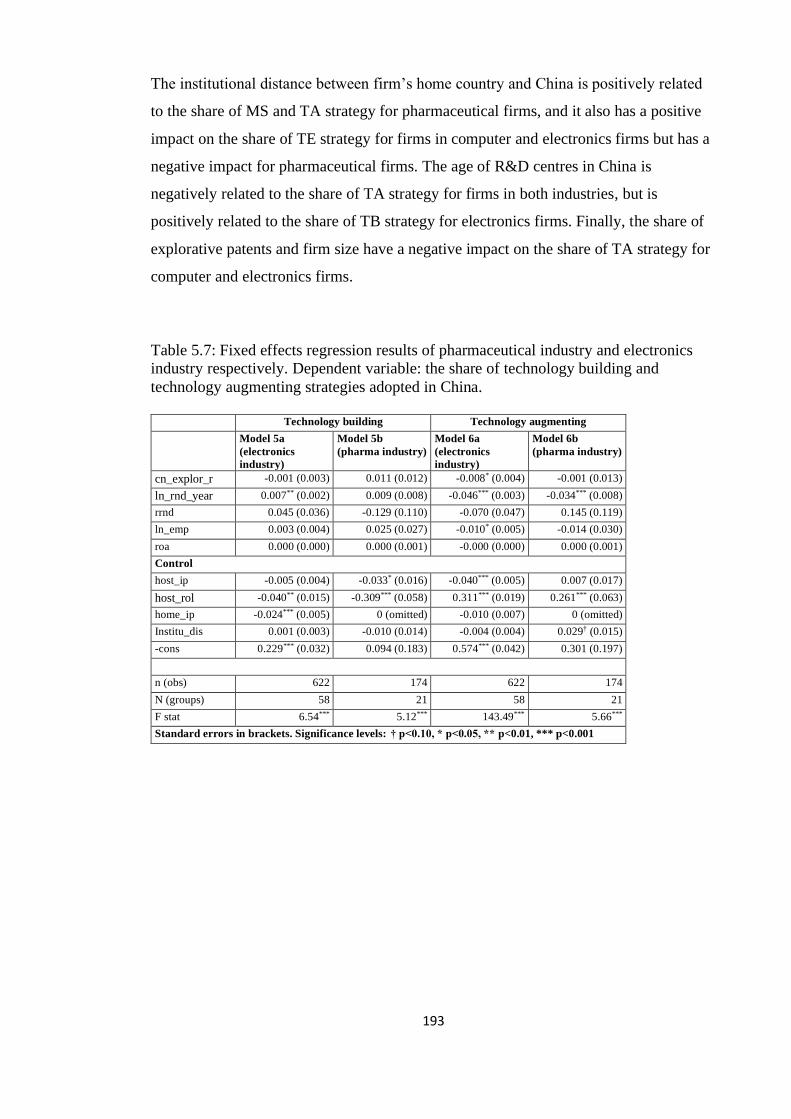
193
The institutional distance between firm’s home country and China is positively related
to the share of MS and TA strategy for pharmaceutical firms, and it also has a positive
impact on the share of TE strategy for firms in computer and electronics firms but has a
negative impact for pharmaceutical firms. The age of R&D centres in China is
negatively related to the share of TA strategy for firms in both industries, but is
positively related to the share of TB strategy for electronics firms. Finally, the share of
explorative patents and firm size have a negative impact on the share of TA strategy for
computer and electronics firms.
Table 5.7: Fixed effects regression results of pharmaceutical industry and electronics
industry respectively. Dependent variable: the share of technology building and
technology augmenting strategies adopted in China.
Technology building Technology augmenting
Model 5a
(electronics
industry)
Model 5b
(pharma industry)
Model 6a
(electronics
industry)
Model 6b
(pharma industry)
cn_explor_r -0.001 (0.003) 0.011 (0.012) -0.008* (0.004) -0.001 (0.013)
ln_rnd_year 0.007** (0.002) 0.009 (0.008) -0.046*** (0.003) -0.034*** (0.008)
rrnd 0.045 (0.036) -0.129 (0.110) -0.070 (0.047) 0.145 (0.119)
ln_emp 0.003 (0.004) 0.025 (0.027) -0.010* (0.005) -0.014 (0.030)
roa 0.000 (0.000) 0.000 (0.001) -0.000 (0.000) 0.000 (0.001)
Control
host_ip -0.005 (0.004) -0.033* (0.016) -0.040*** (0.005) 0.007 (0.017)
host_rol -0.040** (0.015) -0.309*** (0.058) 0.311*** (0.019) 0.261*** (0.063)
home_ip -0.024*** (0.005) 0 (omitted) -0.010 (0.007) 0 (omitted)
Institu_dis 0.001 (0.003) -0.010 (0.014) -0.004 (0.004) 0.029† (0.015)
-cons 0.229*** (0.032) 0.094 (0.183) 0.574*** (0.042) 0.301 (0.197)
n (obs) 622 174 622 174
N (groups) 58 21 58 21
F stat 6.54*** 5.12*** 143.49*** 5.66***
Standard errors in brackets. Significance levels: † p<0.10, * p<0.05, ** p<0.01, *** p<0.001
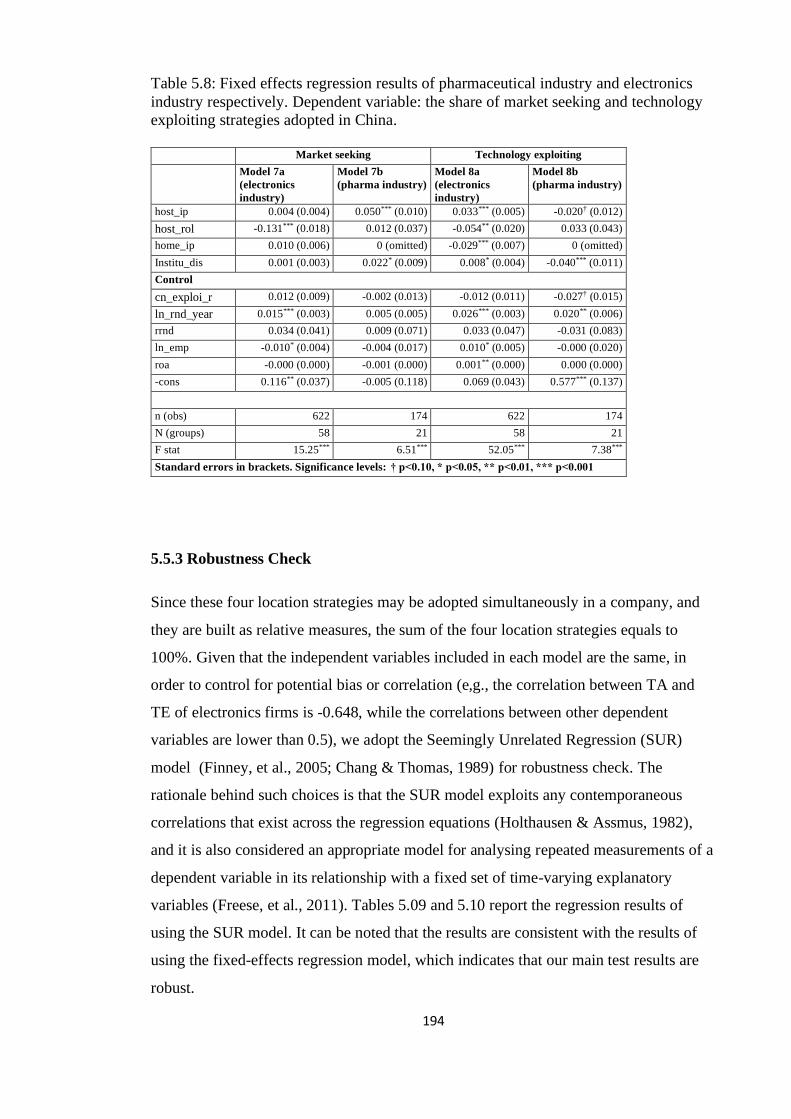
194
Table 5.8: Fixed effects regression results of pharmaceutical industry and electronics
industry respectively. Dependent variable: the share of market seeking and technology
exploiting strategies adopted in China.
Market seeking Technology exploiting
Model 7a
(electronics
industry)
Model 7b
(pharma industry)
Model 8a
(electronics
industry)
Model 8b
(pharma industry)
host_ip 0.004 (0.004) 0.050*** (0.010) 0.033*** (0.005) -0.020† (0.012)
host_rol -0.131*** (0.018) 0.012 (0.037) -0.054** (0.020) 0.033 (0.043)
home_ip 0.010 (0.006) 0 (omitted) -0.029*** (0.007) 0 (omitted)
Institu_dis 0.001 (0.003) 0.022* (0.009) 0.008* (0.004) -0.040*** (0.011)
Control
cn_exploi_r 0.012 (0.009) -0.002 (0.013) -0.012 (0.011) -0.027† (0.015)
ln_rnd_year 0.015*** (0.003) 0.005 (0.005) 0.026*** (0.003) 0.020** (0.006)
rrnd 0.034 (0.041) 0.009 (0.071) 0.033 (0.047) -0.031 (0.083)
ln_emp -0.010* (0.004) -0.004 (0.017) 0.010* (0.005) -0.000 (0.020)
roa -0.000 (0.000) -0.001 (0.000) 0.001** (0.000) 0.000 (0.000)
-cons 0.116** (0.037) -0.005 (0.118) 0.069 (0.043) 0.577*** (0.137)
n (obs) 622 174 622 174
N (groups) 58 21 58 21
F stat 15.25*** 6.51*** 52.05*** 7.38***
Standard errors in brackets. Significance levels: † p<0.10, * p<0.05, ** p<0.01, *** p<0.001
5.5.3 Robustness Check
Since these four location strategies may be adopted simultaneously in a company, and
they are built as relative measures, the sum of the four location strategies equals to
100%. Given that the independent variables included in each model are the same, in
order to control for potential bias or correlation (e,g., the correlation between TA and
TE of electronics firms is -0.648, while the correlations between other dependent
variables are lower than 0.5), we adopt the Seemingly Unrelated Regression (SUR)
model (Finney, et al., 2005; Chang & Thomas, 1989) for robustness check. The
rationale behind such choices is that the SUR model exploits any contemporaneous
correlations that exist across the regression equations (Holthausen & Assmus, 1982),
and it is also considered an appropriate model for analysing repeated measurements of a
dependent variable in its relationship with a fixed set of time-varying explanatory
variables (Freese, et al., 2011). Tables 5.09 and 5.10 report the regression results of
using the SUR model. It can be noted that the results are consistent with the results of
using the fixed-effects regression model, which indicates that our main test results are
robust.

195
Table 5.9: SUR regression results of pharmaceutical industry and electronics industry
respectively. Dependent variable: the share of technology building and technology
augmenting strategies adopted in China. Technology building Technology augmenting
Model 5a
(electronics industry)
Model 5b
(pharma industry)
Model 7a
(electronics industry)
Model 7b
(pharma industry)
cn_explor_r -0.000 (0.003) 0.005 (0.010) -0.006† (0.004) -0.005 (0.010)
ln_rnd_year 0.007** (0.002) 0.009 (0.007) -0.046*** (0.003) -0.034*** (0.008)
rrnd 0.045 (0.034) -0.125 (0.100) -0.070 (0.044) 0.147 (0.108)
ln_emp 0.003 (0.003) 0.023 (0.025) -0.010* (0.004) -0.015 (0.027)
roa 0.000 (0.000) 0.000 (0.001) -0.000 (0.000) 0.000 (0.001)
Control
host_ip 0.005 (0.004) -0.034* (0.015) -0.040*** (0.005) 0.006 (0.016)
host_rol -0.039** (0.014) -0.308*** (0.053) 0.310*** (0.019) 0.262*** (0.057)
home_ip -0.024*** (0.005) 0 (omitted) -0.010 (0.006) 0 (omitted)
Institu_dis 0.001 (0.003) -0.010 (0.013) -0.004 (0.003) 0.029* (0.014)
-cons 0.153*** (0.036) 0.069 (0.172) 0 (omitted) 0.303* (0.147)
n (obs) 622 174 622 174
Parms 66 28 67 28
RMSE 0.021 0.040 0.028 0.043
R-sq 0.163 0.226 0.731 0.293
Chi2 120.81 50.61 86137.87 72.51
Standard errors in brackets. Significance levels: † p<0.10, * p<0.05, ** p<0.01, *** p<0.001
Table 5.10: SUR regression results of pharmaceutical industry and electronics industry
respectively. Dependent variable: the share of market seeking and technology exploiting
strategies adopted in China. Market seeking Technology exploiting
Model 6a
(electronics industry)
Model 6b
(pharma industry)
Model 8a
(electronics industry)
Model 8b
(pharma industry)
host_ip 0.004 (0.004) 0.049*** (0.009) 0.033*** (0.005) -0.021† (0.011)
host_rol -0.131*** (0.166) 0.013 (0.034) -0.052** (0.019) 0.034 (0.040)
home_ip 0.010† (0.006) 0 (omitted) -0.029*** (0.006) 0 (omitted)
Institu_dis 0.001 (0.003) 0.021* (0.008) 0.008* (0.003) -0.041*** (0.010)
Control
cn_exploi_r 0.011 (0.009) 0.013 (0.008) -0.001 (0.009) -0.013 (0.009)
ln_rnd_year 0.015*** (0.002) 0.005 (0.005) 0.026*** (0.003) 0.020*** (0.005)
rrnd 0.034 (0.039) 0.009 (0.065) 0.032 (0.045) -0.031 (0.075)
ln_emp -0.010* (0.004) -0.006 (0.016) 0.010* (0.004) -0.003 (0.018)
roa -0.000 (0.000) -0.001 (0.000) 0.000** (0.000) 0.000 (0.000)
-cons 0 (omitted) 0 (omitted) 0 (omitted) 0.553*** (0.128)
n (obs) 622 174 622 174
Parms 67 29 67 28
RMSE 0.025 0.026 0.029 0.030
R-sq 0.251 0.312 0.495 0.315
Chi2 32672.33 5191.60 33569.07 79.85
Standard errors in brackets. Significance levels: † p<0.10, * p<0.05, ** p<0.01, *** p<0.001

196
5.6 Discussion and conclusions
This paper analyses the evolution of location strategies that MNCs in pharmaceutical
and computer and electronics industries have adopted in China. Our results suggest that
although seeking technology resources (TA and TB) are the initial location strategies
MNCs chose, the importance of MS and TE is gradually increasing. We also addressed
the influence of institutional factors on the choices of location strategies, and find that
the quality of the IPR protection regime in China is positively related to the share of TE
strategies for computer and electronics firms and to the share of MS for pharmaceutical
firms.
With regard to the motives for multinationals to choose China as a location to conduct
innovation activities, our results partly support the findings from previous studies,
which stated that TA and TE are the main motives that drive MNCs to go abroad
(Laurens, et al., 2015; Le Bas & Sierra, 2002; Patel & Vega, 1999). For both electronics
and pharmaceutical firms that choose China to be the host country to conduct R&D
activities, TA was playing a dominant role before 2002. The results of firms in the
computer and electronics industry also confirmed that the importance of TA is gradually
overcome by TE. In addition, our results support Patel and Vega’s (1999) findings that
pharmaceutical firms are driven more by TA compared to electronics firms. However,
our results also differ from previous studies in several aspects. First of all, some studies
have stated that firms do not go abroad for acquiring the technologies that they are not
specialised in at home (Liu & Chen, 2012). Our results indicate that TB is one of the
important strategies for firms to choose China, especially for pharmaceutical firms,
indicating that even if China traditionally does not possess strong technological
competencies in pharmaceuticals, the country is becoming attractive to companies from
countries which do not possess these capabilities. According to the reports published by
the European Union (Breschi & Tarasconi, 2013) and the OECD (2015), which
calculates the RTA value of each technology fields of patents filed by applicants in
China, China enjoys a relative advantage of technology resources for computer and
electronics firms, but not for pharmaceutical firms. Our results show that the importance
of TB is gradually decreasing for firms in the computer and electronics industry, which
means that as China is gradually obtaining technology advantages in computer and
electronics, firms in this industry are more willing to locate the technologies that firm’s

197
home country has a relative specialisation in (TA and TE became the two dominant
strategies since 2003).
Second, the share of MS is very low in previous studies (Patel & Vega, 1999; Laurens,
et al., 2015), however, our results suggest that although during 1990 to 1996 MS was
not an important motive for firms to choose China, the importance of this location
strategy increased notably during the period from 2003 to 2008 for pharmaceutical
firms (for electronics firms it has notably increased during both 1997-2002 and 2003-
2008). Furthermore, TE was not an important motive for choosing China as host
country before 2002 for firms in both industries, but it gradually became one of the top
two motives since 2003 for electronics firms. Although the importance of TE has also
increased for pharmaceutical firms, its share is still lower than TB and TA strategies.
There are studies claiming that investments in China are more market-seeking to begin
with, and with a tendency to evolutionary learning-based upgrading in China (Bruche,
2009). However, our descriptive results show that technology seeking constitutes a big
part of motives for MNCs offshoring R&D activities to China, which is consistent with
the RBV theory. This is also supported by the results in Appendix C4, which show that
there is a higher share of explorative patents than exploitative patent that are filed by
inventors in China. Last but not least, Gao (2008) stated that the IPR regime in China
was greatly improved around 2001, when China joined WTO, which resulted in great
progress regarding building up a “modern, transparent, and effective” IP system, and
also helped China to integrate into the global economy. Regarding the evolution of the
share of location strategies adopted by MNCs in electronics firms and pharmaceutical
firms, there is a notable increase in the share of TE strategy during 2003 to 2008, after
the IP system was improved around 2001. Since TE strategy indicates locating the
technologies that firm has advantage at home relative to China, there could be a higher
risk of IP leakage if the IPR protection in China is weak. Therefore, the change of share
of TE strategy could be attributed to the improvement of the Chinese IP system.
Regarding the factors behind the choices different location strategies, our regression
results show that the IPR protection strength of China is positively related to the share
of MS and TE strategies, since both strategies represent offshoring R&D activities that
are comparatively weak in host countries. This indicates that when firms are planning to
conduct R&D activities in areas in which China is not specialised, they are more likely
to offshore such activities if the IPR regime in China is stronger. TB and TA strategies

198
are for offshoring technologies in which the host country is specialised. The regression
result for IPR protection strength in China shows that it is negatively related to the share
of both strategies. This could explain why the share of TA and TB strategies are
decreasing and the share of MS and TE strategies are increasing gradually, while IPR
protection in China has been improving since the amendment of the IP laws in 2000
(Awokuse & Yin, 2010). These results support our conceptual framework that
institutional theory should be applied to explain the choice of four varied location
strategies.
Since TE strategy also corresponds to a situation when the technology MNC has relative
specialisation in the home country, our results show that the IPR regime in a firm’s
home country is negatively related to the share of TE strategy, which indicates that
when the IPR protection strength in firm’s home country is strong, a firm will be more
reluctant to offshore the technologies with a relative advantage in the home country.
With regard to TB strategy, the regression results also show that the IPR protection
strength of China and firm’s home country, and the quality of rule of law in China, are
negatively related to the share of TB strategy. This may suggest that TB can be adopted
as an explorative R&D strategy to fully utilise the resources in countries with weak
legal systems, consistent with both RBV and institutional theory. As for TA strategy,
which means the technology offshored to China is a technology that both China and
firm’s home country have a relative specialisation, the results show that the IPR
protection strength of China is negatively related to the share of this strategy, but the
quality of rule of law is positively related. Building on insights from both RBV and
institutional theory, we suggest that when offshoring R&D activities in which both
home and host countries are specialised, the quality of rule of law in China matters
more for firms, but this is not the case for IPR protection.
Our results show that the strength of IPR protection in the host country is positively
associated to the location strategies for offshoring technologies in which the host
country has no specialisation, but negatively associated to location strategies about
offshoring technologies in which the host country is relatively more specialised.
Previous studies have stated that R&D activities conducted by MNCs in host country
have influences on the innovation performance of local firms (Liu & Buck, 2007).
Therefore, if China wishes to attract technologies in which it is comparatively weak,
improving the quality of IPR regime in China should be paramount. In addition, the
199
results show that institutional distance plays a different role for firms in the
pharmaceutical industry and the computer and electronics industry. The institutional
distance is negatively related to the share of TE strategy for pharmaceutical firm, but
positively related for computer and electronics firms. Since MNCs prefer to locate
operations in host countries with similar institutional environment (Flores & Aguilera,
2007), pharmaceutical firms should be conservative about choosing a location strategy
which is facing higher risk of IP leakage. This explains why when the institutional
distance with pharmaceutical firm’s home country is bigger, the share of TE strategy is
lower. The strength of IPR protection of firm’s home country is negatively related to the
share of TB strategy and TE strategy for firms in computer and electronics industry.
With regard to the quality of rule of law in China, it is only positively related to TA
strategy.
These results highlight the role of RBV and institutional factors on offshoring
innovation activities. Indeed, institutional factors have been extensively recognised in
IB studies as affecting MNCs’ strategies in host countries. This may indicate the need
for further analysis to investigate more complex relationships between these factors and
test the reciprocal moderating effect on technology strategies.
In conclusion, the contribution of this paper is two-fold: First, this study has focused on
analysing the evolution of the location strategies MNCs adopted when offshoring R&D
activities in China, and we believe this paper contribute in a novel way to a better
understanding to the strategic management of R&D activities in China by MNCs.
Second, we have extended previous works regarding location strategies (Patel & Vega,
1999; Le Bas & Sierra, 2002; Laurens, et al., 2015), over a substantially longer period
of time and tested in the analysis the influence of institutional factors (i.e. IPR
protection strength of home and host countries, quality of rule of law, and institutional
distance) on the choices of these location strategies. The findings of this paper can
provide guidance to decision makers in corporations regarding what factors need to be
considered when making decisions regarding offshoring R&D activities to China, and
how to organise these R&D activities. For example, since our results show that the
strength of IPR protection in the host country is positively associated to the location
strategies for offshoring technologies in which the host country has comparative
disadvantage, firms should adopt such types of strategies in countries with stronger IPR
protection. Firms could adopt strategies like TA and TB to explore the technology
200
advantages in host countries which have weak IPR protection. In addition, the findings
of this paper could also give insight to policy makers in host countries for attracting
offshoring R&D activities. For example, if emerging countries like China want to attract
technologies in which they are comparatively weak, policy makers in such countries
should improve the quality of IPR regime.
This study has some limitations that could be addressed in further research: first, our
findings are based on MNCs in computer and electronics industry and pharmaceutical
industry, which are both knowledge-intensive industries but also present different
characteristics (e.g., pharmaceutical firms may face higher financial loss for IP
infringement than computer and electronics firms). Future studies could include more
industries and test the validity of our findings. Second, this study is only focused on
China, other host countries could also be included in future research to test whether
MNCs react differently in different institutional context, and compare the differences
between China and other countries.

201
References
Allison, P. D., 2009. Quantitative Applications in the Social Sciences: Fixed Effects
Regression Models. Thousand Oaks, CA: SAGE Publications Ltd.
Aron, R. & Singh, J. V., 2005. Get offshoring right. Harvard Business Review, 83(12),
pp. 135-143.
Artz, K. W., Norman, P. M., Hatfield, D. E. & Cardinal, L. B., 2010. A Longitudinal
Study of the Impact of R&D, Patents, and Product Innovation on Firm Performance.
The Journal of Product Innovation Management, 27(5), pp. 725-740.
Awokuse, T. O. & Yin, H., 2010. Does Stronger Intellectual Property Rights Protection
Induce More Bilateral Trade? Evidence from China’s Imports. World Development,
38(8), pp. 1094-1104.
Bardhan, A. D. & Jaffee, D. M., 2005. Innovation, R&D and offshoring. Fisher Center
for Real Estate & Urban Economics.
Barney, J., 1991. Firm Resources and Sustained Competitive Advantage. Journal of
Management, 17(1), pp. 99-120.
Basberg, B. L., 1987. Patents and the measurement of technological change: A survey
of the literature. Research Policy, 16(2-4), pp. 131-141.
Bolívar-Ramos, M. T., 2017. The relation between R&D spending and patents: The
moderating effect of collaboration networks. Journal of Engineering and Technology
Management, Volume 46, pp. 26-38.
Brander, J. A., Cui, V. & Vertinsky, I., 2017. China and intellectual property rights: A
challenge to the rule of law. Journal of International Business Studies, 48(7), pp. 908-
921.
Braun, F. G., Hooper, E., Wand, R. & Zloczysti, P., 2011. Holding a candle to
innovation in concentrating solar power technologies: A study drawing on patent data.
Energy Policy, 39(5), pp. 2441-2456.
Brav, A., Jiang, W., Ma, S. & Tian, X., 2017. How Does Hedge Fund Activism Reshape
Corporate Innovation?. Journal of Financial Economics, Forthcoming.
Breschi, S. & Tarasconi, G., 2013. The Technological Profile and Specialization
Pattern, Luxembourg: Publications Office of the European Union.
Bronzini, R. & Piselli, P., 2016. The impact of R&D subsidies on firm innovation.
Research Policy, 45(2), pp. 442-457.
Brouthers, K. D., Brouthers, L. E. & Werner, S., 2008. Resource-Based Advantages in
an International Context. Journal of Management, 34(2), pp. 189-217.
Bruche, G., 2009. The Emergence of China and India as New Competitors in MNCs'
Innovation Networks. Competition & Change, 13(3), pp. 267 - 288.

202
Cantwell, J. & Mudambi, R., 2005. MNE Competence-Creating Subsidiary Mandates.
Strategic Management Journal, 26(12), pp. 1109-1128.
Cantwell, J. & Piscitello, L., 2005. Recent Location of Foreign-owned Research and
Development Activities by Large Multinational Corporations in the European Regions:
The Role of Spillovers and Externalities. Regional Studies, 39(1), pp. 1-16.
Chang, Y. & Thomas, H., 1989. The Impact of Diversification Strategy on Risk-Return
Performance. Strategic Management Journal, 10(3), pp. 271-284.
D’Agostino, L. M., Laursen, K. & Santangelo, G. D., 2013. The impact of R&D
offshoring on the home knowledge production of OECD investing regions. Journal of
economic geography, 13(1), pp. 145-175.
Dass, N., Nanda, V. & Xiao, S. C., 2017. Truncation bias corrections in patent data:
Implications for recent research on innovation. Journal of Corporate Finance, Volume
44, pp. 353-374.
Demirbag, M. & Glaister, K. W., 2010. Factors determining offshore location choice for
R&D projects: A comparative study of developed and emerging regions. Journal of
Management Studies, 47(8), pp. 1534-1560.
Dunning, J., 1980. Towards an eclectic theory of international production: some
empirical tests. Journal of International Business Studies, 11(1), pp. 9-31.
Dunning, J., 1988. Explaining International Production. London: Harper Collins.
EPO, 2017. DOCDB simple patent family. [Online]
Available at: https://www.epo.org/searching-for-patents/helpful-resources/first-time-
here/patent-families/docdb.html
[Accessed 15 05 2018].
Ernst, D., 2006. Innovation offshoring: Asia’s emerging role in global innovation
networks, Honolulu: East-West Center.
Farrell, D. D., 2005. Offshoring: Value creation through economic change. Journal of
management studies, 42(3), pp. 675-683.
Fingar, C., 2015. China passes US in race for FDI in research and development.
[Online]
Available at: http://www.ft.com/cms/s/3/241d9366-3058-11e5-91ac-
a5e17d9b4cff.html?siteedition=uk#axzz4AiHcQ1bW
[Accessed 22 April 2016].
Finney, R. Z., Campbell, N. D. & Powell, C. M., 2005. Strategies and resources:
Pathways to success?. Journal of Business Research, 58(12), pp. 1721-1729.
Flores, R. G. & Aguilera, R. V., 2007. Globalization and location choice: an analysis of
US multinational firms in 1980 and 2000. Journal of International Business Studies,
38(7), pp. 1187-1210.
Freese, C., Schalk, R. & Croon, M., 2011. The impact of organizational changes on
psychological contracts: A longitudinal study. Personnel Review, 40(4), pp. 404-422.

203
Gammeltoft, P., 2006. Internationalisation of R&D: trends, drivers and managerial
challenges. International Journal of Technology and Globalization, pp. 177-199.
Gao, L., 2008. China's Patent System and Globalization. Research Technology
Management, 51(6), pp. 34-37.
Gerybadze, A. & Reger, G., 1999. Globalization of R&D: recent changes in the
management of innovation in transnational corporations. Research Policy, 28(2-3), pp.
251-274.
Ginarte, J. C. & Park, W. G., 1997. Determinants of patent rights: A cross-national
study. Research Policy, 26(3), pp. 283-301.
Gonzalez, R., Gasco, J. & Llopis, J., 2006. Information systems offshore outsourcing: a
descriptive analysis. Industrial Management & Data Systems, 106(9), pp. 1233-1248.
Griliches, Z., 1990. Patent statistics as economic indicators: A survey. Journal of
Economic Literature, 28(4), pp. 1661-1707.
Griliches, Z., Pakes, A. & Hall, B. H., 1987. The Value of Patents as Indicators of
Inventive Activity. In: P. Dasgupta & P. Stoneman, eds. Economic Policy and Technical
Performance. Cambridge : Cambridge University Press, pp. 97-124.
Grimes, S. & Miozzo, M., 2015. Big Pharma's Internationalization of R&D to China.
European Planning Studies, 23(9), pp. 1873-1894.
Hall, B. H., Jaffe, A. B. & Trajtenberg, M., 2001. The NBER Patent Citation Data File:
Lessons, Insights and Methodological Tools. NBER Working Paper No. 8498.
Hoekman, B. & Nicita, A., 2011. Trade Policy, Trade Costs, and Developing Country
Trade. World Development, 39(12), pp. 2069-2079.
Holthausen, J. D. M. & Assmus, G., 1982. Advertising Budget Allocation under
Uncertainty. Management Science, 28(5), pp. 487-499.
Huang, Y. & Khanna, T., 2003. Can India Overtake China?. Foreign Policy, Volume
134, pp. 74-81.
IPO, 2015. Top 300 Organizations Granted U.S. Patents in 2014, s.l.: s.n.
Jandhyala, S., 2013. Property rights and international investment in information
technology services. Strategic Management Journal, 34(7), pp. 877-889.
Javalgi, R. G., Dixit, A. & Scherer, R. F., 2009. Outsourcing to emerging markets:
Theoretical perspectives and policy implications. Journal of International Management,
15(2), pp. 156-168.
Kang, B., 2015. The innovation process of Huawei and ZTE: Patent data analysis.
China Economic Review, Volume 36, pp. 378-393.
Kaufmann, D., Kraay, A. & Mastruzzi, M., 2003. Governance Matters Iii: Governance
Indicators for 1996-2002. World Bank Policy Research Working Paper No. 3106.

204
Keupp, M. M., Beckenbauer, A. & Gassmann, O., 2009. How managers protect
intellectual property rights in China using de facto strategies. R&D Management, 39(2),
p. 211/224.
Kinkel, S., Lay, G. & Maloca, S., 2007. Development, motives and employment effects
of manufacturing offshoring of German SMEs. International Journal of
Entrepreneurship and Small Business, 4(3), pp. 256-276.
Kondo, M., 1999. R&D dynamics of creating patents in the Japanese industry. Research
Policy, 28(6), pp. 587-600.
Kuemmerle, W., 1999. The Drivers of Foreign Direct Investment into Research and
Development: An Empirical Investigation. Journal of International Business Studies,
30(1), pp. 1-24.
Lanjouw, J. O. & Schankerman, M., 2004. Patent Quality and Research Productivity:
Measuring Innovation with Multiple Indicators. The Economic Journal, 114(495), pp.
441-465.
Laurens, P. et al., 2015. The rate and motives of the internationalisation of large firm
R&D (1994–2005): Towards a turning point?. Research Policy, 44(3), pp. 765-776.
Le Bas, C. & Sierra, C., 2002. ‘Location versus home country advantages’ in R&D
activities: some further results on multinationals' locational strategies. Research Policy,
31(4), pp. 589-609.
Lee, C.-Y., Wu, H.-L. & Pao, H.-W., 2014. How does R&D intensity influence firm
explorativeness? Evidence of R&D active firms in four advanced countries.
Technovation, 34(10), pp. 582-593.
Lewin, A. Y., Massini, S. & Peeters, C., 2009. Why Are Companies Offshoring
Innovation? The Emerging Global Race for Talent. Journal of International Business
Studies, 40(6), pp. 901-925.
Lewin, A. Y. & Volberda, H. W., 2011. Co-evolution of global sourcing: The need to
understand the underlying mechanisms of firm-decisions to offshore. International
Business Review, 20(3), pp. 241-251.
Lin, C., Liu, S. & Manso, G., 2016. Shareholder Litigation and Corporate Innovation.
University of Hong Kong and University of California at Berkeley Working Paper.
Liu, M.-c. & Chen, S.-H., 2012. MNCs’ offshore R&D networks in host country's
regional innovation system: The case of Taiwan-based firms in China. Research Policy,
41(6), pp. 1107-1120.
Liu, X. & Buck, T., 2007. Innovation performance and channels for international
technology spillovers: Evidence from Chinese high-tech industries. Research Policy,
36(3), pp. 355-366.
Li, W. & Yu, X., 2015. China’s intellectual property protection strength and its
evaluation – based on the accession to TRIPS Agreement (Agreement On Trade-related
Aspects of Intellectual Property Rights). R&D Management, 45(4), pp. 397-410.

205
Manning, S., Lewin, A. & Massini, S., 2008. The globalization of innovation: a
dynamic perspective on offshoring. Academy of Management Perspectives, 22(3), pp.
35-54.
Manning, S., Massini, S. & Lewin, A. Y., 2008. A dynamic perspective on next-
generation offshoring: the global sourcing of science and engineering talent. Academy of
Management Perspectives, 22(3), pp. 35-54.
Manning, S., Massini, S., Peeters, C. & Lewin, A. Y., 2018. The changing rationale for
governance choices: Early vs. late adopters of global services sourcing. Strategic
Management Journal, 39(8), pp. 2303-2334.
Martínez-Noya, A. & García-Canal, E., 2011. Technological capabilities and the
decision to outsource/outsource offshore R&D services. International Business Review,
20(3), pp. 264-277.
Motohashi, K., 2012. Management of offshore R&D in China: Cross country
differences in motivation and performance. Institutions and Economies, 4(2), pp. 101-
120.
Nagaoka, S., Motohashi, K. & Goto, A., 2010. Patent Statistics as an Innovation
Indicator. In: B. H. Hall & N. Rosenberg, eds. Handbook of the Economics of
Innovation. Oxford: Elsevier, pp. 1083-1027.
Nassimbeni, G., Sartor, M. & Dus, D., 2012. Security risks in service offshoring and
outsourcing. Industrial Management & Data System, 112(3), pp. 405-440.
Nelson, A. J., 2009. Measuring knowledge spillovers: What patents, licenses and
publications reveal about innovation diffusion. Research Policy, 38(6), p. 994–1005.
Nieto, M. J. & Rodríguez, A., 2011. Offshoring of R&D: Looking abroad to improve
innovation performance. Journal of International Business Studies , 42(3), pp. 345-361.
O'Brien, J. P., 2003. The capital structure implications of pursuing a strategy of
innovation. Strategic Management Journal, 24(5), pp. 415-431.
OECD, 2015. OECD Science, Technology and Industry Scoreboard 2015: Innovation
for growth and society, Paris: OECD Publishing.
Oxley, J. E., 1999. Institutional environment and the mechanisms of governance: the
impact of intellectual property protection on the structure of inter-firm alliances.
Journal of Economic Behavior & Organization, 38(3), pp. 283-309.
Park, W. G., 2008. International patent protection: 1960–2005. Research Policy, 37(4),
pp. 761-766.
Patel, P. & Vega, M., 1999. Patterns of internationalisation of corporate technology:
location vs. home country advantages. Research Policy, 28(2-3), pp. 145-155.
PATSTAT, 2017. PATSTAT. [Online]
Available at: https://www.epo.org/searching-for-patents/business/patstat.html#tab-1
[Accessed 01 September 2017].

206
Pearce, R. D., 1999. Decentralised R&D and strategic competitiveness: globalised
approaches to generation and use of technology in multinational enterprises (MNEs).
Research Policy, 28(2-3), pp. 157-178.
Picci, L., 2010. The internationalization of inventive activity: A gravity model using
patent data. Research Policy, 39(8), pp. 1070-1081.
Plumb, K., 2005. Continuous Processing in the Pharmaceutical Industry: Changing the
Mind Set. Chemical Engineering Research and Design, 83(6), pp. 730-738.
PwC, 2014. The 2014 Global Innovation 1000 & Industrials industry findings, s.l.:
PwC.
Quan, X. & Chesbrough, H., 2010. Hierarchical Segmentation of R&D Process and
Intellectual Property Protection: Evidence From Multinational R&D Laboratories in
China. IEEE Transactions On Engineering Management, 57(1), pp. 9-21.
Rebernik, M. & Bradac, B., 2006. Cooperation and opportunistic behaviour in
transformational outsourcing. Kybernetes, Volume 35, pp. 1005-1013.
Salomon, R. M. & Shaver, J. M., 2005. Learning by Exporting: New Insights from
Examining Firm Innovation. Journal of Economics & Management Strategy, 14(2), pp.
431-460.
Schmeisser, B., 2013. A systematic review of literature on offshoring of value chain
activities. Journal of International Management, 19(4), pp. 390-406.
Sharma, P., Tripathi, R., Singh, V. & Tripathi, R., 2016. Assessing the ICT innovative
position of India based on patent data and research publications. Queen Mary Journal of
Intellectual Property, pp. 514-533.
Stringfellow, A., Teagarden, M. B. & Nie, W., 2008. Invisible costs in offshoring
services work. Journal of Operations Management, 26(2), pp. 164-179.
Teece, D. J., Pisano, G. & Shuen, A., 1997. Dynamic Capabilities and Strategic
Management. Strategic Management Journal, 18(7), pp. 509-533.
USTR, O. o. t. U. S. T. R., 1997. 1997 Special 301 Report. [Online]
Available at: https://ustr.gov/about-us/policy-offices/press-office/reports-and-
publications/archives
[Accessed 29 07 2017].
USTR, O. o. t. U. S. T. R., 2017. Office of the United States Trade Representative.
[Online]
Available at: https://ustr.gov/issue-areas/intellectual-property/Special-301
[Accessed 18 2 2018].
Wooldridge, J. M., 2012. Introductory Econometric: A Modern Approach. 5 ed. Mason:
CENGAGE Learning.
Wu, H., 2009. Evaluation and reflection on China's intellectual property legal
construction. China Legal Science, Issue 1, pp. 51-68.
207
Wu, L.-Y., 2010. Applicability of the resource-based and dynamic-capability views
under environmental volatility. Journal of Business Research, 63(1), pp. 27-31.
Yu, P. K., 2018. When the Chinese Intellectual Property System Hits 35. Queen Mary
Journal of Intellectual Property, Volume 8, pp. 17-70.
Zhao, M., 2006. Conducting R&D in Countries with Weak Intellectual Property Rights
Protection. Management Science, 52(8), pp. 1185-1199.

208
Appendix C1: The data details of share of location strategies (4 intervals)
Table C1.1: The share of each location strategies of electronics firms.
Host
country
90-96 97-02 03-08 09-14
No. % No. % No. % No. %
China TA 25 35.71% 58 26.13% 111 22.84% 128 23.19%
MS 8 11.43% 42 18.92% 116 23.87% 127 23.01%
TA 34 48.57% 84 37.84% 132 27.16% 147 26.63%
TE 3 4.29% 38 17.12% 127 26.13% 150 27.17%
Total 70
222
486
552
Other TA 161 32.14% 268 32.64% 257 26.31% 293 29.04%
MS 85 16.97% 120 14.62% 187 19.14% 161 15.96%
TA 100 19.96% 147 17.90% 184 18.83% 196 19.43%
TE 155 30.94% 286 34.84% 349 35.72% 359 35.58%
Total 501 821 977 1,009
Table C1.2: The share of each location strategies of pharmaceutical firms.
Host
country
90-96 97-02 03-08 09-14
No. % No. % No. % No. %
China TA 16 34.78% 32 36.36% 36 28.35% 42 30.43%
MS 4 8.70% 14 15.91% 32 25.20% 26 18.84%
TA 20 43.48% 34 38.64% 37 29.13% 44 31.88%
TE 6 13.04% 8 9.09% 22 17.32% 26 18.84%
Total 46 88 127 138 Other TA 89 33.71% 106 32.62% 106 30.03% 86 30.07%
MS 34 12.88% 55 16.92% 76 21.53% 61 21.33%
TA 63 23.86% 60 18.46% 68 19.26% 54 18.88%
TE 78 29.55% 104 32.00% 103 29.18% 85 29.72%
Total 264 325 353 286
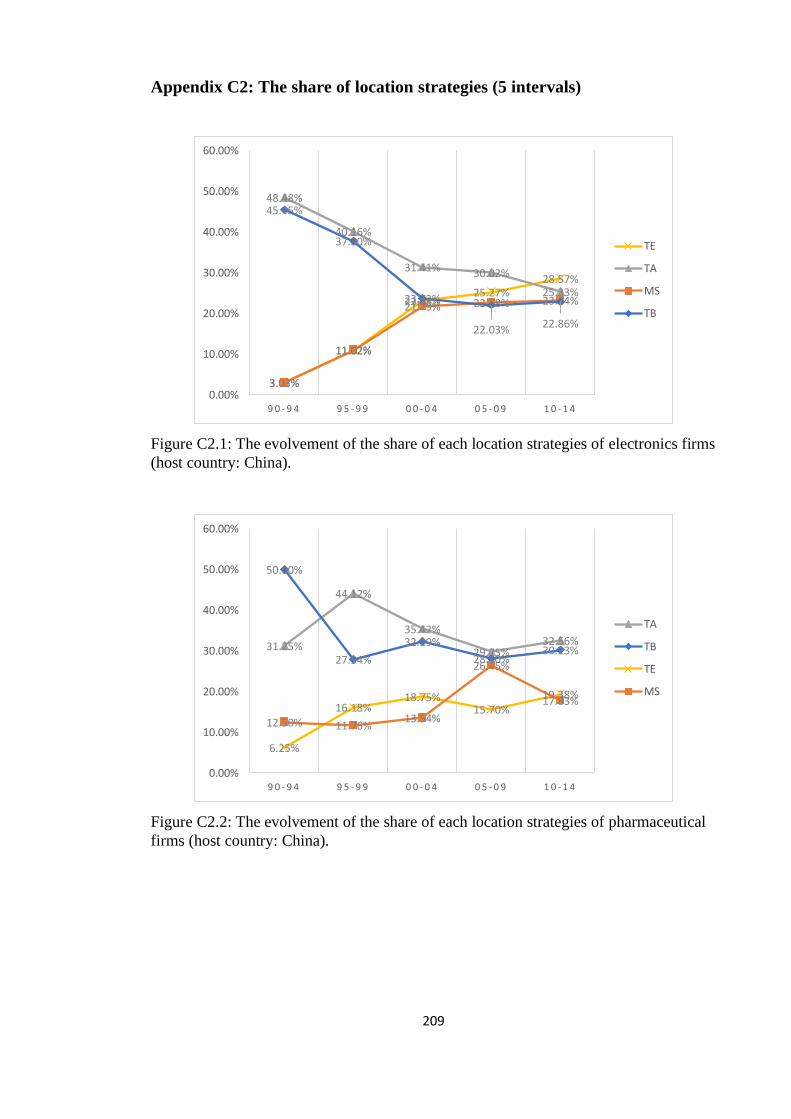
209
Appendix C2: The share of location strategies (5 intervals)
Figure C2.1: The evolvement of the share of each location strategies of electronics firms
(host country: China).
Figure C2.2: The evolvement of the share of each location strategies of pharmaceutical
firms (host country: China).
3.03%
11.02%
23.08%25.27%
28.57%
48.48%
40.16%
31.41% 30.02%
25.33%
3.03%
11.02%
21.79% 22.68% 23.24%
45.45%
37.80%
23.72%
22.03% 22.86%
0.00%
10.00%
20.00%
30.00%
40.00%
50.00%
60.00%
9 0 - 9 4 9 5 - 9 9 0 0 - 0 4 0 5 - 0 9 1 0 - 1 4
TE
TA
MS
TB
31.25%
44.12%
35.42%
29.75%32.56%
50.00%
27.94%
32.29%
28.10%30.23%
6.25%
16.18%18.75%
15.70%19.38%
12.50% 11.76%13.54%
26.45%
17.83%
0.00%
10.00%
20.00%
30.00%
40.00%
50.00%
60.00%
9 0 - 9 4 9 5 - 9 9 0 0 - 0 4 0 5 - 0 9 1 0 - 1 4
TA
TB
TE
MS

210
Figure C2.3: The evolvement of the share of each location strategies of electronics firms
(host country: other).
Figure C2.4: The evolvement of the share of each location strategies of pharmaceutical
firms
(host country: other).
29.23%
34.01% 33.37%
36.45%34.97%35.64%
30.25%
33.60%
26.67%28.91%
18.46%19.59%
18.58% 18.60%19.73%
16.67% 16.14%14.45%
18.28%16.39%
0.00%
5.00%
10.00%
15.00%
20.00%
25.00%
30.00%
35.00%
40.00%
9 0 - 9 4 9 5 - 9 9 0 0 - 0 4 0 5 - 0 9 1 0 - 1 4
TE
TB
TA
MS
31.58%29.93% 30.15%
28.84%
31.60%33.33%
31.69%
27.76%29.78% 29.00%
14.04% 13.38%
22.69%21.63% 20.82%21.05%
25.00%
19.40% 19.75%18.59%
0.00%
5.00%
10.00%
15.00%
20.00%
25.00%
30.00%
35.00%
9 0 - 9 4 9 5 - 9 9 0 0 - 0 4 0 5 - 0 9 1 0 - 1 4
TE
TB
MS
TA

211
Appendix C3: The share of location strategies (yearly)
Figure C3.1: The evolvement of the share of each location strategies of electronics firms
(host country: China; the year with less than 30 observations are removed).
Figure C3.2: The evolvement of the share of each location strategies of pharmaceutical
firms
(host country: China; the year with less than 30 observations are removed).
0.00%
20.00%
40.00%
60.00%
80.00%
100.00%
120.00%
19
90
19
91
19
92
19
93
19
94
19
95
19
96
19
97
19
98
19
99
20
00
20
01
20
02
20
03
20
04
20
05
20
06
20
07
20
08
20
09
20
10
20
11
20
12
20
13
20
14
TB
TA
TE
MS
0.00%
20.00%
40.00%
60.00%
80.00%
100.00%
120.00%
19
90
19
91
19
92
19
93
19
94
19
95
19
96
19
97
19
98
19
99
20
00
20
01
20
02
20
03
20
04
20
05
20
06
20
07
20
08
20
09
20
10
20
11
20
12
20
13
20
14
TA
TB
TE
MS

212
Figure C3.3: The evolvement of the share of each location strategies of electronics firms
(host country: other; the year with less than 30 observations are removed).
Figure C3.4: The evolvement of the share of each location strategies of pharmaceutical
firms
(host country: other; the year with less than 30 observations are remove).
0.00%
5.00%
10.00%
15.00%
20.00%
25.00%
30.00%
35.00%
40.00%
45.00%
19
90
19
91
19
92
19
93
19
94
19
95
19
96
19
97
19
98
19
99
20
00
20
01
20
02
20
03
20
04
20
05
20
06
20
07
20
08
20
09
20
10
20
11
20
12
20
13
20
14
TE
TB
TA
MS
0.00%
5.00%
10.00%
15.00%
20.00%
25.00%
30.00%
35.00%
40.00%
45.00%
19
90
19
91
19
92
19
93
19
94
19
95
19
96
19
97
19
98
19
99
20
00
20
01
20
02
20
03
20
04
20
05
20
06
20
07
20
08
20
09
20
10
20
11
20
12
20
13
20
14
TB
TE
TA
MS

213
Appendix C4: Exploitative patent vs. explorative patent
Figure C4.1: Share of exploitative and explorative patents filed by inventors in China of
firms in both pharmaceutical industry and computer and electronics industry.
Figure C4.2: Share of exploitative and explorative patents filed by selected firms.
0.00%
5.00%
10.00%
15.00%
20.00%
25.00%
30.00%
35.00%
40.00%
45.00%
50.00%
9 0 - 9 6 9 7 - 0 2 0 3 - 0 8 0 9 - 1 4
Explorative(electronics, China)
Explorative(pharma, China)
Exploitative(pharma, China)
Exploitative(electronics, China)
0.00%
10.00%
20.00%
30.00%
40.00%
50.00%
60.00%
70.00%
80.00%
90.00%
9 0 - 9 6 9 7 - 0 2 0 3 - 0 8 0 9 - 1 4
Explorative(electronics)
Exploitative(electronics)
Exploitative(pharma)
Explorative(pharma)
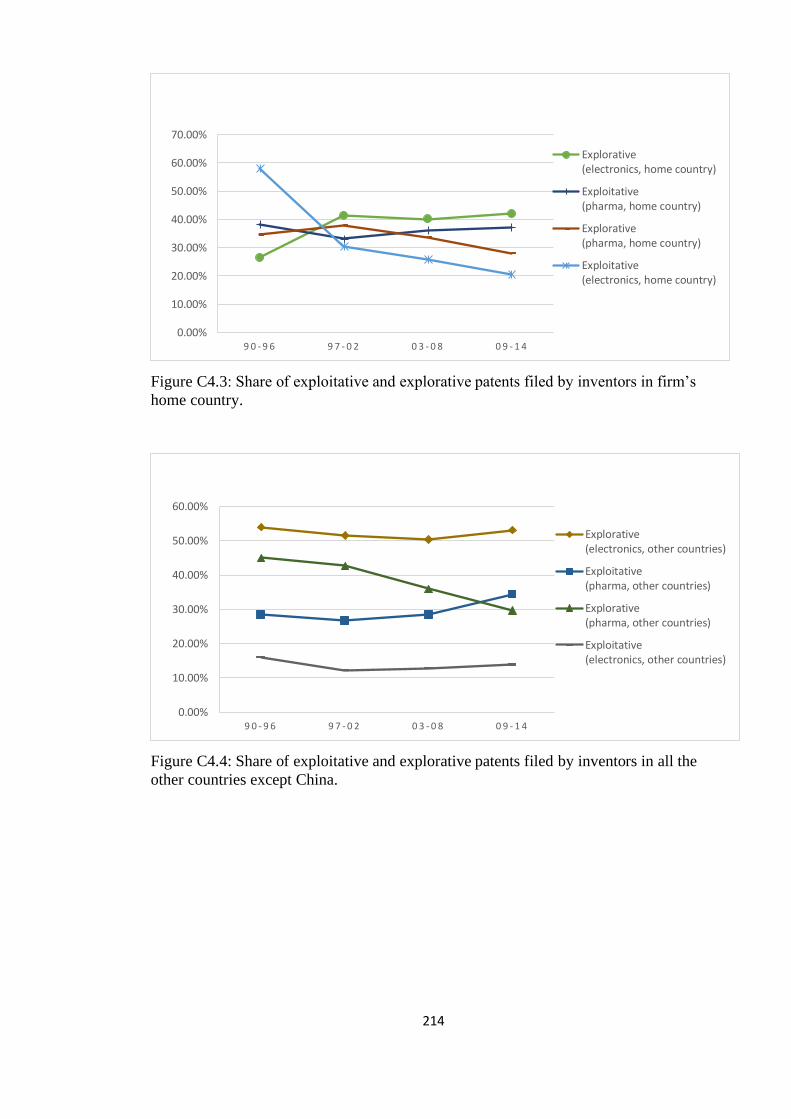
214
Figure C4.3: Share of exploitative and explorative patents filed by inventors in firm’s
home country.
Figure C4.4: Share of exploitative and explorative patents filed by inventors in all the
other countries except China.
0.00%
10.00%
20.00%
30.00%
40.00%
50.00%
60.00%
70.00%
9 0 - 9 6 9 7 - 0 2 0 3 - 0 8 0 9 - 1 4
Explorative(electronics, home country)
Exploitative(pharma, home country)
Explorative(pharma, home country)
Exploitative(electronics, home country)
0.00%
10.00%
20.00%
30.00%
40.00%
50.00%
60.00%
9 0 - 9 6 9 7 - 0 2 0 3 - 0 8 0 9 - 1 4
Explorative(electronics, other countries)
Exploitative(pharma, other countries)
Explorative(pharma, other countries)
Exploitative(electronics, other countries)

215
Figures C4.5: Share of exploitative patents filed by inventors in all the other countries
and China in computer and electronics industry.
Figures C4.6: Share of explorative patents filed by inventors in all the other countries
and China in computer and electronics industry.
0.00%
10.00%
20.00%
30.00%
40.00%
50.00%
60.00%
70.00%
80.00%
90.00%
9 0 - 9 6 9 7 - 0 2 0 3 - 0 8 0 9 - 1 4
Exploitative(electronics)
Exploitative(electronics, home country)
Exploitative(electronics, other countries)
Exploitative(electronics, China)
0.00%
10.00%
20.00%
30.00%
40.00%
50.00%
60.00%
9 0 - 9 6 9 7 - 0 2 0 3 - 0 8 0 9 - 1 4
Explorative(electronics, other countries)
Explorative(electronics, China)
Explorative(electronics, home country)
Explorative(electronics)

216
Figures C4.7: Share of exploitative patents filed by inventors in all the other countries
and China in pharmaceutical industry.
Figures C4.8: Share of explorative patents filed by inventors in all the other countries
and China in pharmaceutical industry.
0.00%
5.00%
10.00%
15.00%
20.00%
25.00%
30.00%
35.00%
40.00%
45.00%
9 0 - 9 6 9 7 - 0 2 0 3 - 0 8 0 9 - 1 4
Exploitative(pharma, home country)
Exploitative(pharma, other countries)
Exploitative(pharma)
Exploitative(pharma, China)
0.00%
5.00%
10.00%
15.00%
20.00%
25.00%
30.00%
35.00%
40.00%
45.00%
50.00%
9 0 - 9 6 9 7 - 0 2 0 3 - 0 8 0 9 - 1 4
Explorative(pharma, other countries)
Explorative(pharma)
Explorative(pharma, home country)
Explorative(pharma, China)

217
Appendix C5: Fixed effects regression results of pharmaceutical industry and electronics industry respectively
Table C5.1: Dependent variable: the share of four location strategies that firms adopted in China (until 2010).
Technology building Market seeking Technology augmenting Technology exploiting
Model 5a
(electronics
industry)
Model 5b
(pharma industry)
Model 6a
(electronics
industry)
Model 6b
(pharma industry)
Model 7a
(electronics
industry)
Model 7b
(pharma industry)
Model 8a
(electronics
industry)
Model 8b
(pharma industry)
host_ip 0.004 (0.005) -0.070*** (0.011) 0.013* (0.006) 0.040** (0.014) -0.027*** (0.006) 0.039 (0.026) 0.012* (0.006) -0.007 (0.014)
host_ruleoflaw -0.032 (0.020) -0.669*** (0.043) -0.075** (0.028) -0.018 (0.057) 0.389*** (0.028) 0.432*** (0.105) -0.213*** (0.026) 0.232*** (0.058)
home_ip -0.024** (0.007) 0 (omitted) 0.030** (0.009) 0 (omitted) -0.016† (0.009) 0 (omitted) -0.026** (0.009) 0 (omitted)
Institu_dis -0.000 (0.003) -0.043*** (0.010) 0.002 (0.005) 0.023† (0.012) 0.010 (0.005) 0.045† (0.023) 0.001 (0.004) -0.028* (0.013)
Control
cn_explor_r -0.001 (0.004) 0.022* (0.010) -0.005 (0.006) -0.009 (0.024)
cn_exploi_r 0.005 (0.016) -0.016 (0.019) -0.009(0.015) -0.026 (0.019)
ln_rnd_year 0.006 (0.004) 0.021** (0.007) 0.004 (0.005) 0.019* (0.009) -0.045*** (0.005) -0.053** (0.017) 0.038*** (0.005) 0.017† (0.009)
rrnd 0.040 (0.043) -0.082 (0.066) 0.025 (0.058) 0.002 (0.086) -0.120* (0.058) 0.143 (0.160) 0.044 (0.055) -0.076 (0.087)
ln_emp 0.007 (0.005) 0.048* (0.023) -0.015* (0.007) -0.021 (0.031) -0.022** (0.007) 0.015 (0.057) 0.021** (0.007) -0.019 (0.032)
roa 0.000 (0.000) 0.001† (0.000) -0.000 (0.000) -0.001† (0.001) -0.000 (0.000) 0.001 (0.001) 0.000 (0.000) 0.000 (0.001)
-cons 0.234*** (0.042) 0.089 (0.135) 0.180** (0.057) 0.010 (0.179) 0.633*** (0.057) 0.190 (0.329) -0.030 (0.054) 0.649** (0.181)
n (obs) 392 100 392 100 392 100 392 100
N (groups) 57 14 57 14 57 14 57 14
F stat 3.75*** 42.05*** 5.35*** 5.14*** 78.69*** 3.16** 38.70*** 10.65***
Standard errors in brackets. Significance levels: † p<0.10, * p<0.05, ** p<0.01, *** p<0.001

218
Chapter 6 Conclusions
The main research question motivating this study was “do institutional factors influence
the offshoring innovation activities? And specifically, what is the role of IPR for
offshoring of innovation?”. The three research papers presented in this thesis have
analysed the role that institutions (especially IPR) play on offshoring innovation
activities from three different aspects. This chapter summarises the key findings of the
thesis, and its contributions and possible implications. We also discuss the limitations of
this research and account for future research directions. This chapter is organised as
follows: Section 6.1 brings together the main findings of the three papers; Section 6.2
highlights the contributions of the thesis to the extant literature and its potential
implications; Section 6.3 discusses the limitations of this research and suggests future
research directions.
6.1 Summary of findings
This thesis aims to identify the influences institutions have on offshoring innovation
activities, especially the influence of IPR. We have analysed their effects from three
different but interrelated dimensions. First, we carried out a detailed analysis of the
evolution of the Chinese IP system from the perspective of both the written law and the
law in practice, and the seemingly coevolving innovation activities in China over the
period 1980s-2017. Second, we tested the relationships between institutional factors
(especially IPR) and offshore governance choices, as well as their effects on achieving
certain business outcomes (i.e., focus on core competencies, access to qualified
personnel, improve organisational flexibility, increase in firm’s overall competitiveness,
increase productivity/efficiency, improve service quality, better access to new markets,
and breakthrough process improvement(s)). Third, we focussed on MNCs in the
pharmaceutical and computer and electronics industries which have established R&D
centres in China, analysed the evolution of their location strategies, and tested the effect
that institutions (in particular IPR) have on the choice of location strategies. The main
findings of each dimension are discussed in more detail below.

219
6.1.1 Summary of findings: The evolution of the Chinese IPR system - Phases of
changes and impact on innovation and international business
Institutional theory suggests that the success of business activities is affected by its
institutional environment (Scott, 2008), and therefore it is important to consider its
influence when analysing MNCs’ offshoring activities. The IPR regime of a country is a
vital factor to MNCs which offshore innovation activities as it affects MNCs’ offshore
governance choices and R&D strategies (Bardhan & Jaffee, 2005; Oxley, 1999).
Despite China being an attractive offshoring destination, the status and quality of its
IPR regime remains unclear, and few studies have comprehensively studied it.
We developed an assessment scheme with five dimensions (i.e., the scope of protection,
the duration of protection and clarity of procedural provisions, enforcement
mechanisms, protection strength of IPR, and the restrictions on IPR) based on the work
of Ginarte and Park (1997), which is used to identify whether the revisions have
improved the quality of IP laws in China. By using this framework to analyse each
provision that has been amended, we note that new amendments are issued for the
Patent law, the Trademark law, and the Copyright law around the year 2000, when
China was trying to become a member of WTO. The changes that were implemented
over this time almost covered the five aspects described above. They expanded the
scope of IP protection by including more objects or acts that can be protected by law,
simplified the procedures related to application, approval, re-examination and dispute
solving, increased the amount of compensation, authorised more power to both
administrative and judiciary authorities for stronger IP enforcement, and also perfected
the provision related to IP rights restrictions. It can be concluded that the revisions made
in this period have resulted in radical improvement to the Chinese IP laws. Based on
this solid foundation, all the three IP laws were revised again in 2008, and our analysis
show that the quality of IP laws (both Patent law and Trademark law) were further
improved.
With regard to the IP enforcement in China, the results show that the number of patent
related cases handled by the State Intellectual Property Office and the amount of fines
imposed on each trademark infringement case continues to increase, which suggest that
the IP enforcement conducted by related administrative authorities is strengthening. The
number of IP related cases of first instance accepted and concluded by local people’s
courts also continues to increase, and the number of IPR-related criminal cases

220
concluded and the number of suspects sentenced in such cases is increasing gradually as
well. This indicates that the IP enforcement is strengthening, and the previous situation
of little to no criminal convictions for IP infringement which scholars have highlighted
in their studies is also improving. It is interesting to note that the number of cases
involving foreigners or foreign enterprises which are handled by courts constitutes only
a small proportion of the total number of cases, suggesting that most of the IP related
disputes happened between local people or enterprises. Furthermore, we reviewed the IP
activities in China by analysing the number of patent applications and patents granted,
and the number of applications of trademark registration. The results show that IP
activities remained at a low level before the year 2000, but from then a tremendous
increase started, which further accelerated after 2008, indicating that IP activities are
coevolving with the IP system development in China. These findings therefore provide
a comprehensive and updated understanding of the Chinese IP system.
6.1.2 Summary of findings: The influences that institutional environment in host
countries have on the choice of offshore governance mode and firm performance
Governance choices could affect MNC’s performance, and are considered important
strategic decisions when offshoring business functions (Hutzschenreuter, et al., 2011).
In Chapter 4 (Paper 2) we analysed the effect of institutional factors (rule of law, IPR)
on offshore governance choices and firm performance regarding offshoring innovation
activities.
We used survey data from the ORN database, and focused on firms that offshored
product design, R&D, software development, and engineering services. Our results
partly support the results from previous studies which have stated that offshore
outsourcing is preferred when IPR protection in host countries is strong (Kshetri, 2007;
Oxley, 1999), but also showed something quite different. Kshetri (2007) stated that
firms often adopt captive mode in countries with weak legal systems, however our
regression results show that the quality of rule of law in host countries is positively
related to the probability of choosing captive mode. Further, researchers find that
strategic investment in property, for example machinery and brands, can be at risk in
environments where the rule of law is considered weak (Levie & Autio, 2011). Given
that substantial investments are typically required in captive mode, which in turn would

221
result in heavy financial losses if the operation fails, a weak legal protection system in
host countries could increase the risks firms face when opting for captive mode. This
can explain our results, and suggest that MNCs will be more committed to the
offshoring destination if the protection of legal system in the host country is strong. In
addition, a firm’s concerns about the IPR protection in host countries do not show
significant impact on the governance choices.
The effect of institutional factors and governance choices on achieving certain offshore
outcomes was also tested. Previous literature suggested that firms select their
governance modes based on their purpose of maximising their performance, and it is the
alignment between governance and the prediction of governance based on a relevant
conceptual framework (e.g., TCE, RBV) that affects performance (Shavers, 1998;
Brouthers, 2002). Scholars have stated that collaborations with suppliers via offshore
outsourcing can offer firms access to new resources (which include talent resources and
technological resources from suppliers in host countries), better focus on core
competencies by outsourcing peripheral business activities, as well as enhancing focal
firms’ flexibility (Bertrand, 2011; Kedia & Lahiri, 2007; Contractor, et al., 2010;
Javalgi, et al., 2009). Our results support these statements by showing that firms who
fail to adopt outsourcing are less likely to achieve the outcome of better focus on core
competencies, better access to personnel, improving organisational flexibility, and
increase firm’s overall competitiveness.
Our results also show that failure to select captive mode is positively related to the
probability of achieving the outcomes of improved organisational flexibility, increased
firm’s overall competitiveness, and increased productivity/efficiency. This could be
attributed to the fast and tremendous development of outsourcing industry, the
improved quality of service from the service providers may still deliver some
efficiencies and allow to achieve certain performance outcomes by selecting
outsourcing although the model predicted is to select captive mode (Lacity, et al., 2009;
Quinn, 2000). Thus, the results suggest that governance misfit does not always hurt
firm’s performance.
Barro (2000) identified a positive relationship between the economic performance and
quality of rule of law. Researchers argue that strategic innovation activities are still
being carried out in developed economies (Manning, et al., 2008; Doh, et al., 2009), and
offshoring innovation activities to such countries could help firms to utilise the

222
technological resources and strengthen their core competencies, which explains our
regression results that rule of law in host countries is positively related to the probability
of focusing on core competencies. Scholars have also stated that offshoring innovation
activities to emerging countries not only provides firms “round-the-clock” services to its
product development, customer services and opening new markets to firms, but it also
offers firms specific locational resources and enhanced innovation capabilities (Siems &
Ratner, 2003; Bryson, 2007; Chung & Alcácer, 2002). However, emerging countries
normally do not possess strong and complete legal systems, which could explain why
the quality of rule of law in host countries is negatively related to the probability of
increasing the firm’s overall competitiveness, improving service quality, accessing new
markets, and achieving breakthrough process improvement(s). In addition, we find that
IPR protection strength in host countries is negatively related to the probability of better
accessing qualified personnel. This could be because the weak IPR protection strength
in emerging countries is a big concern to many firms, but the availability of talent in
those countries is also an important factor that attracts firms to offshore innovation
activities there (Massini & Lewin, 2012; Bardhan & Jaffee, 2005). Although offshoring
innovation activities to countries with weak IPR protection will make firms face higher
risk of IP leakage, firms also gain the opportunities to learn about their competitors’
technologies in such countries (Aron & Singh, 2005). By offshoring non-core
innovation activities to countries with weak IPR protection but offering cheap labour
and great pool of talent, firms are better able to focus on core competencies. This could
explain why the quality of IPR protection in host countries is negatively related to
achieving the outcome of better focus on core competencies. However, whether the IPR
regime of a host country affects firm’s R&D strategies (e.g., what type of technologies
are to be offshored) in the given country could not be answered from the results
presented in this chapter. This motivated us to test such relationships, the results of
which are presented in Chapter 5 (Paper 3).
6.1.3 Summary of findings: Why do multinational firms locate R&D to China? An
analysis of the determinants of location strategies
In Chapter 5, we focused on 79 MNCs in the pharmaceutical and computer and
electronics industries that have R&D labs in China. Following the methods developed
223
by Patel and Vega, we used patent data extracted from PATSTAT to calculate the share
of each location strategy that these firms adopted in a given year.
Our descriptive results partly support findings from previous studies, which have shown
that technology augmenting is the primary motive driving MNCs to go abroad, and that
pharmaceutical firms are driven more by technology augmenting than electronics firms.
(Laurens, et al., 2015; Le Bas & Sierra, 2002; Patel & Vega, 1999). However, our
results also differ from previous studies by showing that technology building is a key
strategy for firms to choose China (especially for pharmaceutical firms), and that the
importance of market seeking and technology exploiting is gradually increasing. The
results indicate that technology seeking (technology augmenting and technology
building) constitutes a big part of motives for MNCs offshoring R&D activities to
China. Although China traditionally does not possess strong technological competencies
in pharma, it is still an attractive destination for pharma firms from countries which do
not have these capabilities (e.g., semiconductors, nanotechnology). As for computer and
electronics firms, the increasing share of technology exploiting strategy indicate that as
China is gradually obtaining technology advantages in computer and electronics field,
firms are more willing to locate the technologies that firm’s home country has a relative
specialisation in (technology augmenting and technology exploiting became the two
dominant strategies since 2003) there.
We further analyse whether the institutions (IPR and rule of law) affect the choice of
these location strategies, and our results show that the IPR protection strength of China
is positively related to the share of market seeking and technology exploiting strategies.
This is an indication that when firms are planning to conduct R&D activities in areas in
which China is not specialised, they are more likely to offshore such activities if the IPR
protection regime in China is strong. We find that IPR protection regime in a firm’s
home country is negatively related to the share of technology exploiting strategy, which
indicates that when IPR protection strength in a firm’s home country is strong, a firm
will be more reluctant to offshore technologies with a relative technological advantage
in the home country. Our findings suggest that firms are more concerned about IPR
protection in home and host countries when using technology exploiting strategy, i.e.
locating technologies in which the home country has a relative technological advantage
but the host country does not, since this strategy may lead to higher risk of IP leakage.
The regression results also show that both the IPR protection strength of China and

224
firm’s home country, and the quality of rule of law in China, is negatively related to the
share of technology building strategy. This may suggest that technology building can be
adopted as an explorative R&D strategy to fully utilise the resources in countries with
weak legal systems.
In summary, this thesis analyses the influence that institutional factors (IPR and rule of
law) have on offshoring decisions utilising varied data sources and research methods.
First, by analysing the provisions of IP laws and IP related data published by
governments, Chapter 3 (Paper 1) indicates that the IPR protection regime in China is
improving and also suggests coevolution of innovation activities and IP system
development. Second, in Chapter 4 (Paper 2), we find that the quality of host country’s
legal system can strengthen firm’s commitment to the country, and firms will be more
willing to outsource innovation activities to a country with better IPR protection. The
results also show that institutional factors can affect achieving business outcomes
offshore, in particular, that accessing to qualified personnel is more likely to be
achieved in a country with weaker IPR protection, and focussing on core competencies
is more likely to be achieved in a country with higher quality of rule of law but weaker
IPR protection. We used survey data in this chapter, which reflects the respondents’
perception of importance of factors regarding governance choices, and it covers firms
that offshored innovation activities to different countries. Although efforts have been
made in the ORN to identify the most appropriate person to respond, limitations still
exist since a respondent’s subjective opinion may not be able to reflect fully the
decision making process for offshoring in firms, especially for implementations further
back in time, unless the respondent was directly involved in the decision. Unfortunately,
it is not possible to control for this potential bias. Furthermore, we are unable to identify
the specific R&D strategies firms adopted by using these data. For example, many
pharmaceutical firms have established R&D labs in China, but the R&D activities
conducted in the lab may be less central to the firm’s strategy than the ones conducted
in the firm’s home country or other developed countries. Therefore, using patent data in
Chapter 5 (Paper 3) to analyse the location strategies from the technology field aspect,
can overcome some of these limitations and complement the findings in Chapter 4. In
Chapter 5, we find that technology seeking (technology augmenting and technology
building) strategies play an important role in driving MNCs to locate R&D activities in

225
China, that technology augmenting strategy will be preferred if the quality of rule of law
in China is improving, and that the share of technology exploiting strategy will be
higher if the IPR protection in China is better. The results also suggest that MNCs may
still choose a country with weak legal system to conduct explorative research to
supplement the technologies which are not available at home.
6.2 Contributions and implications
This PhD thesis uses different data sources and both qualitative and quantitative
research methods to comprehensively test the relationships between institutional factors
and different aspects of offshoring innovation activities. Its theoretical and empirical
contributions are five-fold.
First, instead of approaching the IPR regime in China based on previous economic and
business research, news, other government’s reports, we developed a novel five-
dimension assessment scheme (the scope of protection, the duration of protection and
clarity of procedural provisions, enforcement mechanisms, protection strength of IPR,
and the restrictions on IPR) based on the work of Ginarte and Park (1997), which
provides a clear guidance when evaluating the quality of IP law revisions. Second, since
the IPR regime in China has been an important topic in previous studies, this research
discusses systematically for the first time the changes of IP laws and enforcement over a
period of 20 years, using the five-dimensional assessment scheme, and in doing so, we
provide a comprehensive understanding of the Chinese IP laws and practice. Our results
contribute to the existing literature by showing that the IPR protection China is
improving, and confirmed that the TRIPS agreement have provided a solid foundation
for China to improve its IP system.
Third, previous studies have stated that both captive offshoring and offshore
outsourcing may increase the risk of IP losses, which may be caused by weak IPR
protection in the host country (Razzaque & Sheng, 1998; Griffith, et al., 2009). This
research contributes to the governance mode choices literature and the roles that
institutional factors play when offshoring, and have extended previous work regarding
the relationship between governance choices and firm performance by focusing on
offshoring innovation. Our study also find that the institutions of host countries and
governance mode misalignment have an effect on the achievement of certain offshore

226
outcomes (i.e., focus on core competencies, access to qualified personnel, improve
organisational flexibility, increase in firm’s overall competitiveness, increase
productivity/efficiency, improve service quality, better access to new markets, and
breakthrough process improvement(s)), which was not systematically analysed in
previous studies.
Fourth, previous research regarding location strategies only focused on a short period of
time, while this study has analysed the evolution of the location strategies MNCs
adopted in managing R&D activities in China. Thus, we believe that this paper
contributes in a novel way to develop a fuller and deeper understanding of how MNCs
manage their R&D activities in China. Finally, we have extended previous works by not
only identifying the dominant location strategies (Patel & Vega, 1999; Le Bas & Sierra,
2002; Laurens, et al., 2015), but also tested the influence of institutional factors (i.e. IPR
protection strength of home and host countries, quality of rule of law, and institutional
distance) on the choices of these location strategies.
The thesis has three major managerial implications. First, for MNCs which are
concerned about the IPR regime in China, this study provides a comprehensive analysis
of Chinese IP system and its development, which could help MNCs to make decisions
that may be affected by the IPR protection. Second, this study has identified that
relationships between governance choices and institutions do exist. We also analysed
the effect that institutions and governance choices have on achieving offshore outcomes.
MNCs can learn from this thesis about the roles that institutional factors play when
making decisions regarding governance choices. They can also learn how certain types
of outcomes via offshoring are related to the different governance modes they can
choose and what type of institutional environment they need to consider, for example,
choosing outsourcing in countries with good IPR protection, or, if a firm wants to
improve its core competencies, choosing a country with a more robust legal system.
Third, we find that institutional factors (IPR and rule of law) affect the choice of
location strategies, therefore, this thesis can provide guidance to decision makers in
corporations regarding what needs to be considered when making decisions regarding
offshoring R&D activities to China, and how to organise these R&D activities. For
example, firms could adopt technology exploring type of strategies to utilise the
technology advantages in host countries which have weak IPR protection.
227
From the government policy makers’ perspective, this research provides guidance on
the following aspects: first, the results in Chapter 4 show that the quality of rule of law
in host countries is positively related to the choice of captive mode. Therefore, a country
that wishes to strengthen foreign MNCs’ commitment by establishing wholly-owned
subsidiaries or to attract more FDI, the policy makers should improve its legal system
by revising its laws and strengthening the law enforcement. Second, in Chapter 4 we
find that if the IPR protection in a host country is stronger, the probability of choosing
outsourcing mode will be higher. Studies have shown that offshore outsourcing can also
bring benefits to local firms in host countries, since it offers greater learning
opportunities for suppliers to acquire advanced technology, knowledge of international
markets, new product development skills, R&D skills and so on, which can provide
them with opportunities to get closer to the technological frontier (Ernst, 2000; Li, et al.,
2010). If policy makers want to improve the innovation performance of indigenous
firms by attracting MNCs to outsource more advanced innovation activities and to
stimulate the development and prosperity of local service providers, they should
strengthen the IPR protection. The results in Chapter 5 also show that the IPR protection
in China is positively related to the share of technology exploiting strategy which
represents that the technology offshored is the technologies MNCs have specialisation
in home country, but China is comparatively weak. Previous studies have stated that
R&D activities conducted by MNCs in host country positively influences the innovation
performance of local firms (Liu & Buck, 2007). Therefore, if emerging countries like
China want local firms to access to MNCs’ technologies, or if they want to attract
technologies in industries in which host country is comparatively weak, the quality of
IPR protection regime in host country should be improved to provide a reliable
institutional environment.
6.3 Limitations and future research
Despite the several contributions of this thesis, limitations also exist in this research that
could be addressed in future research.
First, two out of the three papers in this thesis are about China. Although the discussion
presented in Section 2.1 justified our choice of focusing on China, it is a country with a
big and heterogeneous landscape, large population size, and a unique political system.

228
Whether the findings concerning China are applicable to other emerging countries is not
clear. Future research could include other host countries which share different country
characteristics.
Second, the survey data used in Chapter 4 covers a wide range of firms with different
sizes, that offshored to varied locations, and who operates in different industries. It also
contains comprehensive information of respondent’s perception of the importance of
factors which may affect their offshoring decisions. However, the survey was no longer
conducted after 2011, and firm’s perception regarding offshoring may have changed
since then. In order to better contribute to the literature and reflect the current offshoring
situation, future research should be carried out based on updated survey data. Since this
database mainly aims to identify the factors that affect offshoring decisions, some firm
information is not available (for example, R&D spending). Future research can combine
the survey data with other databases to enrich our understanding of the sample firms.
Furthermore, the empirical analysis treats governance choices as dichotomous, but in
practice firms may select varied governance solutions to deal with different tasks and
engage in collaborations or joint ventures so that governance choices in reality appear as
a spectrum in between the two extremes considered in this study. However, in the ORN
database there are only few cases of such intermediate governance modes which would
not have allowed for robust analyses. Therefore, this is a data-driven limitation which
we could not address in the thesis. In-depth interviews could be conducted in future
research to test the validity of our findings, filling the gaps which cannot be addressed
in empirical analysis, and can also provide us a deeper understanding of their choices,
and how they manage their business activities.
Third, the findings regarding location strategies are based on MNCs in the computer
and electronics industry and the pharmaceutical industry, which are both knowledge-
intensive industries with specific characteristics. Although we drew conclusions which
are restricted to these industries, in order to test the validity of our findings across
industry more broadly, future studies could include more industries establishing &D
labs in other countries.
Fourth, patent data is widely used as an indicator of innovation output. However, we
note the limitations of patent data as an indicator for innovation. For example, patenting
is not the only way to protect inventions, and not all innovations are patentable since
patenting requires meeting the patentability criteria according to patent law (Hall, et al.,
229
2001; Braun, et al., 2011; Basberg, 1987). Case studies could be adopted in future
research to test our findings.
Finally, this thesis analysed the factors that affect governance choices and focused on
firms that have R&D centres established in China. However, these firms may also
cooperate with local suppliers while having established R&D labs. Since the patent data
cannot tell whether a supplier contributed to a patent, future research could adopt
qualitative research methods to further analyse a firm’s R&D strategies. For example,
interviews can be conducted with firms from both demand and supply side, identifying
what type of R&D activities firm choose to keep in-house, and what type of R&D
activities they choose to outsource.

230
References
Argyres, N. S. & Zenger, T. R., 2012. Capabilities, Transaction Costs, and Firm
Boundaries. Organization Science, 23(6), pp. 1643-1657.
Aron, R. & Singh, J. V., 2005. Get offshoring right. Harvard Business Review, 83(12),
pp. 135-143.
Awokuse, T. O. & Yin, H., 2010. Does Stronger Intellectual Property Rights Protection
Induce More Bilateral Trade? Evidence from China’s Imports. World Development,
38(8), pp. 1094-1104.
Bardhan, A. D., 2006. Managing globalization of R&D: Organizing for offshoring
innovation. Human Systems Management, 25(2), pp. 103-114.
Bardhan, A. D. & Jaffee, D. M., 2005. Innovation, R&D and offshoring. Fisher Center
for Real Estate & Urban Economics.
Barney, J., 1991. Firm Resources and Sustained Competitive Advantage. Journal of
Management, 17(1), pp. 99-120.
Barro, R. J., 2000. Rule of law, democracy and economic performance. In: Index of
economic freedom. New York: Heritage Foundation, pp. 31-51.
Basberg, B. L., 1987. Patents and the measurement of technological change: A survey
of the literature. Research Policy, 16(2-4), pp. 131-141.
Belderbos, R., Carree, M. & Lokshin, B., 2004. Cooperative R&D and firm
performance. Research Policy, 33(10), pp. 1477-1492.
Bertrand, O., 2011. What goes around, comes around: Effects of offshore outsourcing
on the export performance of firms. Journal of International Business Studies, 42(2),
pp. 334-344.
Birkinshaw, J., 2002. Managing Internal R&D Networks in Global Firms: What Sort of
Knowledge is Involved?. Long Range Planning, 35(3), pp. 245-267.
Brander, J. A., Cui, V. & Vertinsky, I., 2017. China and intellectual property rights: A
challenge to the rule of law. Journal of International Business Studies, 48(7), pp. 908-
921.
Braun, F. G., Hooper, E., Wand, R. & Zloczysti, P., 2011. Holding a candle to
innovation in concentrating solar power technologies: A study drawing on patent data.
Energy Policy, 39(5), pp. 2441-2456.
Brouthers, K. D., 2002. Institutional, Cultural and Transaction Cost Influences on Entry
Mode Choice and Performance. Journal of International Business Studies, 33(2), pp.
203-221.
Brouthers, K. D., 2002. Institutional, Cultural and Transaction Cost Influences on Entry
Mode Choice and Performance. Journal of International Business Studies, 33(2), pp.
203-221.
231
Brouthers, K. D., Brouthers, L. E. & Werner, S., 2008. Resource-Based Advantages in
an International Context. Journal of Management, 34(2), pp. 189-217.
Bruche, G., 2009. The Emergence of China and India as New Competitors in MNCs'
Innovation Networks. Competition & Change, 13(3), pp. 267 - 288.
Bryson, J. R., 2007. The 'second'global shift: The offshoring or global sourcing of
corporate services and the rise of distanciated emotional labour. Geografiska Annaler:
Series B, Human Geography, 89(Supplement s1), pp. 31-43.
Bunyaratavej, K., Hahn, E. D. & Doh, J. P., 2007. International offshoring of services:
A parity study. Journal of International Management, 13(1), pp. 7-21.
Cadarso Vecina, M. Á., Gómez Sanz, N., López Santiago, L. & Tobarra Gómez, M. Á.,
2012. offshoring components and their effect on employment firms deciding about how
and where. Applied Economics, 44(8), pp. 1009-1020.
Caniato, F. et al., 2015. Location drivers, governance model and performance in service
offshoring. International Journal of Production Economics, Volume 163, pp. 189-199.
Cao, Q., 2014. Insight into weak enforcement of intellectual property rights in China.
Technology in Society, Volume 38, pp. 40-47.
Carsten, P., 2014. Reuters. [Online]
Available at: http://www.reuters.com/article/2014/09/24/us-adobe-systems-china-
idUSKCN0HJ0WY20140924
[Accessed 10 February 2015].
Chen, H. & Hu, M. Y., 2002. An analysis of determinants of entry mode and its impact
on performance. International Business Review, 11(2), pp. 193-210.
Chung, W. & Alcácer, J., 2002. Knowledge Seeking and Location Choice of Foreign
Direct Investment in the United States. Management Science, 48(12), pp. 1534-1554.
Contractor, F. J., Kumar, V., Kundu, S. K. & Pedersen, T., 2010. Reconceptualizing the
firm in a world of outsourcing and offshoring: The organizational and geographical
relocation of high‐value company functions. Journal of management studies, 47(8), pp.
1417-1433.
Contractor, F. J., Kumar, V., Kundu, S. K. & Pedersen, T., 2010. Reconceptualizing the
Firm in a World of Outsourcing and Offshoring: The Organizational and Geographical
Relocation of High-Value Company Functions. Journal of Management Studies, 47(8),
pp. 1417-1433.
Cox, A. J. & Sepetys, K., 2009. Intellectual Property Rights Protection in China:
Trends in Litigation and Economic Damages. [Online]
Available at: https://ssrn.com/abstract=1330619
[Accessed 22 September 2018].
D’Agostino, L. M., Laursen, K. & Santangelo, G. D., 2013. The impact of R&D
offshoring on the home knowledge production of OECD investing regions. Journal of
economic geography, 13(1), pp. 145-175.

232
Delios, A. & Henisz, W. J., 2003. Policy uncertainty and the sequence of entry by
Japanese firms, 1980–1998. Journal of International Business Studies, 34(3), pp. 227-
241.
Demirbag, M. & Glaister, K. W., 2010. Factors determining offshore location choice for
R&D projects: A comparative study of developed and emerging regions. Journal of
Management Studies, 47(8), pp. 1534-1560.
Doh, J. P., Bunyaratavej, K. & Hahn, E. D., 2009. Separable but Not Equal: The
Location Determinants of Discrete Services Offshoring Activities. Journal of
International Business Studies, 40(6), pp. 926-943.
Dossani, R. & Kenney, M., 2006. Reflections upon ‘‘sizing the emerging global labor
market’’. Academy of Management Perspectives, 20(4), pp. 35-41.
Dossani, R. & Kenny, M., 2007. The Next Wave of Globalization: Relocating Service
Provision to India. World Development, 35(5), pp. 772-791.
Dou, E., 2014. Apple Goes on Hiring Binge in Asia to Speed Product Releases. [Online]
Available at:
http://online.wsj.com/news/articles/SB100014240527023043607045794166602155078
16
[Accessed 28 May 2014].
Dunning, J., 1980. Towards an eclectic theory of international production: some
empirical tests. Journal of International Business Studies, 11(1), pp. 9-31.
Dunning, J., 1988. Explaining International Production. London: Harper Collins.
Dunn, K., Kohlbeck, M. & Magilke, M., 2009. Future Profitability, Operating Cash
Flows, and Market Valuations Associated with Offshoring Arrangements of
Technology Jobs. Journal of Information Systems, 23(2), pp. 25-47.
Elia, S., Caniato, F., Luzzini, D. & Piscitello, L., 2014. Governance Choice in Global
Sourcing of Services: The Impact on Service Quality and Cost Saving Performance.
Global Strategy Journal, 4(3), pp. 181-199.
Ernst, D., 2000. Inter-Organizational Knowledge Outsourcing: What Permits Small
Taiwanese Firms to Compete in the Computer Industry?. Asia Pacific Journal of
Management, 17(2), pp. 223-255.
Ernst, D., 2006. Innovation offshoring: Asia’s emerging role in global innovation
networks, Honolulu: East-West Center.
Fingar, C., 2015. China passes US in race for FDI in research and development.
[Online]
Available at: http://www.ft.com/cms/s/3/241d9366-3058-11e5-91ac-
a5e17d9b4cff.html?siteedition=uk#axzz4AiHcQ1bW
[Accessed 22 April 2016].
Flores, R. G. & Aguilera, R. V., 2007. Globalization and location choice: an analysis of
US multinational firms in 1980 and 2000. Journal of International Business Studies,
38(7), pp. 1187-1210.
233
Frobel, F., Heinrich, J. & Kreye, O., 1980. The New Internaltional Division of Labour.
London: Cambridge University Press.
Gammeltoft, P., 2006. Internationalisation of R&D: trends, drivers and managerial
challenges. International Journal of Technology and Globalization, pp. 177-199.
Ginarte, J. C. & Park, W. G., 1997. Determinants of patent rights: A cross-national
study. Research Policy, 26(3), pp. 283-301.
Gonzalez, R., Gasco, J. & Llopis, J., 2006. Information systems offshore outsourcing: a
descriptive analysis. Industrial Management & Data Systems, 106(9), pp. 1233-1248.
Gooris, J. & Peeters, C., 2014. Home–Host Country Distance in Offshore Governance
Choices. Journal of International Management, 20(1), pp. 73-86.
Gooris, J. & Peeters, C., 2016. Fragmenting global business processes: A protection for
proprietary information. Journal of International Business Studies, 47(5), pp. 535-562.
Gott, J. & Sethi, A., 2017. 2017 Global Services Location Index, s.l.: A.T. Kearney.
Greguras, F., 2007. Intellectual property strategy and best practices for R&D services in
China. Computer Law & Security Review, 23(5), pp. 449-452.
Griffith, D. A., Harmancioglu, N. & Droge, C., 2009. Governance decisions for the
offshore outsourcing of new product development in technology intensive markets.
Journal of World Business, 44(3), pp. 217-224.
Grossman, G. M. & Rossi-Hansberg, E., 2008. Trading tasks: a simple theory of
offshoring. The American Economic Review, 98(5), pp. 1978-1997.
Hall, B. H., Jaffe, A. B. & Trajtenberg, M., 2001. The NBER Patent Citation Data File:
Lessons, Insights and Methodological Tools. NBER Working Paper No. 8498.
Hu, A. G. & Jefferson, G. H., 2009. A great wall of patents: What is behind China's
recent patent explosion?. Journal of Development Economics, 90(1), pp. 57-68.
Hutzschenreuter, T., Lewin, A. Y. & Dresel, S., 2011. Governance modes for offshoring
activities: a comparison of US and German firms. International Business Review, 20(3),
pp. 291-313.
Javalgi, R. G., Dixit, A. & Scherer, R. F., 2009. Outsourcing to emerging markets:
Theoretical perspectives and policy implications. Journal of International Management,
15(2), pp. 156-168.
Jensen, P. D. Ø. & Pedersen, T., 2012. Offshoring and international competitiveness:
antecedents of offshoring advanced tasks. Journal of the Academy of Marketing
Science, 40(2), pp. 313-328.
Kedia, B. L. & Lahiri, S., 2007. International outsourcing of services: A partnership
model. Journal of International Management , 13(1), pp. 22-37.
Kedia, B. L. & Mukherjee, D., 2009. Understanding offshoring: a research framework
based on disintegration, location and externalization advantages. Journal of World
Business, 44(3), pp. 250-261.

234
Kenney, M., Massini, S. & Murtha, T. P., 2009. Offshoring Administrative and
Technical Work: New Fields for Understanding the Global Enterprise. Journal of
International Business Studies, 40(6), pp. 887-900.
Kinkel, S., Lay, G. & Maloca, S., 2007. Development, motives and employment effects
of manufacturing offshoring of German SMEs. International Journal of
Entrepreneurship and Small Business, 4(3), pp. 256-276.
Kostova, T. & Zaheer, S., 1999. Organizational Legitimacy under Conditions of
Complexity: The Case of the Multinational Enterprise. The Academy of Management
Review, 24(1), pp. 64-81.
Kotabe, M. & Murray, J. Y., 2004. Global sourcing strategy and sustainable competitive
advantage. Industrial Marketing Management, 33(1), pp. 7-14.
Kshetri, N., 2007. Institutional factors affecting offshore business process and
information technology outsourcing. Journal of International Management, 13(1), pp.
38-56.
Kuemmerle, W., 1999. The Drivers of Foreign Direct Investment into Research and
Development: An Empirical Investigation. Journal of International Business Studies,
30(1), pp. 1-24.
Lacity, M. C., Khan, S. A. & Willcocks, L. P., 2009. A review of the IT outsourcing
literature: Insights for practice. The Journal of Strategic Information Systems, 18(3), pp.
130-146.
Laurens, P. et al., 2015. The rate and motives of the internationalisation of large firm
R&D (1994–2005): Towards a turning point?. Research Policy, 44(3), pp. 765-776.
Le Bas, C. & Sierra, C., 2002. ‘Location versus home country advantages’ in R&D
activities: some further results on multinationals' locational strategies. Research Policy,
31(4), pp. 589-609.
Levie, J. & Autio, E., 2011. Regulatory Burden, Rule of Law, and Entry of Strategic
Entrepreneurs: An International Panel Study. Journal of Management Studies, 48(6),
pp. 1392-1419.
Lewin, A. Y. & Couto, V., 2007. Next Generation Offshoring: The Globalization of
Innovation. 1 ed. Durham: Duke Center for International Business Education and
Research (CIBER).
Lewin, A. Y., Massini, S. & Peeters, C., 2009. Why Are Companies Offshoring
Innovation? The Emerging Global Race for Talent. Journal of International Business
Studies, 40(6), pp. 901-925.
Lewin, A. Y. & Peeters, C., 2006. Offshoring Work: Business Hype or the Onset of
Fundamental Transformation?. Long Range Planning, 39(3), pp. 221-239.
Lewin, A. Y. & Volberda, H. W., 2011. Co-evolution of global sourcing: The need to
understand the underlying mechanisms of firm-decisions to offshore. International
Business Review, 20(3), pp. 241-251.

235
Li, J. & Kozhikode, R. K., 2009. Developing new innovation models: Shifts in the
innovation landscapes in emerging economies and implications for global R&D
management. Journal of International Management, 15(3), pp. 328-339.
Liu, M.-c. & Chen, S.-H., 2012. MNCs’ offshore R&D networks in host country's
regional innovation system: The case of Taiwan-based firms in China. Research Policy,
41(6), pp. 1107-1120.
Liu, W., 2005. Intellectual property protection related to technology in China.
Technological Forecasting and Social Change, 72(3), pp. 339-348.
Liu, X. & Buck, T., 2007. Innovation performance and channels for international
technology spillovers: Evidence from Chinese high-tech industries. Research Policy,
36(3), pp. 355-366.
Li, W. & Yu, X., 2015. China’s intellectual property protection strength and its
evaluation – based on the accession to TRIPS Agreement (Agreement On Trade-related
Aspects of Intellectual Property Rights). R&D Management, 45(4), pp. 397-410.
Li, Y., Wei, Z. & Liu, Y., 2010. Strategic orientations, knowledge acquisition, and firm
performance: the perspective of the vendor in cross-border outsourcing. Journal of
Management Studies, 47(8), pp. 1457-1482.
Lu, J. W., 2002. Intra- and Inter-Organizational Imitative Behavior: Institutional
Influences on Japanese Firms' Entry Mode Choice. Journal of International Business
Studies, 33(1), pp. 19-37.
Madhok, A., 2002. Reassessing the fundamentals and beyond: Ronald Coase, the
transaction cost and resource-based theories of the firm and the institutional structure of
production. Strategic Management Journal, 23(6), pp. 535-550.
Manning, S., Massini, S. & Lewin, A. Y., 2008. A dynamic perspective on next-
generation offshoring: the global sourcing of science and engineering talent. Academy of
Management Perspectives, 22(3), pp. 35-54.
Maskell, P., Pedersen, T., Petersen, B. & Dick‐Nielsen, J., 2007. Learning Paths to
Offshore Outsourcing: From Cost Reduction to Knowledge Seeking. Industry and
innovation, 14(3), pp. 239-257.
Massini, S. & Lewin, A. Y., 2012. Global Sourcing of Business Services: A
Coevolutionary Analysis. In: C. L. Wang, D. J. Ketchen & D. D. Bergh, eds. West
Meets East: Building Theoretical Bridges. Bingley: Emerald Group Publishing Limited,
pp. 323-355.
Monczka, R. et al., 2005. Outsourcing strategically for sustainable competitive
advantage. CAPS Research Report, pp. 1-99.
Mudambi, R. & Venzin, M., 2010. The strategic nexus of offshoring and outsourcing
decisions. Journal of Management Studies, 47(8), pp. 1510-1533.
Murphy, C., 2014. Ford to Expand China R&D Facility --Update. [Online]
Available at: http://online.wsj.com/article/BT-CO-20140305-701261.html
[Accessed 28 May 2014].

236
Nguyen, X.-T., 2010. The China we hardly know: Revealing the new China’s
intellectual property regime. Louis ULJ, Volume 55, pp. 773-810.
Nieto, M. J. & Rodríguez, A., 2011. Offshoring of R&D: Looking abroad to improve
innovation performance. Journal of International Business Studies , 42(3), pp. 345-361.
North, D. C., 1990. Institutions, institutional change and economic performance. 1 ed.
Cambridge: Cambridge University Press.
Oxley, J. E., 1999. Institutional environment and the mechanisms of governance: the
impact of intellectual property protection on the structure of inter-firm alliances.
Journal of Economic Behavior & Organization, 38(3), pp. 283-309.
Park, W. G., 2008. International patent protection: 1960–2005. Research Policy, 37(4),
pp. 761-766.
Patel, P. & Vega, M., 1999. Patterns of internationalisation of corporate technology:
location vs. home country advantages. Research Policy, 28(2-3), pp. 145-155.
Peng, M. W., 2013. An institution-based view of IPR protection. Business Horizons,
56(2), pp. 135-139.
Peng, M. W., Ahlstrom, D., Carraher, S. M. & Shi, W. (., 2017. An institution-based
view of global IPR history. Journal of International Business Studies, 48(7), pp. 893-
907.
Penrose, E., 1959. The Theory of the Growth of the Firm. New York: John Wiley.
Quan, X. & Chesbrough, H., 2010. Hierarchical Segmentation of R&D Process and
Intellectual Property Protection: Evidence From Multinational R&D Laboratories in
China. IEEE Transactions On Engineering Management, 57(1), pp. 9-21.
Quinn, J., 2000. Outsourcing Innovation: The New Engine of Growth. Sloan
Management Review, 41(4), p. 13.
Razzaque, M. A. & Sheng, C. C., 1998. Outsourcing of logistics functions: a literature
survey. International Journal of Physical Distribution & Logistics Management, 28(2),
pp. 89-107.
Rebernik, M. & Bradac, B., 2006. Cooperation and opportunistic behaviour in
transformational outsourcing. Kybernetes, Volume 35, pp. 1005-1013.
Rigobon, R. & Rodrik, D., 2005. Rule of law, democracy, openness, and income:
Estimating the interrelationships. Economics of Transition, 13(3), pp. 533-564.
Roza, M., Bosch, F. A. V. d. & Volberda, H. W., 2011. Offshoring strategy: Motives,
functions, locations, and governance modes of small, medium-sized and large firms.
International Business Review, 20(3), pp. 314-323.
Schneider, C. O., Bremen, P., Schönsleben, P. & Alard, R., 2013. Transaction cost
economics in global sourcing: Assessing regional differences and implications for
performance. International Journal of Production Economics, 141(1), pp. 243-254.
237
Schwörer, T., 2013. Offshoring, domestic outsourcing and productivity: evidence for a
number of European countries. Review of World Economics, 149(1), pp. 131-149.
Scott, W. R., 1995. Institutions and organizations. 1 ed. London: SAGE publications.
Shavers, J. M., 1998. Accounting for Endogeneity When Assessing Strategy
Performance: Does Entry Mode Choice Affect FDI Survival?. Management Science,
44(4), pp. 571-585.
Siems, T. F. & Ratner, A. S., 2003. Do What You Do Best, Outsource the Rest?.
Southwest Economy, Volume 6, pp. 13-14.
Stringfellow, A., Teagarden, M. B. & Nie, W., 2008. Invisible costs in offshoring
services work. Journal of Operations Management, 26(2), pp. 164-179.
Swike, E., Thompson, S. & Vasquez, C., 2008. Piracy in China. Business Horizons,
51(6), pp. 493-500.
Teece, D. J., Pisano, G. & Shuen, A., 1997. Dynamic Capabilities and Strategic
Management. Strategic Management Journal, 18(7), pp. 509-533.
Trefler, D., Rodrik, D. & Antràs, P., 2005. Service Offshoring: Threats and
Opportunities. Washington, Brookings Institution Press, pp. 35-73.
WEF, 2018. The Global Competitiveness Report 2018, Cologny/Geneva: WEF.
Williamson, O. E., 1992. Markets, hierarchies, and the modern corporation: An
unfolding perspective. Journal of Economic Behavior & Organization, 17(3), pp. 335-
352.
WTO, 2010. DS362: China — Measures Affecting the Protection and Enforcement of
Intellectual Property Rights. [Online]
Available at: https://www.wto.org/english/tratop_e/dispu_e/cases_e/ds362_e.htm
[Accessed 25 01 2019].
Wu, L.-Y., 2010. Applicability of the resource-based and dynamic-capability views
under environmental volatility. Journal of Business Research, 63(1), pp. 27-31.
Youngdahl, W. & Ramaswamy, K., 2008. Exploring new research frontiers in
offshoring knowledge and service processes. Journal of Operations Management,
26(2), pp. 135-140.