the influence of gravel bars on urban water quality, ne ...1 the influence of gravel bars on urban...
TRANSCRIPT

1
The Influence of Gravel Bars on
Urban Water Quality, NE
Branch of the Anacostia River By Patrick Deery
April 26, 2016
GEOL394
Advisor: Dr. Karen Prestegaard

2
Abstract
Urbanization alters both the physical and biogeochemical characteristics of streams, which affects contaminant transport and their suitability as habitats. The purpose of this research, were to evaluate whether gravel bars mitigate elevated water temperatures, and store sediment and organic matter. Little Paint Branch Creek, within the northeast branch of the Anacostia maintains temperatures below critical values for sensitive species and maintains water clarity between storm events. The research that follows was designed to test the hypotheses that gravel bars play a significant role in the maintaining stream water quality, by providing sites for storage of fine sediment, particulate organic matter and associated contaminates and by regulating stream water temperature through mixing heated surface waters with cooler groundwater. These hypotheses were tested through a combination of field sampling of stream water temperature both upstream and downstream of bar systems and by accessing gravel bar sediment storage. Sediment samples obtained in the field were analyzed for grain size and organic matter content. Results suggest that stream temperature at low flow is affected by gravel bars within the stream. The upstream-downstream temperature increased with temperature during the summer study months. Grain size analyses indicates small percentages of fine sediment in recently deposited gravel bars, but the total storage of fine sediment and organic material is significant due to the size of the bars. However, the role of sediment trapping by vegetation on gravel bars may play a greater role in the retention of fine sediment than storage within the gravel bar dimensions alone.

3
Introduction
Many urban waterways are visibly degraded, have poor water quality, high flow velocities, high sediment loads and have daily maximum stream temperatures that exceed temperature thresholds for sensitive species. Stream degradation in urban areas is due in no small part to impervious surface that generates overland flow runoff, and delivers anthropogenic contaminants to streams (Tong & Chen, 2002). Streams naturally contain geomorphic features that can act to mitigate some of the destructive forces seen in large urban watersheds. Gravel Bars, for example, increase flow resistance in streams (Prestegaard, 1983), thereby decreasing stream velocities and sediment transport capacity. Gravel bars deposition can also raise stream bed elevations, promoting overbank flooding during high flows (Blanchet, 2010). Gravel bar accretion onto stream banks can improve water quality by preventing bank erosion along the stream channel. Stream flow through gravel bars also acts to regulate stream temperature by forcing a portion of the flow through subsurface (shaded pathways) and then mixing this bar groundwater with downstream surface water.
An understanding of how stream channel morphology features effect erosion and mitigate stream temperature is imperative to proper restoration of urban waterways (Bukaveckas, 2007). One restoration goal for urban streams is to maintain stream temperatures within the range required by desired fish and aquatic organisms (below 7°C, for active cold, cold loving species). Gravel bars may also effect water clarity by tapping fine sediment and maintaining sediment balance (erosion from streambanks does not exceed sediment deposition in channel bars) by providing sediment storage areas. Many of the reaches of the urbanized tributaries and main stem of the Northeast Branch of the Anacostia show some of these have extensive gravel bars that might provide some of these water quality functions. Despite being in an urban watershed, with flashy hydrographs, and host to numerous anthropogenic sources of contamination and channel alteration, stream water is clear at low flow (fig 1.), reaches have well defined channels and flood plains. Research indicates that reaches with gravel bars do not increase stream turbidity or transport suspended sediment loads to downstream locations (Blanchet, 2010). Additionally, a preliminary study of maximum stream water temperature indicates that the stream temperature does not increase downstream as the channel widens in the gravel bar reach and maximum stream temperature is significantly lower than maximum air temperature (Nguyen, 2010).
Due to the importance of stream temperature in freshwater ecology, there has been extensive research on the factors that affect stream temperature (Morrill, 2005). But, little data collection or modeling has been done regarding temperature regulation in urban watersheds with gravel bars. It is, however, well understood that water temperature lags behind and reaches lower daily maximum temperatures than air temperature in most stream systems. Stream maximum temperature is influenced by the temperature of the water source and direct heating from the atmosphere (Morrill, 2005). The river width, shading by trees, etc. all influence the exchange of heat between the stream and the atmosphere. In streams with gravel bars, plumes of water flow through gravel bars at a different velocity than the stream base flow. The mixing of water downstream can then either warm or cool streamflow depending on seasonal flux. Sediment temperature may also effect stream water temperature downstream of

4
gravel bars (Constantz et al, 2007). Additionally, research done on Little Paint Branch Creek, the study site for this project, has shown changes in groundwater flow patterns at different times of the year. Stream water flows out of the water table and into the stream during the winter, and stream water flows into the gravel bars and adjacent floodplains during the warmer months of the year. This is controlled largely by seasonal changes in temperature and evapotranspiration that effect the water table. (Lundberg, 2011). Work done by Ock et al (2015) has demonstrated that gravel bars play a significant role in reducing the level of dissolved organic carbon in stream water, as well as storing significant quantities of fine sediment. Over time, this leads to coarser bed-surface sediment, which supports ecological functions and controls sediment supply. Numerous other assessments of water quality in suburban and urban watersheds have found correlations between anthropogenic contamination, impervious surface and degradation of stream morphology (Davis et al, 2002) and (Rhoads & Cahill, 1998). An understanding of both the mechanisms that cause water quality degradation and those that cause stream channel degradation is imperative when considering future restoration projects in urban watersheds. This study was designed in part to add to this knowledge base which in turn will allow for the development of more beneficial stream restoration projects in urban watersheds.
Hypotheses:
Gravel Bars serve to regulate temperature through exchange of stream water with groundwater in the bars.
- Therefore, there will be a reduction in peak temperature downstream of reaches with gravel bars and a lag in the time of daily maximum temperature between upstream of bars (or reaches with bars) and downstream.
- NULL HYPOTHESIS: Maximum peak temperature is the same upstream and downstream of bars.
Gravel bars improve water quality by trapping and storing fine sediment (sand sized and smaller). The total amount of sand-sixed and smaller sediment is significantly higher in gravel bars, than in adjacent channels.
Gravel bars improve water quality by trapping particulate organic carbon. Particulate organic carbon can sorb organic contaminants and trace metals, reducing their concentrations in stream water.
- The total amount of particulate organic carbon concentrations trapped in gravel bars is directly proportional to the subsurface sediment particle size and bar volume.
- Particulate organic carbon concentrations will also increase with higher percentages of fine sediment in the bars
- NULL HYPOTHESES: There is no relationship between sediment grain size and organic matter content of bar sediment.

5
Study Site and Project Design
The study sites used for this project are located in the northeast branch of the Anacostia Watershed. The watershed drains approximately 75 square miles of land in Prince Georges County and Montgomery County, Maryland (USGS). Many of the tributary channels within the NE branch of the Anacostia are subject to anthropogenic influence as a result of urban and suburban development, as well as a substantial number of major roadways crossing the streams to connect Maryland counties to Washington D.C. Field based empirical data will be gathered on a series of three reaches within the northeast branch of the Anacostia. These reaches are as follows: Little Paint Branch Creek, Paint Branch Creek, and the main stem of NE Branch, downstream of their junction on the Anacostia. Reach scale temperature data will be taken from all three reaches included in this study. Additional temperature and grain size data will be taken upstream and downstream of a
series of gravel bars on Little Paint Branch Creek near Cherry Hill Road in College Park, Maryland. The gravel bars being used for this portion of the study are of varying age and size, but grain size analysis suggests similar grain size distributions in both the surface and subsurface of these bar systems. Surface material from these bars are predominantly rounded quartz cobbles sitting atop of smaller subsurface sediments. The subsurface is composed of smaller quartz sands and silts, with large mica grains (visible to the eye), likely derived from the Tertiary sand and gravel facies of the Potomac group and upland sediments of the Piedmont province (Hankin, 2009). Gravel Bars are constructed if layers of these surface and subsurface materials are allowed to accrete (Blanchet, 2011). The aforementioned sites are a short 15 minute drive from the University of Maryland, College Park, and have been monitored for the last twenty years by Dr. Karen Prestegaard and a number her students. The completion of this study has allowed for the development of further research designed to add to the data already available for the northeast branch of the Anacostia. The data developed during this study allowed for a more
Figure 2: Map of the Northeast Branch of the Anacostia, study sites marked with red dots (From: Blanchet, 2009)
Figure 1: Northernmost Study site on Little Paint Branch Creek (Bar 1) Photo By: Patrick Deery

6
thorough understanding of the effects of gravel bars on water quality, in turn providing a more complete appreciation of the geomorphic processes that occur in urban watersheds.
Methods
Bar Morphology:
The gravel bars monitored as a portion of this study are a series of low gradient, quartz- dominated gravel bars arranged as point or alternate bars, which are common to meandering rivers. The series of three bars being monitored and studied along Little Paint Branch Creek and Paint Branch Creek are of varying age and size but display a relative homogeneity regarding both grain size distribution and sediment sorting (Blanchet, 2010). Bars one and two are located in a reach with a well-defined floodplain and are within half a kilometer of Cherry Hill road. Most of the reach is well shaded with the exception of bar two that is the most recently deposited bar and is nearly entirely exposed to sunlight. Bar two is also the youngest and largest of the two bars being studied along Little Paint Branch Creek, with an average length of 35.2 meters and a width of 33.7 meters, as well as an approximate surface area 1783 square meters. As a result of its size, it also causes the largest deviation in streamflow, altering the flow of the channel almost 90°. Bar one lies north of Cherry Hill road and is a significantly smaller alternate bar and as a result alters streamflow direction significantly less. Bar two is approximately 35.2 meters in length and has an average width of 33.7 meters. Estimates of the area of bar two suggest an approximate surface area of 1783 square meters. Bar one is the northernmost bar in the study area, and has the smallest surface expression, with a length of 61.6 meters, average width if 9.8 meters, and a bar area of approximately 600 square meters. Bar three lies on the much larger main channel of Paint Branch Creek. Despite its surface area of 2000 square meters, its effect on stream flow is more limited than the previous two bars due to the size of the channel
Table 1: Gravel bar dimensions of the three bars along Little Paint Branch Creek, College Park, MD (from: Blanchet, 2011)
Gravel Bar Bar Type Length (m) Average Width (m) Bar Area (m^2)
Bar One Alternate 61.6 9.8 595
Bar Two Point 35.2 33.7 1783
Bar Three Alternate 80 35 2800
Figure 3: Gravel bar 2: second bar used in the study, nearly absent of vegetation, displaying a significant alteration of stream flow (May 2016) Photo By: Patrick Deery

7
Temperature measurements and interpretations:
Initial temperature data were gathered during the months of July and early August, using in-situ stream sensors at several sites along both Paint Branch Creek and Little Paint Branch Creek. Following the completion of this period of data collection, and a short period of model assessment, the in-situ sensors used were replaced in the stream bed and allowed to record data from Mid-October into early-January. The sensors used, Onset HOBO® Tidbit v2 Temp Data Loggers, were first set to record instantaneous stream temperature measurements on two minute intervals before being attached to pieces of steel posts as close as possible to the stream bed in an attempt to minimize the effect of thermal radiation on the sensors (Dick et al, 2015). When set to two minute intervals, the sensors can record instantaneous stream water temperature measurements with an intrinsic precision of ±.01˚C for 60 days at a time before filling up their internal memory buffers. Tidbit v2’s were used on both the reach scale, to develop a temperature model for both Paint Branch Creek and Little Paint Branch Creek over the entire length used in this study and the bar scale. Bar scale temperature was determined by placing stream temperature sensors upstream and downstream of series of the three individual bars along Little Paint Branch Creek, also set for two minute intervals. Several Tidbits were also placed along an along a length of Paint Branch Creek, but were later removed due to difficulty involved with reaching the sensors to download the data collected. Despite the early removal of these sensors, the initial data retrieved were useful for the development temperature models for reaches with gravel bars during warmer months.
Temperature sensor calibration:
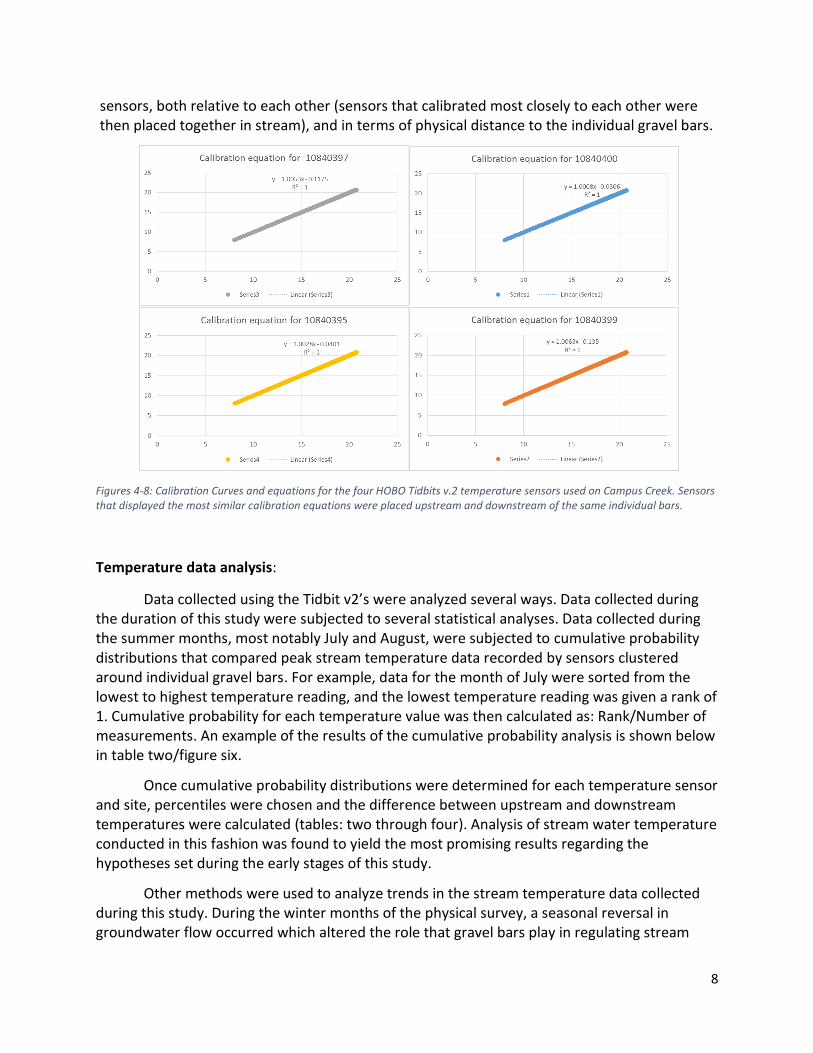
The HOBO Tidbit v.2 temperature sensors record temperature variations with a precision of ±0.01 °C, but their accuracy is within 0.2 °C of the true stream temperature. Therefore, to compare the temperature upstream and downstream of a gravel bar, the accuracy can be significantly improved by calibrating each temperature sensor to a standard (in this case, another HOBO Tidbit v.2). This was done by placing all of the sensors in the same bucket of ice water and setting the sensors to record over 10 hours as the water in the bucket rose towards room temperature. A regression equation was developed between each sensor and the sensor that is used as a standard (see figures 4-8 for reference). readings. This calibration allowed for adjustments to be made regarding physical placement of individual
8
sensors, both relative to each other (sensors that calibrated most closely to each other were then placed together in stream), and in terms of physical distance to the individual gravel bars.
Figures 4-8: Calibration Curves and equations for the four HOBO Tidbits v.2 temperature sensors used on Campus Creek. Sensors that displayed the most similar calibration equations were placed upstream and downstream of the same individual bars.
Temperature data analysis:
Data collected using the Tidbit v2’s were analyzed several ways. Data collected during the duration of this study were subjected to several statistical analyses. Data collected during the summer months, most notably July and August, were subjected to cumulative probability distributions that compared peak stream temperature data recorded by sensors clustered around individual gravel bars. For example, data for the month of July were sorted from the lowest to highest temperature reading, and the lowest temperature reading was given a rank of 1. Cumulative probability for each temperature value was then calculated as: Rank/Number of measurements. An example of the results of the cumulative probability analysis is shown below in table two/figure six.
Once cumulative probability distributions were determined for each temperature sensor and site, percentiles were chosen and the difference between upstream and downstream temperatures were calculated (tables: two through four). Analysis of stream water temperature conducted in this fashion was found to yield the most promising results regarding the hypotheses set during the early stages of this study.
Other methods were used to analyze trends in the stream temperature data collected during this study. During the winter months of the physical survey, a seasonal reversal in groundwater flow occurred which altered the role that gravel bars play in regulating stream

9
water temperatures. This seasonal reversal necessitated a change in analyses from the cumulative probability distributions used during the summer to a peak-peak method that examined the difference in local maxima/minima in stream water temperature over time.
Previous Studies have compared the difference in stream maximum temperature and the lag in timing of stream maximum temperature upstream and downstream of large gravel bars. A general comparison of stream water temperature and air temperature also found that stream temperatures respond (by warming up or cooling down) to the changes in air temperature throughout the day. This diurnal variation in stream water temperatures was associated with a lag time proportional to the magnitude of the temperature increase, where in, lag time was shorter when the temperature raised or lowered faster. Results of this analysis are consistent with numerous other previous studies that suggest a linear to sublinear increase in stream temperature associated with an increase in air temperature (Morrill et al, 2005).
Sediment Sampling and Grain Size Analysis:
Sediment sampling of three gravel bars on Little Paint Branch Creek was done in late October 2016. A representative sample of surface and subsurface material was taken from numerous locations along each of the three bars in an attempt to adequately accommodate for any heterogeneity in bar material. This sampling process necessitated taking a number of surface and subsurface samples from different points along each of the gravel bars. Surface and subsurface samples were taken from the head, midpoint, and tails of each of the gravels examined in this study to accomplish this. This amounted to approximately ten sediment samples per bar and a little over 30 samples in total. This number later jumped to around 50 total samples, when analyses of overbank sediment from the floodplains associated with gravel bars one and two were introduced into the study. The samples were then set to air dry in the Hydrology lab in the main geology building on University of Maryland, College Park campus before being subjected sieve analysis and Loss on Ignition (LOI) testing. Due to the time constraints associated with the completion of the initial proposal phase of this study, a series of four previously studied samples were also introduced as method controls. These control samples came from Campus Creek, another reach of the northeast branch of the Anacostia. The samples from Campus Creek displayed a number of similarities in both the quality of sorting and rounding of individual grains as well as in the general mineralogy of the samples. The two surface samples from Campus Creek were dominated by large, well-rounded quartz gravels and quartz sands with visible mica grains, whereas the subsurface samples were dominated by quartz sands, silts and mica grains (Hankin, 2009).
Figure 9: Exposure of subsurface sediment where the surface has been scraped way for grain size analysis, note the significantly lower quantities of large cobbles and higher quantities of sand and silt in the subsurface. Photo By: Patrick Deery

10
A grain size analysis of the 30 samples from Little Paint Branch Creek was completed during the fall and winter 2016. Each of the samples were sieved through a series of progressively smaller filters for approximately 30 minutes per sample (Grzechnik & Pitsch, 2004). Prior to the sieving, each of the samples was weighed on a lab scale to determine an initial mass. Following the sieve analysis, the samples now broken down by grain size were weighed to determine the mass loss during the sieve analysis. The mass distribution established from these analyses allowed for the development of estimates of the carbon storage in each of the bars as well as fine sediment storage per depth of gravel.
The samples collected from Little Paint Branch Creek’s floodplain at gravel bars one and two were subjected to the same process to determine the role of fine sediment storage by vegetation in urban watersheds. These samples were notably finer in grain size and had higher percentages of organic matter by sample volume than the samples collected from the gravel bars. This suggests that the role of vegetation in sediment trapping and storage may be as important, or more important than that of gravel bars themselves. This will be covered in more detail later in the results and discussion sections of this report.
Error Analysis in the sieve analysis:
Sieve analyses are subject to two primary sources of error. These are poor technique; wherein significant amounts of mass are lost during the sieving process and variability in sample contents. Mass loss during the sieving process can be minimized through careful cleaning of the sieve filters while measuring out sample fragments. Great care was taken during the sieving of the Campus Creek and Little Paint Branch Creek sediment samples in this regard, resulting in mass losses significantly less than 0.5% of the total sample mass for the bulk of the samples processed. Any samples beyond this 0.5% threshold were sieved an additional time until procedural error was within acceptable margins. Variability due to field sampling location cannot be addressed as easily, and was not addressed for the Campus Creek samples. It was however addressed for samples from Little Paint Branch Creek. This form of error in the grain size analyses was assessed by determining the mean grain size by mass and finding the standard deviation from the mean of each of the samples. Error due to sample variability was found to be within ±3.36% of the mean grain size values for the vast majority of size fractions. This suggests that the samples from Little Paint Branch Creek were relatively homogenous when broken down as surface and subsurface samples. This also suggests that the method of sediment deposition is consistent across the surface of each of the bars that were surveyed as a part of this study.

11
Mass Loss on Ignition:
One of the primary intents of this study was to assess the influence of gravel bars on stream water quality, with the specific intent of monitoring the reduction in stream bound particulate organic matter. Particulate organic matter in soils and aquifers are sites for sorption and retention of trace metals and organic compounds. In urban and suburban watersheds, metals like cadmium, sourced from car tires, chromium in the form of air conditioning coolants and brake system emissions and nickel from diesel and gasoline are all sorbed and retained in this manner. In Soil Science, organic matter storage is typically assessed by using the mass loss on ignition (LOI) technique. This technique involves subjecting the fine sediment fraction (less than 2mm) to a relatively high temperature (approximately 550° C in this case) bake, which cooks off the organic carbon stored in the sample (Pansu et al, 2006). Research done by the department of Soil and Water Science at University of Florida found that LOI compared favorably against other methods of determining carbon and calcium storage in fine sediments for LOI contents ranging from zero to 1000g Kg-1. For all wetlands used in their study Loss-on-Ignition Method to Assess Soil Organic Carbon in Calcareous Everglades Wetlands, Wright and his colleagues found that LOI was significantly related to total carbon storage (r2=0.957) (Wright et al, 2006). Assessment of carbon storage for this study was done using a similar method, but using higher temperatures, due in part to the lack of carbonate in the samples, and for generally more consistent results. After the sieve analysis had been completed, the samples from Little Paint Branch Creek were partitioned by size fragment, weighed again, and set to bake in a Muffle furnace at approximately 550°C for a period of around five hours (research indicates time needs to be greater than 3 hours). The samples were then left to cool before being weighed again to determine the mass loss on ignition. LOI testing was conducted on the samples from Little Paint Branch Creek after they had been dried in a 150° oven then subsampled (~2 to 12 grams a piece) and weighed for testing. Hydraulic Conductivity:
Hydraulic conductivity is a property of rocks and soils, which generally describes the ease with which fluid can move through pore spaces or fractures. Hydraulic conductivity can be estimated from porosity or grain size data. For natural sediments, however, it is best determined experimentally in the field though a variety of testing methodologies. As a significant control on the function of most river systems, the calculation of hydraulic conductivity can be of significant use when trying to understand the functions of individual streams. As residence time is a significant factor in the ability of gravel bars to act to mitigate increases in stream temperature, the utility of this measurement for this study comes from the ability to determine flow velocity between grain boundaries, also known as Darcy’s Velocity. Hydraulic conductivity was measured at each of the study sites through a type field testing known as a slug test (Hvorslev, 1951). Slug testing involves adding water to a groundwater well over a short period of time and monitoring how the hydraulic head responds to the addition of fluid. This form of slug test is also known as the bail-down method and involves adding water

12
into a well and recording the time it takes for water levels to return to the pre-experimental levels (Wisconsin Department of Natural Resources, 1993).
Wells were installed in each gravel bar to conduct slug tests. Recording pressure transducers were installed at the base of the wells, water was added to raise the well water level and the water level and time were recorded until water levels recovered to their initial position. Data from the slug test was applied to the slug test equation:
K =r2 ln(
LR)
2Lto
to
= the time when the water level and initial water level ratio equals 0.37
r = constant 1.59
L = length of the screen in the well, 6 cm
R = radius of the well, 0.4 cm
Measurements of hydraulic conductivity, K at Little Paint Branch Creek were also compared with estimates of K determined by different grain size equations. A set of experiments conducted by Sahba Rana indicated that the Hazen relationship:
K = CD10
Provided the best prediction of the slug test K values, Where D10 is the size of the subsurface material, (Sahba Rana, personal communication).
Darcy Velocity: Q/A or V = -K(dh/dl).
Once K values have been obtained from in situ slug tests or estimated from the Hazen relationship, the Darcy velocity and travel time that it takes for groundwater to move through the gravel bars is calculated.

13
Results
Temperature data (Warm Months):
Analyses found a median (50th percentile) upstream-downstream temperature difference (ΔT) of 0.436°C for bar one and an average difference of 0.419°C for the remainder of the data collected at the bar. Similar analyses of temperature data from bars two and three a found median ΔT values of 0.145°C and 0.633°C respectively. Analyses of temperature data from the three gravel bars positively correlated an increase in the ΔT with an increase in stream water temperature. This correlation varied in degree and magnitude per each individual bar. Bar two, for example, despite having a median (50th percentile) upstream-downstream temperature difference of 0.436°, had a mean ΔT value of 0.1°C. This is due to a wide variation in the upstream-downstream temperature differences found in the data set. It is likely that this variation is due to a number of internal factors related to the gravel bar dimensions and channel morphology. Bar two is the only point bar featured in this study, diverts flow far more than either of the alternate bars featured (approx. 90° deviation) and creates a stagnation in flow as a result of this significant flow deviation (direct observation). Increases in temperature or variations in temperature could potentially be a result of this stagnation in flow, or the relatively short residence time associated with the size of the bar. This will be covered in greater depth later in this report.
y = 0.1768x - 3.8882R² = 0.9337
-0.4-0.2
00.20.40.60.8
11.21.41.6
16 21 26 31
ΔT
(°C
)
Downstream Temperature
Figure 10: relationship between overall magnitude of downstream temperatures and ΔT calculated between the two in-situ temperature sensors at bar one

14
Bar three is dimensionally most similar to the first bar featured in this study. They are both alternate bars that cause significant deviation in channel direction and stream flow, and both exceed 60 meters in length. Bar three differs from bar one, by being significantly wider and by being present in a significantly larger channel, Paint Branch Creek as opposed to Little Paint Branch Creek. Bar three saw significantly larger temperature variations due to a combination of this wider channel, and from a series of eddies that developed at the downstream end of the bar. These eddies resulted in short scale temperature variations upwards of 10°C that suggest that bar three fails to perform key actions typical of gravel bars like decreasing flow velocity and reducing sediment flux. Despite this, bar three exhibited the highest median upstream-downstream temperature difference (ΔT) of 0.633°C and the second highest mean ΔT of 1.174°C. The positive correlation between downstream temperature and increasing upstream-downstream temperature difference is also present at this site, but to a more limited degree than the previous two sites. It is unclear whether or not the effect is actually due to the presence of the
Pectentile UP DOWN ΔT
min 20.484 20.531 -0.047
5th 21.413 21.628 -0.215
16th 23.064 23.064 -0.024
median 25.137 24.992 0.145
84th 26.965 26.72 0.245
95th 28.072 27.899 1.73
max 35.823 36.96 -1.137
Mean 25.851 25.971 0.100
Std. dev. 5.202 5.521 0.851
-0.4-0.2
00.20.40.60.8
11.21.41.61.8
2
16 21 26 31
ΔT
(°C
)
Downstream Temperature
Figure 11: Trend exhibited by bar two is less linear than bar one, but displays similar features to its contemporary.
Table 3: Temperature distribution upstream and downstream of bar two. Temperature is more randomly distributed upstream and dowsntream of bar system. This is likely due to a combination of channel morphology and bar dimensions.
Table 4: Cumulative probability distributions for bar three of the study. Bar three was on the much larger main channel of Paint Branch Creek and saw significantly larger temperature fluctuations than the other two bars monitored as a portion of this study.
Percentile UP DOWN ΔT
min 21.127 21.175 -0.048
5th 23.905 23.448 0.0358
16th 24.074 24.895 0.457
50th 26.304 25.671 0.633
84th 28.692 25.914 2.778
95th 30.016 27.21 2.806
max 32.073 30.52 1.553
Mean 26.599 25.548 1.174
Std. Dev 3.866 2.932 1.223Figure 12: Linear trend still evident in data set from bar three, but to a more limited extent than the two previous bars.
-1
-0.5
0
0.5
1
1.5
2
2.5
3
18 23 28 33
ΔT
(°C
)
Downstream Temperature

15
gravel bar at this site or is simply an apparent effect due to the limited data set and limited number of sensors used.
Despite this, analyses of these data suggests that the decrease in downstream temperature is heavily dependent on the magnitude of the upstream temperature, such that the warmer the upstream water temperature, the higher the decrease in downstream temperatures. This further suggests that gravel bars are playing an active role in the cooling of stream water by slowing the flow of pulses of stream water at sites where gravel bars create significant deviations in stream flow. Furthermore, the sorting done on these data resulted in a mostly linear progression from cooler temperatures at the beginning of the month of July and warmer temperatures at the end of the month, which correlates with the increase in summer air temperatures. This suggests that the influence gravel bars play in cooling stream water may be at its highest during the warmest parts of the year. Although this also occurs during the cooler months of the year, once the groundwater flow reversal happens, gravel bars act far more too average extremes as opposed to explicitly cooling peak stream temperatures.
Temperature Data (Cooler Months):
The trend towards the reduction of peak temperature present in gravel bars during warm months continues into at least early November. Around this time, a seasonal reversal in groundwater flow occurs. Stream water goes from flowing generally out of the channel, in this case into gravel bars and the adjacent floodplain, to flowing from the floodplain into the channel. The effect of this is to both reduce peak stream temperature as well as to raise minimum temperatures which can be seen in figure seven. The cumulative probability analyses used to examine temperature data in the warmer months were no longer effective analytical methods for this reason. This necessitated a change in the type of temperature data analyses performed for data recorded during the cooler months of year. A simple analysis was performed that examined the average reduction in stream water temperature during warmer periods, which typically occurred at the end of the day. This analysis found an average ΔT of between 0.1˚C and 0.15°C between the upstream sensor and downstream sensor post calibration. This suggests that during the day, while stream temperature is warmed by air temperature, the gravel bars still serve to cool peak temperature. It is however likely that this effect is due to a combination of the intrusion of cooler groundwater into the system and the residence period of water flowing through the gravel bar than purely residence time alone. Similar examinations of average minimum stream temperature downstream of major bars along Little Paint Branch Creek found average ΔT’s of between -0.15°C and -0.25 ˚C, suggesting that the same
Figure 13: Temperature Readings for Bar One, Late December into Early January. Blue: Upstream Red: Downstream

16
groundwater effect that aided in lowering peak temperature during the day, raised minimum temperature at night. Little research has been done regarding this effect. The research done to date suggests that groundwater-streambed interactions may play a significant role in limiting diurnal stream water temperature variations (Contstantz, 1998 & Keery et al, 2007). In this case, it would appear the groundwater temperature, which is well known to resist short scale diurnal variations as a result of being insulted from the surface, lies somewhere between peak daytime stream temperatures and nightly minimums. Further study is required to determine whether or not the magnitude of this effect varies over long periods of time, or is present at along the entire length of the reach.
Grain Size Analysis and Sieve Data:
During the proof of concept phase of this study, samples from Campus Creek were subjected to grain size analyses and loss on ignition testing, while waiting for the Little Paint Branch Creek samples to completely dry. The Campus Creek samples were chosen for their similarities to the samples collected at Little Paint Branch Creek. These samples, when subjected to grain size analyses indicated an overabundance of silt size sediment was present in the subsurface of sampled gravel bars. Subsurface samples from Little Paint Branch Creek displayed similar grain size distributions to the samples from Campus Creek. On average, upwards of 30% of the total sediment in sieved subsurface samples was below two millimeters in diameter. Bars two and three share very similar grain size distributions to those highlighted below from bar one. This correlates well with the samples collected well from Campus Creek and further suggests that hydraulic conductivity and thus stream residence time is controlled by these subsurface sediments. An additional two percent (on average) was below .125 mm in diameter. This grain size reservoir is likely host to a significant portion of organic matter and therefore is the likely reservoir for the storage anthropogenic contaminants like Cobalt, Cadmium and Lead. Although two percent is seemingly low, when scaled to the size and depth of the gravel bars being researched as portion of this study, represents a significant reservoir for the storage of the aforementioned anthropogenic contaminants. Additionally, the presence of significant levels of silt and sand in gravel bars along Little Paint Branch Creek effectively decreases the availably of sediment downstream of major gravel bars, acting to reduce sediment transport and improve water quality (Dangol, 2008).

17
Figures 14-15: Cumulative grain size distributions for the four sediment samples from Little Paint Branch Creek. The samples from the subsurface (red) of bar one (head and tail of bar, left to right) display similar curves to each other. This trend is also mirrored by the subsurface samples of other bars along LPBC. Sediment homogeneity indicates similar transport and storage methods for large portions of creek.
Table 5: Weight percent of the 2mm and below fraction of the samples from Little Paint Branch Creek, Bar One. Also shown is the percent weight of organic matter determined from the mass loss on ignition testing for the same samples, as well as an estimate of the organic matter storage for the whole sample mass based on the weight percent of organic matter from the <2mm samples.
Mass Loss on Ignition:
After the completion of the sieve analysis and the bake period for the sediment samples from Little Paint Branch Creek, the samples were reweighed to determine the mass lost during the bake period. The loss of mass that can be seen in tables six and seven, ranged from (placeholder) grams to approximately (placeholder) grams. Additionally, storage of organic carbon was notably higher in the subsurface of the two bars sampled at Little Paint Branch Creek, as well as the two sampled on Campus Creek. Carbon storage in both of these bar systems sampled represented greater than 1% of the total sample mass. As low as this seems, when scaled to bar dimensions, it can represent a large portion of the sediment present. A small percentage of this loss is likely due to oxidation of sediments, and removal of stored water. An attempt was made to minimize the effect of this loss by prebaking the samples at 150°C prior to weighing and subjecting them to the full burn period at 600°C. Within this mass range however, it is unlikely that material loss is lower than 51% total carbon (Wright et al, 2008). Assuming this were true for the entire mass of the gravel bars, a significant quantity of solid particulate organic matter (S-POM) is likely being stored in the gravel bars on both Little Paint Branch Creek. The removal of this quantity of material and storage within the gravel bars along Little Paint Branch Creek would significantly improve stream water quality downstream of the storage mechanisms. These outcomes mirror the findings of Ock et al (2015) in their study of the influence of gravel bars on S-POM’s in the Trinity River, California.
Bar Site Avg Wt% < 2mm OM% wt < 2mm OM Wt total (g)
Bar One Upstream Subsurface 35.232 2.577 0.192
Bar One Middle Subsurface 33.434 3.763 0.25
Bar One Downstream Subsurface 30.075 4.815 0.177

18
Table 6: Results of loss on ignition testing on five samples from Bar One on Little Paint Branch Creek, each sample represents subsurface sediments from a number of locations along the bar. Average Mass LOI was higher for Bar One than any of the samples from Campus Creek. This is likely a result of the higher levels of fine sediment associated with Little Paint Branch Creek.
A second set of samples was recovered from Little Paint Branch Creek after the grain size analyses of the gravel bar sediments had been completed. These samples of the overbank material that had been trapped due to the presence of vegetation along the edges of gravel bars were collected in an attempt to quantify the magnitude of the vegetative trapping effect in urban waterways. A significant quantity of research exists to date that suggests vegetation is key to the trapping and retention of sediment in both wetland environments and alluvial streams. While gravel bar formation may be required to allow for the development of vegetation in urban river systems, the vast majority of sediment trapping may be due to the presence of vegetation. Tall, bank bound grasses may be most effective in this regard due to their ability to create turbulence and promote deposition during periods of high flow. Initial observation and sampling performed on overbank sediments from Little Paint Branch Creek alluded to significantly high rates of organic matter storage in overbank sediments than those from adjacent bar sediments. Unfortunately, the methods used in this study did not allow for determination of the source of this organic material (in situ deposition vs. flow bound), but analyses that allow for this determination including completion of LOI testing would be an excellent continuation of this study. Nevertheless, the data collected suggests that vegetation plays a significant role in the retention of fine sediment in urban systems, and that the presence of gravel bars and the growth of vegetation may work in tandem to reduce fine sediment transport in urban waterways.
LPBC Sample ID
Sample & Cruicble Wt
(preburn) (g)
Sample Wt (Pre
burn) (g) Post Burn Wt (g) Mass LOI (g) % Mass LOI
Bar One Upstream One: 14.660 2.579 2.479 0.100 3.882
Bar One Upstream Two: 25.243 13.000 12.873 0.128 1.925
Bar One Upstream Three: 22.354 9.174 8.825 0.349 1.924
Bar One Middle: 15.556 3.388 3.138 0.250 3.763
Bar One Downstream: 19.757 7.242 7.066 0.177 4.815
LPBC Sample ID
Sample & Cruicble Wt
(preburn) (g)
Sample Wt (Pre
burn) (g) Post Burn Wt (g) Mass LOI (g) % Mass LOI
Bar Two Upstream One: 20.593 7.413 20.305 0.287 3.877
Bar Two Upstream Two: 24.669 12.154 24.204 0.464 3.820
Bar Two Upstream Three: 15.018 2.850 14.872 0.146 5.120
Bar Two Middle: 14.304 3.294 14.174 0.130 3.950
Bar Two Downstream One: 22.006 9.763 21.771 0.235 2.404
Bar Two Downstream Two: 17.188 5.106 16.976 0.212 4.152
Table 7: Bar Two Loss on Ignition data. Loss rates from bar two were several percent higher than bar one on average. This
suggests that the significant flow deviation present as a result of bar two may allow for additional subsurface storage of
organic material in the bar.

19
Hydraulic Conductivity and Gravel Bar Residence Time:
Table 8: Chart showing grain size and hydraulic conductivity measurements for bar one on Little Paint Branch Creek. Readings for combined hydraulic conductivity correlate more closely with subsurface hydraulic conductivity readings, suggesting that flow through gravel bars is controlled by subsurface sediments.
As noted earlier, measurements of hydraulic conductivity (K) of individual gravel bars were determined through field-testing (Sabha Rana, personal correspondence). Measurements of gravel bar hydraulic conductivity were conducted via Bail-Down method, or slug testing. The results of these analyses suggested that flow through gravel bars was controlled more often by the finer sediment (D10 grain size) present in the subsurface of the bar systems. Hydraulic conductivity via Hazen method found average surface K readings of 1.134, and subsurface hydraulic conductivity of 0.9072. The combined hydraulic conductivity for the gravel bars tested in this study was found to be 0.355, which correlates more closely with subsurface grain size than surface. This suggests that subsurface hydraulic conductivity is the dominant control on the ability for fluid to flow between grain boundaries in these systems. Similarly, this suggests that flow rates through the gravel bars featured in this study are controlled by subsurface sediments, and can be calculated by using a combination of Darcy’s Velocity equation, V = -K(∆h/∆l), where K represents hydraulic conductivity and ∆h/∆l represents the change in hydraulic head over a given distance, and gravel bar dimensions. Residence time for gravel bars included as a portion of this study can be found below in table six. Gravel bar residence times were generally on the order of four to six days, but varied depending on the actual bar dimensions. Bar two exhibited a significantly lower residence time (12 hours), likely due to its higher gradient and shorter length relative to the path of flow. It can be said with a reasonable
Method
D10 D50 D60 Io Hazen
US- Surface 1 14 34.8 36.7 -2.291 2.268
US- Subsurface 1 0.70 6.5 9.8 9.456 5.66 x 10 -2
US- Combined 1 0.90 14.5 18.0 6.749 9.37 x 10⁻²
US -Surface 2 14 33 35.5 -2.708 2.268
US -Subsurface 2 0.3 3 6 1.909 1.04 x 10⁻²
US -Combined 2 3.5 22 32.2 1.131 0.142
US -Subsurface 3 0.4 7 10 8.156 1.85 x 10⁻²
M - Surface 0.3 3.9 6.9 6.268 1.04 x 10⁻²
M -Subsurface 14 31.3 36 -2.627 2.268
M- Combined 1.9 27 31.5 31.34 4.18 x 10⁻²
DS - Suface 0.23 6 8.5 10.424 6.12 x 10⁻⁴
DS -Subsurface 14 27 29 -2.942 2.268
DS - Combined 2.5 23 26 2.189 7.23 x 10⁻²
Bar 1 Slug Test: K =

20
degree of certainty that the residence period within the gravel bars allowed for a reduction in peak stream temperatures downstream of individual gravel bars.
Discussion
This study set out with the goal of quantifying the role of gravel bars in urban river systems by examining their impact on summer stream temperature, and by analyzing the quantity of fine sediment and particulate organic matter (POM) stored in the gravel bars. Temperature analyses starting in Fall 2016 and concluding in Spring 2017, indicated that during stream temperature maxima (late summer), the stream temperature decreased, approximately 0.2°C to 1.4°C, with higher values of stream temperature reduction downstream of gravel bars, when stream temperatures were at their highest.
The stream temperature monitoring was continued during the cooler months to determine seasonal changes in temperature behavior that might be influenced by the seasonal reversals in surface-groundwater interactions described by Lundberg (2011). During November and December of 2016, the role of gravel bars changes from one that simply cools peak stream temperature to one that mitigates both peak and minimum water temperatures. This effect is likely due to an influx of groundwater flow from the floodplains. During warmer months, evapotranspiration lowers the water table near the stream and water flows out of the channel and into the gravel bars and adjacent flood plain (Lundberg, 2011). During the winter, evapotranspiration does not occur, and elevations are higher in the floodplain, causing it to flow towards the channel and mix with stream water in the gravel bars. This mixing of surface and groundwater in the bars would reduce peak temperatures and raise minimum temperatures. Groundwater monitoring can be used to determine seasonal variations in groundwater flow directions, but the monitoring of temperature upstream and downstream of the gravel bars requires significantly less installation time, cost, and monitoring. A task that requires 20 wells can potentially be done with several of the in-situ temperature gauges, such as the ones used in this study (Onset HOBO Tidbit v.2’s).
Fine sediment and organic matter storage were assessed through a combination of grain size analyses (sieve) and loss on ignition tests (LOI). Grain size analyses found small percentages of fine sediment, ranging from 1.92% to 3.88% total sample mass (less than <125 microns).The organic matter results indicated concentration by weight to be a small fraction of the fine sediment. Although seemingly small when compared to total sample mass, organic matter in
Bar Hydraulic Conductivity
(K)
Gradient Darcy Velocity
(m/s)
Velocity (m/s) Residence Time
(hrs)
Bar One 0.029 0.002 0.0001 0.0002 90.058
Bar Two 0.029 0.009 0.0002 0.0008 11.968
Bar Three 0.029 0.002 0.00005 0.0002 133.668
Table 9: Extrapolation of field hydraulic conductivity values used to determine residence time for the gravel bars studied. Note: Residence
times for bars one and three are significantly higher than the residence time for bar two. This is likely due to the higher gradient and
relatively short bar length compared to the other two bars.

21
sand aquifers are the preferred sorption sites for many toxic organic compounds. Studies at the Borden site in Ontario, Canada, indicated sorption and retardation of PCE and CTET contaminant plumes with organic matter fractions of 0.0002 (Roberts et al, 1986). Due to the high partitioning of hydrophobic organic compounds onto organic surfaces, these fractions of a percentile by weight can play a major role in the retention of anthropogenic contaminants. The gravel bars serve an additional role that serves to retain suspended sediment. Blanchet (2010) documented that gravel bar deposition raised the channel bed, resulting in more frequent overbank sedimentation and storage of suspended sediment in the floodplain. Field examinations of overbank sediment, suggest that there may be significant trapping of sediment by vegetation present on gravel bar surfaces. Vegetation affects sediment trapping by increasing flow resistance and physically trapping suspended sediment on vegetated surfaces. Previous research has suggest that tall, woody Marsh grasses excel at this task due to their ability to create the aforementioned flow resistance (Bennett et al, 2008). Additionally, studies of heavy metal transport in agricultural watersheds have previously recognized the importance of organic matter and suspended sediment as complexation sites for trace metals, and toxic organic compounds (Whitby et al, 1977).
Conclusion
Previous research suggests that gravel bars along a streams flow path may play a significant role in reducing the effects of anthropogenic change on urban waterways (Ock et al, 2015). This study specifically sought to quantify this role through field testing of a number of gravel bar parameters along the Northeast Branch of the Anacostia. Gravel bar based fine sediment and organic matter retention were monitored through direct field sampling of sediment and in-situ temperature probes placed around gravel bars along Little Paint Branch Creek. The examination of stream temperature indicated that during stream temperature maxima (late Summer), the stream temperature decreased 0.2°C to 1.4°C, with higher values in stream temperature reduction during periods of higher average stream temperature. These data support the hypothesis that gravel bars act in part to mitigate stream temperature.
Examination of the grain size of the gravel bars indicates that subsurface material is an important component of the bar sediment. The D10 of the subsurface grain size correlates with the hydraulic conductivity of the bars as measured in the field. Sieve analyses of gravel bar sediments revealed a significant fraction of sand size sediment (< 2 mm) in the subsurface sediments, often on the order of 30% total sample mass of the subsurface material (about 15% of the mass of the bar. Sieve analyses indicated little sediment below 250 microns in diameter, frequently less than one percent even among subsurface samples. These data suggest that gravel bars act to reduce stream temperature by mixing water transported through the bars (with a residence time of four to five days on average) with water that moves around the bars.
These grain size data suggest that the bars are important sites for the storage of sand-sized sediment, but not for the silt and clay sized sediment that are considered contaminants. This would suggest that fine sediment is not being stored in these gravel bars. The grain size data and hydraulic conductivity data suggest that pore spaces are the size of fine sand, and the

22
fine sediment is not transported by laminar flow through these small pore spaces in these sand-rich gravel bars. This would suggest that the hypothesis that gravel bars store more fine sediment that adjacent stream channels is unsupported and that gravel bars do not provide significant storage reservoirs for suspended sediment.
Loss on ignition testing of fine sediment from the surface and subsurface of a number of bars along Little Paint Branch Creek displayed small percentages of trapped particulate organic matter, particularly among subsurface sediments. Samples of fine sediment from the subsurface of gravel bars one and two along Little Paint Branch Creek exhibited loss on ignition values ranging from 1.924% and 5.12% in sediment samples below 125 microns in diameter, which themselves are 1-4% total sample mass. Although the total fraction of organic matter is small (0.001 to 0.0016), they meet or exceed concentrations observed in studies of sorption of organic compounds in natural gradient experiments (Roberts et al, 1986). This organic material can serve as sorption sites for trace metals and organic compounds. This would appear to support the hypothesis that gravel bars work to improve water quality by trapping and storing small quantities of particulate organic matter, which can provide retention sites for anthropogenic contaminants and trace metals. Additional observations have suggested that while gravel bars play a small role in retaining and storing fine sediment and organic material, vegetation along the edges of gravel bars may play a more important role, similar to the role of tall marsh grasses in wetland environments. The intention of the aforementioned research is to bolster the available knowledge base on watershed-morphology interaction in urban watersheds, the Anacostia watershed in particular, and to allow for the development of more useful restoration efforts within the same systems.

23
References Cited
Blanchet, Z.D., (2009), Effects of Bar Formation on Channel Stability and Sediment Loads in an Urban Watershed. Master of Science Thesis, University of Maryland College Park.
Bennett, S.J., Wu, W., Alonso, C.V., Wang, S.S., (2008), Modeling fluvial response to in-stream
woody vegetation: implications for stream corridor restoration, Earth Surface Processes and
Landforms, 33(6), 890-909
Bukaveckas, P. A. (2007), Effects of Channel Restoration on Water Velocity, Transient Storage,
and Nutrient Uptake in a Channelized Stream †. Environmental Science & Technology Environ.
Sci. Technol., 41(5), 1570-1576.
Constantz, J.E., (1998), Interaction between Stream Temperature, Streamflow, and
Groundwater Exchanges in Alpine Streams, Water Resources Research: An AGU Journal, 34(7),
1609-1615
Constantz, J. E., Niswonger, R. G.,Stewart, A. E. (2007) et al, Analysis of Temperature Gradients to Determine Stream Exchanges with Ground Water, Field Techniques for Estimating Water Fluxes Between Surface Water and Ground Water, Chapter 4, 117-126, U.S. Geologic Survey, U.S. Department of Interior doi:10.1021/es061618x Dangol, A., (2008), Transport and Storage of Coarse and Fine Grained Sediment, Little Paint
Branch Creek, Senior Thesis Geology 394 Final Report, University of Maryland Department of
Geology, College Park, Maryland
Davis, N. M., Weaver, V., Parks, K., & Lydy, M. J. (2003), An Assessment of Water Quality, Physical Habitat, and Biological Integrity of an Urban Stream in Wichita, Kansas, Prior to Restoration Improvements (Phase I). Archives of Environmental Contamination and Toxicology, 44(3), 351-359. doi:10.1007/s00244-002-2043-0 Dick, J. J., Tetzlaff, D., Birkel, C., & Soulsby, C. (2015), Modelling landscape controls on dissolved organic carbon sources and fluxes to streams. Biogeochemistry, 122(2-3), 361-374. doi:10.1007/s10533-014-0046-3 Grzechnik, E., Pitsch, H., (2004), The Basic Principles of Sieve Analysis, Retsch GmbH & Co. KG,
Haan, Germany
Hankin, E.R., (2009), Scale of Bank Roughness and Their Relationship to Bank Erosion Processes.
Master of Science Thesis, University of Maryland College Park, Department of Geology.
Hvorslev, M. J., (1951), Time lag and soil permeability in ground-water observations, U.S. Army,
Corps of Engineers

24
Keery, J., Binley, A., Crook, N., Smith, J.W., (2007), Temporal and Spatial Variability of
Groundwater-Surface Water Fluxes: Development and Application of an Analytical Method
using Temperature Time Series, Journal of Hydrology, 330(1-2), 1-16
Lundberg, D., Prestegaard, K. L., (2011), Effects of Channel Morphology on Floodplain
Inundation and Surface-Groundwater Interactions in an Urban Watershed, Master’s Thesis,
University of Maryland, Department of Geology
Maertz, D.E., (1993), Water-Resources Investigations in Wisconsin, U.S. Geological Survey Open
File Report, 93-129, Wisconsin Department of Natural Resources
Morrill, J. C., Bales, R. C., & Conklin, M. H. (2005). Estimating Stream Temperature from Air Temperature: Implications for Future Water Quality. Journal of Environmental Engineering, 131(1), 139-146. doi:10.1061/(asce)0733-9372(2005)131:1(139)
Ock, G., & Kondof, G. M. (2012), Assessment of ecological roles of gravel bar features restored
by gravel augmentation and channel rehabilitation activities below Lewiston Dam in the Trinity
River, California. Weaverville, CA: Trinity River Restoration Program.
Pansu, M, Gautheyrou, J, (2006), Water Content and Loss on Ignition, Handbook of Soil
Analysis: Mineralogical, Organic and Inorganic Methods, Part (1), (3-13).
Prestegaard, K.L., (1983), Bar Resistance in Gravel Bed Streams at Bankfull Stage, Water
Resources Research Water Resources Res. 19.2: 472-76
Rhoads, B. L., & Cahill, R. A. (1999), Geomorphological assessment of sediment contamination in an urban stream system. Applied Geochemistry, 14(4), 459-483. doi:10.1016/s0883-2927(98)00061-4 Roberts, P.V., Goltz, M.N., Mackay, D.M., (1986), A Natrual Gradient Experiment on Solute Transport in a Sand Aquifer: 3. Retardation Estimates and Mass Balances for Organic Solutes, Water Resources Research: An AGU Journal, 22(13), 2047-2058 Tong, S. T., & Chen, W. (2002), Modeling the relationship between land use and surface water quality. Journal of Environmental Management, 66(4), 377-393. doi:10.1006/jema.2002.0593 Whitby, L. M., Maclean, A.J., Schnitzer, M., Gaynor, J.D., (1977), Sources, storage and transport of heavy metals in agricultural watersheds, Soil Research Institute, Ontario, Canada Wright, A. L., Wang, Y., & Reddy, K. R. (2008), Loss‐on‐Ignition Method to Assess Soil Organic Carbon in Calcareous Everglades Wetlands. Communications in Soil Science and Plant Analysis, 39(19-20), 3074-3083. doi:10.1080/00103620802432931

25
Appendix A: Honor Code: I pledge on my honor that I have not given or received any unauthorized assistance on this assignment/examination. Signature: Patrick Deery Date: April 25th, 2017