the influence of climate change on tree species
TRANSCRIPT

The inluence of climate change on tree species distribution in west part of south-east europe 211
The inluence of climate change on tree species distribution in west part of south-east europe
J. Vukelić, S. Vojniković, D. Ugarković, D. Bakšić and S. Mikac
X
The influence of climate change on tree species distribution in west
part of south-east europe
J. Vukelić1, S. Vojniković2, D. Ugarković1, D. Bakšić1 and S. Mikac1 1Faculty of Forestry University of Zagreb
Svetosimunska 25, 10000 Zagreb,
Croatia 2Faculty of Forestry University of Sarajevo
Zagrebačka 20, 71000 Sarajevo,
Bosnia and Herzegovina
1. Introduction
Ecological niche is n-dimensional hipervolume space defined by amount of ecological factors in which population of certain species is able to persist. From ecological point of view there are fundamental (FEN) and realized niche (REN). Fundamental ecological niche is space which certain species occupies in lower competition of other species or in absence of natural antagonists. Opposite to fundamental niche realized niche is space in which certain species accrues and persists in presence of competition with other species (Hutchinson, 1957). To fully understand ecological niche is rather complicated concept. Ecological niche can be imagined as multidimensional space in which each ecological factor is presented by vector different in amount and direction of action. Amount of ecological factor action is shown in his importance for accruence and development of species, while direction of action can be positive or negative on species prevalence. Entirely understanding influence of each ecological factor on certain species space distribution is fairly difficult since between ecological factors exist certain dependence. Importance of ecological niche on appearance and accurance of certain species can be observed on few resolution levels. Species during ontogeny development develops different needs toward ecological factors. Seed of all tree species for germination and initial growth needs only temperature and soil moisture, for further development young plant needs higher amount of sun radiation, moisture, nutrients and lower competition of mature trees. If ecological niche is observed from the view of population in certain geographical climate than climatic and geomorphologic (relief) factors have higher importance for spatial distribution and formation of species areal.
12
www.intechopen.com

Climate Change and Variability212
Beside air temperature depending on cloudiness and air insulation, precipitation has the highest importance for vegetation development while being the main source of moisture in soil needed for basic physiological processes. When values of temperature and precipitation are observed should be considered that exactly extreme values (minimum and maximum) of these two ecological factors are limiting for certain species thriving. Extreme values of climate factors determine distribution range of certain species alongside ecological factor gradient. Climate factors (temperature and precipitation) can be according to their effect divided on local and global that is micro and macroclimatic. Microclimate factors cause anomalies within certain climate area, as for example climate inversion within certain climate area determined by relief. Climate factor changes cause also change in appearance of vegetation cover certain area. Climate factors effect on dragging certain species in newer areas or higher altitudes while their place is taken by other species that can adapt to changed ecological conditions. Wills et al. (1999) pointed out significant association between vegetation dynamic and Earth orbital frequencies (Milanković cycles) in amplitudes at about 124000 years. Climate change is normal appearance in nature caused by natural variability. In the last interglaciation period using oxygen isotope δ18O isolated on Greenland low temperature oscillations were found (Dansgaard et al., 1993). Oscillations in Holocene were ±1,5 ºC for average summer and annual temperature (Wick & Tinner, 1997), while precipitation reconstruction showed significant oscillations during Holocene (Magny et al., 2003). Davis (2003) found variations in average temperature from +0,5 to -2,5 ºC for the entire Europe during Holocene. In contest of climate change should be distinguished climate change from climate fluctuation. Climate change is defined as one-way directed change. Contrariwise, climate fluctuation implies rhythmic oscillations around one average value whereat higher or lower amplitudes can appear. When determining climate change there is evident significance of time factor since one-way directed change of certain time period can be, at prolongation of observation sequences, shown as part of climate fluctuation. Therefore is useful to comprise climate change and climate fluctuations with common mark as climate change (Kirigin, 1975). Nowadays there are many scientific discussions and interpretations of global warming causes. Analyses of ice boreholes are showing high increase of CO2 concentration in atmosphere and increase of CO2 during industrial period from 280 ppmv (year 1750.) to 365 ppmv (year 1998.) (Högberg, 2007). Hasselmann (1997) points out that during last century average temperature has increased by 0,5 ºC. According to same author theory about anthropogenic cause of global climate changes is still controversial. Loutre (2003) assigns long current interglacial period of almost 5000 years to high CO2 concentration that prevents development of ice shield and at a same time beginning of new glaciations. Part of southeast Europe is highly important for overall vegetation of Europe. This geographically small area is abounded with numerous different tree species. Paleonological researches classify it in important refuge during last glacial from where certain tree species have expanded in northern parts of Europe (Willis, 1994). Willis et al. (1999) indicates on simultaneous existence of subtropical genders as: Carya, Pterocarya, Liquidambar, Seqouia, Taxoduim, Nissa etc., alongside with fir (Abies) and beech (Fagus) on area nowadays Balaton. Second example is specie Acer monspessulanum spread over south Europe, and during Ipswichiana period outspread as far as British peninsula
(West, 1980). Same author find out that spruce (Picea omorika) in Pastoniana period has grown as far as south of England. Some tree species appear only in pure forests (composed of only one tree species), while others can be found and in mixed communities (composed of two or more tree species). Some tree species nowadays are widely distributed (Fagus sylvatica), while other tree species are only individually incorporated in theirs distribution area (Acer pseudopaltanus). Dominant vegetation types of forests nowadays present in southeast Europe territory are pedunculate oak (Quercus robur) forests bounded at larger rivers in Panonian lowland area. In hilly area at 400 m altitude are dominant sessile oak (Quercus petrea) forests. In mountain area at 400-800 m of altitude are dominant pure and mixed forests of common beech (Fagus sylvatica), and at 700-1100 m of altitude are found mixed forests of common beech, fir and spruce. In pre-mountain region is dominant mountain pine (Pinus mugo). In coastal region of Adriatic see dominant are pine species namely Holm oak (Quercus ilex) and pubescent oak (Quercus pubescens).
Fig. 1. Main vegetation types of forests with dominant tree species in southeast Europe: a) Pinus mugo, b) Picea abies, c) Pinus nigra, d) Quercus petrea, e) Quercus robur, f) Pinus sylvestris, g) Abies alba, h) Quercus ilex, i) Fagus sylvatica and j) Quercus pubescens.
www.intechopen.com

The inluence of climate change on tree species distribution in west part of south-east europe 213
Beside air temperature depending on cloudiness and air insulation, precipitation has the highest importance for vegetation development while being the main source of moisture in soil needed for basic physiological processes. When values of temperature and precipitation are observed should be considered that exactly extreme values (minimum and maximum) of these two ecological factors are limiting for certain species thriving. Extreme values of climate factors determine distribution range of certain species alongside ecological factor gradient. Climate factors (temperature and precipitation) can be according to their effect divided on local and global that is micro and macroclimatic. Microclimate factors cause anomalies within certain climate area, as for example climate inversion within certain climate area determined by relief. Climate factor changes cause also change in appearance of vegetation cover certain area. Climate factors effect on dragging certain species in newer areas or higher altitudes while their place is taken by other species that can adapt to changed ecological conditions. Wills et al. (1999) pointed out significant association between vegetation dynamic and Earth orbital frequencies (Milanković cycles) in amplitudes at about 124000 years. Climate change is normal appearance in nature caused by natural variability. In the last interglaciation period using oxygen isotope δ18O isolated on Greenland low temperature oscillations were found (Dansgaard et al., 1993). Oscillations in Holocene were ±1,5 ºC for average summer and annual temperature (Wick & Tinner, 1997), while precipitation reconstruction showed significant oscillations during Holocene (Magny et al., 2003). Davis (2003) found variations in average temperature from +0,5 to -2,5 ºC for the entire Europe during Holocene. In contest of climate change should be distinguished climate change from climate fluctuation. Climate change is defined as one-way directed change. Contrariwise, climate fluctuation implies rhythmic oscillations around one average value whereat higher or lower amplitudes can appear. When determining climate change there is evident significance of time factor since one-way directed change of certain time period can be, at prolongation of observation sequences, shown as part of climate fluctuation. Therefore is useful to comprise climate change and climate fluctuations with common mark as climate change (Kirigin, 1975). Nowadays there are many scientific discussions and interpretations of global warming causes. Analyses of ice boreholes are showing high increase of CO2 concentration in atmosphere and increase of CO2 during industrial period from 280 ppmv (year 1750.) to 365 ppmv (year 1998.) (Högberg, 2007). Hasselmann (1997) points out that during last century average temperature has increased by 0,5 ºC. According to same author theory about anthropogenic cause of global climate changes is still controversial. Loutre (2003) assigns long current interglacial period of almost 5000 years to high CO2 concentration that prevents development of ice shield and at a same time beginning of new glaciations. Part of southeast Europe is highly important for overall vegetation of Europe. This geographically small area is abounded with numerous different tree species. Paleonological researches classify it in important refuge during last glacial from where certain tree species have expanded in northern parts of Europe (Willis, 1994). Willis et al. (1999) indicates on simultaneous existence of subtropical genders as: Carya, Pterocarya, Liquidambar, Seqouia, Taxoduim, Nissa etc., alongside with fir (Abies) and beech (Fagus) on area nowadays Balaton. Second example is specie Acer monspessulanum spread over south Europe, and during Ipswichiana period outspread as far as British peninsula
(West, 1980). Same author find out that spruce (Picea omorika) in Pastoniana period has grown as far as south of England. Some tree species appear only in pure forests (composed of only one tree species), while others can be found and in mixed communities (composed of two or more tree species). Some tree species nowadays are widely distributed (Fagus sylvatica), while other tree species are only individually incorporated in theirs distribution area (Acer pseudopaltanus). Dominant vegetation types of forests nowadays present in southeast Europe territory are pedunculate oak (Quercus robur) forests bounded at larger rivers in Panonian lowland area. In hilly area at 400 m altitude are dominant sessile oak (Quercus petrea) forests. In mountain area at 400-800 m of altitude are dominant pure and mixed forests of common beech (Fagus sylvatica), and at 700-1100 m of altitude are found mixed forests of common beech, fir and spruce. In pre-mountain region is dominant mountain pine (Pinus mugo). In coastal region of Adriatic see dominant are pine species namely Holm oak (Quercus ilex) and pubescent oak (Quercus pubescens).
Fig. 1. Main vegetation types of forests with dominant tree species in southeast Europe: a) Pinus mugo, b) Picea abies, c) Pinus nigra, d) Quercus petrea, e) Quercus robur, f) Pinus sylvestris, g) Abies alba, h) Quercus ilex, i) Fagus sylvatica and j) Quercus pubescens.
www.intechopen.com

Climate Change and Variability214
Fully understanding of ecological niche it is of crucial importance for getting complete insight in forest ecosystems function. Understanding interaction between climate and vegetation represents one of the most essential segments in researching geographical distribution and development of species.
2. Material and methods
For ecological niche modelling were used available date on tree species distribution obtained from data of terrestrial habitats Republic of Croatia (Oikon d.o.o. for MZOPU, 2004), Flora Croatica Database (http://hirc.botanic.hr), reconstructing vegetation maps (Map of forest vegetation Republic of Bosnia and Hercegovina and Map of forest ecosystems Republic of Croatia) and personal field researches. For ecological niche spatial distribution modelling and their projections under climate changes scenario were chosen climate characteristic tree species on entire are, such as: Holm oak (Quercus ilex), pubescent oak (Quercus pubescens), pedunculate oak (Quercus robur), sessile oak (Quercus petrea), common beech (Fagus sylvatica), common fir (Abies alba), mountain pine (Pinus mugo), Austrian pine (Pinus nigra) and scots pine (Pinus sylvestris). Climate data used for ecological niche modelling were taken from database WORLDCLIME for period 1950-2000 (http://www.worlclime.org). Spatial distribution of climate data is 30arc-seconds, that equals to the approximately resolution of 1 km2 (to be exact 0,83 km2) (Hijmans et al., 2005). Spatial distribution change of ecological niche for main tree species was modelled for year 2080. using climate data obtained from global climate change models CGCM2 (Coupled Global Climate Model-SRES-A2a) and CGCma (Canadian Centre for Climate Modelling and Analysis) (source: http://gisweb.ciat.cgiar.org). This climate model represents second version of first generation global climate model (CGCM1) essentially improved when compared to first version. Parameters of mixing ocean from horizontal vertical scheme were modified to vertiginously mixing (Gent & McWilliams, 1990) and in the second generation model was included sea and ice dynamic (Flato & Hibler, 1992). For ecological niche modelling was used MAXENT program (Phillips et al., 2004, 2006). Among ecological factors were used extreme values of bioclimatic variables, namely: maximum temperature of the hottest month in year (BIO5), minimum temperature of the coldest month in the year (BIO6), precipitation of the wettest month in the year (BIO13) and precipitation of the driest month in the year (BIO14). Other climate variables were due to high linear correlation coefficient discarded as independent from prediction model of spatial distribution ecological niche. Altitude also was not included in prediction model since it showed extremely high positive correlation with maximum temperature of the hottest month (BIO5). Obtained maps of spatial distribution ecological niche were transformed into grids and visualed in ArcMap 9.2.
Fig. 2. Process of modelling ecological niche according to chosen climate factors as predictor variables using MAXENT program and projection of the present ecological niche according to the global climate change model CGCM2 for year 2080.
3. Results
The lowest average minimum temperature of the coldest month was determined for mountain pine (Pinus mugo) at -5,9 ºC and for common fir (Abies alba) at -5,3 ºC. The highest minimal temperatures of the coldest month were found for holm oak (Quercus ilex) at 3,6 ºC and pubescent oak (Quercus pubescens) at 0,2 ºC. The highest values of maximum temperatures of the hottest month were determined for holm oak (Quercus ilex) at 28,9 ºC, pedunculate oak (Quercus robur) at 27,5 ºC and for pubescent oak (Quercus pubescens) and sessile oak (Quercus petrea) at 28,9 ºC. The lowest minimum temperature of the hottest month was found for mountain pine (Pinus mugo) at 19,1 ºC. These temperature values pertain to the period 1950-2008. Global climate model CGCM2 (A2a) showed significant increase of minimum and maximum temperatures for all tree species. Average increase of maximum temperatures the hottest month for all tree species according to used climate change model is 6,9 ºC, in range from 6,2 ºC for mountain pine (Pinus mugo) to 7,6 ºC for Austrian pine (Pinus nigra). Average increase of minimum temperature the coldest month according to climate change model is 2,0 ºC, with the highest change found for holm oak (Quercus ilex) at 2,3 ºC, and the lowest for sessile oak (Quercus petrea) at 1,9 ºC.
www.intechopen.com

The inluence of climate change on tree species distribution in west part of south-east europe 215
Fully understanding of ecological niche it is of crucial importance for getting complete insight in forest ecosystems function. Understanding interaction between climate and vegetation represents one of the most essential segments in researching geographical distribution and development of species.
2. Material and methods
For ecological niche modelling were used available date on tree species distribution obtained from data of terrestrial habitats Republic of Croatia (Oikon d.o.o. for MZOPU, 2004), Flora Croatica Database (http://hirc.botanic.hr), reconstructing vegetation maps (Map of forest vegetation Republic of Bosnia and Hercegovina and Map of forest ecosystems Republic of Croatia) and personal field researches. For ecological niche spatial distribution modelling and their projections under climate changes scenario were chosen climate characteristic tree species on entire are, such as: Holm oak (Quercus ilex), pubescent oak (Quercus pubescens), pedunculate oak (Quercus robur), sessile oak (Quercus petrea), common beech (Fagus sylvatica), common fir (Abies alba), mountain pine (Pinus mugo), Austrian pine (Pinus nigra) and scots pine (Pinus sylvestris). Climate data used for ecological niche modelling were taken from database WORLDCLIME for period 1950-2000 (http://www.worlclime.org). Spatial distribution of climate data is 30arc-seconds, that equals to the approximately resolution of 1 km2 (to be exact 0,83 km2) (Hijmans et al., 2005). Spatial distribution change of ecological niche for main tree species was modelled for year 2080. using climate data obtained from global climate change models CGCM2 (Coupled Global Climate Model-SRES-A2a) and CGCma (Canadian Centre for Climate Modelling and Analysis) (source: http://gisweb.ciat.cgiar.org). This climate model represents second version of first generation global climate model (CGCM1) essentially improved when compared to first version. Parameters of mixing ocean from horizontal vertical scheme were modified to vertiginously mixing (Gent & McWilliams, 1990) and in the second generation model was included sea and ice dynamic (Flato & Hibler, 1992). For ecological niche modelling was used MAXENT program (Phillips et al., 2004, 2006). Among ecological factors were used extreme values of bioclimatic variables, namely: maximum temperature of the hottest month in year (BIO5), minimum temperature of the coldest month in the year (BIO6), precipitation of the wettest month in the year (BIO13) and precipitation of the driest month in the year (BIO14). Other climate variables were due to high linear correlation coefficient discarded as independent from prediction model of spatial distribution ecological niche. Altitude also was not included in prediction model since it showed extremely high positive correlation with maximum temperature of the hottest month (BIO5). Obtained maps of spatial distribution ecological niche were transformed into grids and visualed in ArcMap 9.2.
Fig. 2. Process of modelling ecological niche according to chosen climate factors as predictor variables using MAXENT program and projection of the present ecological niche according to the global climate change model CGCM2 for year 2080.
3. Results
The lowest average minimum temperature of the coldest month was determined for mountain pine (Pinus mugo) at -5,9 ºC and for common fir (Abies alba) at -5,3 ºC. The highest minimal temperatures of the coldest month were found for holm oak (Quercus ilex) at 3,6 ºC and pubescent oak (Quercus pubescens) at 0,2 ºC. The highest values of maximum temperatures of the hottest month were determined for holm oak (Quercus ilex) at 28,9 ºC, pedunculate oak (Quercus robur) at 27,5 ºC and for pubescent oak (Quercus pubescens) and sessile oak (Quercus petrea) at 28,9 ºC. The lowest minimum temperature of the hottest month was found for mountain pine (Pinus mugo) at 19,1 ºC. These temperature values pertain to the period 1950-2008. Global climate model CGCM2 (A2a) showed significant increase of minimum and maximum temperatures for all tree species. Average increase of maximum temperatures the hottest month for all tree species according to used climate change model is 6,9 ºC, in range from 6,2 ºC for mountain pine (Pinus mugo) to 7,6 ºC for Austrian pine (Pinus nigra). Average increase of minimum temperature the coldest month according to climate change model is 2,0 ºC, with the highest change found for holm oak (Quercus ilex) at 2,3 ºC, and the lowest for sessile oak (Quercus petrea) at 1,9 ºC.
www.intechopen.com
Climate Change and Variability216
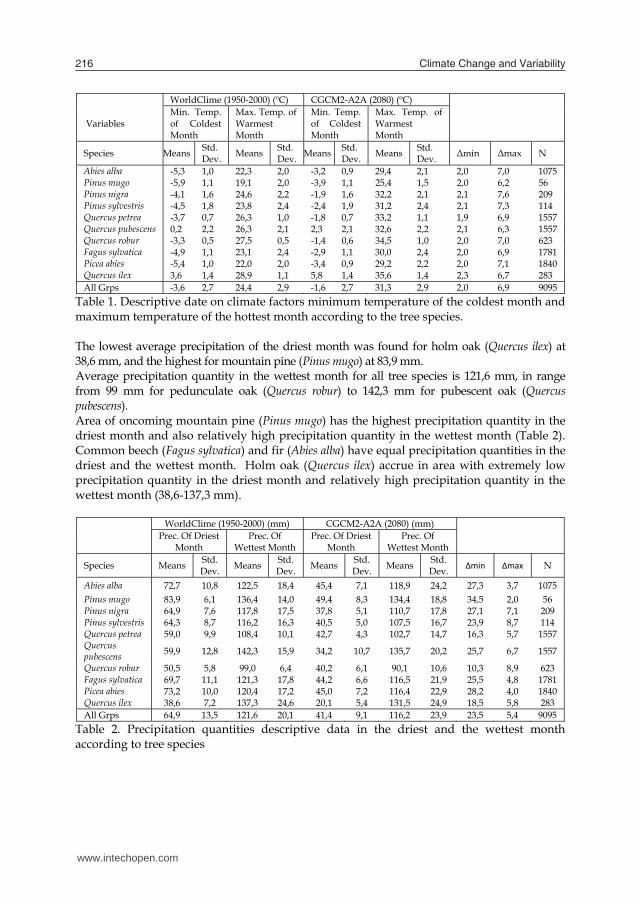
Variables
WorldClime (1950-2000) (ºC) CGCM2-A2A (2080) (ºC)
Min. Temp. of Coldest Month
Max. Temp. of Warmest Month
Min. Temp. of Coldest Month
Max. Temp. of Warmest Month
Species Means Std. Dev. Means Std.
Dev. Means Std. Dev. Means Std.
Dev. Δmin Δmax N
Abies alba -5,3 1,0 22,3 2,0 -3,2 0,9 29,4 2,1 2,0 7,0 1075 Pinus mugo -5,9 1,1 19,1 2,0 -3,9 1,1 25,4 1,5 2,0 6,2 56 Pinus nigra -4,1 1,6 24,6 2,2 -1,9 1,6 32,2 2,1 2,1 7,6 209 Pinus sylvestris -4,5 1,8 23,8 2,4 -2,4 1,9 31,2 2,4 2,1 7,3 114 Quercus petrea -3,7 0,7 26,3 1,0 -1,8 0,7 33,2 1,1 1,9 6,9 1557 Quercus pubescens 0,2 2,2 26,3 2,1 2,3 2,1 32,6 2,2 2,1 6,3 1557 Quercus robur -3,3 0,5 27,5 0,5 -1,4 0,6 34,5 1,0 2,0 7,0 623 Fagus sylvatica -4,9 1,1 23,1 2,4 -2,9 1,1 30,0 2,4 2,0 6,9 1781 Picea abies -5,4 1,0 22,0 2,0 -3,4 0,9 29,2 2,2 2,0 7,1 1840 Quercus ilex 3,6 1,4 28,9 1,1 5,8 1,4 35,6 1,4 2,3 6,7 283 All Grps -3,6 2,7 24,4 2,9 -1,6 2,7 31,3 2,9 2,0 6,9 9095
Table 1. Descriptive date on climate factors minimum temperature of the coldest month and maximum temperature of the hottest month according to the tree species. The lowest average precipitation of the driest month was found for holm oak (Quercus ilex) at 38,6 mm, and the highest for mountain pine (Pinus mugo) at 83,9 mm. Average precipitation quantity in the wettest month for all tree species is 121,6 mm, in range from 99 mm for pedunculate oak (Quercus robur) to 142,3 mm for pubescent oak (Quercus pubescens). Area of oncoming mountain pine (Pinus mugo) has the highest precipitation quantity in the driest month and also relatively high precipitation quantity in the wettest month (Table 2). Common beech (Fagus sylvatica) and fir (Abies alba) have equal precipitation quantities in the driest and the wettest month. Holm oak (Quercus ilex) accrue in area with extremely low precipitation quantity in the driest month and relatively high precipitation quantity in the wettest month (38,6-137,3 mm).
WorldClime (1950-2000) (mm) CGCM2-A2A (2080) (mm)
Prec. Of Driest
Month Prec. Of
Wettest Month Prec. Of Driest
Month Prec. Of
Wettest Month
Species Means Std. Dev. Means Std.
Dev. Means Std. Dev. Means Std.
Dev. Δmin Δmax N
Abies alba 72,7 10,8 122,5 18,4 45,4 7,1 118,9 24,2 27,3 3,7 1075 Pinus mugo 83,9 6,1 136,4 14,0 49,4 8,3 134,4 18,8 34,5 2,0 56 Pinus nigra 64,9 7,6 117,8 17,5 37,8 5,1 110,7 17,8 27,1 7,1 209 Pinus sylvestris 64,3 8,7 116,2 16,3 40,5 5,0 107,5 16,7 23,9 8,7 114 Quercus petrea 59,0 9,9 108,4 10,1 42,7 4,3 102,7 14,7 16,3 5,7 1557 Quercus pubescens 59,9 12,8 142,3 15,9 34,2 10,7 135,7 20,2 25,7 6,7 1557
Quercus robur 50,5 5,8 99,0 6,4 40,2 6,1 90,1 10,6 10,3 8,9 623 Fagus sylvatica 69,7 11,1 121,3 17,8 44,2 6,6 116,5 21,9 25,5 4,8 1781 Picea abies 73,2 10,0 120,4 17,2 45,0 7,2 116,4 22,9 28,2 4,0 1840 Quercus ilex 38,6 7,2 137,3 24,6 20,1 5,4 131,5 24,9 18,5 5,8 283 All Grps 64,9 13,5 121,6 20,1 41,4 9,1 116,2 23,9 23,5 5,4 9095
Table 2. Precipitation quantities descriptive data in the driest and the wettest month according to tree species
Precipitation quantities of the driest month according to global climate change model showed significant decrease of average values for 23,5 mm, while average precipitation quantities of the wettest month decreased for 5,4 mm. The highest average precipitation quantities of the driest month were found for mountain pine (Pinus mugo) at 34,5 mm or in relative value 41,12 %. The highest decrease in average precipitation quantities of the driest month is found for holm oak (Quercus ilex) at 18,5 mm or 48,00 % in relative value. The highest decrease in precipitation of the wettest month was found for pedunculate oak (Quercus robur) at 8,9 mm or 8,94 % when compared with data in period 1950-2000. Statistically significant differences were determined between all values of analysed climate factors apart for pubescent oak (Quercus pubescens) and sessile oak (Quercus petrea) for maximal temperature of the hottest month (p=0,84494). Statistically significant differences were not found for precipitation quantities of the driest month between spruce (Picea abies) and fir (Abies alba) (p=0,16283) and between Austrian pine (Pinus nigra) and scots pine (Pinus sylvestris) (p=0,628145). Significant differences were not found between holm oak (Quercus ilex) and mountain pine (Pinus mugo) for precipitation quantities of the wettest month (p=0,69797) and for scots pine (Pinus sylvestris) and Austrian pine (Pinus nigra) (p=0,382217) as well as between spruce (Picea abies) and common beech (Fagus sylvatica) (p=0,103702).
Fig. 3. Box & Whisker plot average values (Mean±1,96 St.Dev) of climate variables used for modelling ecological niche according to tree species for period 1950-2000 and their projected values according to global climate change model CGCM2 with projection for 2080. Range of tree species population can be monitored depending on every climate factor individual. In Table 3. are presented species range values according to individual climate factor. It can be seen that 95 % of pedunculate oak (Quercus robur) population is in very narrow maximum temperature range for the hottest month (T_max M.) at 1,70 ºC, while total population has range of 2 ºC. In contrary to pedunculate oak, common beech (Fagus sylvatica) shows brooder range of total population at 13,6 ºC as well as sessile oak (Quercus petrea) at 14,10 ºC. Common beech is due to wide distribution considered as species of wide ecological valence towards climate factors whereat average range maximum temperatures of the hottest month is at 8,40 ºC and 4,30 ºC for minimum temperature of the coldest month (T_min M.).
www.intechopen.com

The inluence of climate change on tree species distribution in west part of south-east europe 217
Variables
WorldClime (1950-2000) (ºC) CGCM2-A2A (2080) (ºC)
Min. Temp. of Coldest Month
Max. Temp. of Warmest Month
Min. Temp. of Coldest Month
Max. Temp. of Warmest Month
Species Means Std. Dev. Means Std.
Dev. Means Std. Dev. Means Std.
Dev. Δmin Δmax N
Abies alba -5,3 1,0 22,3 2,0 -3,2 0,9 29,4 2,1 2,0 7,0 1075 Pinus mugo -5,9 1,1 19,1 2,0 -3,9 1,1 25,4 1,5 2,0 6,2 56 Pinus nigra -4,1 1,6 24,6 2,2 -1,9 1,6 32,2 2,1 2,1 7,6 209 Pinus sylvestris -4,5 1,8 23,8 2,4 -2,4 1,9 31,2 2,4 2,1 7,3 114 Quercus petrea -3,7 0,7 26,3 1,0 -1,8 0,7 33,2 1,1 1,9 6,9 1557 Quercus pubescens 0,2 2,2 26,3 2,1 2,3 2,1 32,6 2,2 2,1 6,3 1557 Quercus robur -3,3 0,5 27,5 0,5 -1,4 0,6 34,5 1,0 2,0 7,0 623 Fagus sylvatica -4,9 1,1 23,1 2,4 -2,9 1,1 30,0 2,4 2,0 6,9 1781 Picea abies -5,4 1,0 22,0 2,0 -3,4 0,9 29,2 2,2 2,0 7,1 1840 Quercus ilex 3,6 1,4 28,9 1,1 5,8 1,4 35,6 1,4 2,3 6,7 283 All Grps -3,6 2,7 24,4 2,9 -1,6 2,7 31,3 2,9 2,0 6,9 9095
Table 1. Descriptive date on climate factors minimum temperature of the coldest month and maximum temperature of the hottest month according to the tree species. The lowest average precipitation of the driest month was found for holm oak (Quercus ilex) at 38,6 mm, and the highest for mountain pine (Pinus mugo) at 83,9 mm. Average precipitation quantity in the wettest month for all tree species is 121,6 mm, in range from 99 mm for pedunculate oak (Quercus robur) to 142,3 mm for pubescent oak (Quercus pubescens). Area of oncoming mountain pine (Pinus mugo) has the highest precipitation quantity in the driest month and also relatively high precipitation quantity in the wettest month (Table 2). Common beech (Fagus sylvatica) and fir (Abies alba) have equal precipitation quantities in the driest and the wettest month. Holm oak (Quercus ilex) accrue in area with extremely low precipitation quantity in the driest month and relatively high precipitation quantity in the wettest month (38,6-137,3 mm).
WorldClime (1950-2000) (mm) CGCM2-A2A (2080) (mm)
Prec. Of Driest
Month Prec. Of
Wettest Month Prec. Of Driest
Month Prec. Of
Wettest Month
Species Means Std. Dev. Means Std.
Dev. Means Std. Dev. Means Std.
Dev. Δmin Δmax N
Abies alba 72,7 10,8 122,5 18,4 45,4 7,1 118,9 24,2 27,3 3,7 1075 Pinus mugo 83,9 6,1 136,4 14,0 49,4 8,3 134,4 18,8 34,5 2,0 56 Pinus nigra 64,9 7,6 117,8 17,5 37,8 5,1 110,7 17,8 27,1 7,1 209 Pinus sylvestris 64,3 8,7 116,2 16,3 40,5 5,0 107,5 16,7 23,9 8,7 114 Quercus petrea 59,0 9,9 108,4 10,1 42,7 4,3 102,7 14,7 16,3 5,7 1557 Quercus pubescens 59,9 12,8 142,3 15,9 34,2 10,7 135,7 20,2 25,7 6,7 1557
Quercus robur 50,5 5,8 99,0 6,4 40,2 6,1 90,1 10,6 10,3 8,9 623 Fagus sylvatica 69,7 11,1 121,3 17,8 44,2 6,6 116,5 21,9 25,5 4,8 1781 Picea abies 73,2 10,0 120,4 17,2 45,0 7,2 116,4 22,9 28,2 4,0 1840 Quercus ilex 38,6 7,2 137,3 24,6 20,1 5,4 131,5 24,9 18,5 5,8 283 All Grps 64,9 13,5 121,6 20,1 41,4 9,1 116,2 23,9 23,5 5,4 9095
Table 2. Precipitation quantities descriptive data in the driest and the wettest month according to tree species
Precipitation quantities of the driest month according to global climate change model showed significant decrease of average values for 23,5 mm, while average precipitation quantities of the wettest month decreased for 5,4 mm. The highest average precipitation quantities of the driest month were found for mountain pine (Pinus mugo) at 34,5 mm or in relative value 41,12 %. The highest decrease in average precipitation quantities of the driest month is found for holm oak (Quercus ilex) at 18,5 mm or 48,00 % in relative value. The highest decrease in precipitation of the wettest month was found for pedunculate oak (Quercus robur) at 8,9 mm or 8,94 % when compared with data in period 1950-2000. Statistically significant differences were determined between all values of analysed climate factors apart for pubescent oak (Quercus pubescens) and sessile oak (Quercus petrea) for maximal temperature of the hottest month (p=0,84494). Statistically significant differences were not found for precipitation quantities of the driest month between spruce (Picea abies) and fir (Abies alba) (p=0,16283) and between Austrian pine (Pinus nigra) and scots pine (Pinus sylvestris) (p=0,628145). Significant differences were not found between holm oak (Quercus ilex) and mountain pine (Pinus mugo) for precipitation quantities of the wettest month (p=0,69797) and for scots pine (Pinus sylvestris) and Austrian pine (Pinus nigra) (p=0,382217) as well as between spruce (Picea abies) and common beech (Fagus sylvatica) (p=0,103702).
Fig. 3. Box & Whisker plot average values (Mean±1,96 St.Dev) of climate variables used for modelling ecological niche according to tree species for period 1950-2000 and their projected values according to global climate change model CGCM2 with projection for 2080. Range of tree species population can be monitored depending on every climate factor individual. In Table 3. are presented species range values according to individual climate factor. It can be seen that 95 % of pedunculate oak (Quercus robur) population is in very narrow maximum temperature range for the hottest month (T_max M.) at 1,70 ºC, while total population has range of 2 ºC. In contrary to pedunculate oak, common beech (Fagus sylvatica) shows brooder range of total population at 13,6 ºC as well as sessile oak (Quercus petrea) at 14,10 ºC. Common beech is due to wide distribution considered as species of wide ecological valence towards climate factors whereat average range maximum temperatures of the hottest month is at 8,40 ºC and 4,30 ºC for minimum temperature of the coldest month (T_min M.).
www.intechopen.com

Climate Change and Variability218
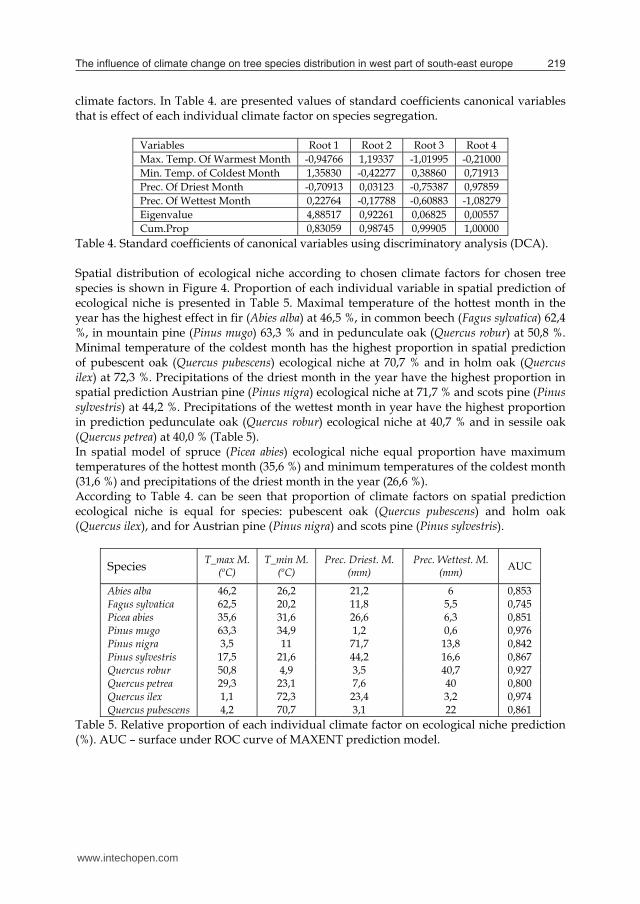
Species T_max M. (ºC) T_min M. (ºC) Prec. Driest. M. (mm) Prec. Wettest. M. (mm)
95% Min.-Max. 95% Min.-Max. 95% Min.-Max. 95% Min.-Max. Abies alba 7,90 12,00 3,80 7,80 38 50 59 68 Pinus mugo 6,90 8,40 3,80 5,10 25 25 40 43 Pinus nigra 8,40 11,50 6,70 8,20 31 42 56 68 Pinus sylvestris 9,00 11,60 7,80 8,50 36 42 56 59 Quercus petrea 4,10 9,10 3,20 5,10 34 44 41 56 Quercus pubescens 8,40 14,10 8,10 11,50 46 59 63 96
Quercus robur 1,70 2,00 1,90 2,30 24 28 21 37 Fagus sylvatica 8,40 13,60 4,30 8,90 44 53 60 73 Picea abies 8,15 12,00 3,65 7,00 36 44 57 68 Quercus ilex 4,70 5,90 5,50 6,90 29 41 92 99
Table 3. Range of values chosen climate factors according to tree species. Min.-Max. – range between the lowest and the highest value. Ecological niche analysis considering all variables was done using discriminate analysis (DCA). Results show position of chosen tree species population projected in two-dimensional system where every axis is linear combination all four climate factors (Figure 3).
Fig. 3. Frequency distribution according to tree species and chosen climate factors a). Scatter plot canonical values of discriminate analysis b). Results of discriminate analysis show clear segregation of populations according to tree species in two larger groups. First group includes species holm oak (Quercus ilex) and pubescent oak (Quercus pubescens) where discriminatory variable is Root 1. Both species clearly segregate from all others and exactly they define geographical appurtenance to Mediterranean region. Second group composed from all other species can be geographically classified in continental region. Discriminatory axis Root 2 shows clear species segregation from pedunculate oak (Quercus robur), across sessile oak (Quercus petrea) up to mountain pine (Pinus mugo), while fir, beech and spruce overlap considering combination of chosen
climate factors. In Table 4. are presented values of standard coefficients canonical variables that is effect of each individual climate factor on species segregation.
Variables Root 1 Root 2 Root 3 Root 4 Max. Temp. Of Warmest Month -0,94766 1,19337 -1,01995 -0,21000 Min. Temp. of Coldest Month 1,35830 -0,42277 0,38860 0,71913 Prec. Of Driest Month -0,70913 0,03123 -0,75387 0,97859 Prec. Of Wettest Month 0,22764 -0,17788 -0,60883 -1,08279 Eigenvalue 4,88517 0,92261 0,06825 0,00557 Cum.Prop 0,83059 0,98745 0,99905 1,00000
Table 4. Standard coefficients of canonical variables using discriminatory analysis (DCA). Spatial distribution of ecological niche according to chosen climate factors for chosen tree species is shown in Figure 4. Proportion of each individual variable in spatial prediction of ecological niche is presented in Table 5. Maximal temperature of the hottest month in the year has the highest effect in fir (Abies alba) at 46,5 %, in common beech (Fagus sylvatica) 62,4 %, in mountain pine (Pinus mugo) 63,3 % and in pedunculate oak (Quercus robur) at 50,8 %. Minimal temperature of the coldest month has the highest proportion in spatial prediction of pubescent oak (Quercus pubescens) ecological niche at 70,7 % and in holm oak (Quercus ilex) at 72,3 %. Precipitations of the driest month in the year have the highest proportion in spatial prediction Austrian pine (Pinus nigra) ecological niche at 71,7 % and scots pine (Pinus sylvestris) at 44,2 %. Precipitations of the wettest month in year have the highest proportion in prediction pedunculate oak (Quercus robur) ecological niche at 40,7 % and in sessile oak (Quercus petrea) at 40,0 % (Table 5). In spatial model of spruce (Picea abies) ecological niche equal proportion have maximum temperatures of the hottest month (35,6 %) and minimum temperatures of the coldest month (31,6 %) and precipitations of the driest month in the year (26,6 %). According to Table 4. can be seen that proportion of climate factors on spatial prediction ecological niche is equal for species: pubescent oak (Quercus pubescens) and holm oak (Quercus ilex), and for Austrian pine (Pinus nigra) and scots pine (Pinus sylvestris).
Species T_max M. (ºC)
T_min M. (ºC)
Prec. Driest. M. (mm)
Prec. Wettest. M. (mm) AUC
Abies alba 46,2 26,2 21,2 6 0,853 Fagus sylvatica 62,5 20,2 11,8 5,5 0,745 Picea abies 35,6 31,6 26,6 6,3 0,851 Pinus mugo 63,3 34,9 1,2 0,6 0,976 Pinus nigra 3,5 11 71,7 13,8 0,842 Pinus sylvestris 17,5 21,6 44,2 16,6 0,867 Quercus robur 50,8 4,9 3,5 40,7 0,927 Quercus petrea 29,3 23,1 7,6 40 0,800 Quercus ilex 1,1 72,3 23,4 3,2 0,974 Quercus pubescens 4,2 70,7 3,1 22 0,861
Table 5. Relative proportion of each individual climate factor on ecological niche prediction (%). AUC – surface under ROC curve of MAXENT prediction model.
www.intechopen.com
The inluence of climate change on tree species distribution in west part of south-east europe 219
Species T_max M. (ºC) T_min M. (ºC) Prec. Driest. M. (mm) Prec. Wettest. M. (mm)
95% Min.-Max. 95% Min.-Max. 95% Min.-Max. 95% Min.-Max. Abies alba 7,90 12,00 3,80 7,80 38 50 59 68 Pinus mugo 6,90 8,40 3,80 5,10 25 25 40 43 Pinus nigra 8,40 11,50 6,70 8,20 31 42 56 68 Pinus sylvestris 9,00 11,60 7,80 8,50 36 42 56 59 Quercus petrea 4,10 9,10 3,20 5,10 34 44 41 56 Quercus pubescens 8,40 14,10 8,10 11,50 46 59 63 96
Quercus robur 1,70 2,00 1,90 2,30 24 28 21 37 Fagus sylvatica 8,40 13,60 4,30 8,90 44 53 60 73 Picea abies 8,15 12,00 3,65 7,00 36 44 57 68 Quercus ilex 4,70 5,90 5,50 6,90 29 41 92 99
Table 3. Range of values chosen climate factors according to tree species. Min.-Max. – range between the lowest and the highest value. Ecological niche analysis considering all variables was done using discriminate analysis (DCA). Results show position of chosen tree species population projected in two-dimensional system where every axis is linear combination all four climate factors (Figure 3).
Fig. 3. Frequency distribution according to tree species and chosen climate factors a). Scatter plot canonical values of discriminate analysis b). Results of discriminate analysis show clear segregation of populations according to tree species in two larger groups. First group includes species holm oak (Quercus ilex) and pubescent oak (Quercus pubescens) where discriminatory variable is Root 1. Both species clearly segregate from all others and exactly they define geographical appurtenance to Mediterranean region. Second group composed from all other species can be geographically classified in continental region. Discriminatory axis Root 2 shows clear species segregation from pedunculate oak (Quercus robur), across sessile oak (Quercus petrea) up to mountain pine (Pinus mugo), while fir, beech and spruce overlap considering combination of chosen
climate factors. In Table 4. are presented values of standard coefficients canonical variables that is effect of each individual climate factor on species segregation.
Variables Root 1 Root 2 Root 3 Root 4 Max. Temp. Of Warmest Month -0,94766 1,19337 -1,01995 -0,21000 Min. Temp. of Coldest Month 1,35830 -0,42277 0,38860 0,71913 Prec. Of Driest Month -0,70913 0,03123 -0,75387 0,97859 Prec. Of Wettest Month 0,22764 -0,17788 -0,60883 -1,08279 Eigenvalue 4,88517 0,92261 0,06825 0,00557 Cum.Prop 0,83059 0,98745 0,99905 1,00000
Table 4. Standard coefficients of canonical variables using discriminatory analysis (DCA). Spatial distribution of ecological niche according to chosen climate factors for chosen tree species is shown in Figure 4. Proportion of each individual variable in spatial prediction of ecological niche is presented in Table 5. Maximal temperature of the hottest month in the year has the highest effect in fir (Abies alba) at 46,5 %, in common beech (Fagus sylvatica) 62,4 %, in mountain pine (Pinus mugo) 63,3 % and in pedunculate oak (Quercus robur) at 50,8 %. Minimal temperature of the coldest month has the highest proportion in spatial prediction of pubescent oak (Quercus pubescens) ecological niche at 70,7 % and in holm oak (Quercus ilex) at 72,3 %. Precipitations of the driest month in the year have the highest proportion in spatial prediction Austrian pine (Pinus nigra) ecological niche at 71,7 % and scots pine (Pinus sylvestris) at 44,2 %. Precipitations of the wettest month in year have the highest proportion in prediction pedunculate oak (Quercus robur) ecological niche at 40,7 % and in sessile oak (Quercus petrea) at 40,0 % (Table 5). In spatial model of spruce (Picea abies) ecological niche equal proportion have maximum temperatures of the hottest month (35,6 %) and minimum temperatures of the coldest month (31,6 %) and precipitations of the driest month in the year (26,6 %). According to Table 4. can be seen that proportion of climate factors on spatial prediction ecological niche is equal for species: pubescent oak (Quercus pubescens) and holm oak (Quercus ilex), and for Austrian pine (Pinus nigra) and scots pine (Pinus sylvestris).
Species T_max M. (ºC)
T_min M. (ºC)
Prec. Driest. M. (mm)
Prec. Wettest. M. (mm) AUC
Abies alba 46,2 26,2 21,2 6 0,853 Fagus sylvatica 62,5 20,2 11,8 5,5 0,745 Picea abies 35,6 31,6 26,6 6,3 0,851 Pinus mugo 63,3 34,9 1,2 0,6 0,976 Pinus nigra 3,5 11 71,7 13,8 0,842 Pinus sylvestris 17,5 21,6 44,2 16,6 0,867 Quercus robur 50,8 4,9 3,5 40,7 0,927 Quercus petrea 29,3 23,1 7,6 40 0,800 Quercus ilex 1,1 72,3 23,4 3,2 0,974 Quercus pubescens 4,2 70,7 3,1 22 0,861
Table 5. Relative proportion of each individual climate factor on ecological niche prediction (%). AUC – surface under ROC curve of MAXENT prediction model.
www.intechopen.com
Climate Change and Variability220
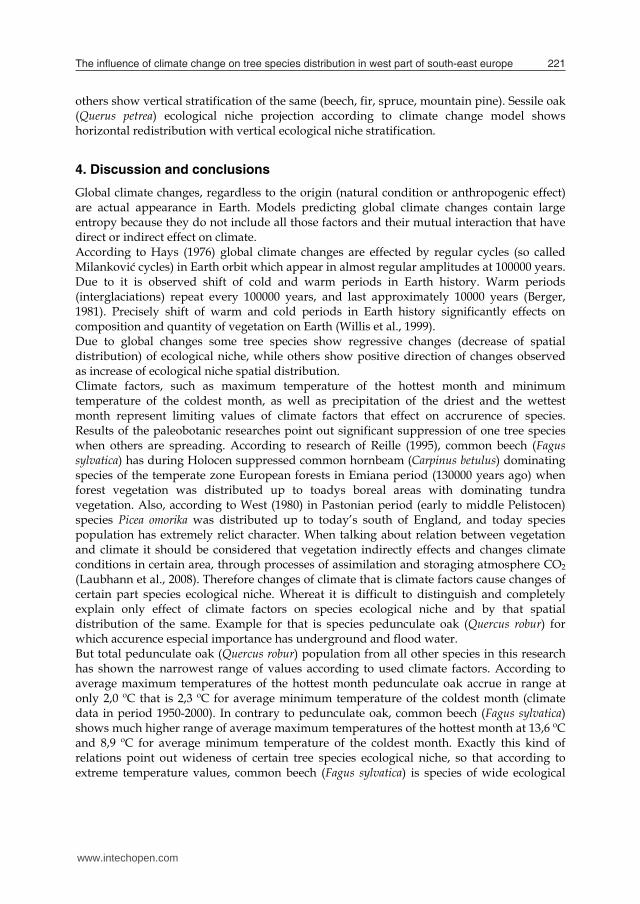
FigavCGligcer Reprocomecochanic
g. 4. Spatial disterage values for
GCM2 for year 20ght green presentrtain tree species.
esults of spatial ojection of the sammon beech (Faological niche spaange model CGCche (pedunculate
tribution of ecolperiod 1950-2000080. Purple colorts lower (closer 0.
distribution ecolame are shown inagus sylvatica), fatial distribution
CM2 for year 2080e oak, pubescent
ogical niche acc0. and prediction r presents higher0), white color pr
logical niche accn Figure 4. Specifir (Abies alba) a models and their0. some species st oak, holm oak,
ording to chosen according global (closer 1) predicresents area out
cording to choseies whose ecologand spruce (Picer projections accoshow spatial redi, Austrian pine a
n climate factorsl climate change ction probability, of ecological nic
en climate factorgical niche overlaea abies). Accordording to global cistribution of ecoand Scots pine),
s with model
, while che for
rs and aps are ing to
climate logical while
others show vertical stratification of the same (beech, fir, spruce, mountain pine). Sessile oak (Querus petrea) ecological niche projection according to climate change model shows horizontal redistribution with vertical ecological niche stratification.
4. Discussion and conclusions
Global climate changes, regardless to the origin (natural condition or anthropogenic effect) are actual appearance in Earth. Models predicting global climate changes contain large entropy because they do not include all those factors and their mutual interaction that have direct or indirect effect on climate. According to Hays (1976) global climate changes are effected by regular cycles (so called Milanković cycles) in Earth orbit which appear in almost regular amplitudes at 100000 years. Due to it is observed shift of cold and warm periods in Earth history. Warm periods (interglaciations) repeat every 100000 years, and last approximately 10000 years (Berger, 1981). Precisely shift of warm and cold periods in Earth history significantly effects on composition and quantity of vegetation on Earth (Willis et al., 1999). Due to global changes some tree species show regressive changes (decrease of spatial distribution) of ecological niche, while others show positive direction of changes observed as increase of ecological niche spatial distribution. Climate factors, such as maximum temperature of the hottest month and minimum temperature of the coldest month, as well as precipitation of the driest and the wettest month represent limiting values of climate factors that effect on accrurence of species. Results of the paleobotanic researches point out significant suppression of one tree species when others are spreading. According to research of Reille (1995), common beech (Fagus sylvatica) has during Holocen suppressed common hornbeam (Carpinus betulus) dominating species of the temperate zone European forests in Emiana period (130000 years ago) when forest vegetation was distributed up to toadys boreal areas with dominating tundra vegetation. Also, according to West (1980) in Pastonian period (early to middle Pelistocen) species Picea omorika was distributed up to today’s south of England, and today species population has extremely relict character. When talking about relation between vegetation and climate it should be considered that vegetation indirectly effects and changes climate conditions in certain area, through processes of assimilation and storaging atmosphere CO2 (Laubhann et al., 2008). Therefore changes of climate that is climate factors cause changes of certain part species ecological niche. Whereat it is difficult to distinguish and completely explain only effect of climate factors on species ecological niche and by that spatial distribution of the same. Example for that is species pedunculate oak (Quercus robur) for which accurence especial importance has underground and flood water. But total pedunculate oak (Quercus robur) population from all other species in this research has shown the narrowest range of values according to used climate factors. According to average maximum temperatures of the hottest month pedunculate oak accrue in range at only 2,0 ºC that is 2,3 ºC for average minimum temperature of the coldest month (climate data in period 1950-2000). In contrary to pedunculate oak, common beech (Fagus sylvatica) shows much higher range of average maximum temperatures of the hottest month at 13,6 ºC and 8,9 ºC for average minimum temperature of the coldest month. Exactly this kind of relations point out wideness of certain tree species ecological niche, so that according to extreme temperature values, common beech (Fagus sylvatica) is species of wide ecological
www.intechopen.com
The inluence of climate change on tree species distribution in west part of south-east europe 221
FigavCGligcer Reprocomecochanic
g. 4. Spatial disterage values for
GCM2 for year 20ght green presentrtain tree species.
esults of spatial ojection of the sammon beech (Faological niche spaange model CGCche (pedunculate
tribution of ecolperiod 1950-2000080. Purple colorts lower (closer 0.
distribution ecolame are shown inagus sylvatica), fatial distribution
CM2 for year 2080e oak, pubescent
ogical niche acc0. and prediction r presents higher0), white color pr
logical niche accn Figure 4. Specifir (Abies alba) a models and their0. some species st oak, holm oak,
ording to chosen according global (closer 1) predicresents area out
cording to choseies whose ecologand spruce (Picer projections accoshow spatial redi, Austrian pine a
n climate factorsl climate change ction probability, of ecological nic
en climate factorgical niche overlaea abies). Accordording to global cistribution of ecoand Scots pine),
s with model
, while che for
rs and aps are ing to
climate logical while
others show vertical stratification of the same (beech, fir, spruce, mountain pine). Sessile oak (Querus petrea) ecological niche projection according to climate change model shows horizontal redistribution with vertical ecological niche stratification.
4. Discussion and conclusions
Global climate changes, regardless to the origin (natural condition or anthropogenic effect) are actual appearance in Earth. Models predicting global climate changes contain large entropy because they do not include all those factors and their mutual interaction that have direct or indirect effect on climate. According to Hays (1976) global climate changes are effected by regular cycles (so called Milanković cycles) in Earth orbit which appear in almost regular amplitudes at 100000 years. Due to it is observed shift of cold and warm periods in Earth history. Warm periods (interglaciations) repeat every 100000 years, and last approximately 10000 years (Berger, 1981). Precisely shift of warm and cold periods in Earth history significantly effects on composition and quantity of vegetation on Earth (Willis et al., 1999). Due to global changes some tree species show regressive changes (decrease of spatial distribution) of ecological niche, while others show positive direction of changes observed as increase of ecological niche spatial distribution. Climate factors, such as maximum temperature of the hottest month and minimum temperature of the coldest month, as well as precipitation of the driest and the wettest month represent limiting values of climate factors that effect on accrurence of species. Results of the paleobotanic researches point out significant suppression of one tree species when others are spreading. According to research of Reille (1995), common beech (Fagus sylvatica) has during Holocen suppressed common hornbeam (Carpinus betulus) dominating species of the temperate zone European forests in Emiana period (130000 years ago) when forest vegetation was distributed up to toadys boreal areas with dominating tundra vegetation. Also, according to West (1980) in Pastonian period (early to middle Pelistocen) species Picea omorika was distributed up to today’s south of England, and today species population has extremely relict character. When talking about relation between vegetation and climate it should be considered that vegetation indirectly effects and changes climate conditions in certain area, through processes of assimilation and storaging atmosphere CO2 (Laubhann et al., 2008). Therefore changes of climate that is climate factors cause changes of certain part species ecological niche. Whereat it is difficult to distinguish and completely explain only effect of climate factors on species ecological niche and by that spatial distribution of the same. Example for that is species pedunculate oak (Quercus robur) for which accurence especial importance has underground and flood water. But total pedunculate oak (Quercus robur) population from all other species in this research has shown the narrowest range of values according to used climate factors. According to average maximum temperatures of the hottest month pedunculate oak accrue in range at only 2,0 ºC that is 2,3 ºC for average minimum temperature of the coldest month (climate data in period 1950-2000). In contrary to pedunculate oak, common beech (Fagus sylvatica) shows much higher range of average maximum temperatures of the hottest month at 13,6 ºC and 8,9 ºC for average minimum temperature of the coldest month. Exactly this kind of relations point out wideness of certain tree species ecological niche, so that according to extreme temperature values, common beech (Fagus sylvatica) is species of wide ecological
www.intechopen.com

Climate Change and Variability222
range. Alongside common beech (Fagus sylvatica) species of wide ecological range according to average maximum temperatures are spruce (Picea abies), fir (Abies alba), sessile oak (Quercus petrea), pubescent oak (Quercus pubescens), Austrian pine (Pinus nigra) and scots pine (Pinus sylvestris). According to the average temperatures of the coldest month value range is narrower than by average temperature of the hottest month. Considering precipitation quantities, pedunculate oak (Quercus robur) also shows the narrowest range towards precipitation quantities of the driest and the wettest month from 28 mm to 37 mm. The widest precipitation quantity range in the driest month shows common beech (Fagus sylvatica) at 53 mm and pubescent oak (Quercus pubescens) at 59 mm. The highest population range considering precipitation quantity in the wettest month shows holm oak (Quercus ilex) at 99 mm arriving in the most exothermic conditions in contrary to all other species. Exactly statement about exothermion of species should be observed from the aspect of precipitation distribution all over the year, and not only in average values. According to global climate change model average maximum temperatures of the hottest month will increase in average for 6,9 ºC, and average temperature of the coldest month for 2,0 ºC. Increase of the average annual air temperature in territory of Republic Croatia that in 20 century had value from +0,02 ºC in 10 years in Gospić to +0,07 ºC in 10 years in Zagreb, has continued and strengthened in begging of the 21 century. From 2004 decade trends have been between 0,04 ºC to 0,08 ºC, and till 2008 between 0,05 ºC up to 0,10 ºC. Positive trend, present on all territory of Croatia, from beginning of analysed period became especially expressed in last 50 years and even more in last 25 years. Trends of average annual air temperature in 108-year period statistically are significant for all stations besides Osijek, and in last 50 that is 25 years for all analyzed stations. Trend of the annual precipitation quantities shows decrease during 20 century on all territory of Croatia analogous to tendency of dryness in Mediterranean. Decrease is more evident in Adria (Crikvenica:-1,8 % in 10 years, statistically significant and Hvar: -1,2% in 10 year), than in upper land (mountain region-Gospić:-0,8 ºC in 10 years, east Slavonija, Osijek:-1,3 % in 10 years, northwest Croatia, Zagreb-Grič:-0,3 % in 10 years). Observed increasing trend of dry days in Croatia raises question about frequency successive dry days. Variation of dry periods are determined analysing data from period 1961-2000 from 25 meteorological stations that evenly cover main climate zones in Croatia (continental, mountain and maritime). Dominant increase of dry periods in Adria and low expressed trend in continental area contributes that Croatia stays in transitional area between general tendency of precipitation increase in north Europe and decrease in Mediterranean (Fifth national report Republic of Croatia according to Framework convention UN on climate change; UNFCCC, 2009). Range of temperature values and precipitation quantities for certain species points out importance of climate factors on species arrival. Researches of climate factors effect on certain species ecological niche give essential knowledge’s about relation of vegetation, on species level, towards environment especially climate. Former understanding of distinctly high importance of different water forms (underground, flooded and stagnating) on pedunculate oak accruence should be considered in synergy with climate factors, especially temperature. Forest ecosystems in present time are subjected to changes, whether that they are caused by natural variability or by human activity. Consideration of total synergy all ecological factors on accruence certain tree species represents one of the main segments in researching and understanding how forest vegetation functions. Prognoses of climate change models should
be taken with certain precaution and with different possible outcomes. Ecological niche modelling and understanding relations prevail between vegetation and ecological factors, especially climate, should be observed on level of entire species population. However, it should be considered possible spatial parts of the population that during evolution have appated to local climate conditions and their ecological niche differ from other population parts (ecotypes). In that case certainly that future researches relations between climate and vegetation have to include and genetic variability within same species. Further researches in ecological niche modelling for wood species find application in vegetation and forest ecosystems charting and in analysing interaction between vegetation and ecological factors. More qualitative spatial models in future should be developed and improved with proportion of species in total mixture as depended variable at ecological factors and detail pale botanic researches. Assumed climate changes can lead to changes in spatial distribution of forest vegetation manifested in abundance of current forest types, possible decay of existing or appearance of new types, changing abundance of certain tree species populations, productivity of forest ecosystems, ecological stability and forest health status as well as in changing total productive and forest function of general benefit.
5. References
Hijmans, R.J.; S.E. Cameron, J.L. Parra, P.G. Jones and A. Jarvis, (2005). Very high resolution interpolated climate surfaces for global land areas. International Journal of Climatology, 25: 1965-1978.
Hutchinson, G.E. (1957) The multivariate niche. Cold Spr. Harb. Symp. Quant. Biol. 22, 415–421. Willis, K. J., A. Kleczkowski, S. J. Crowhurst, 1999: 124,000-year periodicity in terrestrial
vegetation change during the late Pliocene epoch. Nature 397: 685 – 688. Willis, K. J., 1994: The Vegetational History oh The Balkans. Quaternary Science Reviews, 13:
769 – 788. Dansgaard, W., H. B. Clausen, N. Gundestrup, C. U. Hammer, S. F. Johnsen, P. M. Kristinsdottir,
N. Reeh, 1982: A New Greenland Deep Ice Core. Science, 218: 1273 – 1277. Wick, L., W. Tinner, 1997: Vegetation changes and timberline fluctuations in the central airs as
indicators of Holocene climatic oscillations. Arctic and Alpine Research, 29: 445 – 458. Magnya, M., C. Bégeot, J. Guiot, O. Peyron, 2003: Contrasting patterns of hydrological changes in
Europe in response to Holocene climate cooling phases. Quaternary Science Reviews, 22: 1589–1596.
Davis, B. A. S., S. Brewerb, A. C. Stevensona, J. Guiotc, Data Contributors, 2003: The temperature of Europe during the Holocene reconstructed from pollen data. Quaternary Science Reviews, 22: 1701 – 1716.
Högberg, P., 2007: Enviromental science: Nitrogen imapcts on forest carbon. Nature, 447: 781 – 782.
Hasselmann, K., 1997: Climate-change research after Kyoto. Nature, 390, 225 – 226. Loutre, M. F., 2003: Clues from MIS 11 to predict the future climate: a modeling point of view.
Earth and Planetary Science Letters. Earth Planetary Science Letter 212: 213 – 224. West, R. G., 1980: Pleistocene forest history in East Anglia. New Phytologist 85: 571 – 622.
www.intechopen.com

The inluence of climate change on tree species distribution in west part of south-east europe 223
range. Alongside common beech (Fagus sylvatica) species of wide ecological range according to average maximum temperatures are spruce (Picea abies), fir (Abies alba), sessile oak (Quercus petrea), pubescent oak (Quercus pubescens), Austrian pine (Pinus nigra) and scots pine (Pinus sylvestris). According to the average temperatures of the coldest month value range is narrower than by average temperature of the hottest month. Considering precipitation quantities, pedunculate oak (Quercus robur) also shows the narrowest range towards precipitation quantities of the driest and the wettest month from 28 mm to 37 mm. The widest precipitation quantity range in the driest month shows common beech (Fagus sylvatica) at 53 mm and pubescent oak (Quercus pubescens) at 59 mm. The highest population range considering precipitation quantity in the wettest month shows holm oak (Quercus ilex) at 99 mm arriving in the most exothermic conditions in contrary to all other species. Exactly statement about exothermion of species should be observed from the aspect of precipitation distribution all over the year, and not only in average values. According to global climate change model average maximum temperatures of the hottest month will increase in average for 6,9 ºC, and average temperature of the coldest month for 2,0 ºC. Increase of the average annual air temperature in territory of Republic Croatia that in 20 century had value from +0,02 ºC in 10 years in Gospić to +0,07 ºC in 10 years in Zagreb, has continued and strengthened in begging of the 21 century. From 2004 decade trends have been between 0,04 ºC to 0,08 ºC, and till 2008 between 0,05 ºC up to 0,10 ºC. Positive trend, present on all territory of Croatia, from beginning of analysed period became especially expressed in last 50 years and even more in last 25 years. Trends of average annual air temperature in 108-year period statistically are significant for all stations besides Osijek, and in last 50 that is 25 years for all analyzed stations. Trend of the annual precipitation quantities shows decrease during 20 century on all territory of Croatia analogous to tendency of dryness in Mediterranean. Decrease is more evident in Adria (Crikvenica:-1,8 % in 10 years, statistically significant and Hvar: -1,2% in 10 year), than in upper land (mountain region-Gospić:-0,8 ºC in 10 years, east Slavonija, Osijek:-1,3 % in 10 years, northwest Croatia, Zagreb-Grič:-0,3 % in 10 years). Observed increasing trend of dry days in Croatia raises question about frequency successive dry days. Variation of dry periods are determined analysing data from period 1961-2000 from 25 meteorological stations that evenly cover main climate zones in Croatia (continental, mountain and maritime). Dominant increase of dry periods in Adria and low expressed trend in continental area contributes that Croatia stays in transitional area between general tendency of precipitation increase in north Europe and decrease in Mediterranean (Fifth national report Republic of Croatia according to Framework convention UN on climate change; UNFCCC, 2009). Range of temperature values and precipitation quantities for certain species points out importance of climate factors on species arrival. Researches of climate factors effect on certain species ecological niche give essential knowledge’s about relation of vegetation, on species level, towards environment especially climate. Former understanding of distinctly high importance of different water forms (underground, flooded and stagnating) on pedunculate oak accruence should be considered in synergy with climate factors, especially temperature. Forest ecosystems in present time are subjected to changes, whether that they are caused by natural variability or by human activity. Consideration of total synergy all ecological factors on accruence certain tree species represents one of the main segments in researching and understanding how forest vegetation functions. Prognoses of climate change models should
be taken with certain precaution and with different possible outcomes. Ecological niche modelling and understanding relations prevail between vegetation and ecological factors, especially climate, should be observed on level of entire species population. However, it should be considered possible spatial parts of the population that during evolution have appated to local climate conditions and their ecological niche differ from other population parts (ecotypes). In that case certainly that future researches relations between climate and vegetation have to include and genetic variability within same species. Further researches in ecological niche modelling for wood species find application in vegetation and forest ecosystems charting and in analysing interaction between vegetation and ecological factors. More qualitative spatial models in future should be developed and improved with proportion of species in total mixture as depended variable at ecological factors and detail pale botanic researches. Assumed climate changes can lead to changes in spatial distribution of forest vegetation manifested in abundance of current forest types, possible decay of existing or appearance of new types, changing abundance of certain tree species populations, productivity of forest ecosystems, ecological stability and forest health status as well as in changing total productive and forest function of general benefit.
5. References
Hijmans, R.J.; S.E. Cameron, J.L. Parra, P.G. Jones and A. Jarvis, (2005). Very high resolution interpolated climate surfaces for global land areas. International Journal of Climatology, 25: 1965-1978.
Hutchinson, G.E. (1957) The multivariate niche. Cold Spr. Harb. Symp. Quant. Biol. 22, 415–421. Willis, K. J., A. Kleczkowski, S. J. Crowhurst, 1999: 124,000-year periodicity in terrestrial
vegetation change during the late Pliocene epoch. Nature 397: 685 – 688. Willis, K. J., 1994: The Vegetational History oh The Balkans. Quaternary Science Reviews, 13:
769 – 788. Dansgaard, W., H. B. Clausen, N. Gundestrup, C. U. Hammer, S. F. Johnsen, P. M. Kristinsdottir,
N. Reeh, 1982: A New Greenland Deep Ice Core. Science, 218: 1273 – 1277. Wick, L., W. Tinner, 1997: Vegetation changes and timberline fluctuations in the central airs as
indicators of Holocene climatic oscillations. Arctic and Alpine Research, 29: 445 – 458. Magnya, M., C. Bégeot, J. Guiot, O. Peyron, 2003: Contrasting patterns of hydrological changes in
Europe in response to Holocene climate cooling phases. Quaternary Science Reviews, 22: 1589–1596.
Davis, B. A. S., S. Brewerb, A. C. Stevensona, J. Guiotc, Data Contributors, 2003: The temperature of Europe during the Holocene reconstructed from pollen data. Quaternary Science Reviews, 22: 1701 – 1716.
Högberg, P., 2007: Enviromental science: Nitrogen imapcts on forest carbon. Nature, 447: 781 – 782.
Hasselmann, K., 1997: Climate-change research after Kyoto. Nature, 390, 225 – 226. Loutre, M. F., 2003: Clues from MIS 11 to predict the future climate: a modeling point of view.
Earth and Planetary Science Letters. Earth Planetary Science Letter 212: 213 – 224. West, R. G., 1980: Pleistocene forest history in East Anglia. New Phytologist 85: 571 – 622.
www.intechopen.com

Climate Change and Variability224
Phillips, S. J.,M. Dudík, R. E. Schapire. 2004: A maximum entropy approach to species distribution modeling. In Proceedings of the Twenty-First International Conference on Machine Learning, pages 655-662.
Phillips, S. J., R. P. Anderson, R. E. Schapire. 2006: Maximum entropy modeling of species geographic distributions. Ecological Modelling, 190: 231-259.
Hays, J., J. Imbrie, N. Shackleton, 1976: Variations in the Earth's Orbit: Pacemaker of the Ice Ages. Science 194: 1121.
Berger, A. L., 1981: The astronomical theory of paleoclimates. Climatic variations: facts and theories (ur. A. L. Berger), str. 501 – 525, Reidel, Dordrecht.
Reille, M., J. L. de Beaulieu, 1995: Pollen analysis of a long upper Pleistocene continental sequence in a Velay maar (Massif Central, France). Quaternary Research, 44: 205 – 215.
Laubhann, D., H. Sterba, G. J. Reinds, D. W. Vries, 2008: The impact of atmospheris and climate on growth in Europe monitoring plots: An individual growth model. Forest Ecology and Management. In Press.
Gent, P.R. and J.C. McWilliams, 1990: Isopycnal Mixing in Ocean Circulation Models. J. Phys. Oceanogr., 20, 150-155.
Flato, G.M. and Hibler, W.D. III, 1992: Modelling Pack Ice as a Cavitating Fluid. J. Phys. Oceanogr., 22, 626-651.
Kirigin, B., 1975: Kolebanja klimatskih elemenata i sušenje jele na području SR Hrvatske. Radovi, 23: 16-27.
Drugo, treće i četvrto nacionalno izvješće Republike Hrvatske prema Okvirnoj konvenciji Ujedinjenih naroda o promjeni klime (UNFCCC). Ministarstvo zaštite okoliša, prostornog uređenja i graditeljstva, Zagreb. Studeni 2006, str. 96.
www.intechopen.com
Climate Change and VariabilityEdited by Suzanne Simard
ISBN 978-953-307-144-2Hard cover, 486 pagesPublisher SciyoPublished online 17, August, 2010Published in print edition August, 2010
InTech EuropeUniversity Campus STeP Ri Slavka Krautzeka 83/A 51000 Rijeka, Croatia Phone: +385 (51) 770 447 Fax: +385 (51) 686 166www.intechopen.com
InTech ChinaUnit 405, Office Block, Hotel Equatorial Shanghai No.65, Yan An Road (West), Shanghai, 200040, China
Phone: +86-21-62489820 Fax: +86-21-62489821
Climate change is emerging as one of the most important issues of our time, with the potential to causeprofound cascading effects on ecosystems and society. However, these effects are poorly understood and ourprojections for climate change trends and effects have thus far proven to be inaccurate. In this collection of 24chapters, we present a cross-section of some of the most challenging issues related to oceans, lakes, forests,and agricultural systems under a changing climate. The authors present evidence for changes and variabilityin climatic and atmospheric conditions, investigate some the impacts that climate change is having on theEarth's ecological and social systems, and provide novel ideas, advances and applications for mitigation andadaptation of our socio-ecological systems to climate change. Difficult questions are asked. What have beensome of the impacts of climate change on our natural and managed ecosystems? How do we manage forresilient socio-ecological systems? How do we predict the future? What are relevant climatic change andmanagement scenarios? How can we shape management regimes to increase our adaptive capacity toclimate change? These themes are visited across broad spatial and temporal scales, touch on important andrelevant ecological patterns and processes, and represent broad geographic regions, from the tropics, totemperate and boreal regions, to the Arctic.
How to referenceIn order to correctly reference this scholarly work, feel free to copy and paste the following:
Joso Vukelić, Sead Vojnikovic, Damir Ugarkovic, Darko Bakšić and Stjepan Mikac (2010). The Influence ofClimate Change on Tree Species Distirbution in South-East Europe, Climate Change and Variability, SuzanneSimard (Ed.), ISBN: 978-953-307-144-2, InTech, Available from: http://www.intechopen.com/books/climate-change-and-variability/the-influence-of-climate-change-on-tree-species-distirbution-in-south-east-europe

© 2010 The Author(s). Licensee IntechOpen. This chapter is distributedunder the terms of the Creative Commons Attribution-NonCommercial-ShareAlike-3.0 License, which permits use, distribution and reproduction fornon-commercial purposes, provided the original is properly cited andderivative works building on this content are distributed under the samelicense.