the importance of ostroms's design principles: youth group
TRANSCRIPT

Norw
egia
n U
niv
ersity
of L
ife S
cience
s (NM
BU
)
The importance of Ostroms's design principles: Youth group performance in Northern Ethiopia
Stein T. Holden, and Mesfin Tilahun
Centre for Land Tenure Studies Working Paper 2/17

THE IMPORTANCE OF OSTROM’S DESIGN PRINCIPLES:
YOUTH GROUP PERFORMANCE IN NORTHERN ETHIOPIA1
By
STEIN T. HOLDEN1 and MESFIN TILAHUN1,2 1School of Economics and Business/Centre for Land Tenure Studies, Norwegian University of
Life Sciences, P. O. Box 5003, 1432 Ås, Norway. 2Mekelle University, Department of Economics, P.O.Box 451, Mekelle, Ethiopia.
Emails: [email protected]; [email protected]
Abstract
Youth unemployment and migration are growing challenges that need more political attention in
many countries, particularly countries with rapid population growth and economic
transformation. Proactively mobilizing the youth as a resource in the creation of sustainable
livelihoods can potentially be a win-win-win solution that Ethiopia is currently attempting with its
new youth employment strategy of allocating rehabilitated communal lands to youth groups. This
study investigates the extent to which Ostrom’s Design Principles (DPs) are adhered to and matter
for the early performance of youth groups in terms of their stability, trust and overall performance.
We find a high degree of compliance with the Design Principles. From sets of seven DP versus six
performance indicators 14 relations were significant and with a sign consistent with the DPs
enhancing performance. Three relations were significant but with opposite sign. Some of the DPs
appeared more important for early performance of the youth groups. The Ethiopian youth group
approach to mobilize landless and unemployed youth is promising and should be tested elsewhere.
Further research is needed too on the Ethiopian model as it is still at an early stage of testing as
most groups are less than five years old.
Key Words: Youth; youth groups; common pool resource management, environmental
custodians; collective action; business model; group performance.
JEL codes: Q15; Q23.
1 Data collection has been funded by the research fund of the fist author and the NORAD-funded “Climate-Smart Natural Resource
Management and Policy” project that is a collaborative research and capacity-building program between the School of Economics
and Business at Norwegian University of Life Sciences, Mekelle University, Tigray, and LUANAR in Malawi. We have received
valuable comments to an earlier version of this paper from Erling Berge. All remaining errors remain the authors’ responsibility.


2
1. Introduction
Elinor Ostrom received the Nobel Prize in economics for her contributions to the understanding of
collective action related to natural resource management. Her Design Principles (DP)2 were listed in her
book (Ostrom 1990). These conditions for successful collective action to secure sustainable management
of natural resources were derived based on assessment of a large number of studies. The DPs were used to
characterize commons that had been managed in a sustainable way over a long time. However, this triggers
the question of how and when the DPs were adopted in the first place? Was there a natural evolution with
a specific sequencing in of the DPs or did many of them have to come at the same time to establish the
stable equilibrium? Context may also matter for which DPs are more important?
Agrawal (2001) discusses the contributions of Ostrom (1990) and relate them to other milestone
contributions in the common pool resource (CPR) literature; Wade (1988) and Baland and Platteau (1996);
by highlighting the complexity of causal relationships, data limitations and the methodological challenges
for expanding our understanding of the issues. Ostrom (1990) was a meta-analysis based on case studies
conducted by other scholars. Baland and Platteau (1996) built on a wider literature review of property rights
issues. Wade (1988) built his analysis on studies in 31 villages in Southern India. Most studies of CPR
management have been case studies (small N studies) and there have been few large N studies that have
tested the relative importance of the different DPs (Poteete et al. 2008).
In this study, we assess the role of Ostrom’s DPs in the early success of youth groups that have been
established through a large-scale intervention that may be seen as a social experiment in form of state-
community agreements orchestrated in the Tigray Regional State in northern Ethiopia. The purpose of this
intervention is to create sustainable livelihoods for landless youth. Most groups are allocated a common
pool resource3 of rehabilitated communal land that they are given the responsibility to protect while they at
the same time are allowed to establish a production activity that can be their source of livelihood. Such
activities include beekeeping, keeping of livestock, planting of forestry trees or fruit trees, planting of
vegetables and use of irrigation.
2 She defined a Design Principle as “an essential element or condition that helps to account for the success of
institutions in sustaining the CPRs and gaining the compliance of generation after generation of appropriators to the
rules in use” (Ostrom 1990, p. 90). She has also commented: “The term “design principle” has confused many readers.
Perhaps I should have used the term “best practices” to describe the rules and structure of robust institutions.” (Ostrom
2010, p. 653, footnote 5)
3 A common pool resource is a natural or man-made resource whose yield is subtractable and whose exclusion is non-
trivial but not necessarily impossible (Ostrom et al. 1992).

Each group is formalized as a primary cooperative under the cooperative law. They have to self-organize
with an own board of five members and develop their own bylaw, develop a business plan and are subject
to regular auditing. Our study assesses the role of Ostrom’s DPs in enhancing the success of these newly
established youth CPR businesses.
Our study is a large N study and consists of a census of 742 such youth groups in five districts in Tigray.
The average group size is 20 and the group size varies from less than ten to more than hundred members in
a group. Our study therefore covers close to 15000 youth organized into groups over the period 2011-2015.
One basic question is whether allocation of rehabilitated forests and grazing lands to youth groups has a
high risk of ending as a “Tragedy of the Commons” (Hardin 1968) or whether such groups have a high
probability of being able to cooperate and establish sustainable livelihoods more in line with the DPs of
Elinor Ostrom (1990; 2008)4. More specifically, can the degree of adherence to the DPs be important for
their degree of early success? And, can some of the DPs and the extent to which they have been adhered to
(de jure and de facto) more closely be correlated with indicators of early success or indicators that groups
have specific problems such as facing problems with disputes, cooperation problems or internal trust
problems? We use indicators of share of initial group members still staying in the group at the time of the
survey, group cooperation (ranked by group leader), group trust (ranked by group leader), own assessment
of performance (ranked by group leader), Youth Association assessment of performance, and income from
joint activity per member as early performance indicators. With these indicators, we try to answer the
following research questions: Can (some of) the DPs prevent or reduce the probability that groups get into
problems such as conflicts or cooperation problems? Ostrom emphasized that the DPs should not be used
as a blueprint for success. But can they still be used to increase the probability of success when starting
new common property regimes? Or can some of them be used and which ones are of higher importance?
We provide new insights about these complex issues based on our study.
One of the difficulties of establishing causality in the relationship between the DPs and performance based
on survey data is that adherence to the DPs can be highly endogenous and a result of long-term institutional
refinement and adjustment in complex systems. The advantage of our study is that the formation of the
youth groups we study is very recent and a kind of social experiment where the variation in choices made
by the youth groups themselves in formulation of their own bylaws are more of a random nature. Our data
4 In this study we do not aim to study the effect on natural resource management. This will be one of the focuses of or
future research.

therefore lends itself to causal analysis to a larger extent than usually is the case for endogenous institutional
arrangements that have developed over longer periods of time and where other tools may be required
(Ostrom and Basurto 2011).
In light of the growing challenge of youth landlessness and youth unemployment it is also of high interest
to know whether the approach used is a good way to kick-start youth entrepreneurship by giving youth
groups a joint responsibility for environmental stewardship and livelihood opportunity through self-
organization? The answer is of high interest to policy makers aiming to establish better resource
management and create opportunities for youth.
Our findings indicate that the groups conform quite closely to Ostrom’s DPs and are mostly satisfied with
their own performance.
2. Theoretical framework: Ostrom’s Design Principles
An overview of the Design Principles is presented in Table 1. Ostrom (1990) emphasized that the DPs
should not be applied as a blueprint to be imposed on resource management regimes. However, they are
considered to synthesize core factors that enhance the long-term survival of institutions developed by
resource users (Ostrom 2010, p. 13). Cox et al. (2009) analyzed over 100 studies by scholars and found that
two-thirds of the studies confirm that robust systems are characterized by most of the DPs while those that
are not robust do not follow the DPs.
Some of the DPs may also be seen as a combination of two principles. Ostrom (2010) acknowledges that
some of the DPs in the 1990 book were too general and split three of them in two separate principles, each
based on the proposal of Cox et al. (2009). E.g., DP1 in Table 1 can be seen as both a demarcation of a
physical area and a group of members. DP2 can also be seen as a combination of two principles; the
matching of restrictions and resources on the one hand, and provision and appropriation rules on the other
(Agrawal 2001). Similarly, DP4 can be seen as two types of monitoring; monitoring of resources and
monitoring of users (Agrawal 2001; Cox et al. 2009; Ostrom 2010).
Empirical research has shown that trust has an important role to play to enhance cooperation in groups
(Rothstein 2005; Ostrom 2010). Communication and reputation play important roles in the process of
assessment of trustworthiness and development of trust (Poteete et al. 2010; Ostrom 2010).

Table 1. Ostrom’s Design Principles (DPs). DP
No
Short name Explanation
1 Clearly defined
borders
Individuals with rights to the common pool resource (CPR) must be clearly
defined and the same applies to the borders of the CPR
Ostrom (2010): 1a. User boundaries, 1b. Resource boundaries
2 Matching
appropriation and
provision rules
There must be a balance between appropriation rules (benefit sharing
rules), provision rules (required contributions by group members) and this
must match the CPR
Ostrom (2010): 2a. Congruence with local conditions, 2b. Appropriation
and provision
3 Collective choice
arrangements
There must be an inclusive decision-making process related to adjustment
of rules for CPR utilization and management
4 Monitoring There must be an accountable monitoring system in place that monitors the
CPR management and ensures its protection
Ostrom (2010): 4a. Monitoring users, 4b. Monitoring the resource.
5 Graduated
sanctions
Appropriators who violate the rules for CPR management or extraction face
graduated sanctions depending on the seriousness of the violation or
repetition of violations
6 Conflict resolution
mechanism
Appropriators have a good and efficient (low-cost) system for conflict
resolution among themselves or between appropriators and outsiders
7 Recognized rights
to organize
Government bodies allow groups to self-organize by forming own internal
rules of conduct
8 Nested enterprises Appropriation, provision, monitoring, enforcement, conflict resolution, and
government activities are organized in multiple layers of nested enterprises Sources: Ostrom (1990; 2010).
Sanctioning mechanisms and willingness to sanction others may indicate something about the robustness
of groups to internal threats. Sanctioning mechanisms may serve as a threat and do not necessarily have to
be violated to have a positive effect.
We will now go ahead and assess the extent to which the recently formed youth groups in Tigray that we
have surveyed conform with the Design Principles of Ostrom. We then assess how the degree of adherence
the DPs is correlated with or affecting the performance of the youth groups. The extent to which the DPs
can be stated as quasi-experimental initial settings for they youth groups we may argue for a causal
relationship. However, this requires critical assessment for each of the DPs based on how they are measured.
We go through the DPs one by one but first we give an overview of our data.
3. Data
We have carried out a census of 742 youth groups in five districts in Tigray region of Ethiopia in 2016. A
structured questionnaire was used to interview the chairperson of each youth group. The districts included
in the study were Adwa, Degua Tembien, Kilite Awlalo, Raya Azabo and Seharti Samre. Table 2 gives an
overview of the distribution of youth groups across these districts by main activity of the groups.

Table 2. The distribution of youth groups by district and main activity Raya
Azebo
Degua
Tembien
Seharti
Samre
Kilite
Awlalo
Adwa Total
Animal rearing 47 17 24 1 51 140
Beekeeping 6 32 27 11 83 159
Forest 3 3 2 0 34 42
Irrigation/Horticulture 34 19 19 4 20 96
Mining 110 2 29 145 9 295
Other 1 0 8 0 1 10
Total 201 73 109 161 198 742 Source: Own census data.
Table 3. Distribution of key performance indicators
Is poor cooperation in the group affecting the performance of the activities?
Variable code Response Freq. Percent Cum.
1 Yes, very much 150 20.35 20.35
2 To some extent 92 12.48 32.84
3 No such problem 495 67.16 100.00 Total 737 100.00
How do you rate the trust among the group members overall?
Variable code Response Freq. Percent Cum.
1 Very high 402 54.25 54.25
2 Quite high 306 41.30 95.55
3 Ok 18 2.43 97.98
4 Not so good 12 1.62 99.60
5 Very poor 3 0.40 100.00 Total 741 100.00
How do you rate the performance of your group?
Variable code Response Freq. Percent Cum.
1 Very good 259 34.95 34.95
2 Good 287 38.73 73.68
3 Average 138 18.62 92.31
4 Below average 40 5.4 97.71
5 Poor performance 17 2.29 100.00
Total 741 100.00
How is the group rated by the Youth Association?
Variable code Response Freq. Percent Cum.
1 Very good 83 11.22 11.22
2 Good 307 41.49 52.7
3 Average 295 39.86 92.57
4 Below average 37 5.00 97.57
5 Poor performance 18 2.43 100.00
Total 740 100.00
Source: Own census data.

The performance indicators also include the member share of the initial group members that still stayed in
the group at the time of our survey (2016) and income per group member. Figure 1 shows the distribution
of the member share staying in the groups at the time of our survey from those initially joining the group.
Table 4 gives an overview of incomes by group production activity.
FUIGURES
Figure 1. Kernel density distribution for the share of initial group members remaining in 2016.
Table 4. Income per member from youth group activity by type of activity in 2015.
Main group activities Mean income St. Error N
Animal rearing 1362.3 389.7 139
Beekeeping 295.3 36.9 157
Forest 68.1 20.1 42
Irrigation/Horticulture 945.7 204.3 95
Mining 1696.1 195.4 292
Other 7363.2 3614.6 9
Total 1212.5 122.8 734 Source: Own census data. Income in Ethiopian Birr

Table 5 gives an overview of additional variables included as controls in the performance related models.
Some of these can be endogenous in nature and require cautious treatment.
Table 5. Summary statistics for control variables Variable Obs Mean Std. Dev. Min Max
Establishment year & month 742 2014.4 1.584 2003.8 2016.2
Initial member number 742 19.542 16.168 2.0 193
Female share at start of group 742 0.344 0.204 0.0 1.0
Gender of group leader, 1=Female 740 0.112 0.316 0.0 1.0
Distance to road, km 734 2.411 2.653 0.0 30.0
Distance to market, km 735 8.500 5.837 0.1 36.0
Distance to home, min. km 735 1.453 1.369 0.0 12.0
Input access problems, dummy 742 0.662 0.473 0.0 1.0
Area allocated per person in group, ha 737 0.190 0.235 0.0 2.0
Number of returning migrants 742 1.124 3.770 0.0 70.0
Self-selection of group members, dummy 742 0.805 0.397 0.0 1.0
Change in key group positions, dummy 742 0.272 0.445 0.0 1.0
Source: Own census data.
4. Adherence to Ostrom’s Design Principles
We provide a summary of findings from the descriptive analysis of this here. The details are found in the
Appendix.
Ostrom’s DP 1: Clearly defined borders
Regarding protection of the allocated land area we found that less than 6% of the youth groups experience
illegal harvesting on their land more frequently than monthly and only 1.1% experience it more frequently
than weekly. This shows that illegal harvesting is not a big problem. Most youth groups have a guarding
system and we can conclude that the resource base of the youth is well protected from extraction by
outsiders. Membership of the groups is also clearly identified although group members may cooperate with
their family in various ways in relation to their group activities and responsibilities.
Ostrom’s DP 2: Sharing of benefits and costs/congruence between appropriation rules and provision
rules

97.6% of the groups have a bylaw that regulates the sharing of responsibilities and incomes from the group
activities. Equal sharing of income is the rule for 98.7% of the youth groups. The work responsibilities are
shared equally in 56.7% of the groups only, as female members are allowed to do less of the heavy
bodywork than males in the remaining groups but they still get an equal share of the benefits.
Ostrom’s DP 3: Joint decision-making system
As a primary cooperative, the groups have to establish themselves with a chairperson, vice chairperson, a
secretary, an accountant and a treasury. 95.8% of the youth groups stated to have their own written bylaw.
92.2% of the groups have penalties for non-participation in the group meetings. There are graduated
sanctions against non-participation as well as late arrival to meetings. Moreover, these sanctions have been
enforced. Monetary sanctions are most common (86% of the sanctions). 43.6% of the groups had members
that had been penalized for absence from meetings and 36.9% of the groups had members that had been
penalized for late arrival to meetings. It is very clear that group membership implies strong participation
obligations. Close to 68% of the groups have meetings at least biweekly. When asked about influence in
decision-making about 71% of the group leaders state that all members are equally influential while 26%
state that the elected group of five are more influential. Male dominance is not stated to be strong among
the group leaders (who mostly are males).
Ostrom’ DP 4: Internal monitoring system
As seen above there is a system with frequent meetings and punishments for non-participation and late
arrival. This implies one form of internal monitoring related to decision-making. In addition, we assess
whether there is a monitoring system for not coming to the work activities of the group and for late coming
to such group work activities. 92.6% of the groups have bylaw stipulating penalties for not coming to group
work activities. 26.1% of the groups have members that have been punished for not coming to group work
activities. 79.9% of the groups have bylaws stipulating penalties for late coming to group work activities
and 21.7% of the youth groups have punished some members for late arrival to group work activities.
Ostrom’s DP 5: Graduated sanctions
We found that groups that have bylaws related to participation in and late arrival to group meetings and
work activities commonly used monetary and non-monetary sanctions. The non-monetary sanctions varied
from simple warnings, to “last warning”, dismissal from the group, and having to work extra for the group
as punishment. The monetary penalties were in most cases increasing with the number of violations but
were in fewer cases the same amount regardless whether the violation was the first, second or third time.
Some had a mixture of non-monetary and monetary sanctions. Another common practice was to give a
monetary sanction the first two times and then dismissal the third time. There were also mixed penalties
such as combinations of monetary and additional work obligations or a monetary sanction combined with
last warning. There were also a lot of variation in the monetary amounts that had to be paid across groups
and the variation from first to second and third violation by the same person. It was the rule rather than the
exception to have bylaws with penalties for violations (80-93% of the groups), while 51-82% of all groups
had graduated sanctions for the four types of violations.
Ostrom’s DP 6: Conflict resolution system
About 25% of the youth groups have experienced at least one dispute and about 12% have experienced a
serious dispute. Disputes between the group and some outsiders were more likely to be of the serious type
than disputes within the group. 82.9% of the disputes within the group were resolved within the group itself
while only 19.2% of the disputes between the group and outsiders were resolved among the parties
themselves. As much as 39.7% of the disputes between the groups and outsiders were still unresolved at
the time of the interview while only 3.4% of the within-group disputes were still unresolved. There was a
high level of satisfaction (96.6% were satisfied) with how within-group disputes had been resolved while
23.4% were not satisfied with how the disputes between the group and some outsiders had been resolved.
We can conclude that local informal conflict resolution works well for within-group disputes. Because only
in few cases the groups had to get help from community (tabia) or district (woreda) officials to resolve
disputes.
Ostrom’s DP 7: Institutional recognition: Minimum rights to organize
The youth groups in Tigray have been formed through a formal institutional arrangement as primary
cooperatives and therefore fall under the law of cooperatives. The group is as such an official registered
unit of business with an exclusive number of members, that is provided a demarcated resource it is
responsible for managing in a sustainable way (except for mining where it has a time-limited right to extract
the non-renewable resource). The group has to have a business plan, have an officially elected leadership
team, can apply for joint loans, and to be audited by the cooperative organization. Still, the groups are given
the authority to organize themselves and have their own bylaws. The groups are monitored and provision
of loans and legal documents for their land entitlement depends on good performance and compliance with
the rules for resource management (taking good care of rehabilitated lands). We therefore conclude that the
groups get the minimum rights to organize themselves (Design Principle 7).
Ostrom’s DP 8: Nested enterprises: Common Pool Resource that is part of a larger system

The allocation of rehabilitated communal lands to youth groups in Tigray is clearly a part of a larger plan
for sustainable land management at community, district and regional levels. Parts of the areas allocated to
youth groups are “area exclosures”5 that the communities at an earlier stage agreed to protect from resource
extraction while they also invested in the conservation of the areas by building various forms of soil and
water conservation structures. Some areas have also been planted with trees. Other areas are rehabilitated
gulley areas. The rehabilitation has thus typically involved labor-intensive investments where labor has
been mobilized through compulsory labor provided by community members, through Food-for-work and
Cash-for-work activities under the Productive Safety Net Program (PSNP) or other food security and
sustainable land management programs.
We develop a more concise set of variables that should capture the variation in the extent to which the first
six DPs are implemented. These are summarized in Table 6. Table 6 below summarizes the final indicator
variables used to assess the DPs in the following regression models.
Table 6. Variables used as indicators for Ostrom’s Design Principles in regression models Variable Obs Mean Std. Dev. Min Max
DP1: Encroachment control system in place, dummy 742 0.941 0.236 0 1
DP2: Bylaw regulating sharing arrangements, dummy 742 0.973 0.162 0 1
DP3: Bylaw regulating frequency of meetings, dummy 742 0.949 0.221 0 1
DP3b: All members involved in decisions, dummy 742 0.708 0.455 0 1
DP4: Number of bylaws regulating management 741 3.497 1.044 0 4
DP5: Number of bylaws stipulating graduated sanctions 742 2.741 1.405 0 4
DP6: Satisfactory conflict resolution system, dummy 742 0.970 0.170 0 1
Source: Own census data.
The table demonstrates a high degree of compliance with the DPs among the youth groups. While there is
100% compliance with DP7 and DP8, the extent of deviation from 100% for the other DPs are used to
assess their possible effect on or correlation with the performance indicators. The DP variables in Table 6
may, however, also be closely correlated with each other and therefore create problems with
multicollinearity in the regressions. We therefore assess their correlation coefficients in Table A 24 in the
appendix. We also assessed the effects on significance levels from removing some of the most closely
correlated DPs but this did not make any big difference in the significance of the remaining DPs. The
correlation therefore appeared tolerable.
5 “Area exclosure” is a term used in Ethiopia and is an area that the community has agreed to protect from resource
extraction by humans and their livestock. The purpose has been to rehabilitate degraded communal lands. These areas
have also been called ‘enclosures’. The communities have typically established a guarding system to protect such
areas.

Next, we assess whether these DP indicator variables can be considered as “pre-determined” relative to the
outcome variables that we are assessing their correlation with. Assessing them one by one we find the
following. DP1 is assessed during the survey and we cannot rule out that the encroachment control system
to some extent has responded to actual exposure to violations. Such controls have a higher likelihood of
being imposed where encroachment is a problem and this may cause an underestimate of the effect of
imposing such controls. DP2, DP3, DP4 and DP5 are bylaws that were established by the youth groups
when they were established. We investigated whether these bylaws have been changes after their initial
establishment but there were hardly any such adjustments. We can therefore be confident that these
represent “pre-determined” variables. DP3b is on the other hand based on an assessment at the time of the
survey and indicates that decisions have not been delegated so much to the elected members or the leader.
This variable cannot therefore be considered to be pre-determined and the causality could go both ways.
DP6 is also an assessment at the time of the survey and may depend on the extent to which weaknesses in
the conflict resolution system have been revealed through exposure to conflicts. We therefore have to be
careful with the interpretation of correlations for this variable.
5. Estimation strategy
The key performance indicators are outlined in Table 3 and Table 4. For the first of the indicators, exposure
to conflicts we use two types of models; an ordered probit model and a multinomial logit model. This allows
us to test whether exposure to less serious disputes is related to different variables than exposure to more
serious disputes. For the other performance indicators, except the share of the initial group members that
still are in the group, we use ordered probit models. A fractional response model is used for the member
share staying models. The ordered probit models include the ranked degree of effect of poor cooperation
on performance (group leaders’ assessment), the level of trust (group leaders’ assessment), group leaders’
ranked performance assessment by the groups, and the youth association’s assessment of group
performance. These performance indicators are assumed to be functions of the DPs and possibly a number
of other control variables. We first run parsimonious models without the control variables. The control
variables are shown in Table 4. Some of them are potentially endogenous and require careful treatment.
Finding valid and strong instruments to predict them is difficult.
Finally, we assess group performance using group income per member as a dependent variable. In these
models we have added potential endogenous variables in a stepwise fashion to check the robustness of the
results for the DPs. The basic hypothesis is that the DPs are enhancing the performance of the groups and
that a significant correlation with the performance indicators may imply a causal positive effect on

performance for the pre-determined DPs. For the potentially more endogenous DPs we discuss the results
more cautiously in terms of there possibly being reverse causality or some other form of interaction.
An assessment of the potential endogeneity of the DPs was implemented by regressing the DPs on the same
set of control variables. The results are presented in Appendix Table A 25. It shows that certain DPs were
more likely to have been implemented in certain woredas. It also shows a higher R2 for the DPs that were
more likely to have changed after the formation of the groups (DP1, DP3b, DP6). We have resorted to
careful interpretation of the results when potentially endogenous variables are included, whether these are
the DPs or the control variables.
The DPs are also potentially correlated and we have assessed the degree of such correlation. It is substantial
between some of the DPs and we ran specifications where some of the highly correlated DPs were dropped
to assess how and whether this affected significance levels and the coefficients of the related included DPs.
Such multicollinearity did not affect the robustness of our key results and conclusions
6. Results and discussion
The results for the parsimonious DP and performance models without other control variables are presented
in Table 7. Positive significant coefficients for DPs in the member stay and the income per member models
can indicate that DPs enhance performance. Negative significant coefficients for DPs in the other models
indicate that DPs enhance performance in the wanted direction. DP1 (encroachment control system
established) is significantly associated with better performance for five out of six performance indicators.
DP2 (Bylaw regulating sharing arrangements) and DP4 (Number of bylaws regulating management) are
not significantly associated with any of the performance indicators. DP3 (Bylaw regulating frequency of
meetings) is significantly related with, possibly enhancing, two of the performance indicators (the rating
by youth group leaders and Youth Associations). DP3b (All members involved in decisions) is significantly
related with three indicators but only two of these are in the enhancing direction (indicators for poor
performance and trust). DP5 (number of graduated sanctions) is significantly related with four of the
indicators, three of which are in the expected direction. It seems to have contributed positively to (or is
positively correlated with) higher share of members staying on in the groups but is negatively correlated
with income per member. A higher number of members staying also implies that more members have to
share the income from the group activity and this may partly explain this finding. Overall, for seven DP
measures and six performance indicators we found 14 significant positive relationships enhancing
performance and three that were significant and negative. The high compliance with the DPs resulted in
few observations where the DPs were unfulfilled. This may have limited the number of significant positive
effects such as for DP2 where compliance was 97.3%.

14
Table 7. Parsimonious models for DPs versus performance indicators Member
Stay share
Poor coop
affects
performance
Trust Own rating Youth
Association
Rating
Group
income per
member
DP1: Encroachment control system in place 0.328c -0.303 -0.703a -0.752a -0.766b 5.013a
DP2: Bylaw regulating sharing arrangements 0.415 0.330 -0.186 -0.080 -0.122 -0.480
DP3: Bylaw regulating frequency of
meetings
0.133 0.031 0.236 -0.449d -0.545c 1.946
DP3b: All members involved in decisions -0.072 -1.020a -0.443a 0.004 0.326a 0.398
DP4: Number of bylaws regulating
management
-0.080 -0.011 -0.095 0.046 0.029 0.334
DP5: Number of graduated sanctions 0.109b -0.096c -0.024 -0.001 -0.075c -0.425c
DP6: Satisfactory conflict resolution system 0.162 0.993a -0.651c -0.427 -0.699c 1.477
Constant 0.232
-5.884c
Cut1 constant
-0.930c -1.848a -1.861a -3.172a
Cut2 constant
-0.500 -0.176 -0.829 -1.853a
Cut3 constant
0.190 -0.011 -0.389
Cut4 constant
0.861d 0.624 0.230
Sigma constant
5.629a
Wald chi2 19.639 89.559 54.093 23.213 49.572
Log likelihood
-1554.391
Prob > chi2 0.006 0.000 0.000 0.002 0.000 0.001
Number of observations 741 736 740 740 739 733 Source: Own census data. Significance levels: d < 0.10, c < 0.05, b < 0.01, a < 0.001. Fractional probit model with robust standard errors is used for the member stay model.
Censored tobit with robust standard erros is used in the income per member model. Ordered probit models with robust standard errors are used in the remaining models.

15

Table 8 presents the results from the performance-related models where additional controls are included
as a robustness check. The responses for the dependent variables, except the member share of the initial
group members staying in the group, are shown in Table 3. The distribution of the member share of the
initial group staying is shown in Figure 1. The first model in

Table 8 assesses factors associated with whether poor cooperation in the group affects its performance.
DP3b is negatively associated with group cooperation (significant at 0.1% level). More active participation
by all members in group decisions therefore seems to be associated with more cooperation problems in the
groups and these negatively affect the performance of the group. However, here could be reverse causality;
if performance is affected group members may engage themselves more in solving the problem. DP5
(number of graduated sanctions) is also negatively associated with (significant at 1% level) performance of
the groups. It is possible that tougher sanctions create more frustrations and more problems in the groups.
DP6 (satisfactory conflict resolution system in place) is positively associated with group performance
(significant at 5% level). The dynamics in the groups related to the DPs appear to be ambiguous.
A look at the other controls provide some additional insights. Exposure to conflicts severely affects, or is
correlated with, group cooperation and performance (significant at 1% level for both less serious and serious
disputes). Input access problems are strongly affecting group cooperation and performance (significant at
0.1% level). Early established groups are more likely to have cooperation and performance problems
(significant at 1% level).
We next assess the rating of the level of trust among group members (higher trust is associated with a lower
number). DP1 (Encroachment control system in place) is associated a higher level of trust within the group
(significant at 0.1% level). DP3b (active participation by all group members in decision) is also significantly
(at 0.1% level) associated with a higher level of trust in the groups. None of the other DPs were significant.
Exposure to less serious and serious conflicts are associated with significantly lower (at 0.1% levels) within
group trust. Groups that were allowed to form themselves (self-selection of members) demonstrate
significantly (at 0.1% level) higher level of internal trust. A change in key group positions in the groups is
associated with a significantly (at 1%) lower level of trust. The level of trust is also significantly lower in
two of the districts while there are no significant differences between types of activities.
The next model uses the group leaders’ rating of the performance of their group relative to other groups on
a scale from one to five, with one being the best (see Table 3 for the distribution). DP1 (Encroachment
control system established) is significantly (at 0.1% level) related to better ranking of group performance.
None of the other DPs are significant in this model. Exposure to less serious or serious conflicts are
significantly (at 0.1% levels) associated with poorer performance rating of the groups.
Irrigation/horticulture groups had a significantly (at 1% level) better rating than other types of groups. More
recently established groups also received a significantly (at 5% level) better rating while one of the districts
had a better rating of the groups there.

We next compare the Youth Association’s rating of the groups (a lower number indicating a higher/better
rating). It is possible that youth group leaders overstate the performance of their groups. The distribution
of the responses in Table 3 points in this direction. On the other hand, group leaders may also be better
informed about internal conditions in the groups than the Youth Association, which has representatives
located in the tabia who are responsible for following up the groups.

Table 8 demonstrates that DP1 (encroachment control system in place) is highly significant (at 0.1% level)
and positively associated with the group performance rating. DP3 (having bylaw regulating frequency of
meetings) is also significantly (at 5% level) associated with a better rating while DP3b (all members
involved in group decisions) is significantly negatively associated with the performance rating in contrast
to DP3. The latter variable is more endogenous and the finding may relate to what is observed related to
DP3b in the previous models on conflicts and cooperation versus performance. DP5 (number of graduated
sanctions) is significantly (at 0.1 level) associated with group ranking and the same is the case for DP6
(satisfactory conflict resolution system in place) which is significant at 5% level. This gives a good
correspondence between the DPs and group performance as judged by the Youth Association.
Contrary to the other models, the less serious and serious conflict variables are not significantly related to
the rating by the Youth Association. Significant differences were found between some of the districts and
like the rating by group leaders irrigation /horticulture groups were rating as performing significantly (at
5% level) better than other groups. Forest groups were rated to perform poorer than other groups (significant
at 10% level only). Change in key group positions and larger area per group members were also associated
with higher ranking (both of these variables were significant at 10% levels only).

Table 8. Ordered probit models for group cooperation, group trust, own performance rating and
rating by the Youth Association Poor
cooperation
affects
performance
Trust Own
rating
Youth
Association
Rating
DP1: Encroachment control system in place -0.163 -0.812a -0.772a -0.805a
DP2: Bylaw regulating sharing arrangements 0.375 -0.433 -0.072 -0.346
DP3: Bylaw regulating frequency of meetings 0.405 -0.035 -0.466d -0.564c
DP3b: All members involved in decisions -1.252a -0.386a -0.022 0.284b
DP4: Number of bylaws regulating management -0.063 -0.005 0.068 0.090
DP5: Number of graduated sanctions -0.122c -0.068 -0.024 -0.121b
DP6: Satisfactory conflict resolution system 0.770c -0.404 0.119 -0.542c
Establishment year & month 0.104b 0.053 -0.063c -0.013
Initial member number -0.008c -0.004 -0.003 -0.001
Female share in group at start 0.314 -0.347 -0.339 0.219
Gender of group leader, 1=Female 0.485b 0.013 0.013 -0.153
Distance to road, km -0.024 0.007 -0.015 -0.002
Distance to market, km -0.015 0.000 0.011 0.011
Distance to home, min. km 0.055 -0.002 0.019 0.038
Input access problems, dummy -0.511a -0.153 0.117 0.042
Baseline: No conflicts 0.000 0.000 0.000 0.000
Serious conflict in group, dummy -0.499b 0.472b 0.538a 0.111
Less serious conflict in group, dummy -0.434b 0.615a 0.444a -0.014
Area allocated per person in group 0.491d -0.185 -0.390d -0.439d
Number of returning migrants 0.027 -0.024 -0.013 -0.013
Change in key group positions, dummy -0.182 0.261c -0.158 -0.157
Self-selection of group members, dummy 0.249 -0.535a -0.075 0.274c
District dummies: Base=Raya Azebo 0.000 0.000 0.000 0.000
Degua Tembien 0.159 -0.103 -0.178 0.225
Seharti Samre 0.335d 0.480b -0.208 0.539a
Kilite Awlalo -0.062 0.053 -0.475a -0.345c
Adwa 0.501b 0.293d -0.096 0.398b
Activity dummies: Base=Animal rearing 0.000 0.000 0.000 0.000
Beekeeping 0.059 -0.122 0.103 0.149
Forest -0.198 -0.246 0.025 0.350d
Irrigation/Horticulture 0.218 -0.063 -0.527a -0.304c
Mining 0.132 -0.213 -0.197 -0.099
Other 0.941 -1.447d -0.905 -0.005
Cut 1 Constant 207.546b 104.046 -128.856c -28.367
Cut 2 Constant 208.034b 105.863 -127.760c -26.939
Cut 3 Constant 106.225 -126.907c -25.398
Cut 4 Constant 106.896 -126.257c -24.765
Wald chi2 194.619 134.823 107.778 152.411
Prob > chi2 0.000 0.000 0.000 0.000
Number of obs. 722 725 726 725 Source: Own census data. Dependent variable categorizations: Group cooperation problem: 1=Yes, very much, 2=To some
extent, 3=No cooperation problem, Trust: 1=Very high, 2=Quite high, 3=ok, 4=Not so good, 5=Very poor, Own performance
rating and Youth Association rating: 1=Very good, 2=Good, 3=Average, 4=Below average, 5=Poor performance. Significance
levels: d < 0.10, c < 0.05, b < 0.01, a < 0.001.

21
Table 9 assesses whether the DPs affect share of remaining initial members in the group and the income
that youth group members obtain from their youth group activity. The dependent variable in the income
models is the log of the income per current youth group member in 2015 in Ethiopian Birr (EB). Descriptive
statistics of the variation in income per current youth group member across the main group activities is
shown in Table 4. Forest and beekeeping groups have much lower incomes than the other groups. It takes
long time before planted trees can be harvested. 2015 was a drought year and this may also have affected
negatively the production of honey by beekeeping groups.
We have included the member stay share model with the income models to facilitate a better joint inspection
of these models. A stepwise approach is used to assess the importance of the following potential endogenous
variables. These are occurrence of more or less serious conflicts, number of dropped out members (which
relates to the member stay share as one of the performance indicators), change in elected board of group
members (dummy=1 if such a change has taken place), and gender of group leader (dummy=1 for female
leader). Finding good instruments to predict these is difficult. We therefore resort to running models with
and without these and careful interpretation of the results.
Table 9 shows a very strong and highly significant (at 0.1% level) relationship between DP1 (encroachment
control system in place). The direction of causality could go both ways in this case. With a more valuable
production activity which generates more income for the group there may also be higher risk of
encroachment and theft and making guarding of the area important. Among the other DPs only DP5
(number of graduated sanctions) was significant (at 5 and 10% levels) and it had a negative sign. A higher
number of graduated sanctions was associated with lower income per group member. This could indicate a
dis-incentive effect from graduated sanctions. The signs of all the other DPs were positive but insignificant.
Among the other variables, we see that establishment year and month is highly significant and negative in
the income models and positive in the member stay share models. This makes sense as it takes time before
the youth group production activities start to generate income. Dropout rates may also increase over time
and there may have been more organizational problems in relation to the establishment of the earliest groups
due to less experienced local administrations. Lower income is particularly associated with the forest groups
for tree production takes longer time than other activities to generate income. Beekeeping also gave
significantly lower income than other activities except forestry. Input access problems (dummy) was
significantly negatively associated with income and 66% of the groups stated to have such a problem. Lower
income is not directly related to distance to road or distance to market as these variables are insignificant.
Income is positively related to the area allocated per initial group member (significant at 10 and 5% levels).

Income per current member is also highly significantly (at 0.1% level) related to the reduction in number
of group members since start. A higher dropout of members gives more income per remaining members.
Here could also be a selection effect with more hard-working members remaining. The initial female share
in the group is negatively associated with income per initial member. This could be because some of the
investment activities are physically demanding and more difficult for females to contribute to. Some groups
allowed females to contribute less to such activities without changing the principle of equal sharing of
income. Finally, we see, somewhat surprisingly, that groups that have less serious disputes have
significantly (at 0.1% level) higher income per member while groups with serious disputes also have higher
income (significant at 10% only) than groups with no disputes. This could be because higher income creates
more competition and disagreements within groups (reverse causality). Another finding, that groups that
have had a change in key positions since start (27% of the groups have had such a change), had significantly
higher income per member. Here also causality could go both ways. Higher income could cause more
internal controversies and a demand for change of persons in key positions. Such a change could also lead
to better group management and higher income.

23
Table 9. Fractional probit model for member stay share and Tobit models for log of individual
income per current member in 2015 from group activity Member stay
share
Logindinc1 Logindinc2 Logindinc3
DP1: Encroachment control system in place 0.296 5.548a 5.566a 4.999a
DP2: Bylaw regulating sharing arrangements 0.217 -1.781 -1.791 -1.913
DP3: Bylaw regulating frequency of meetings 0.189 0.931 1.150 0.810
DP3b: All members involved in decisions -0.013 0.459 0.285 0.152
DP4: Number of bylaws regulating
management
-0.047 0.364 0.262 0.350
DP5: Number of graduated sanctions 0.086c -0.385c -0.315d -0.295d
DP6: Satisfactory conflict resolution system 0.102 0.934 1.054 1.457
Establishment year & month 0.097a -0.893a -0.836a -0.655a
Initial member number 0.000 -0.004 -0.019 -0.023
Female share at start of group 0.032 -2.330c -2.484c -2.792c
Distance to road, km -0.156 -0.013 -0.017 0.021
Distance to market, km 0.018 -0.013 -0.012 -0.031
Distance to home, min. km 0.012d -0.287d -0.260 -0.262
Input access problems, dummy -0.027 -1.171c -1.122c -1.339b
Area allocated per person in group 0.057 1.919d 2.593c 1.985d
Number of returning migrants 0.008 0.042 0.063 0.055
District dummies: Base=Raya Azebo
Degua Tembien 0.072 2.287b 2.070c 1.642c
Seharti Samre 0.501a 0.594 0.823 0.841
Kilite Awlalo -0.058 1.245d 1.327d 1.725c
Adwa 0.582a 0.278 0.275 0.139
Activity dummies: Base=Animal rearing
Beekeeping -0.032 -2.543a -2.501a -2.543a
Forest -0.017 -5.220a -4.986a -4.834a
Irrigation/Horticulture 0.116 -0.893 -0.525 -0.388
Mining -0.130 0.035 -0.037 -0.015
Other -0.200 0.422 0.206 0.174
Number of dropped out members
0.147a 0.123a
Gender of group leader, 1=Female
0.572 0.828
Self-selection of group members -0.143
Baseline: No conflicts
Serious conflict in group, dummy -0.316c
1.039d
Less serious conflict in group, dummy -0.108
2.025a
Change in key group positions, dummy -0.356a
2.187a
Constant -195.891a 1797.448a 1681.809a 1317.806a
Sigma constant 5.197a 5.141a 4.986a
Log likelihood -1490.106 -1477.733 -1458.721
Wald chi2 114.140
Prob. > chi2 0.000 0.000 0.000 0.000
Number of obs. 726 721 719 719
Number of left censored obs. 315 315 315 Source: Own census data. Dependent variable: Log (Income per current group member (EB) in 2015+1). The table shows
marginal effects. Significance levels: d < 0.10, c < 0.05, b < 0.01, a < 0.001.

24
7. Conclusion
Ostrom (2010) warns against being too optimistic about being able to solve social dilemmas as there are
many examples of failures as well, and acknowledges that further research is needed. We contribute to this
research in terms of assessing the success of kick-started youth groups in terms of their ability to cooperate
and self-manage themselves as custodians of an allocated land resource that is intended to be a source of
livelihood and joint business. Our study revealed a high degree of compliance with Ostrom’s Design
Principles across the youth groups. When relating the Design Principles to a number of performance
indicators, we found that DP1 (having an encroachment control system in place) was the most significant
among the DPs. This is in terms of being associated with better performance (significant for five of six
indicators in the parsimonious models without controls and significant in four of six in the models with an
extended set of controls). Overall, for the seven DP measures and six performance indicators we found 14
significant effects or correlations in line with DPs enhancing performance in the parsimonious models while
two of those became insignificant when we added the set of controls. There were three significant
relationships between the DPs and the performance indicators that had the opposite sign. Five of the seven
DP measures were significantly correlated with the Youth Association’s ranking of the performance of the
groups and one of these had the “wrong” sign (DP3b - All members involved in decisions), but only DP1
was significantly positively correlated with income of group members from their joint production activity.
Self-selection of group members, used by 80% of the groups, is associated with higher trust among
members. Some results seemed surprising. For example, exposure to disputes and change in key group
positions were associated with lower trust but also with higher incomes from the groups’ joint production
activities. This latter result may partly be explained by larger dropout rates for groups with such exposure
to serious disputes and changes in key group positions as a lower number of group members lead to higher
income per remaining member. However, how much this can explain of these income effects needs further
inspection.
Overall, we think the youth group model we have studied shows promise as an approach to engaging
landless and unemployed youth in productive activities and as environmental custodians. Giving youth
groups self-organization responsibilities, opportunities, as well as obligations as a primary cooperative and
environmental caretaker unit is an approach that we recommend for testing also elsewhere, given the
growing problem of youth unemployment and landlessness. This can also contribute to political stability
and keeping youth out of trouble and making them into the valuable resource for society they deserve to
be.

25
References
Agrawal, A. (2001). Common property institutions and sustainable governance of resources. World
Development 29(10), 1649-1672.
Baland, J. M., & Platteau, J. P. (1996). Halting degradation of natural resources: Is there a role for rural
communities? Food & Agriculture Organization, Rome.
Cox, M., Arnold, G. and Tomas, S.V. (2009). Design principles are not blue prints, but are they robust? A
meta-analysis of 112 studies. Lincoln Institute of Land Policy Working Paper.
Ostrom, E. (1990). Governing the commons. Cambridge University Press.
Ostrom, E. (2010). Beyond markets and states: polycentric governance of complex economic systems.
American Economic Review 100(3), 641–672.
Ostrom, E. (2010). Polycentric systems for coping with collective action and global environmental change.
Global Environmental Change 20(4), 550-557.
Ostrom, E. (2010). Analyzing collective action. Agricultural Economics 41, 155-166.
Ostrom, E., Walker, J., & Gardner, R. (1992). Covenants with and without a Sword: Self-governance Is
Possible. American Political Science Review 86(2), 404-417.
Ostrom, E. and Basurto, X. (2011). Crafting analytical tools to study institutional change. Journal of
Institutional Economics 7(3), 317-343.
Poteete, A. R., and Ostrom, E. (2008). Fifteen years of empirical research on collective action in natural
resource management: struggling to build large-N databases based on qualitative research. World
Development 36(1), 176-195.
Wade, R. (1988). The management of irrigation systems: How to evoke trust and avoid prisoner's dilemma.
World Development 16(4), 489-500.

26
APPENDICES
Appendix 1A: Details on adherence to Ostrom’s DPs
Ostrom’s DP 1: Clearly defined borders
In Table A 1 we assess whether the land area that has been allocated to youth groups is clearly demarcated.
The groups are grouped by the main activity they have on their land to assess whether there are systematic
differences between these.
Table A 1. Assessment of Ostrom’s Design Principle 1: Clear border demarcation, by type of
activity Animal
rearing
Bee
keeping
Forest Irrigation/
Horticulture
Mining Other Total
Very clearly
demarcated and fenced
Obs. 40.0 23.0 4.0 38.0 2.0 2.0 109.0
% 29.2 14.5 9.5 39.6 0.7 20.0 14.8
Clearly demarcated
but not fenced
Obs. 70.0 110.0 29.0 46.0 206.0 0.0 461.0
% 51.1 69.2 69.1 47.9 69.8 0.0 62.4
Partly well demarcated Obs. 10.0 10.0 4.0 2.0 2.0 0.0 28.0
% 7.3 6.3 9.5 2.1 0.7 0.0 3.8
No clear borders for
part of the area
Obs. 11.0 16.0 5.0 10.0 85.0 1.0 128
% 8.0 10.1 11.9 10.4.0 28.8 10.0 17.3
Does not apply Obs. 6.0 0.0 0.0 0.0 0.0 7.0 13.0
% 4.4 0.0 0.0 0.0 0.0 70.0 1.8
Total Obs. 137.0 159.0 42.0 96.0 295.0 10.0 739.0
% 100.0 100.0 1000.0 100.0 100.0 100.0 100.0
Source: Own census data. Test for significant difference between activities: Pearson chi2(20) = 454.14, Pr < 0.0001.

27
Table A 2. Is there traffic by outsiders going through the area allocated to the youth group? By
district Raya
Azebo
Degua
Tembien
Seharti
Samre
Kilite
Awlalo
Adwa Total
Yes, a path/road goes through Obs. 57.0 3.0 11.0 43.0 10.0 124.0
% 28.8 4.1 10.2 26.7 5.1 16.8
It is common by outsiders
to walk through the area
Obs. 48.0 6.0 18.0 69.0 11.0 152.0
% 24.2 8.2 16.7 42.9 5.6 20.6
Livestock of outsiders
commonly enter the area
Obs. 18.0 5.0 12.0 13.0 29.0 77.0
% 9.1 6.9 11.1 8.1 14.7 10.5
Uncommon, but it happens Obs. 30.0 13.0 18.0 28.0 57.0 146.0
% 15.2 17.8 16.7 17.4 28.9 19.8
No, it is well protected and
no traffic by outsiders
Obs. 42.0 46.0 41.0 7.0 89.0 225.0
% 21.2 63.0 38.0 4.4 45.2 30.5
Does not apply Obs. 3.0 0.0 8.0 1.0 1.0 13.0
% 1.5 0.0 7.4 0.6 0.5 1.8
Total Obs. 198.0 73.0 108.0 161.0 197.0 737.0
% 100.0 100.0 100.0 100.0 100.0 100.0
Source: Own census data. Test for significant difference between districts: Pearson chi2(20) = 243.76, Pr < 0.0001.
Table A 3. Is there traffic by outsiders going through the area allocated to the youth group? By
main activity type Animal
rearing
Beekeeping Forest Irrigation/
Horticulture
Mining Other Total
Yes, a path/road goes
through
Obs. 6.0 5.0 1.0 4.0 107.0 1.0 124.0
% 4.4 3.2 2.4 4.2 36.4 10.0 16.8
It is common by outsiders
to walk through the area
Obs. 14.0 8.0 2.0 5.0 123.0 0.0 152.0
% 10.2 5.1 4.8 5.2 41.8 0.0 20.6
Livestock of outsiders
commonly enter the area
Obs. 14.0 23.0 7.0 7.0 26.0 0.0 77.0
% 10.2 14.6 16.7 7.3 8.8 0.0 10.5
Uncommon, but it
happens
Obs. 31.0 44.0 18.0 21.0 32.0 0.0 146.0
% 22.6 27.9 42.9 21.9 10.9 0.0 19.8
No, it is well protected
and
no traffic by outsiders
Obs. 66.0 78.0 14.0 59.0 6.0 2.0 225.0
% 48.2 49.4 33.3 61.5 2.0 20.0 30.5
Does not apply Obs. 6.0 0.0 0.0 0.0 0.0 7.0 13.0
% 4.4 0.0 0.0 0.0 0.0 70.0 1.8
Total Obs. 137.0 158.0 42.0 96.0 294.0 10.0 737.0
% 100.0 100.0 100.0 100.0 100.0 100.0 100.0
Source: Own census data. Test for significant difference between activities. Pearson chi2(25) = 678.33, Pr < 0.0001.

28
Table A 4. Is the group experiencing any illegal harvesting by outsiders in the allocated land
area? Raya
Azebo
Degua
Tembien
Seharti
Samre
Kilite
Awlalo
Adwa Total
It is frequent (>1 per week) Obs. 6.0 1.0 1.0 0.0 0.0 8.0
% 3.1 1.4 0.9 0.0 0.0 1.1
It happens now and then
(>1 per month)
Obs. 11.0 0.0 6.0 4.0 12.0 33.0
% 5.6 0.0 5.6 2.5 6.1 4.5
It happens rarely (<1 per
month)
Obs. 8.0 5.0 4.0 1.0 26.0 44.0
% 4.1 6.9 3.7 0.6 13.1 6.0
It happens very rarely
(<1 per year)
Obs. 21.0 16.0 9.0 14.0 49.0 109.0
% 10.7 21.9 8.3 8.8 24.8 14.8
Has never happened since start
of the group/area was allocated
Obs. 150.0 51.0 88.0 141.0 111.0 541.0
% 76.5 69.9 81.5 88.1 56.1 73.6
Total Obs. 196.0 73.0 108.0 160.0 198.0 735.0
% 100.0 100.0 100.0 100.0 100.0 100.0
Source: Own census data. Test for significant difference between districts: Pearson chi2(16) = 83.42, Pr < 0.0001.
Table A 5. Frequency of illegal harvesting vs type of activity Animal
rearing
Bee-
keeping
Forest Irrigation/
Horticulture
Mining Other Total
It is frequent (>1 per
week)
Obs. 3.0 1.0 0.0 1.0 3.0 0.0 8.0
% 2.2 0.6 0.0 1.0 1.0 0.0 1.1
It happens now and then
(>1 per month)
Obs. 6.0 5.0 3.0 6.0 13.0 0.0 33.0
% 4.4 3.1 7.1 6.3 4.4 0.0 4.5
It happens rarely
(<1 per month)
Obs. 13.0 15.0 8.0 6.0 1.0 1.0 44.0
% 9.6 9.4 19.1 6.3 0.3 12.5 6.0
It happens very rarely
(<1 per year)
Obs. 24.0 36.0 10.0 17.0 22.0 0.0 109.0
% 17.7 22.6 23.8 17.7 7.5 0.0 14.8
Has never happened since
start of the group/area was
allocated
Obs. 90.0 102.0 21.0 66.0 255.0 7.0 541.0
% 66.2 64.2 50.0 68.8 86.7 87.5 73.6
Total Obs. 136.0 159.0 42.0 96.0 294.0 8.0 735.0
% 100.0 100.0 100.0 100.0 100.0 100.0 100.0 Source: Own census data. Test for significant difference between activities: Pearson chi2(20) = 74.52, Pr < 0.0001.
We see from Tables A4 and A5 that less than 6% of the youth groups experience illegal harvesting on their
land more frequently than monthly and only 1.1% experience it more frequently than weekly. This shows
that illegal harvesting is not a big problem. Table 13 shows the extent of guarding that is used by the youth
groups to protect their area. Most youth groups have a guarding system and we can conclude that the
resource base of the youth is well protected from extraction by outsiders.

29
Table A 6. Frequency of illegal harvesting versus guarding of the land against outsiders (related
to Ostrom’s DP 1: Clear demarcation against outsider intrusion Frequency of illegal harvesting by
outsiders in the allocated area
Continuously
guarding by
rotating
responsibility
Guarding
during
daytime
Hired a
guard to
protect the
area
No guard is
considered
necessary
Total
It is frequent (>1 per week) Obs. 6.0 1.0 0.0 1.0 8.0
% 1.7 1.4 0.0 0.6 1.1
It happens now and then
(>1 per month)
Obs. 22.0 3.0 3.0 5.0 33.0
% 6.2 4.2 2.0 3.2 4.5
It happens rarely (<1 per month) Obs. 15.0 6.0 19.0 4.0 44.0
% 4.2 8.3 12.8 2.6 6.0
It happens very rarely
(<1 per year)
Obs. 56.0 16.0 33.0 4.0 109.0
% 15.7 22.2 22.2 2.6 14.8
Has never happened since start
of the group/area was allocated
Obs. 258.0 46.0 94.0 143.0 541
% 72.3 63.9 63.1 91.1 73.6
Total Obs. 357.0 72.0 149.0 157.0 735.0
% 100.0 100.0 100.0 100.0 100.0
Source: Own census data. Test for significant difference between districts: Pearson chi2(12) = 59.00, Pr < 0.0001.
Table A 7. Is the current system for controlling encroachment functioning satisfactorily?
(Ostrom’s DP 1/5?) Raya
Azebo
Degua
Tembien
Seharti
Samre
Kilite
Awlalo
Adwa Total
No Obs. 25.0 5.0 9.0 2.0 3.0 44.0
% 12.6 6.9 8.3 1.2 1.5 6.0
Yes Obs. 170.0 68.0 99.0 158.0 194.0 689.0
% 85.9 93.1 90.8 98.1 98.0 93.2
Some modification is needed Obs. 3.0 0.0 1.0 1.0 1.0 6.0
% 1.52 0.0 0.92 0.6 0.5 0.8
Total Obs. 198.0 73.0 109.0 161.0 198.0 739.0
% 100.0 100.0 100.0 100.0 100.0 100.0
Source: Own census data. Test for significant difference between districts: Pearson chi2(8) = 32.66, Pr < 0.0001.
From this we conclude that Ostrom’s DP 1 (Clearly demarcated and protected borders for the resource
and clearly defined group with rights) is satisfied for 93% of the groups.
Ostrom’s DP 2: Sharing of benefits and costs/congruence between appropriation rules and
provision rules
Table A 8 shows that 97.6% of the groups have a bylaw that regulates the sharing of responsibilities and
incomes from the group activities.

30
Table A 8. Is the sharing of work and responsibilities in the group and the sharing of income
regulated by the bylaw of the group? Raya
Azebo
Degua
Tembien
Seharti
Samre
Kilite
Awlalo
Adwa Total
No Obs. 14.0 0.0 0.0 3.0 1.0 18.0
% 7.0 0.0 0.0 1.9 0.5 2.4
Yes Obs. 185.0 73.0 109.0 158.0 197.0 722.0
% 93.0 100.0 100.0 98.1 99.5 97.6
Total Obs. 199.0 73.0 109.0 161.0 198.0 740.0
% 100.0 100.0 100.0 100.0 100.0 100.0
Source: Own census data.
Table A 9. How is the work required on the allocated land shared among the youth group
members? (Ostrom’s DP 2) Raya
Azebo
Degua
Tembien
Seharti
Samre
Kilite
Awlalo
Adwa Total
Equal sharing for all Obs. 108.0 60.0 86.0 106.0 151.0 511.0
% 54.0 82.2 78.9 65.8 76.3 69.0
Different requirement for males
and females
Obs. 85.0 13.0 17.0 54.0 47.0 216.0
% 42.5 17.8 15.6 33.5 23.7 29.2
Sharing modified to ability of
each member
Obs. 3.0 0.0 0.0 1.0 0.0 4.0
% 1.5 0.0 0.0 0.6 0.0 0.5
Sharing based on the individual
motivation & other activities
Obs. 3.0 0.0 6.0 0.0 0.0 9.0
% 1.5 0.0 5.5 0.0 0.0 1.2
Other, specify Obs. 1.0 0.0 0.0 0.0 0.0 1.0
% 0.5 0.0 0.0 0.0 0.0 0.1
Total Obs. 200.0 73.0 109.0 161.0 198.0 741.0
% 100.0 100.0 100.0 100.0 100.0 100.0
Source: Own census data. Test for significant difference between districts: Pearson chi2(16) = 67.13, Pr < 0.0001.
Table A 10. How is income from the group activities shared among group members? (Ostrom’s
DP 2). Raya
Azebo
Degua
Tembien
Seharti
Samre
Kilite
Awlalo
Adwa Total
Equally shared by all Obs. 198.0 73.0 102.0 159.0 198.0 730.0
% 99.0 100.0 93.6 99.4 100.0 98.7
Shares depend on effort
and gender
Obs. 2.0 0.0 7.0 1.0 0.0 9.0
% 0.5 0.0 6.4 0.6 0.0 1.2
Total Obs. 200.0 73.0 109.0 160.0 198.0 740.0
% 100.0 100.0 100.0 100.0 100.0 100.0
Source: Own census data. Test for significant difference between districts: Pearson chi2(8) = 31.93, Pr < 0.0001.

31
We see from Tables A9 and A10 that equal sharing of income is the rule for 98.7% of the youth groups. In
Table 18 we see that the responsibilities are shared equally in 56.7% of the groups only as female members
are allowed to do less of the heavy body work than males but they still get an equal share of the benefits.
Table A 11. Is there a gender difference in the sharing of responsibilities and benefits in the
group? (Ostrom’s DP 2). Raya
Azebo
Degua
Tembien
Seharti
Samre
Kilite
Awlalo
Adwa Total
No, all are equally treated Obs. 114.0 34.0 61.0 61.0 117.0 387.0
% 58.5 46.6 69.3 45.9 60.3 56.7
Females do less of the heavy
work but get equal benefit
Obs. 79.0 39.0 24.0 72.0 77.0 291.0
% 40.5 53.4 27.3 54.1 39.7 42.6
Females do less of the heavy
work and get less of the benefit
Obs. 0.0 0.0 3.0 0.0 0.0 3.0
% 0.0 0.0 3.4 0.0 0.0 0.4
Other, specify Obs. 2.0 0.0 0.0 0.0 0.0 2.0
% 1.0 0.0 0.0 0.0 0.0 0.3
Total Obs. 195.0 73.0 88.0 133.0 194.0 683.0
% 100.0 100.0 100.0 100.0 100.0 100.0
Source: Own census data. Test for significant difference between districts: Pearson chi2(12) = 43.99, Pr < 0.0001.
If we accept that females should be allowed to do less of the heavy work, we can state that 99% of the
groups satisfy DP 2.
Ostrom’s DP 3: Joint decision-making system.
95.8% of the youth groups stated to have their own written bylaw. Their bylaws also stated the frequency
of meetings in these groups that have a bylaw, see Table A 12.
Table A 12. Groups with bylaw that specified the frequency of meetings, by district (Ostrom’s
DP 3) Raya
Azebo
Degua
Tembien
Seharti
Samre
Kilite
Awlalo
Adwa Total
Weekly Obs. 90.0 23.0 31.0 79.0 13.0 236.0
% 50.0 31.5 31.3 50.3 6.8 33.7
Biweekly Obs. 52.0 22.0 28.0 52.0 85.0 239.0
% 28.9 30.1 28.3 33.1 44.3 34.1
Monthly Obs. 37.0 28.0 40.0 26.0 90.0 221.0
% 20.6 38.4 40.4 16.6 46.9 31.5
Other, explain Obs. 1.0 0.0 0.0 0.0 4.0 5.0
% 0.6 0.0 0.0 0.0 2.1 0.7
Total Obs. 180.0 73.0 99.0 157.0 192.0 701.0
% 100.0 100.0 100.0 100.0 100.0 100.0
Source: Own census data. Test for significant difference between districts: Pearson chi2(12) =120.73, Pr < 0.0001.
32
92.2% of the groups have penalties for non-participation in group meetings. There are actually graduated
sanctions against non-participation as well as late arrival to meetings. And these have been enforced.
Monetary sanctions are most common (86% of the sanctions). 43.6% of the groups had members that had
been penalized for absence from meetings and 36.9% of the groups had members that had been penalized
for late arrival to meetings. It is very clear that group membership implies strong participation obligations.
Close to 68% of the groups have meetings at least biweekly.
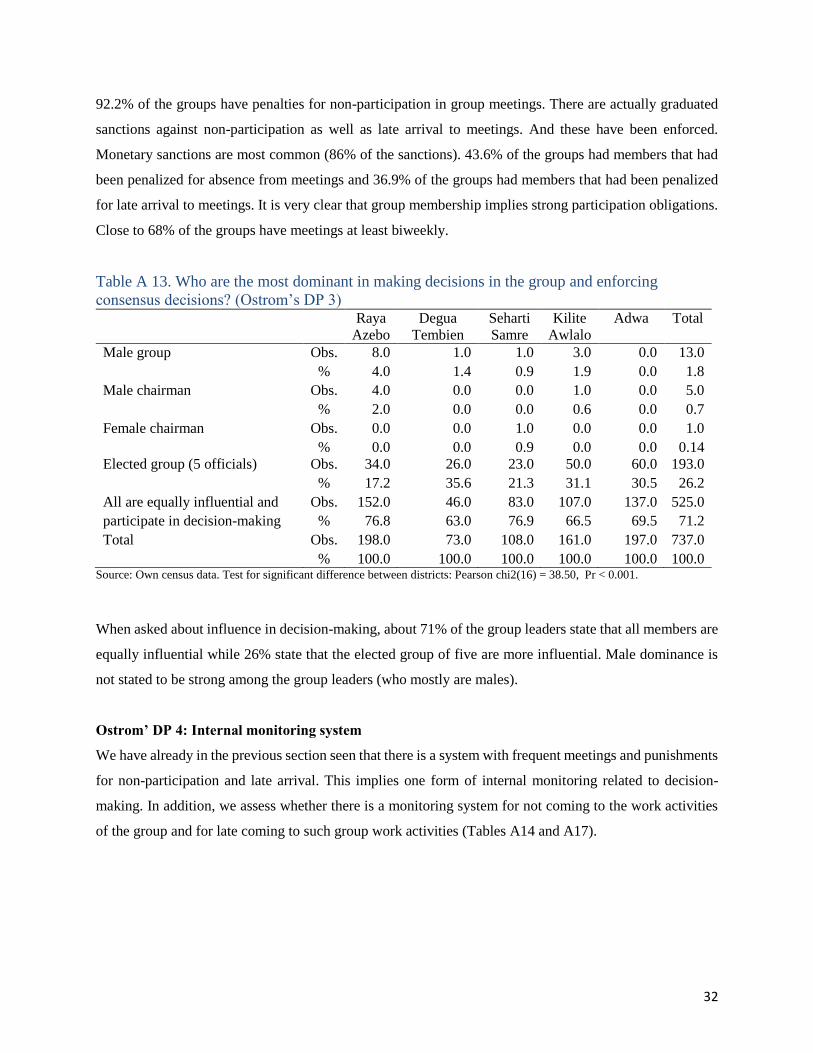
Table A 13. Who are the most dominant in making decisions in the group and enforcing
consensus decisions? (Ostrom’s DP 3) Raya
Azebo
Degua
Tembien
Seharti
Samre
Kilite
Awlalo
Adwa Total
Male group Obs. 8.0 1.0 1.0 3.0 0.0 13.0 % 4.0 1.4 0.9 1.9 0.0 1.8
Male chairman Obs. 4.0 0.0 0.0 1.0 0.0 5.0 % 2.0 0.0 0.0 0.6 0.0 0.7
Female chairman Obs. 0.0 0.0 1.0 0.0 0.0 1.0 % 0.0 0.0 0.9 0.0 0.0 0.14
Elected group (5 officials) Obs. 34.0 26.0 23.0 50.0 60.0 193.0 % 17.2 35.6 21.3 31.1 30.5 26.2
All are equally influential and Obs. 152.0 46.0 83.0 107.0 137.0 525.0
participate in decision-making % 76.8 63.0 76.9 66.5 69.5 71.2
Total Obs. 198.0 73.0 108.0 161.0 197.0 737.0 % 100.0 100.0 100.0 100.0 100.0 100.0
Source: Own census data. Test for significant difference between districts: Pearson chi2(16) = 38.50, Pr < 0.001.
When asked about influence in decision-making, about 71% of the group leaders state that all members are
equally influential while 26% state that the elected group of five are more influential. Male dominance is
not stated to be strong among the group leaders (who mostly are males).
Ostrom’ DP 4: Internal monitoring system
We have already in the previous section seen that there is a system with frequent meetings and punishments
for non-participation and late arrival. This implies one form of internal monitoring related to decision-
making. In addition, we assess whether there is a monitoring system for not coming to the work activities
of the group and for late coming to such group work activities (Tables A14 and A17).

33
Table A 14. Does the group have a bylaw stipulating penalties for not coming to work activities
of the group? Raya
Azebo
Degua
Tembien
Seharti
Samre
Kilite
Awlalo
Adwa Total
No Obs. 21 2 14 7 12 56
% 10.5 2.7 12.8 4.4 6.1 7.6
Yes Obs. 180 71 95 154 186 686
% 89.6 97.3 87.2 95.6 93.9 92.4
Total Obs. 201 73 109 161 198 742
% 100 100 100 100 100 100
Source: Own census data. Test for significant difference between districts: Pearson chi2(4) = 12.21, Pr< 0.016.
Table A 15. Have any group members been punished for not coming to group work activities? Raya
Azebo
Degua
Tembien
Seharti
Samre
Kilite
Awlalo
Adwa Total
No Obs. 146.0 38.0 84.0 141.0 139.0 548.0
% 72.6 52.1 77.1 87.6 70.2 73.9
Yes Obs. 55.0 35.0 25.0 20.0 59.0 194.0
% 27.4 47.9 22.9 12.4 29.8 26.1
If yes, how many punished? % 4.4 4.9 3.8 5.1 3.8 4.3
Total Obs. 201.0 73.0 109.0 161.0 198.0 742.0
% 100.0 100.0 100.0 100.0 100.0 100.0
Source: Own census data. Test for significant difference between districts: Pearson chi2(4) = 35.77, Pr < 0.0001.
Table A 14 shows that 92.6% of the groups have bylaw stipulating penalties for not coming to group
work activities. Table A 15 shows that 26.1% of the groups have members that have been punished for
not coming to group work activities.
Table A 16. Does group have bylaw for penalties for late coming to group work activities? Raya
Azebo
Degua
Tembien
Seharti
Samre
Kilite
Awlalo
Adwa Total
No No 33.0 9.0 38.0 37.0 32.0 149.0
% 16.4 12.3 34.9 23.0 16.2 20.1
Yes No 168.0 64.0 71.0 124.0 166.0 593.0
% 83.6 87.7 65.1 77.0 83.8 79.9
Total No 201.0 73.0 109.0 161.0 198.0 742.0
% 100.0 100.0 100.0 100.0 100.0 100.0
Source: Own census data. Test for significant difference between districts: Pearson chi2(4) = 21.99, Pr < 0.0001.
Table A 16 shows that 79.9% of the groups have bylaws stipulating penalties for late coming to group
work activities and Table A 17 shows that 21.7% of the youth groups have punished some members for
late arrival to group work activities.

34
Table A 17. Have any group members been punished for late arrival to group work activities? Raya
Azebo
Degua
Tembien
Seharti
Samre
Kilite
Awlalo
Adwa Total
No Obs. 148.0 44.0 91.0 141.0 157.0 581.0
% 73.6 60.3 83.5 87.6 79.3 78.3
Yes Obs. 53.0 29.0 18.0 20.0 41.0 161.0
% 26.4 39.7 16.5 12.4 20.7 21.7
If yes, how many punished? % 4.4 5.5 3.1 3.3 5.3 4.6
Total Obs. 201.0 73.0 109.0 161.0 198.0 742.0
% 100.0 100.0 100.0 100.0 100.0 100.0
Source: Own census data. Test for significant difference between districts: Pearson chi2(4) = 26.53, Pr < 0.0001.
Finally, we aggregate the extent of use of the four types of sanctions (absence from and late arrival to
meetings and to group work activities) by adding four dummy variables for whether each group has used
each of the four types of sanctions. The distribution of aggregate use of the sanctions is presented in Table
25, by district.
Table A 18. To what extent have groups penalized their group members by number of types of
violations, by district. Number of types if violations Raya
Azebo
Degua
Tembien
Seharti
Samre
Kilite
Awlalo
Adwa Total
0 Obs. 86.0 17.0 57.0 98.0 72.0 330.0
% 42.8 23.3 52.3 60.9 36.4 44.5
1 Obs. 33.0 12.0 16.0 22.0 41.0 124.0
% 16.4 16.4 14.7 13.7 20.7 16.7
2 Obs. 35.0 12.0 16.0 21.0 38.0 122.0
% 17.4 16.4 14.7 13.0 19.2 16.4
3 Obs. 27.0 14.0 14.0 15.0 24.0 94.0
% 13.4 19.2 12.8 9.3 12.1 12.7
4 Obs. 20.0 18.0 6.0 5.0 23.0 72.0
% 10.0 24.7 5.5 3.1 11.6 9.7
Total Obs. 201.0 73.0 109.0 161.0 198.0 742.0
% 100.0 100.0 100.0 100.0 100.0 100.0
Source: Own census data. Test for significant difference between districts: Pearson chi2(16) = 57.88, Pr < 0.0001.
Table A 18 shows that 44.5% of the groups have used none of the sanctions, 16.7% have used one type of
sanctions, 16.4% have used two types of sanctions, 12.7% three types, and 9.7% have used all four types
of sanctions. This does not mean that each of the sanctions are graduated, however, which is the focus of
the next of Ostrom’s DPs. It shows that monitoring is practiced and punishment for violation of bylaws is
implemented quite widely within the groups. This probably implies that the bylaws are very important for
compliance with the group bylaws.

35
Ostrom’s DP 5: Graduated sanctions
We have assessed the existence of bylaws within groups for not coming to and late arrival to group meetings
and to joint group work activities and the extent to which there are specified graduated sanctions as part of
the bylaws for non-compliance with these. We found that monetary and non-monetary sanctions were
commonly used by groups that have bylaws related to participation in and late arrival to group meetings
and work activities. The non-monetary sanctions varied from simple warnings, to “last warning”, dismissal
from the group, and having to work extra for the group as punishment. The monetary penalties were in most
cases increasing with the number of violations but were in fewer cases the same amount regardless whether
the violation was the first, second or third time. Some had a mixture of non-monetary and monetary
sanctions. For example, there could be only a warning first time but then a monetary sanction the second
and third times. Another common practice was to give a monetary sanction the first two times and then
dismissal the third time. There were also mixed penalties such as combinations of monetary and additional
work obligations or a monetary sanction combined with last warning. There were also a lot of variation in
the monetary amounts that had to be paid across groups and the variation from first to second and third
violation by the same person.
Table A 19 gives an overview of the presence of bylaws for the four types of violations, and whether there
are graduated sanctions in place related to these bylaws.
Table A 19. The existence of bylaws and graduated sanctions for violations of the bylaws Type of behavior Bylaw specifying
penalty for
behavior, % of all
groups
Graduated
sanctions, % of
all groups
Graduated
sanctions, % of
those with
bylaw
Not showing up for group meetings 92.3 81.5 88.3
Late coming to group meetings 84.9 62.4 73.5
Not showing up for group joint work
activities
92.5 72.0 77.8
Late coming to group joint work activities 79.9 58.2 72.8
Source: Own census data.
Table A 19 shows that it is the rule rather than the exception to have bylaws with penalties for violations
(80-93%), while 51-82% of all groups have graduated sanctions for the four types of violations, giving 72-
88% of the bylaws with sanctions applying graduated sanctions.

36
Table A 20. Number of types of graduated sanctions related to participation in group meetings
and group work activities, by district Number of types of
graduated sanctions
Raya
Azebo
Degua
Tembien
Seharti
Samre
Kilite
Awlalo
Adwa Total
0 Obs. 35.0 4.0 22.0 17.0 8.0 86.0
% 17.4 5.5 20.2 10.6 4.0 11.6
1 Obs. 23.0 8.0 6.0 18.0 14.0 69.0
% 11.4 11.0 5.5 11.2 7.1 9.3
2 Obs. 37.0 11.0 25.0 24.0 32.0 129.0
% 18.4 15.1 22.9 14.9 16.2 17.4
3 Obs. 17.0 18.0 16.0 30.0 44.0 125.0
% 8.5 24.7 14.7 18.6 22.2 16.9
4 Obs. 89.0 32.0 40.0 72.0 100.0 333.0
% 44.3 43.8 36.7 44.7 50.5 44.9
Total Obs. 201.0 73.0 109.0 161.0 198.0 742.0
% 100.0 100.0 100.0 100.0 100.0 100.0
Source: Own census data. Test for significant difference between districts: Pearson chi2(16) = 50.75, Pr < 0.0001.
We also assessed the extent to which there is variation in existence of such bylaws and graduated sanctions
across the five districts. We created a sum for the four dummies for the graduated sanctions to assess the
aggregate distribution of the four types across groups and districts.
We can conclude that graduated sanctions are considered an important tool for ensuring compliance with
the group bylaws as 88.4% of the groups have at least one type of graduated sanction in relation to
participation in group meetings and group work activities.
Ostrom’s DP 6: Conflict resolution system
Table A 21 shows that about 25% of the youth groups have experienced at least one dispute and about
12% have experienced a serious dispute. Disputes between the group and some outsiders were more likely
to be of the serious type than disputes within the group.

37
Table A 21. Seriousness of dispute versus who were involved in the dispute
The group
versus some
outsiders
Some group
members
versus
outsiders
Internal
dispute within
the group
No
response Total
No disputes Obs. 0.0 0.0 0.0 554.0 554.0
% 0.0 0.0 0.0 99.6 74.7
Some serious disputes Obs. 41.0 2.0 47.0 0.0 90.0
% 64.1 50.0 39.8 0.0 12.1
Some less serious
disputes
Obs. 23.0 2.0 71.0 2.0 98.0
% 35.9 50.0 60.2 0.4 13.2
Total Obs. 64.0 4.0 118.0 556.0 742.0
% 100.0 100.0 100.0 100.0 100.0 Source: Own census data.
Table A 22 shows that 82.9% of the disputes within the group were resolved within the group itself while
only 19.2% of the disputes between the group and outsiders were resolved among the parties themselves.
As much as 39.7% of the disputes between the groups and outsiders were still unresolved at the time of the
interview while only 3.4% of the within-group disputes were still unresolved.
Table A 22. How were disputes resolved versus who were involved in the dispute How have the disputes been resolved? The group
versus some
outsiders
Some group
members
versus
outsiders
Internal
dispute
within the
group
Total
Solved among the parties themselves Obs. 12.0 1.0 97.0 110.0
% 19.1 25.0 82.9 59.8
Resolved with help of local conflict
mediators
Obs. 4.0 0.0 0.0 4.0
% 6.4 0.0 0.0 2.2
Resolved with help from the Land
Administration Committee
Obs. 5.0 1.0 1.0 7.0
% 7.9 25.0 0.9 3.8
Resolved with help from tabia officials Obs. 11.0 1.0 12.0 24.0
% 17.5 25.0 10.3 13.0
Resolved with help from woreda officials Obs. 6.0 1.0 3.0 10.0
% 9.5 25.0 2.6 5.4
Unresolved Obs. 25.0 0.0 4.0 29.0
% 39.7 0.0 3.4 15.8
Total Obs. 63.0 4.0 117.0 184.0
% 100.0 100.0 100.0 100.0 Source: Own census data.
We also see from Table A 23 that there was a high level of satisfaction (96.6% were satisfied) with how
within-group disputes had been resolved while 23.4% were not satisfied with how the disputes between the

38
group and some outsiders had been resolved. We can conclude that local informal conflict resolution works
well for within-group disputes and only in few cases have they had to get help from community (tabia) or
district (woreda) officials.
Table A 23. Satisfaction with dispute resolution versus who were involved in the dispute Who were involved Satisfied with how the dispute was resolved
No Yes Total
The group versus some outsiders Obs. 15.0 49.0 64.0
Row % 23.4 76.6 100.0
Col % 75.0 29.5 34.4
Some group members versus outsiders Obs. 1.0 3.0 4.0
Row % 25.0 75.0 100.0
Col % 5.0 1.8 2.15
Internal dispute within the group Obs. 4.0 114.0 118.0
Row % 3.4 96.6 100.0
Col % 20.0 68.7 63.44
Total Obs. 20.0 166.0 186.0
Row % 10.8 89.2 100.0
Col % 100.0 100.0 100.0
Source: Own census data.
Ostrom’s DP 7: Institutional recognition: Minimum rights to organize
The youth groups in Tigray have been formed through a formal institutional arrangement as primary
cooperatives and therefore fall under the law of cooperatives. The group is as such an official registered
unit of business with an exclusive number of members, that is provided a demarcated resource it is
responsible for managing in a sustainable way (except for mining where it has a time-limited right to extract
the non-renewable resource). The group has to have a business plan, have an officially elected leadership
team, can apply for joint loans, and to be audited by the cooperative organization. Still, the groups are given
the authority to organize themselves and have their own bylaws. The groups are monitored and provision
of loans and legal documents for their land entitlement depends on good performance and compliance with
the rules for resource management (taking good care of rehabilitated lands). We therefore conclude that the
groups get the minimum rights to organize themselves (Design Principle 7).
Ostrom’s DP 8: Nested enterprises: Common Pool Resource that is part of a larger system
The allocation of rehabilitated communal lands to youth groups in Tigray is clearly a part of a larger plan
for sustainable land management at community, district and regional levels. Parts of the areas allocated to
youth groups are area exclosures that the communities at an earlier stage agreed to protect from resource
extraction while they also invested in the conservation of the areas by building various forms on soil and

39
water conservation structures. Some areas have also been planted with trees. Other areas are rehabilitated
gulley areas. The rehabilitation has thus typically involved labor-intensive investments where labor has
been mobilized through compulsory labor provided by community members, through Food-for-work and
Cash-for-work activities under the Productive Safety Net Program (PSNP) or other food security and
sustainable land management programs.
The community members that have invested a lot of their labor into these communal lands expect also to
get some of the benefits from these investments. It is therefore not obvious that they agree that these lands
are given to youth groups unless they have youth themselves that are included among the beneficiaries.
Therefore, all the youth that have been allocated a rehabilitated area come from the same community as the
area is located. There is variation from community to community in terms of how much land is suitable for
such distribution and that communities also agree to allocate to youth groups. However, the number of
landless youth in each community is growing by the day and community motivation to allocate land to such
youth has therefore also increased. The allocation extends the livelihood options for youth who are more
likely to remain within the community such that outmigration reduces. Most of the youth being part of such
a youth group continue to live with their own family unless they have married and have been able to get a
plot to build their own house if they do not stay with their family. The youth allocated such land are landless
and will therefore not be the ones taking over the land from their parents (landlessness is one of the criteria
for being able to join a youth group).
Appendix 2A. Additional statistical tests and regressions
Correlations between DP indicators
Table A 24. Correlation coefficients for the DP variables DP1 DP2 DP3 DP3b DP4 DP5 DP6
DP1: Encroachment control
system in place
1
DP2: Bylaw regulating sharing
arrangements
0.3105 1
DP3: Bylaw regulating
frequency of meetings
0.2522 0.3388 1
DP3b: All members involved in
decisions
-0.0738 -0.0157 0.0789 1
DP4: Number of bylaws
regulating management
0.2235 0.3425 0.7085 0.167 1
DP5: Number of graduated
sanctions
0.0765 0.2015 0.4205 0.1707 0.6144 1
DP6: Satisfactory conflict
resolution system
-0.0103 0.0199 0.0314 0.0447 0.0223 -0.0035 1
Source: Own census data.

40
Table A 25. Correlations between DPs and control variables: Assessment of endogeneity ODP1 DP2 DP3 DP3b DP4 DP5 DP6
Establishment year & month 0.004 0.001 -0.008d 0.018 -0.017 -0.015 -0.001
Initial member number 0.000 0.000c 0.000 0.002d -0.003 -0.001 0.000
Female share in group at start 0.126a 0.006 0.071d -0.051 0.551b 0.744b 0.038
Gender of group leader, 1=Female -0.047 0.011 -0.007 0.046 0.083 -0.060 -0.017
Distance to road, km 0.001 0.004c -0.001 -0.008 -0.018 -0.032 -0.001
Distance to market, km -0.001 -0.001 -0.001 -0.006d 0.000 0.003 -0.001
Distance to home, min. km -0.002 -0.007 0.000 -0.010 0.011 0.085c 0.003
Input access problems, dummy 0.035d 0.002 -0.007 -0.052 -0.073 -0.108 -0.014
Baseline: No conflicts 0.000 0.000 0.000 0.000 0.000 0.000 0.000
Serious conflict in group, dummy 0.009 0.014 0.035d 0.042 0.178d 0.188 -0.215a
Less serious conflict in group, dummy -0.001 -0.013 0.008 0.103c -0.118 -0.094 0.008
Area allocated per person in group -0.018 0.019 0.006 0.136d 0.220 0.114 0.007
Number of returning migrants 0.004d 0.000 0.001 -0.007 0.002 -0.027c 0.001
Change in key group positions, dummy 0.059a 0.019 0.000 0.015 0.023 -0.115 0.014
Self-selection of group members -0.036b -0.005 -0.028c 0.400a -0.075 -0.222d 0.000
District dummies: Base=Raya Azebo 0.000 0.000 0.000 0.000 0.000 0.000 0.000
Degua Tembien 0.037 0.088a 0.070b -0.032 0.307c 0.207 0.023
Seharti Samre 0.059 0.085a 0.025 0.034 -0.230 -0.160 0.047b
Kilite Awlalo 0.128a 0.047d 0.098b 0.044 0.224d 0.244 0.024
Adwa 0.103a 0.090a 0.037 -0.065 0.125 0.384c -0.017
Activity dummies: Base=Animal rearing 0.000 0.000 0.000 0.000 0.000 0.000 0.000
Beekeeping -0.031 0.001 -0.004 -0.007 0.012 0.047 -0.024
Forest 0.014 -0.015 -0.027 -0.031 -0.171 -0.392 -0.007
Irrigation/Horticult -0.054 0.010 -0.016 -0.022 0.101 -0.047 -0.003
Mining -0.036 0.050 -0.050 0.007 -0.052 -0.221 -0.013
Other 0.028 0.020 0.015 0.417a -0.158 0.090 -0.030
Constant -6.996 -1.035 16.103d -35.296 38.403 32.979 2.919
F value 1.995 0.826 1.546 5.386 2.137 2.712 1.293
Prob > F 0.004 0.699 0.050 0.000 0.002 0.000 0.162
Number of observations 727 727 727 727 726 727 727
R-squared 0.093 0.060 0.051 0.154 0.057 0.066 0.203 Source: Own census data. OLS models for each DP. The table shows marginal effects. Significance levels: d < 0.10, c < 0.05, b < 0.01, a < 0.001.

41
Conflict experience and the DPs
Table A 26 shows the extent of exposure to less serious and more serious disputes among the youth groups.
The results from ordered probit models and multinomial logit models for the DPs’ relationship with less
serious and more serious disputes are presented in Table A 27. Table A 27 demonstrates that the pre-
determined DPs to a small extent are associated with the occurrence of less serious or serious disputes. For
DP3b (all members involved in decisions) we see a positive correlation (significant at 5% level) with the
occurrence of less serious disputes. This could be related to group dynamics. If many members want to
influence decisions this could lead to internal disputes. For DP6 (satisfactory conflict resolution system in
place) there is a strong negative correlation with serious dispute (significant at 0.1% level in the multinomial
logit model while DP was insignificant and with a positive sign in the less serious conflict outcome of the
multinomial model). It is possible that exposure to serious conflicts have exposed awareness of limitations
of the conflict resolution system such that the causality goes from serious conflict to DP6 which is a
perception variable. Many of the serious disputes are related to external agents and could not be handled
adequately by the local conflict resolution system. Many of these disputes are still unresolved.
Table A 26. The extent of conflict experiences of youth groups by 2016
Has the group experienced any conflicts since its establishment?
Variable code Response Freq. Percent Cum.
0 No conflict 554 74.66 74.66
1 Less serious dispute 98 13.21 87.87
2 Serious dispute 90 12.13 100.00 Total 742 100.00
Source: Own census data.
We briefly inspect the control variables in Table A 27. There are significant variations across districts in
the extent of less serious and serious disputes but no significant differences between types of main activities
of the youth groups. Self-selection of youth group members was associated with lower probability of
(serious) disputes. Less serious disputes were also more likely to groups established earlier rather than later.
This could be because the aggregate probability of conflicts occurring may increase over time but could
also be due to less experience with formation of groups at an early stage of this large-scale social
experiment. Serious conflicts were also positively associated with the area allocated per youth. If the value
of the land is increasing with the area, there may be more conflicts and competition over a larger land
resource.

42
Table A 27. Ordered probit and Multinomial logit models for factors associated with groups
having had serious and less serious disputes Ordered Multinomial logit model
probit Less serious
dispute
Serious
dispute
DP1: Encroachment control system in place 0.114 0.432 -0.062
DP2: Bylaw regulating sharing arrangements 0.106 -0.497 0.785
DP3: Bylaw regulating frequency of meetings 0.477 1.167 1.021
DP3b: All members involved in decisions 0.299c 0.753c 0.307
DP4: Number of bylaws regulating management 0.012 -0.276 0.202
DP5: Number of graduated sanctions -0.022 -0.038 -0.030
DP6: Satisfactory conflict resolution system -2.573a 14.818 -4.476a
Establishment year and month -0.072c -0.207b -0.099
Number of initial members in group 0.003 0.002 0.006
Gender youth group leader, female=1 dummy -0.158 -0.875d 0.010
Distance to road, km -0.056c -0.072 -0.128d
Distance to market, km 0.014 0.042d 0.016
Distance to home, min. km 0.017 0.026 0.028
Input access problems, dummy 0.173 0.231 0.343
Share of females in group at start -0.358 0.084 -1.081
Land area per person allocated to group, ha 0.570c 0.864 1.391c
Number or returning migrants in group 0.002 -0.013 0.001
Self-selection of group members, dummy -0.324c -0.125 -0.922c
District dummies: Base=Raya Azebo 0.000 0.000 0.000
Degua Tembien -0.143 1.726b -1.559c
Seharti Samre 0.116 1.104d -0.131
Kilite Awlalo -0.278 0.553 -1.059c
Adwa 0.295d 2.140a -0.296
Activity dummies: Base=Animal rearing 0.000 0.000 0.000
Beekeeping -0.047 0.095 -0.150
Forest 0.013 0.359 -0.304
Irrigation/Horticulture 0.017 0.319 -0.182
Mining -0.092 0.581 -0.449
Other -0.171 1.429 -13.377
Constant 397.295 200.320
cut1 constant -146.913c cut2 constant -146.312c Wald chi2 138.883 198.088
Prob > chi2 0.000 0.000
Number of observations 726 726
Source: Own census data. Significance levels: d < 0.10, c < 0.05, b < 0.01, a < 0.001. Coefficients are relative
risk ratios in the multinomial logit.
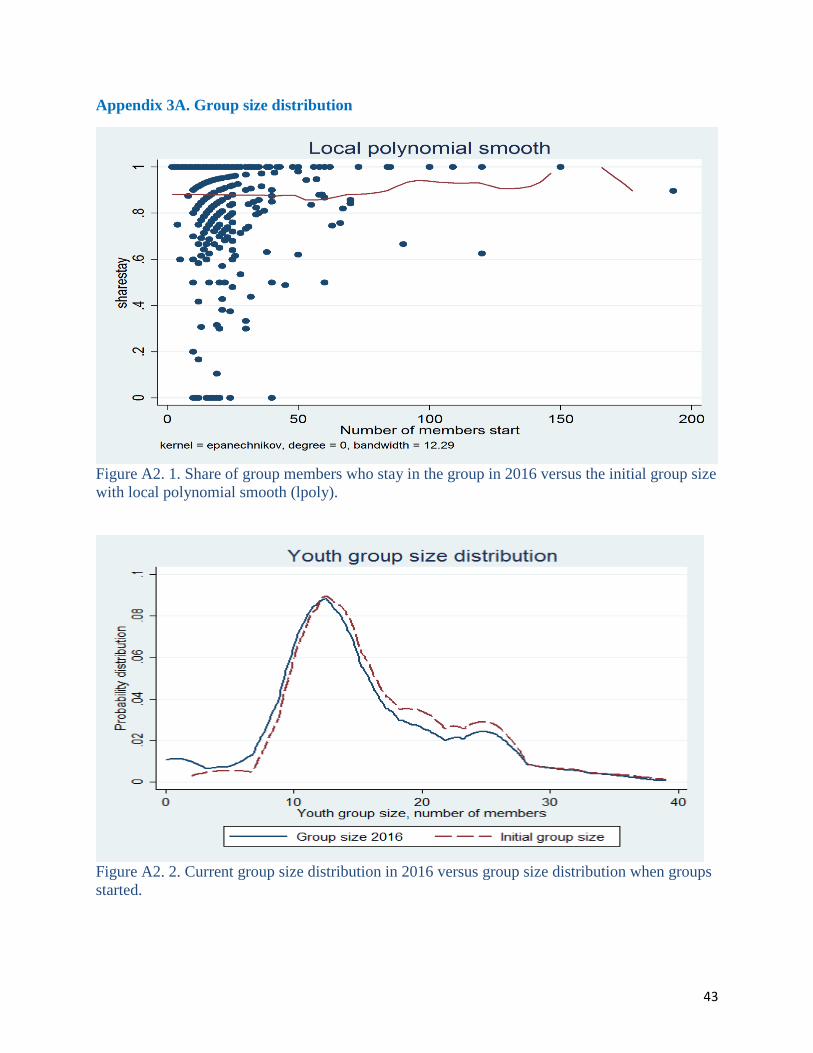
43
Appendix 3A. Group size distribution
Figure A2. 1. Share of group members who stay in the group in 2016 versus the initial group size
with local polynomial smooth (lpoly).
Figure A2. 2. Current group size distribution in 2016 versus group size distribution when groups
started.