the importance of benchmarking1 © 2004 supply chain visions – all rights reserved upply hain...
TRANSCRIPT

upplyhain isions
®V© 2004 Supply Chain Visions– All Rights Reserved
Mike LedyardPartner
Supply Chain Visions
Continental Traffic Service, Inc.9th Annual Client Focus Group
May 19th 2004
Benchmarking

1© 2004 Supply Chain Visions – All Rights Reserved
upplyhain isions
®V
In This Session…
Lessons from the Real World
Ten Steps to Benchmarking
Measuring Up

2© 2004 Supply Chain Visions – All Rights Reserved
upplyhain isions
®V
Lessons Learned in the Real World
If you are not going to take action based on the results, don’t measure it!
In other words, “Don’t measure what you won’t change!”
Key questions that must be asked and answered:Will I change my behavior, or ask my people to change their behaviors, based on this measure?Does the potential benefit to be gained from this information exceed the cost of obtaining it?
You will have a greater immediate impact measuring loading factors and utilization of contracted carriers than total cost to serve
Build from key components up to the overall process measures, but know where you are going before you begin

3© 2004 Supply Chain Visions – All Rights Reserved
upplyhain isions
®V
10 Step Path to Benchmarking Success 1
Articulate your strategy Determine your critical processesDevelop process measuresIdentify your Key Performance Indicators (KPI’s)Collect your dataResearch “best in class”Compare performance levelsDetermine reasons for low performanceIdentify action initiativesContinuous improvement
1 Ledyard and Vitasek, “To Benchmark, Or Not, Is Not Really A Question,”CTSI Logistics Forum, Vol. 5, No. 1, pp. 1-3

4© 2004 Supply Chain Visions – All Rights Reserved
upplyhain isions
®V
Strategy Comes First
“Would you please tell me which way I ought to go from here? “ asked Alice.“That depends a good deal on where you want to get to.”“I really don’t know,” replied Alice.“Then it doesn’t matter which way you go,” said the cat.
Lewis CarrollAlice's Adventures in Wonderland

5© 2004 Supply Chain Visions – All Rights Reserved
upplyhain isions
®V
Profitable Growth
Profitable Growth
Increase Retail / Direct Sales
Increase Retail / Direct Sales
Increase Wholesale Sales
Increase Wholesale Sales
Business Objectives
Strategic ImperativesNew ProductsNew Products
Measures of Success
Mission-Critical
Initiatives
Tactical Plans
Tactical Plans Support Strategy
Tactical plans are derivatives in support of identified goals and objectivesScorecards measure Critical Success Factors

6© 2004 Supply Chain Visions – All Rights Reserved
upplyhain isions
®V
CustomerSupplier
Logistics Functions
Focal Company
Planning,Forecasting &
Scheduling
Value-addedConversionProcesses
Information
Sourcing &Procurement
Fulfillment
Determine Critical Processes
ProductsCash
ServicesSourcing &
Procurement
Fulfillment
Information
Keebler, Manrodt, Durtsche and Ledyard (1999), Keeping Score: Measuring the Business Value of Logistics in the Supply Chain, Chicago, IL: The Council of Logistics Management
A Process View of the Supply Chain

7© 2004 Supply Chain Visions – All Rights Reserved
upplyhain isions
®V
Process Measures vs. Results Measures
Results MeasuresUsually functionally orientedUsually focused on one aspect of a process Measures components of a process – but not the whole processIf left unchecked, drive suboptimization
Process MeasuresAre usually company-wide or customer focusedAre cross functional in nature (and sometimes cross company)Measure the “total effect” of a processDrive overall optimization of costs and customer satisfaction

8© 2004 Supply Chain Visions – All Rights Reserved
upplyhain isions
®V
Task
Task
Task
Activity
Function
Develop Process Measures
The composition of a process measure is based on the composition of the process being measured
Activity
Task
Task
Task
Function
Activity
Task
Task
Task
Function
Process
Activity Activity Activity
Task
Task
Task
Task
Task
Task
Task
Task
Task

9© 2004 Supply Chain Visions – All Rights Reserved
upplyhain isions
®V
Cycle Time – Make-to-Stock
Fulfillment Cycle Time
Order Entry & Processing
Delivery and Receipt
Shi
pmen
t Dat
e
Rec
eipt
by
Cus
tom
er
Order Pick / Pack / Ship
Ord
ers
Pic
ked/
Hou
r
Ave
rage
Ord
er
Siz
e
Ord
ers
Pro
cess
ed/W
k
Ord
er R
ecei
pt &
V
erifi
catio
n
Ord
er E
ntry
into
S
yste
m
Ord
ers
Pro
cess
ed/H
r
Ord
ers
Rec
eive
d/W
k

10© 2004 Supply Chain Visions – All Rights Reserved
upplyhain isions
®V
Measures Drive Behaviors
- How much did it cost to fill the order?
- Cross functional view to work with OM and Manufacturing and Transportation
- Overall order accuracy and quality – including invoicing
- 95% Perfect Order Fulfillment
Best
Does Not Consider
Kinds of Behavior Created
Measure
- How much did it cost to fill the order?
- Customer complaints (quality or accuracy)
- Did it arrive when the customer wanted?
- How much did it cost to fill the order
- Cycle time up or down the supply chain (tail)
- Customer complaints (quality or accuracy)
- Cross functional view to work with OM and Manufacturing
- Large inventories on hand to prevent out of stocks
- Expedited orders to manufacturing
- Airfreight shipments- Large inventories on
hand to prevent out of stocks
- 97% On Time to Customer Request
- 98% Fill Rate for a Distribution Center in 48 hours
BetterBad

11© 2004 Supply Chain Visions – All Rights Reserved
upplyhain isions
®V
Logistics Measures in Context
Cash-to-cash cycle timeNet asset turnover, return on net assets
Days of inventory in entire supply chain by activityTotal safety stocks as % of total inventorySafety (hedge) stocks by customer Dedicated inventories by customer Local support inventories
Inventory turnover Days of inventoryReturn on investmentReturn on assets
Asset Utilization
Perfect order fulfillment (right item, right qty, right place, right time, defect free, correct documentation)Overall customer satisfaction
On-time delivery to commit, requestOrder cycle time variabilityOrder processing accuracyForecasting accuracyPlanning accuracyManufacturing schedule adherenceStockouts against forecast
Fill rates by customer, commodityAvailable for customer pickup per requestErrors by line item, activity, reason code, etc.Cycle count accuracy
Reliability
Upside production flexibilityForecasting/planning cycle time% Expedite requests fulfilled Order fulfillment lead time
Backlog & back ordersAggregate cycle times by activityOrder cycle time Lead time from order receipt to manufacturer complete
Order fulfillment lead time by customer, commodityFill rates by customer, commodity% Expedite requests fulfilled by customerCapacity load & utilization
Flexibility & Responsiveness
Total supply chain management cost as a percentage of salesTotal delivered cost
Logistics costs (order mgmt + distribution + freight) as a percentage of salesFreight costs as a percentage of sales to customerDistribution costs as a percentage of salesInventory shrink and obsolescence as a percent of salesLabor productivity analysis Over, short, damage as % of salesReturns as a percentage of sales
Costs per line, per order, per activity, per shift, etcLoad factors, lines per order, qty per line, etc.Freight costs per pound by mode and destination
Cost
Strategic MeasuresProcess MeasuresResults Measures
Companies should strive for “balanced” measures that are more process and strategic in nature
© 2003 Supply Chain Visions – All Rights Reserved
(as published in Jan 2003 issue of Logistics Management)

12© 2004 Supply Chain Visions – All Rights Reserved
upplyhain isions
®V
What Gets Measured Gets Managed
Concentrate on measuring the right things – second emphasis on measuring them in the most efficient manner
Segmentation is essential – by market, product, and/or customerDon’t try to “boil the ocean”
Focus on areas of greatest concern, or greatest painMeasuring anything that does not directly affect profitability, productivity or safety only adds burden while diverting attention from that which is truly important

13© 2004 Supply Chain Visions – All Rights Reserved
upplyhain isions
®V
Implementation – Select the Measures
Determine which 3-4 metrics are critical to your success of your functional teamCreate value add statements that are substantially under your team or area’s control and contain measurable performance goals
Our team adds value by maintaining 98.36% or better on-time and in-
full shipments
Our team adds value by ensuring that our
supplier quality is at or above 99.67%
Our team adds value by maintaining 99.21% or
better accuracy on material procurement
VVA (Validate the Value Add) Statements

14© 2004 Supply Chain Visions – All Rights Reserved
upplyhain isions
®V
On Time and In Full Shipments
94%
96%
98%
100%
Jan Feb Mar Apr May Jun Jul Aug Sep Oct Nov Dec
Begin Measuring
Summarize data so that results are obvious Make it easy to see if goals are being metInclude historical data to track trends

15© 2004 Supply Chain Visions – All Rights Reserved
upplyhain isions
®V
Research Best in Class
Benchmarking – Two ViewpointsOnly by understanding how your performance compares to others in your industry can you identify where improvement efforts will be beneficial
The only benchmarks that matter are your customer’s expectations

16© 2004 Supply Chain Visions – All Rights Reserved
upplyhain isions
®V
Best-in-Class Companies Are Like Decathletes
Top ranking athletes across a set of eventsAccumulate the most points among all eventsWin some events, but not allKnow their own strengths and weaknessesKnow the strengths and weaknesses of competitorsFocus training first on events that match their relative strengths & events which they feel they can or must winSpend remainder of training time and energy on the remaining events to assure they are minimally competitive in all events
Best-in-ClassCompanies
Decathletes
Top ranking companies across a processesBeats competitors in most areas, not allIs not best-in-class in every performance category, but wins in areas that match their strategies and prioritiesKnow their own competencies, strengths, and weaknessesLikewise, know the same about their competitorsSpend most of their resources in those areas which in which theymust excel (in accordance with competitive knowledge, customer and stakeholder requirements, and business strategies)Minimally competitive in every performance category
Source: Performance Measurement Group

17© 2004 Supply Chain Visions – All Rights Reserved
upplyhain isions
®V
A Pareto chart shows where to focus your effortsOften, your failures are caused by another group! This data helps point you in the right directionAsk “Why” 5 times, if necessary
Understand Why You Are Not Meeting Your Goals
Late Order Reason Codes
0
5
10
15
20
25
30
35
Purch Documents BM Quality Picking Carrier Admin

18© 2004 Supply Chain Visions – All Rights Reserved
upplyhain isions
®V
Take Action
Taking action will help drive change to improve your performanceSharing your VVA data helps mitigate emotions and finger pointingExplore all actions to solve the problem
We are working with Purchasing to:
1) Determine which suppliers have slipped
2) Actively issue Corrective Actions for suppliers with late shipments
3) Ensure all supplier Statement of Works/Contracts have receiving goals outlined
19© 2004 Supply Chain Visions – All Rights Reserved
upplyhain isions
®V
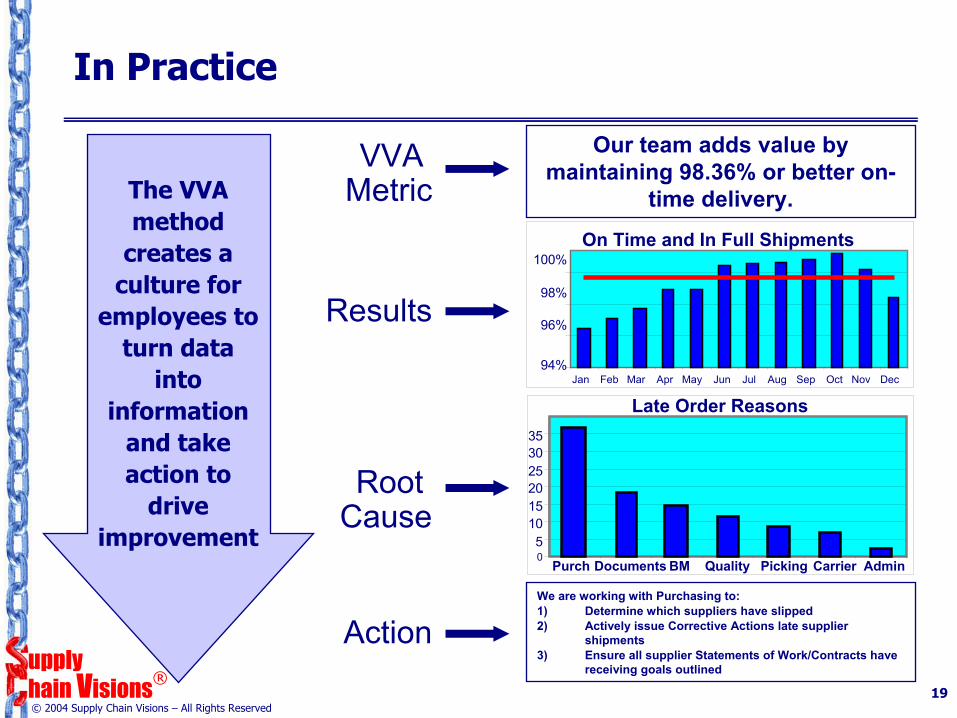
In Practice
Our team adds value by maintaining 98.36% or better on-
time delivery.
Root Cause
Action
Results
VVA Metric
On Time and In Full Shipments
94%
96%
98%
100%
Jan Feb Mar Apr May Jun Jul Aug Sep Oct Nov Dec
Late Order Reasons
05
101520253035
Purch Documents BM Quality Picking Carrier Admin
We are working with Purchasing to:1) Determine which suppliers have slipped 2) Actively issue Corrective Actions late supplier
shipments3) Ensure all supplier Statements of Work/Contracts have
receiving goals outlined
The VVA method
creates a culture for
employees to turn data
into information
and take action to
drive improvement

20© 2004 Supply Chain Visions – All Rights Reserved
upplyhain isions
®V
Keep In Mind…
The greatest measures not used are not worth spending the timeDrive a culture that are “believers” in measures and not just “collectors” or “posters”Develop and foster an environment that utilizes performance measures
Involve employeesActively discuss improvement areasDrive improvement of the business and not just pay for performance
Information does not guarantee action No “end” to supply chain improvements
Today’s exceptional service becomes tomorrow’s minimum cost of doing business
You cannot fix that which you cannot measure

How Do You Measure Up?
© 2004 Supply Chain Visions – All Rights Reserved
upplyhain isions
®V