the impacts of brand management practices on brand
TRANSCRIPT
THE IMPACTS OF BRAND MANAGEMENT PRACTICES ON BRAND PERFORMANCE
AND FIRM VALUE
By
Yanhui Zhao
A DISSERTATION
Submitted to
Michigan State University
in partial fulfillment of the requirements
for the degree of
Business Administration—Marketing—Doctor of Philosophy
2016

ABSTRACT
THE IMPACTS OF BRAND MANAGEMENT PRACTICES ON BRAND PERFORMANCE
AND FIRM VALUE
By
Yanhui Zhao
Brands are among the most important of firm assets, serving as crucial sources of competitive
advantage. The realization of such competitive advantage requires effective, robust, and flexible
brand management practices that accommodate internal and external contingencies. My
dissertation uses two essays to investigate how a selection of brand management practices
influences brand performance and firm value. Essay 1 employs two studies to examine cross-
category variation in the effect of marketing mix variables on brand sales and brand equity.
Empirical evidence from analyzing Information Resources, Inc. scanner data (study 1) and
consumer survey data (study 2) suggests that brand relevance in category (BRiC) – a product
category characteristic – interacts with marketing mix decisions (e.g., product variety,
distribution coverage) to affect brand sales and brand equity. The focus of Essay 2 is rebranding
strategies that aim to update a firm’s brand image by changing brand identity or brand strategy.
Empirical evidence from analyzing 229 rebranding events shows that, on average, rebranding
initiatives are associated with positive abnormal stock returns. More importantly, these financial
returns can be predicted by the degree of rebranding and the fit between the degree of rebranding
and competitive factors (firm competitive position and industry competition intensity).

iii
TABLE OF CONTENTS
LIST OF TABLES…………………………………………………………… ………….….…… v
LIST OF FIGURES…………………………………………… …………………………….….. vi
CHAPTER 1 ………………………………………………………………… ………………..….1
Brand Relevance in Category and Marketing Mix Impacts……… ………………………1
Literature Review on Marketing Mix Influences………………… ……………………....5
Effects of Marketing Mix Variables on Objective Performance Metrics… ..……..6
Effects of Marketing Mix Variables on Subjective Performance Metrics…….…..8
Cross-Category Variation in the Effects of Marketing Mix…… ………………....9
Model and Hypotheses…………………………………………………………….……..10
BRiC and Product Variety…………………………………………………… ….11
BRiC and Brand Price……………………………………………………………12
BRiC and Promotional Activities ……………………………………… ……….13
BRiC and Distribution Coverage…………………………… …………………...16
Study 1: Marketing Mix Variables × BRiC →Brand Sales ………… …………………17
Data………………………………………………………………………… …....17
Measures…………………………………………………………………… …....18
Analysis…………………………………………………………………………..19
Results………………………………………………………………… ………....21
Study 2: Marketing Mix Variables × BRiC → Brand Equity …………………… …….24
Data Collection…………………………………………………………… ...…...24
Questionnaire Structure and Measures……………… ………………………..…25
Measurement Validity……………………………………………………………25
Model Estimation…………………………………………………………… …...26
Results ………………………………………………………………… ……...…27
Discussion ………………………………………………… ………………………...…..29
Theoretical Implications………………………………………………… ………30
Managerial Implications………………………… ………………………………32
Limitations and Future Research………………………… ……………………...33
APPENDICES ………………………………… ……… ………………………………..35
APPENDIX A: TABLES …………………………………… ……...… …….….36
APPENDIX B: FIGURES ………… …………………………… …….…...……42
APPENDIX C: Study 2 Measures ……………… ………………… ……………44
REFERENCES……………………………… ………………………………….……….46
CHAPTER 2 …………………………………………………………………………… .………51
Rebranding and Firm Value: An Event Study on Abnormal Returns to Rebranding
Announcements…………………………………………………………………..............51
Literature Review ………….……………………………………………………….……55
What is Rebranding? ……………………………………………………… …….55
Why Rebrand? ……………………………………………………..…………………..56
So What? …………………………………………………… ………….……..…58

iv
Conceptual Framework and Hypotheses …… ……………………………………..……59
Two Dimension of Rebranding…………………………………………………..60
The Impact of Competitive Factors on Rebranding……………………………...61
How Rebranding Affects Future Shareholder Value…………………… ……….63
The Fit between the Degree of Rebranding and Competitive Factors … ……..…66
Data and Method……………………………………………… …………………………68
Data Sources………………………………………………………… …………..68
Measures of Key Variables…………………………………………… …………69
Measures of Additional Variables………………… …………………………….73
Analysis……………………………………………………………….………….76
Hypotheses Testing……… ………………………………………………………...…….77
Hypothesis Testing: Model-Free Evidence………………………………………77
Hypothesis Testing: Degree of Rebranding Results……………………… …..…77
The Worth of Rebranding………………………………… ……………………..78
Hypothesis Testing: Abnormal Returns Results……………………………. ..….79
Robustness Tests…………………………………………………… ……………82
Discussion……………………………… ……………………………………………..…82
Theoretical Implications……………………………………………………. ..….84
Managerial Implications…………………………………………… …………....86
Limitations and Future Research……………………… ………………………...89
APPENDICES………… ……………………………………………………..………….91
APPENDIX A: TABLES…………………... ……………………… ………..….92
APPENDIX B: FIGURES……………………...… …… … ……………………..99
REFERENCES…………………………………..…………………………………………....102

v
LIST OF TABLES
Table 1-1: Descriptive Statistics and Correlations (Study 1)……………………….……………36
Table 1-2: Variance Estimates of Null Models for All Level 1 Variables (Study 1)……… ……37
Table 1-3: Three-Level Mixed Effect Model Results (Study 1, DV: Brand Sales)…………. …..38
Table 1-4: Best Linear Unbiased Predictions of Random Slopes…………………… ….……….39
Table 1-5: Descriptive Statistics and Correlations (Study 2)…………………………………….40
Table 1-6: Two-Level HLM Results (Study 2, DV: Brand Equity)…………… ………………..41
Table 2-1: Variable Operationalization…………………………………………. ..……………..92
Table 2-2: Correlations and Descriptive Statistics……………………………….………………94
Table 2-3: Degree of Rebranding Results (Path Model Part 1)…………………….……… ……96
Table 2-4: Abnormal Returns and Test Statistics Across Various Event Windows… ……..……97
Table 2-5: Abnormal Returns Results (Path Model Part 2)……………………………….… …..98
vi
LIST OF FIGURES
Figure 1-1: Conceptual Model……………………….………………………………..……… …42
Figure 1-2: Predicted Effects of Marketing Mix Variables in Different Categories…… ……….43
Figure 2-1: Research Model……………………………………………………………….……..99
Figure 2-2: Degree of Rebranding and Examples………………………………………………100
Figure 2-3: Interactions between Degree of Rebranding and Competition Factors…….. ….… 101
1
CHAPTER 1
Brand Relevance in Category and Marketing Mix Impacts
To survive in the fiercely competitive consumer packaged goods (CPG) industry, both
manufacturers and retailers have continuously employed marketing mix elements in extreme
ways. Given the strategic importance of marketing mix variables, it is not surprising that the
outcomes of marketing mix have been heavily researched. Ample evidence has shown that
marketing mix decisions have strong effects on brand sales (Bayus and Putsis, 1999; Boulding,
Lee, and Staelin, 1994) and customer-based brand equity (Yoo, Donthu, and Lee, 2000; Buil, de
Chernatony, and Martinez, 2013).
Prior research has demonstrated not only that marketing mix variables significantly
contribute to brand sales, but also that the contribution varies across product categories (Fader
and Lodish, 1990; Narasimhan, Neslin, and Sen, 1996). Research trying to identify category-
level moderators has been fruitful. Category penetration, inter-purchase times, price levels, the
number of brands, and consumer propensity to stockpile have been identified as key category
variables that moderate the effect of marketing mix variables on brand sales (Fader and Lodish,
1990; Narasimhan, Neslin, and Sen, 1996). Close scrutiny of this stream of literature suggests
that the category-level moderators identified are not exhaustive. One key category-level factor
identified by brand scholars, brand relevance in category (BRiC), has been missing from the
study of cross-category variation in marketing mix effects.
Building on the notion that consumers usually employ marketing mix variables as
extrinsic brand quality cues, a stream of literature on the effects of marketing mix variables on
brand equity has found that marketing mix variables can have very different, sometimes even
opposite, effects on brand equity (Yoo, Donthu, and Lee, 2000; Buil, de Chernatony, and
2
Martinez, 2013). For example, advertising expenditures and distribution channel expansion are
positive brand quality cues and thus encourage the growth of brand equity, while frequent price
promotion is a negative brand quality cue and thus undermines brand equity. Although the above
findings are interesting and managerially relevant, absent from this stream of literature is a
discussion of whether and how the influence of marketing mix variables on brand equity varies
across product categories.
To fill the above-mentioned literature gaps, we propose and empirically test a model
highlighting BRiC’s role in influencing the effectiveness of marketing mix decision variables.
BRiC is a concept that has recently emerged from the brand management literature. It refers to
“the importance of brand for consumer decision making” (Fischer, Volckner, and Sattler, 2010,).
Fischer, Volckner, and Sattler (2010) noted that the overall importance of brands for consumer
decision making differs across product categories. For example, consumers care more about
brand name when buying razors or shampoo, while caring less about brand name when buying
paper towels, toilet paper, or pencils. Because BRiC pertains to the importance of brand for
consumer decision making and consumers’ reaction to marketing mix variables is greatly
influenced by brand perception, there is a reason to speculate that marketing mix variables
interact with BRiC (cross-level interaction) to influence brand sales (examined in study 1) and
brand equity (examined in study 2).
The contribution of this research is threefold. First, we propose and validate a new
measure of BRiC that can be computed using secondary sales data. BRiC was originally
measured using Fischer, Volckner, and Sattler’s (2010) five-item survey scale. When using the
original survey scale, researchers directly ask consumers to indicate the importance of brand
name when purchasing from a specific product category. This scale is a valid measure of the

3
manifest motive of pursuing named brands. However, such a survey measure is less powerful in
capturing latent motives (Hawkins and Mothersbaugh, 2012). For some consumers, pursuing
named brands might be a latent motive (e.g., consumers may be reluctant to admit that brand
name drives their purchases). In these cases, the original survey measure cannot capture
consumers’ motive for pursuing named brands. To overcome this problem, we propose a new
proxy measure of BRiC that uses consumers’ actual choices to infer consumers’ brand-name-
seeking motives.
Second, we contribute to the stream of research on the effects of marketing mix variables
on brand sales by modeling BRiC as a category-level moderator to explain residual cross-
category variance. BRiC is a concept introduced by Fischer, Volckner, and Sattler (2010), which
refers to the overall importance of brand for consumers’ purchases in a specific product category.
Fischer et al. (2010) revealed the general importance of the new concept. However, its relevance
for marketing mix decisions is still unclear. We attempt to estimate how the average increase in
brand sales resulting from these marketing mix elements can be explained by BRiC. To do this,
we first compile a dataset covering 138,027 quarterly observations of brand-level sales, prices,
product varieties, distribution coverages, feature advertisements, displays, price promotions of
7,680 brands across 31 CPG categories from scanner data provided by Information Resources,
Inc. (IRI). By testing a three-level mixed effect model, study 1 shows that including BRiC in
estimating marketing mix variables’ effect on brand sales explains significant additional variance
in brand sales. This supports our claim that BRiC is an influential category-level variable that has
been overlooked in prior research on the effects of marketing mix decisions.
Third, to the best of our knowledge, we are the first to examine the cross-category
variation in the effects of marketing mix variables on customer-based brand equity. Keller (1993)

4
suggested that customer-based brand equity stems from brand knowledge while the creation of
brand knowledge is affected by customers’ exposure to a brand’s marketing activities. Prior
research has found evidence that marketing mix variables serve as extrinsic quality cues and thus
affect customer-based brand equity (Yoo et al., 2000; Buil et al., 2013; Pappu and Quester,
2008). For example, research has found that frequent price reduction may hurt a brand in the
long term because it conveys an image of unstable product quality (Winer, 1986), whereas
advertising expenditures may help establish long-term brand associations and grow brand equity
(Yoo et al., 2000). While identifying factors that influence brand equity is a major priority for
scholars and managers (Buil et al., 2013; Baldauf et al., 2009; Valette-Florence, Guizani, and
Merunka 2011), identifying the conditions under which the influence is strong or weak should be
at least equally important. However, close scrutiny of the existing research reveals significant
research gaps regarding cross-category variation in the effect of marketing mix variables on
brand equity. Such research gaps raise crucial questions about how to design an effective
marketing mix in different product categories if building customer-based brand equity is a
primary business goal. With these practical questions and business goals in mind, we test a
multilevel model using hierarchical linear modeling (HLM) and survey data collected from 933
consumers across 29 product categories. The results provide support for our claims that (1)
significant cross-category variation exists in the impact of marketing mix variables on customer-
based brand equity and (2) BRiC can explain this variation.
We believe this research has significant managerial implications for brand management
and product category management. Given resource constraints, when making marketing mix
decisions and allocating resources to marketing activities in various product categories,
marketing managers responsible for multiple product categories should assess and compare the

5
returns from marketing activities across categories. Such comparison is necessary to ensure the
highest possible returns from limited marketing resources.
Our multi-study research presented here is structured in the following manner. We first
introduce the main effects of marketing mix variables on brand sales and brand equity. Given
that prior literature has provided support for these relationships, this introduction is brief and
only serves as a basis to develop focal cross-level interaction hypotheses. We then discuss study
1, which focuses on the effect of the cross-level interaction on brand sales. This is followed by
discussion of study 2, which focuses on the effect of the cross-level interaction on brand equity.
We conclude with contributions of this study and discussion of both managerial implications and
directions for future research.
Literature Review on Marketing Mix Influences
The literature on marketing mix influences can be organized into three major streams:
(1) Research on the effect of marketing mix variables on objective performance metrics
(e.g., sales, profits)
(2) Research on the effect of marketing mix variables on subjective performance metrics
(e.g., brand equity)
(3) Research on the effect of marketing mix variables on individual consumer behavior
(i.e., consumer choices)
We devote most of our review to articles in the first two streams because the principal issue we
investigate deals with cross-category variation in the effect of marketing mix on brand sales
(study 1) and brand equity (study 2). In this section, we review prior research on a selection of
marketing mix variables, including product variety, price, advertising or feature advertising,
6
price promotion, in-store displays, and distribution coverage. Although these variables do not
embrace every element of a marketing mix, they demonstrate the effects of marketing mix
variables.
Effects of Marketing Mix Variables on Objective Performance Metrics
Product variety. Product variety refers to the number of differentiated product variations
a brand offers in a product category (Ataman, Van Heerde, and Mela, 2010). A high level of
product variety is common in the CPG industry. Many brands rely on a high level of product
variety (or “product proliferation” strategy) to compete in the CPG industry. For example,
Procter & Gamble, a product proliferation strategy pioneer, has at least 15 products under its
Crest brand, including Crest Pro-Health Intensive Clean, Crest Pro-Health Whitening Gel, and
Crest Pro-Health Clinical Gum Protection.
Product variety directly contributes to brand sales (Bayus and Putsis, 1999; Ataman, Van
Heerde, and Mela, 2010). The underlying rationale is evident: (1) Product variety should increase
a firm’s share of retail shelf space and thus increase the chance of products being selected by
consumers (Mason and Milne, 1994) and (2) a larger number of differentiated product variations
generates strong attraction for a wider range of consumers (especially those with high desire to
seek variety) and high deterrence of new entries. Of course, too much product variety may
backfire. As the number of product variations continues to grow, it becomes increasingly hard
for the firm to continually segment the market. The likely outcome is the product cannibalization
phenomenon; that is, newly added product variations compete with the brand’s old products and
the new products’ customers are existing customers of the brand (Mason and Milne, 1994).
7
Price. Economics theory provides strong support for the negative relationship between
brand price and brand sales. When brand price increases, consumer demand for the brand
decreases correspondingly.
Price promotion. The literature has long recognized that price promotion is the
predominate form of competition in the CPG industry (e.g., Walters and MacKenzie, 1988).
Ample evidence suggests that price reductions affect consumer purchase decisions. Increased
sales in response to price reductions can stem from two major sources: (1) Current brand
customers may stockpile due to the price reductions and (2) competitors’ customers may switch
to the brand temporarily (Hawkins and Mothersbaugh, 2012).
Feature advertising. Feature advertising refers here to the weekly advertising of products
in newspaper inserts and store fliers. Feature advertising is more cost-efficient than TV
advertising in communicating product information to customers (Srinivasan and Bodapati, 2006).
The effects of feature advertisements on brand sales are well studied in prior research (Zhang,
Wedel, and Pieters, 2009; Blattberg, Briesch, and Fox, 1995; Dhar, Hoch, and Kumar, 2001). For
brands, feature advertising is informative advertising. A brand uses feature advertising to inform
consumers of the brand’s availability, price, and discounts. Thus, feature advertising affects
consumer purchase decisions through its effect on consumer attention (Zhang, Wedel, and
Pieters, 2009; Stegeman, 1991). For retailers, feature advertising attracts customers from
competitors and builds store traffic and volume (Srinivasan and Bodapati, 2006).
In-store displays. In-store displays are also used to inform consumers of product
availability, prices, and discounts. It is well documented in the literature that in-store displays
positively affect brand sales (e.g., Chevalier, 1975).
8
Distribution coverage. One of the key aspects of channel management in the CPG
industry is deciding how many stores or retail outlets through which to sell the products in a
given geographic area (Stern, El-Ansary, and Coughlan, 1996). If a brand is distributed in a large
number of stores, we say that the brand has high distribution coverage. Obviously, distribution
coverage affects brand sales. After a brand expands to a new geographic area and is available in
a larger number of stores, brand sales can increase dramatically (Aaker, 1996; Frazier, 1999;
Frazier and Lassar, 1996).
Effects of Marketing Mix Variables on Subjective Performance Metrics
Product variety. Prior research suggests that product variety is an important extrinsic cue
that consumers use to infer brand quality (e.g., Berger, Draganska, and Simonson 2007). A high
degree of product variety within a brand can be an indicator of the brand’s strength and
popularity, which reduces consumers’ perceived risk in purchasing.
Price. Consumers use price as an indicator or reference of product quality. The literature
documents that consumers perceive a high-priced brand as having higher quality and higher
value (Rao and Monroe, 1989). Thus, price has a positive association with brand equity (Yoo,
Donthu, and Lee, 2000).
Price promotion. Prior research suggests a negative impact of price promotion on
customer-based brand equity. Frequent price promotions convey a low-quality brand image
(Winer, 1986) and, thus, eventually erode brand equity (Yoo, Donthu, and Lee, 2000).
Advertising. Advertisements have been identified as major tools for a firm to build
customer-based brand equity (Keller and Lehmann, 2003; Sriram and Kalwani, 2007). The
content and frequency of advertising affect different elements of brand equity. By using various
content appeals, a brand can communicate its functional and emotional value to consumers and

9
build strong, favorable brand associations in consumers’ minds (Buil, de Chernatony, and
Martinez, 2013; Yoo, Donthu, and Lee, 2000). The frequency of advertising also affects brand
awareness and brand recall. Intense advertising programs capture consumers’ attention,
improving consumers’ ability to recognize and recall the brand (Yoo et al., 2000; Buil et al.,
2013). Consumers also use the intensity of advertising programs as a quality cue (Milgrom and
Roberts, 1986; Kirmani and Rao, 2000). Consumers usually perceive brands with high
advertising intensity as reliable (e.g., Moorthy and Hawkins, 2005).
In-store display. Prior research has not studied the influence of a brand’s in-store display
on brand equity.
Distribution coverage. High distribution coverage is associated with higher customer
satisfaction as it reduces consumers’ effort and time spent in purchasing and makes it convenient
for consumers to buy (Yoo, Donthu, and Lee, 2000; Ataman, Van Heerde, and Mela, 2010).
Research has found that consumers perceive high utility and value for intensively distributed
brands (Yoo, Donthu, and Lee, 2000). Also, distribution coverage is associated with perceived
product quality as high coverage indicates higher brand power and reputation (Fein and
Anderson, 1997).
Cross-Category Variation in the Effects of Marketing Mix
A general agreement seems to exist among managers and scholars that consumers display
different reactions to marketing mix activities when purchasing in different categories. Certain
marketing mix variables are more effective in driving brand sales in some categories than others.
For example, an industry report by IRI suggests that a 15% price reduction accompanied by
feature advertisements increased sales of the promoted toilet tissue product by 440.5%. The same
promotion for a pasta brand increased sales by 198.1% and that for a deodorant brand yielded an
10
increase of 102.0%. Thus, category-level analysis is important for both manufacturers and
retailers to make more informed marketing mix decisions regarding resource allocation among
marketing activities.
Prior research on cross-category variation in marketing mix effectiveness has been
fruitful. Curhan (1974) found that slow-selling fruits were more affected by changes in display
space than fast-selling items. Using an experiment, Chevalier (1975) provided further support by
showing strong differences in display effectiveness across product categories. Fader and Lodish
(1990) studied 331 product categories and reported that categories with higher category
penetration, shorter inter-purchase times, higher private label share, and lower price levels had
higher volume sold due to price deals. Narasimhan, Neslin, and Sen (1996) studied 108 product
categories and used data compiled from weekly scanner data. These authors reported that CPG
categories with fewer numbers of brands, higher category penetration, shorter inter-purchase
times, and higher consumer propensity to stockpile had higher promotional elasticities.
Srinivasan et al.’s (2004) research revealed that manufacturer revenue elasticities are higher in
categories with lower private-label share, for impulse-buying products, and in categories with
few stock keeping units (SKUs).
Model and Hypotheses
Given the research findings presented in the literature review, it is not surprising that
manufacturer and retailer management has given – and continues to give – considerable attention
regarding resource allocation to marketing mix activities across categories. To provide
understanding around such decisions, we propose a conceptual model (Figure 1) that highlights

11
the moderating effect of BRiC on the effect of marketing mix variables on brand sales (H1a-
H6a) and brand equity (H1b-H6b).
BRiC and Product Variety
The contribution of product variety to brand sales is contingent on the likelihood and
severity of product cannibalization. We expect that the problem of product cannibalization may
be more severe in high-BRiC categories than in low-BRiC categories. Cannibalization occurs
when newly added product variations compete with a brand’s existing products. In high-BRiC
categories, brand name plays an important role in consumer decision making (Fischer, Völckner,
and Sattler, 2010). Hence, when purchasing from high-BRiC categories, consumers are loyal to
certain brands in repeat purchases. Thus, it is difficult for new product variations to attract new
consumers from competing brands. As a result, the primary consumers who purchase newly
added product variations are old customers loyal to the brand. Conversely, when buying from
low-BRiC categories, consumers make decisions not based on brand name but on other factors
such as function, price, and design. Because consumers are less loyal to certain brands, the
problem of cannibalization is less severe. As a result, the magnitude of the sales increase
associated with adding product variations is less constrained by cannibalization in lower BRiC
categories. More formally,
H1a: The positive effect of product variety on brand sales is weaker in product categories
characterized by high BRiC than those characterized by low BRiC.
Even though BRiC negatively moderates the effect of product variety on brand sales, it
may nonetheless positively moderate its effect on customer-based brand equity. Research has
suggested that consumers use product variety as an important quality cue (Berger, Draganska,
and Simonson 2007). It is not surprising that consumers perceive a brand offering a high degree

12
of product variety or occupying a large proportion of shelf space as a powerful and popular
brand. This perception greatly reduces consumer perception of purchase risk. In a high-BRiC
category, the role played by product variety as a quality cue is even more salient. This is because
in high-BRiC categories where consumer decisions are driven by brand name, consumers rely on
such indicator to infer a brand’s quality. Such inference is less important in low-BRiC categories
because consumer decisions are not evidently affected by brand name, and consumers do not
need such indicator to infer brand quality. More formally,
H1b: The positive effect of product variety on brand equity is stronger in product
categories characterized by high BRiC than those characterized by low BRiC.
BRiC and Brand Price
Price elasticity of demand is usually negative, meaning that a negative relationship exists
between brand price and brand unit sales. However, such negative relationship may be strong or
weak in different product categories. We propose that the negative relationship is weaker (less
negative) in high-BRiC categories than in low-BRiC categories because consumers are less
sensitive to price changes when brand name plays a salient role in their purchase decision
(Erdem, Swait, and Louviere 2002). When purchasing in a high-BRiC category where brand
name is important, consumers are willing to pay a higher price premium for the brand name than
when purchasing in a low-BRiC category where brand name is less important (Fischer,
Völckner, and Sattler, 2010). Accordingly, consumer choices are less sensitive to price changes
in categories characterized by higher BRiC. For example, beer is a typical high-BRiC category
where consumers regard brand name as important. A 5% increase or decrease in a beer brand’s
price may not change either its own or its competitors’ consumers’ choices significantly because
consumers tend to stay loyal to certain brands. When we look at the milk category where
13
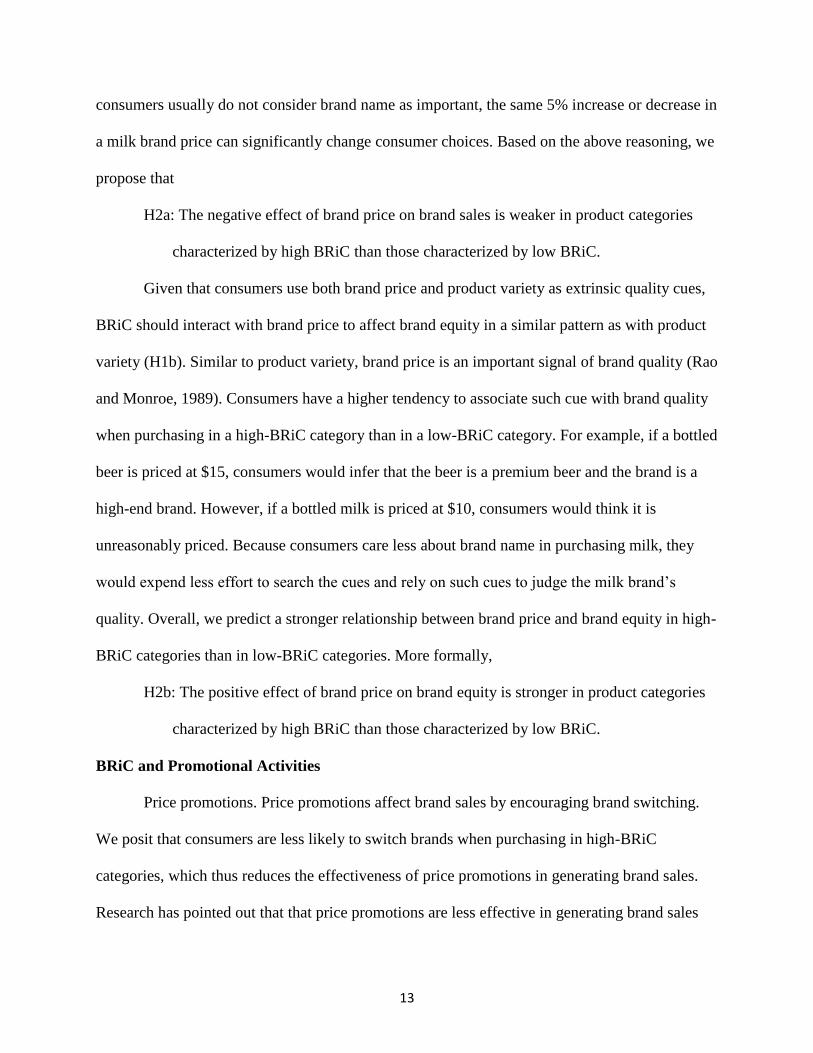
consumers usually do not consider brand name as important, the same 5% increase or decrease in
a milk brand price can significantly change consumer choices. Based on the above reasoning, we
propose that
H2a: The negative effect of brand price on brand sales is weaker in product categories
characterized by high BRiC than those characterized by low BRiC.
Given that consumers use both brand price and product variety as extrinsic quality cues,
BRiC should interact with brand price to affect brand equity in a similar pattern as with product
variety (H1b). Similar to product variety, brand price is an important signal of brand quality (Rao
and Monroe, 1989). Consumers have a higher tendency to associate such cue with brand quality
when purchasing in a high-BRiC category than in a low-BRiC category. For example, if a bottled
beer is priced at $15, consumers would infer that the beer is a premium beer and the brand is a
high-end brand. However, if a bottled milk is priced at $10, consumers would think it is
unreasonably priced. Because consumers care less about brand name in purchasing milk, they
would expend less effort to search the cues and rely on such cues to judge the milk brand’s
quality. Overall, we predict a stronger relationship between brand price and brand equity in high-
BRiC categories than in low-BRiC categories. More formally,
H2b: The positive effect of brand price on brand equity is stronger in product categories
characterized by high BRiC than those characterized by low BRiC.
BRiC and Promotional Activities
Price promotions. Price promotions affect brand sales by encouraging brand switching.
We posit that consumers are less likely to switch brands when purchasing in high-BRiC
categories, which thus reduces the effectiveness of price promotions in generating brand sales.
Research has pointed out that that price promotions are less effective in generating brand sales
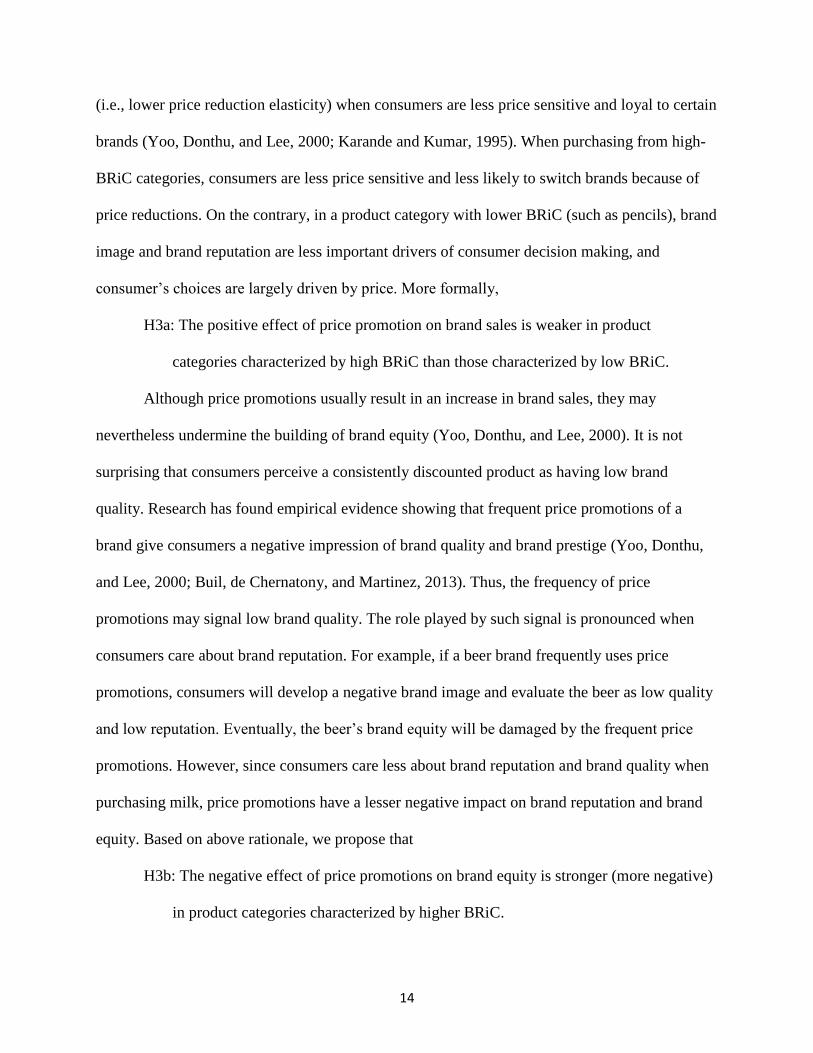
14
(i.e., lower price reduction elasticity) when consumers are less price sensitive and loyal to certain
brands (Yoo, Donthu, and Lee, 2000; Karande and Kumar, 1995). When purchasing from high-
BRiC categories, consumers are less price sensitive and less likely to switch brands because of
price reductions. On the contrary, in a product category with lower BRiC (such as pencils), brand
image and brand reputation are less important drivers of consumer decision making, and
consumer’s choices are largely driven by price. More formally,
H3a: The positive effect of price promotion on brand sales is weaker in product
categories characterized by high BRiC than those characterized by low BRiC.
Although price promotions usually result in an increase in brand sales, they may
nevertheless undermine the building of brand equity (Yoo, Donthu, and Lee, 2000). It is not
surprising that consumers perceive a consistently discounted product as having low brand
quality. Research has found empirical evidence showing that frequent price promotions of a
brand give consumers a negative impression of brand quality and brand prestige (Yoo, Donthu,
and Lee, 2000; Buil, de Chernatony, and Martinez, 2013). Thus, the frequency of price
promotions may signal low brand quality. The role played by such signal is pronounced when
consumers care about brand reputation. For example, if a beer brand frequently uses price
promotions, consumers will develop a negative brand image and evaluate the beer as low quality
and low reputation. Eventually, the beer’s brand equity will be damaged by the frequent price
promotions. However, since consumers care less about brand reputation and brand quality when
purchasing milk, price promotions have a lesser negative impact on brand reputation and brand
equity. Based on above rationale, we propose that
H3b: The negative effect of price promotions on brand equity is stronger (more negative)
in product categories characterized by higher BRiC.

15
Research has provided rich evidence showing that feature advertisements and in-store
displays can increase the sales of a product (Zhang, Wedel, and Pieters, 2009; Blattberg, Briesch,
and Fox, 1995; Dhar, Hoch, and Kumar, 2001). The purpose of using feature advertisements and
in-store displays is to build a communication channel to inform consumers of product
information, especially price promotions. As we argued for price promotions, the same pattern of
interactions should be expected for BRiC and feature advertising and for BRiC and in-store
displays. More formally,
H4a: The positive effect of feature advertising on brand sales is weaker in product
categories characterized by high BRiC than those characterized by low BRiC.
H5a: The positive effect of in-store displays on brand sales is weaker in product
categories characterized by high BRiC than those characterized by low BRiC.
Advertisements in general contribute to the building of brand equity (Yoo, Donthu, and
Lee, 2000; Buil, de Chernatony, and Martinez, 2013). We suggest that this contribution is even
more pronounced in high-BRiC categories than in low-BRiC categories. When consumer care
about brand reputation and use brand name to guide their decision making, they have the need to
collect information either actively or passively though external media. The information role
played by advertisements is more significant for the judgment of brand quality in high-BRiC
categories. Moreover, advertising intensity is sometimes used by consumers as an extrinsic
quality cue. Consumers consider brands with high advertising expenditures as powerful and
reliable and such quality cue is more important for consumers in assessing brand quality and
brand reputation in high-BRiC categories than in low-BRiC categories. More formally,
16
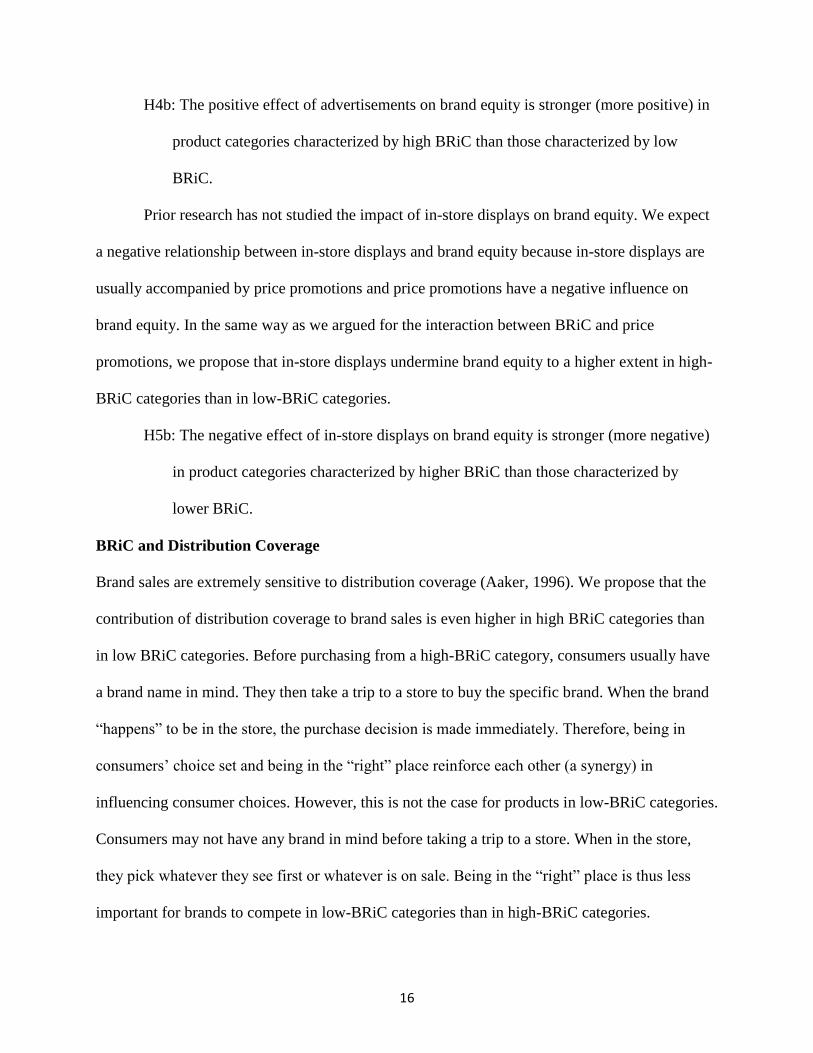
H4b: The positive effect of advertisements on brand equity is stronger (more positive) in
product categories characterized by high BRiC than those characterized by low
BRiC.
Prior research has not studied the impact of in-store displays on brand equity. We expect
a negative relationship between in-store displays and brand equity because in-store displays are
usually accompanied by price promotions and price promotions have a negative influence on
brand equity. In the same way as we argued for the interaction between BRiC and price
promotions, we propose that in-store displays undermine brand equity to a higher extent in high-
BRiC categories than in low-BRiC categories.
H5b: The negative effect of in-store displays on brand equity is stronger (more negative)
in product categories characterized by higher BRiC than those characterized by
lower BRiC.
BRiC and Distribution Coverage
Brand sales are extremely sensitive to distribution coverage (Aaker, 1996). We propose that the
contribution of distribution coverage to brand sales is even higher in high BRiC categories than
in low BRiC categories. Before purchasing from a high-BRiC category, consumers usually have
a brand name in mind. They then take a trip to a store to buy the specific brand. When the brand
“happens” to be in the store, the purchase decision is made immediately. Therefore, being in
consumers’ choice set and being in the “right” place reinforce each other (a synergy) in
influencing consumer choices. However, this is not the case for products in low-BRiC categories.
Consumers may not have any brand in mind before taking a trip to a store. When in the store,
they pick whatever they see first or whatever is on sale. Being in the “right” place is thus less
important for brands to compete in low-BRiC categories than in high-BRiC categories.
17
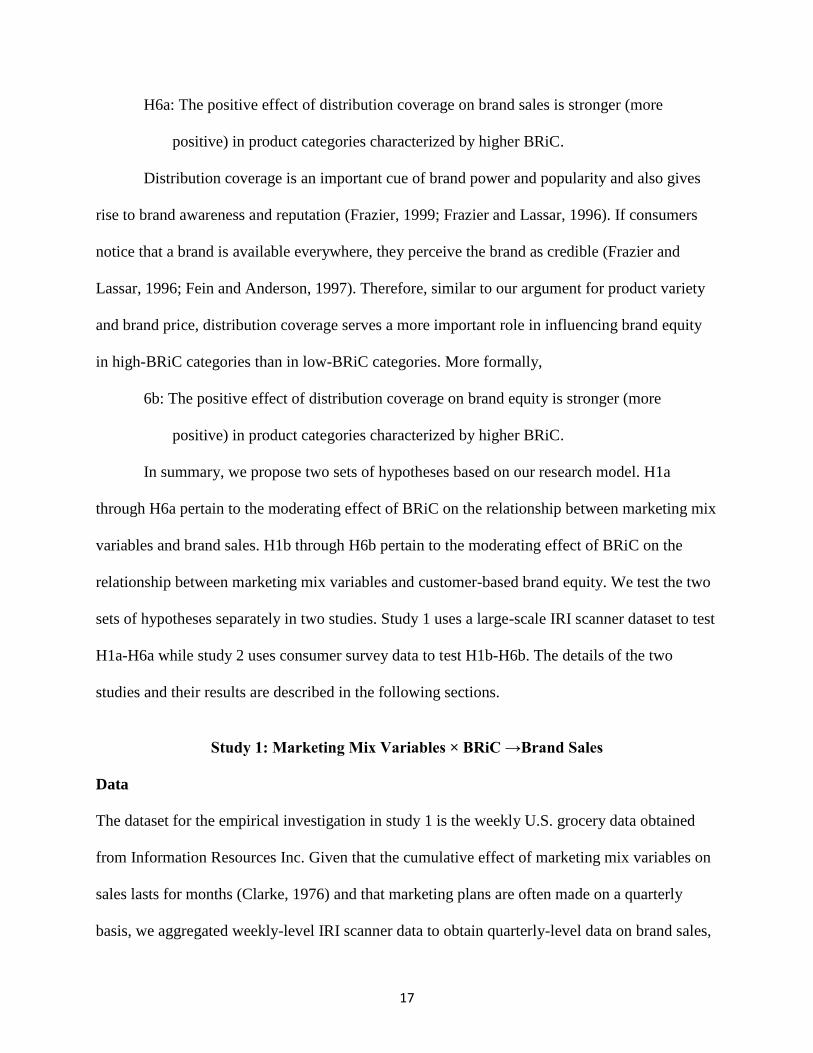
H6a: The positive effect of distribution coverage on brand sales is stronger (more
positive) in product categories characterized by higher BRiC.
Distribution coverage is an important cue of brand power and popularity and also gives
rise to brand awareness and reputation (Frazier, 1999; Frazier and Lassar, 1996). If consumers
notice that a brand is available everywhere, they perceive the brand as credible (Frazier and
Lassar, 1996; Fein and Anderson, 1997). Therefore, similar to our argument for product variety
and brand price, distribution coverage serves a more important role in influencing brand equity
in high-BRiC categories than in low-BRiC categories. More formally,
6b: The positive effect of distribution coverage on brand equity is stronger (more
positive) in product categories characterized by higher BRiC.
In summary, we propose two sets of hypotheses based on our research model. H1a
through H6a pertain to the moderating effect of BRiC on the relationship between marketing mix
variables and brand sales. H1b through H6b pertain to the moderating effect of BRiC on the
relationship between marketing mix variables and customer-based brand equity. We test the two
sets of hypotheses separately in two studies. Study 1 uses a large-scale IRI scanner dataset to test
H1a-H6a while study 2 uses consumer survey data to test H1b-H6b. The details of the two
studies and their results are described in the following sections.
Study 1: Marketing Mix Variables × BRiC →Brand Sales
Data
The dataset for the empirical investigation in study 1 is the weekly U.S. grocery data obtained
from Information Resources Inc. Given that the cumulative effect of marketing mix variables on
sales lasts for months (Clarke, 1976) and that marketing plans are often made on a quarterly
basis, we aggregated weekly-level IRI scanner data to obtain quarterly-level data on brand sales,

18
product variety, prices, feature advertisements, price reductions, in-store displays, and
distribution coverage. Our final large-scale dataset consisted of 138,027 quarterly observations
of 7,680 brands across 31 CPG categories over five years.
Measures
Brand relevance in category. Our operationalization of BRiC is related to the concept of brand
equity. Aliawadi, Lehmann, and Neslin (2003) operationalized “brand equity” as the revenue
premium of a named brand over a store brand and calculated it as the difference between the
revenue of the named brand and that of the store brand. The rationale is that if consumers display
a more favorable behavioral response to a named brand’s products than to equivalent unbranded
products, then the brand is seen as having high brand equity. Building upon these authors’ idea,
we propose a proxy measure of BRiC on the product category level. We posit that if consumers
display more favorable behavioral responses to named brands than to store brands when
purchasing from a product category, then the purchases in that product category are substantially
affected by brand name and thus that product category has high BRiC. In product categories with
high BRiC, purchase decisions are highly affected by brand name and consumers are willing to
pay a higher price premium. Therefore, the extent to which named brands outsell store brands is
a reasonable proxy for BRiC. Based on this operationalization, we recommend the following
formula to calculate BRiC for category i:
BRiC =Total Sales of Named Brands in Category i−Total Sales of Store Brands in Category i
Total Sales of Store Brands in Category i
This new proxy measure of BRiC was later validated in study 2 by examining its correlation with
the original survey measure developed by Fischer, Völckner, Henrik, and Sattler (2010).
19
Brand price. Brand price is computed by averaging the prices of all SKUs of a
brand.
Product variety. In line with Ataman, Van Heerde, and Mela (2010), product
variety is measured as the number of SKUs of a brand.
Frequency of price promotions, feature advertisements, and in-store displays. The
frequency of three types of promotional activities were computed by aggregating weekly
promotional activities reported in IRI data.
Distribution coverage. Distribution coverage of a brand was measured as the
number of stores selling any SKUs of the brand.
Control variables. Category penetration, inter-purchase times, price levels, the
number of brands, and higher consumer propensity to stockpile are category-level
moderators that influence the effect of marketing mix variables. However, the model is too
complex if we control every moderating effect (5 moderators × 6 independent variables =
30 interactions). To construct a parsimonious model, we only included two category-level
characteristics, the number of brands in a product category (Category Size) and the average
price of a product category (Category Price), and their interactions with marketing mix
variables in the analysis.
Analysis
Our dataset comprises three levels of observations because (1) quarterly observations were
nested in (2) brands which were also nested in (3) categories. Ordinary least squares is
inappropriate for analyzing multilevel data because it gives biased estimates. A three-level
mixed-effect model was used to account for the nonindependence among observations and to test
the cross-level interactions between BRiC and marketing mix elements. Level 1 captures the

20
variance within brands and consists of repeated observation of each brand’s sales, product line
depth, price reductions, feature advertisements, in-store displays, and distribution coverage.
Level 2 captures the variance between brands. Level 3 captures variance between CPG
categories and consists of the measure of BRiC. We specify our model via a three-stage
formulation using the notation of Raudenbush and Bryk (2002). The level 1 model for quarter i,
brand j, and category k is specified as
log(BS)ijk = π0jk + π1jklog(PRICE)ijk + π2jklog(VARIE)ijk + π3jklog(ADVER)ijk + π4jklog(DISPL)ijk
+ π4jklog(REDUC)ijk + π6log(DISTR)ijk + εijk
where BS is brand sales; PRICE is average brand price; VARIE denotes number of product
variations of a brand; ADVER is the frequency of feature advertisements of a brand; DISPL
denotes the frequency of in-store displays; REDUC denotes the frequency of price reductions;
and DISTR is the number of distributors of a brand in quarter i.
The following level 2 model specification allows the intercept π0jk and slopes π1jk in the level 1
model to vary between brands:
π0jk = β00k + r0jk
π1jk = β10k + r1jk
π2jk = β20k + r2jk
π3jk = β30k + r3jk
π4jk = β40k + r4jk
π5jk = β50k + r5jk
π6jk = β60k + r6jk
The following level 3 model specification allows intercept β00k and slopes β10k ~60k to vary
between product categories:
β00k = γ000 + γ001BRiCk + γ002CategorySizek + γ003CategoryPricek + u0k
β10k = γ100 + γ101BRiCk + γ102CategorySizek + γ103CategoryPricek + u1k
β20k = γ200 + γ201BRiCk + γ202CategorySizek + γ203CategoryPricek + u2k
β30k = γ300 + γ301BRiCk + γ302CategorySizek + γ303CategoryPricek + u3k
β40k = γ400 + γ401BRiCk + γ402CategorySizek + γ403CategoryPricek + u4k
β50k = γ500 + γ501BRiCk + γ502CategorySizek + γ503CategoryPricek + u5k

21
β60k = γ600 + γ601BRiCk + γ602CategorySizek + γ603CategoryPricek + u6k
A reduced-form model of the above specification is estimated using the xtmixed command in
Stata 13.0.
Results
Table 1 displays descriptive statistics and correlations. To calculate within-brand level (level 1)
correlations, we first obtained regression coefficients from multilevel analyses between one
predictor and one criterion at level 1 and then standardized the regression coefficients.
Correlations at level 1 are shown below the diagonal in Table 1. Correlations above the diagonal
are at category level, with level 1 variables averaged across 20 quarters of observations and
across different brands. Interestingly, we found a marginally significant correlation between the
proposed new measure of BRiC and category price level (r=0.33, p<0.1), as well as between
BRiC and the number of brands in a category (r=0.41, p<0.1). Considering that (1) higher
category price is positively related to higher consumer purchase involvement, and thus higher
BRiC, and (2) manufacturers are more motived to use larger brand portfolios in high-BRiC
categories than in low-BRiC categories, the significant correlations make logical sense and
provide evidence of criterion validity of the new measure.
We first estimated a series of null models to partition the amount of variance at each
level. In the null models, simple regressions with each level 1 variable as an outcome variable
(without level 1, 2, or 3 predictors) were conducted. The variance estimations of null models are
shown in Table 2. As Table 2 shows, at level 1, a substantial amount of variance exists in each
variable, indicating that a brand’s quarterly amount of each variable (e.g., brand sales, feature
advertisements) differed. Level 2 had a significant amount of variance in each variable between
brands within categories, meaning that brands in the same category differed in their average level
22
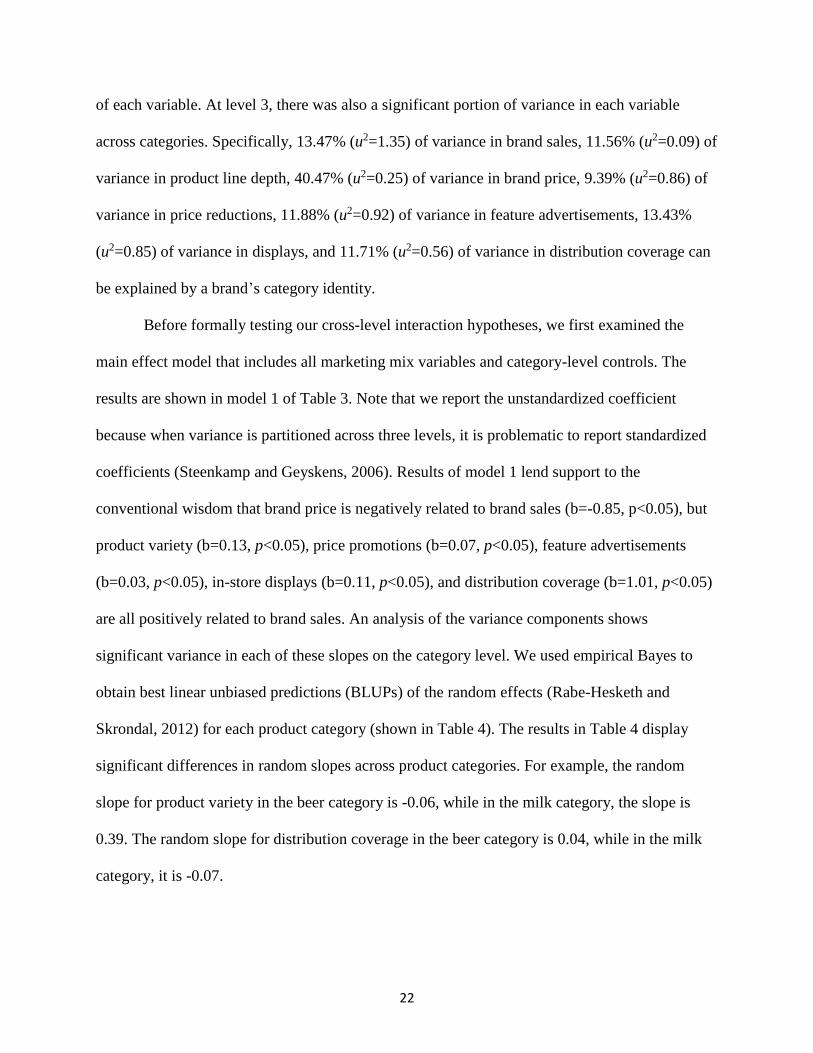
of each variable. At level 3, there was also a significant portion of variance in each variable
across categories. Specifically, 13.47% (u2=1.35) of variance in brand sales, 11.56% (u2=0.09) of
variance in product line depth, 40.47% (u2=0.25) of variance in brand price, 9.39% (u2=0.86) of
variance in price reductions, 11.88% (u2=0.92) of variance in feature advertisements, 13.43%
(u2=0.85) of variance in displays, and 11.71% (u2=0.56) of variance in distribution coverage can
be explained by a brand’s category identity.
Before formally testing our cross-level interaction hypotheses, we first examined the
main effect model that includes all marketing mix variables and category-level controls. The
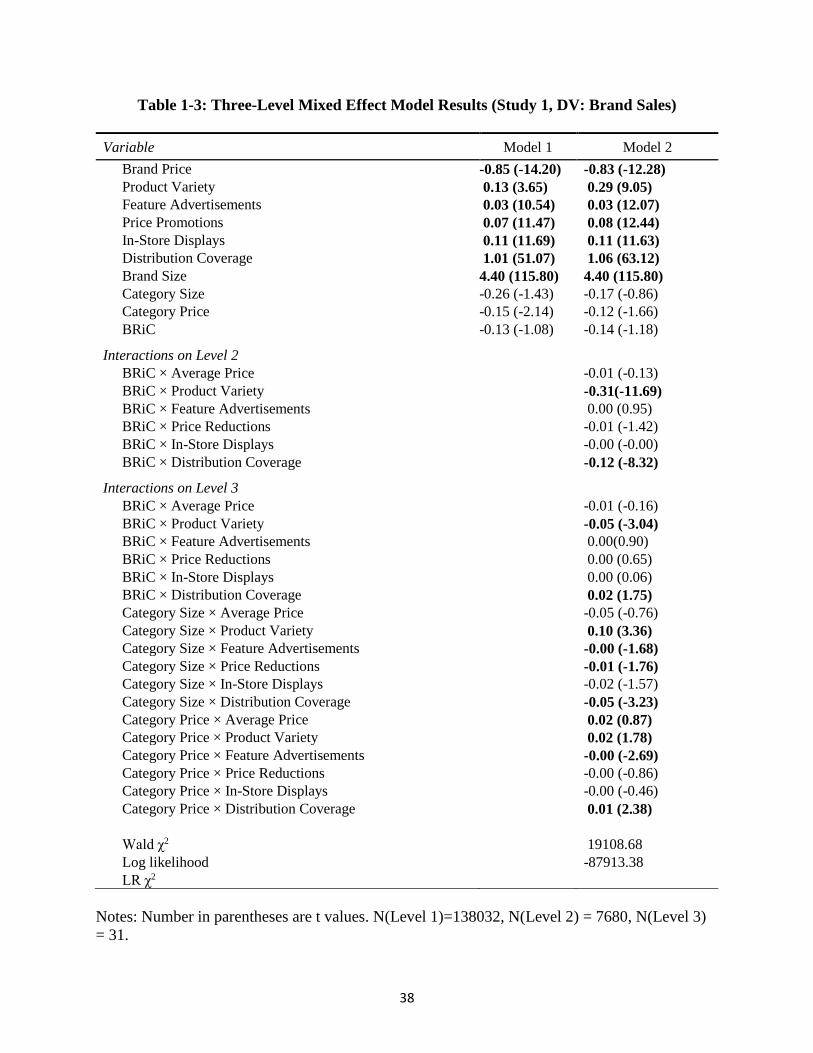
results are shown in model 1 of Table 3. Note that we report the unstandardized coefficient
because when variance is partitioned across three levels, it is problematic to report standardized
coefficients (Steenkamp and Geyskens, 2006). Results of model 1 lend support to the
conventional wisdom that brand price is negatively related to brand sales (b=-0.85, p<0.05), but
product variety (b=0.13, p<0.05), price promotions (b=0.07, p<0.05), feature advertisements
(b=0.03, p<0.05), in-store displays (b=0.11, p<0.05), and distribution coverage (b=1.01, p<0.05)
are all positively related to brand sales. An analysis of the variance components shows
significant variance in each of these slopes on the category level. We used empirical Bayes to
obtain best linear unbiased predictions (BLUPs) of the random effects (Rabe-Hesketh and
Skrondal, 2012) for each product category (shown in Table 4). The results in Table 4 display
significant differences in random slopes across product categories. For example, the random
slope for product variety in the beer category is -0.06, while in the milk category, the slope is
0.39. The random slope for distribution coverage in the beer category is 0.04, while in the milk
category, it is -0.07.
23
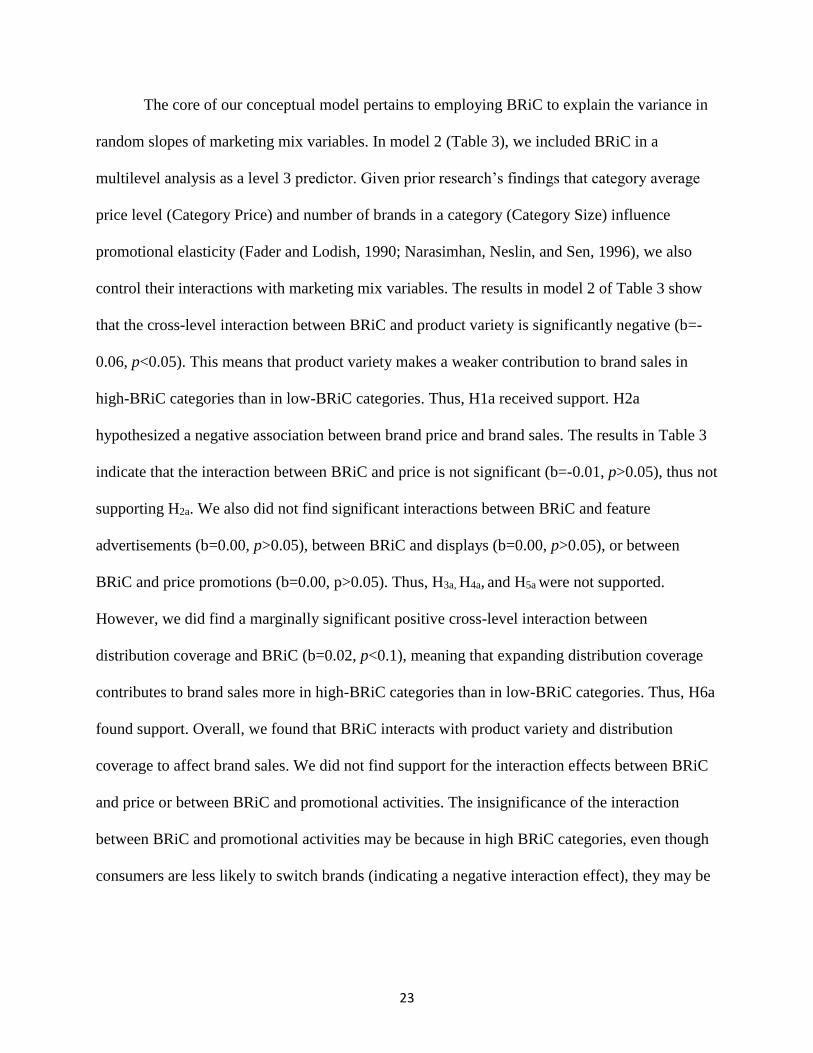
The core of our conceptual model pertains to employing BRiC to explain the variance in
random slopes of marketing mix variables. In model 2 (Table 3), we included BRiC in a
multilevel analysis as a level 3 predictor. Given prior research’s findings that category average
price level (Category Price) and number of brands in a category (Category Size) influence
promotional elasticity (Fader and Lodish, 1990; Narasimhan, Neslin, and Sen, 1996), we also
control their interactions with marketing mix variables. The results in model 2 of Table 3 show
that the cross-level interaction between BRiC and product variety is significantly negative (b=-
0.06, p<0.05). This means that product variety makes a weaker contribution to brand sales in
high-BRiC categories than in low-BRiC categories. Thus, H1a received support. H2a
hypothesized a negative association between brand price and brand sales. The results in Table 3
indicate that the interaction between BRiC and price is not significant (b=-0.01, p>0.05), thus not
supporting H2a. We also did not find significant interactions between BRiC and feature
advertisements (b=0.00, p>0.05), between BRiC and displays (b=0.00, p>0.05), or between
BRiC and price promotions (b=0.00, p>0.05). Thus, H3a, H4a, and H5a were not supported.
However, we did find a marginally significant positive cross-level interaction between
distribution coverage and BRiC (b=0.02, p<0.1), meaning that expanding distribution coverage
contributes to brand sales more in high-BRiC categories than in low-BRiC categories. Thus, H6a
found support. Overall, we found that BRiC interacts with product variety and distribution
coverage to affect brand sales. We did not find support for the interaction effects between BRiC
and price or between BRiC and promotional activities. The insignificance of the interaction
between BRiC and promotional activities may be because in high BRiC categories, even though
consumers are less likely to switch brands (indicating a negative interaction effect), they may be

24
more likely to stockpile (i.e., consumers buy ahead of their anticipated future needs, indicating a
positive interaction effect). The positive interaction and negative interaction cancel each other.
To better illustrate how the effects of product variety and distribution coverage on brand
sales vary across product categories, we split product categories by the median of BRiC (proxy
measure) into high-BRiC categories and low-BRiC categories, and reran analyses on the two
subsamples. The results are shown in Figure 2 Panel A and Panel B. As Figure 2 Panel A shows,
product variety has a higher impact on brand sales in low-BRiC categories (b=0.15, p<0.05) than
in high-BRiC categories (b=0.11, p<0.05). Figure 2 Panel B shows that distribution coverage has
a higher impact on brand sales in high-BRiC categories (b=1.04, p<0.05) than in low-BRiC
categories (b=0.98, p<0.05).
Study 2: Marketing Mix Variables × BRiC → Brand Equity
Data Collection
A pilot study was first conducted to examine the level of familiarity of consumers with each of
the 31 product categories and each of the marketing mix variables. The pilot study suggested that
a large proportion of consumers had no or limited purchase experience with cigarettes and photo-
related products. Therefore, these two categories were not included in the second study.
Moreover, the pilot study suggested that consumers had difficulty in understanding what feature
advertisement is. Therefore, we did not include feature advertisement in study 2. Instead, we
collected data on advertising mail, with which regular consumers are more familiar. Consumer
respondents for study 2 were recruited through Amazon Mechanical Turk (MTurk). Qualified
respondents were those who had recently purchased any products in a given product category
25
and were able to recall the name of the brand purchased. Approximately 30 responses were
collected for each of the 29 product categories, which yielded a sample size of 933.
Questionnaire Structure and Measures
The questionnaire started with a screening question asking whether a consumer had
recently purchased in a product category (e.g., beer, milk). This was followed by a four-item
scale of BRiC. Then the consumer was asked to recall and write down the name of the brand
he/she purchased. The rest of the questionnaire comprised questions asking the consumer’s
perceptions about the purchased brand’s product variety, overall price level, price promotion
frequency, advertising intensity, in-store display intensity, advertising mail frequency,
distribution coverage, and overall evaluation of brand equity. All these measures were adapted
from Yoo, Donthu, and Lee (2000). See the appendix for the specific items used for the beer
category. Survey items for the other 28 categories are similar. We measured BRiC using the
proxy measure of BRiC we proposed in study 1 as well as the original survey measure of BRiC
developed by Fischer, Völckner, and Sattler (2010).
Measurement Validity
Table 5 presents descriptive statistics and correlations. One noteworthy findings from
Table 5 is that a marginally significant correlation exists between the proxy measure of BRiC
and the survey measure of BRiC (r=0.34, p=0.08). Considering that we used a relatively small
sample size on the category level (N=29), we assessed this correlation as substantive. This
correlation again provided statistical support for the validity of the newly proposed proxy
measure of BRiC.
The adequacy of the measurement model was examined through the evaluation of
reliability and the convergent and discriminant validity of all latent variables (Fornell and
26
Larcker, 1981). Composite reliabilities for all variables were larger than 0.7. All the items loaded
significantly (t>1.96) and were also significant (all factor loadings exceeded 0.8) on their
hypothesized factors, which provides evidence of convergent validity of all measures
(Steenkamp and Van Trijp, 1991). Table 5 shows that all factors have average variance extracted
(AVE) values higher than 0.70 and these AVE values exceed the squared correlations between
all pairs of variables (Fornell and Larcher, 1981). These results establish the discriminant and
convergent validity of our measures.
We used two approaches to alleviate common method variance concerns. First, we
provided two measures of BRiC, with one being computed using grocery scanner data, which
ensured that our measures were from different sources. Second, we conducted Harman’s one-
factor test. The results showed that the first factor only accounts for 33.46% of the overall
variance (Podsakoff and Organ, 1986). One general factor did not explain the majority of the
total variance, demonstrating a minimal threat of common method bias.
Model Estimation
In our model, brands are nested within product categories. Ordinary least squares is inappropriate
because applying ordinary least squares to a multilevel model (with nonindependence data) will
result in biased estimates. Instead, we used HLM (Raudenbush and Bryk, 2002) to test our
hypothesized cross-level interaction effects. HLM uses iterative maximum likelihood estimation
and allows the simultaneous estimation of relationships among constructs at two or more levels
(Steenkamp and Geyskens 2006). This specific feature enabled us to test how BRiC (second-
level construct) moderates the relationship between marketing mix variables and brand equity
(first-level relationships). Following Raudenbush and Bryk’s (2002) recommendations, we

27
group-mean-centered the level 1 predictors within product category and grand-mean-centered
BRiC. The level 1 model for brand i in category j is specified as follows:
BEij = β0j + β5jVARIE + β1jPRICE + β7jDEAL + β3jADVER + β6jMAIL + β4jDISPL + β2jDISTR
+ rij
where i and j represent brands and categories, respectively; PRICE denotes perceived price level;
DISTR represents perceived distribution intensity; ADVER is perceived advertising intensity;
DISPL denotes perceived in-store display frequency; VARIE is perceived product variety; MAIL
is perceived advertising mail frequency; DEAL is perceived price promotion frequency; and BE
is overall brand equity evaluated by consumers.
By using the following level 2 model specification, we allowed the intercept β0j and slopes β1j~7j
in the level 1 model to vary between brands:
β0j = γ00 + γ01BRiC + u0j
β1j = γ10 + γ11BRiC + u1j
β2j = γ20 + γ21BRiC + u2j
β3j = γ30 + γ31BRiC + u3j
β4j = γ40 + γ41BRiC + u4j
β5j = γ50 + γ51BRiC + u5j
β6j = γ60 + γ61BRiC + u6j
β7j = γ70 + γ71BRiC + u7j
Results
Table 6 provides the results for HLM model estimations. Contrary to findings in prior research
(e.g., Yoo, Donthu, and Lee, 2000), we did not find strong support for the claimed main effects
of marketing mix variables on brand equity. Prior research has suggested that frequent
promotional activities undermine brand equity. However, the results in Table 6 show a positive
impact of in-store displays (b=0.13, p<0.05) and advertising mailings (b=0.09, p<0.05) on brand
equity. Also contrary to prior research are the findings that brand price is negatively related to
brand equity (b=-0.06, p<0.05) and that product variety (b=0.05, p>0.05), price promotions

28
(b=0.03, p>0.05), advertisements (b=0.02, p>0.05), and distribution coverage (b=0.04, p>0.05)
do not have a significant effect on brand equity.
The core of our conceptual model pertains to the cross-level interaction between BRiC
and marketing mix variables. To test our hypotheses, we first ran a model with survey-measured
BRiC (model 2). The results indicated that the model fit was only slightly better than the main
effect model (deviances=3089.76 vs. 3071.73) and that survey-measured BRiC did not interact
with any of the marketing mix variables to affect brand equity (p values>0.05). We then ran a
model wherein we replaced survey-measured BRiC with proxy-measured BRiC (model 3). The
results indicated a better model fit than model 2 (deviance = 3109.77 vs. 3089.76). More
importantly, the results indicated marginally significant interaction between BRiC and product
variety (b=0.05, p<0.1) and significant interaction between BRiC and distribution coverage
(b=0.05, p<0.05). The results suggest that the effects of perceived product variety and perceived
distribution coverage on brand equity are stronger for brands in categories characterized by high
BRiC than those in categories characterized by low BRiC. Thus, H1b and H6b were supported.
The interactions between BRiC and other marketing mix variables were not significant
(p’s >0.05). Thus, H2b – H5b were not supported.
Cross-category variation in the effects of product variety and distribution coverage on
brand equity is illustrated in Figure 2 Panel C and Panel D. As Figure 2 Panel C shows, product
variety has a higher impact on brand equity in high-BRiC categories (b=0.18, p<0.05) than in
low-BRiC categories (b=-0.09, p>0.05). Figure 2 Panel B shows that distribution coverage has a
higher impact on brand equity in high-BRiC categories (b=0.13, p<0.05) than in low-BRiC
categories (b=0.98, p>0.05).

29
Discussion
Our primary objective was to determine product category-level conditions under which
marketing mix variables may be more or less effective in influencing brand sales and brand
equity. To accomplish this objective, we focused on a category-level characteristic – BRiC – and
developed and tested a series of hypotheses pertaining to the cross-level interaction effects
between BRiC and marketing mix variables across two studies. Study 1 focused on the effects of
the interactions on brand sales. Empirical results from analyzing large-scale IRI scanner data
reveal that marketing mix variables are indeed important drivers of brand sales, in accordance
with conventional wisdom. More importantly, we found category-level variation in the effects,
with BRiC serving as a boundary condition wherein some marketing mix variables are more or
less effective in driving sales. Specifically, we found that (1) the positive effect of product
variety on brand sales is negatively moderated by BRiC, with high product variety bringing out
larger brand sales in low-BRiC categories than in high-BRiC categories, and (2) the positive
effect of distribution coverage on brand sales is positively moderated by BRiC, with a higher
contribution of distribution coverage to brand sales in high-BRiC categories than in low-BRiC
categories.
Study 2 focused on brand equity as the outcome variable. Empirical results from
analyzing consumer survey data showed that BRiC moderates the effect of consumer perceptions
of marketing mix variables on their evaluation of brand equity. Noteworthy findings from study
2 include that (1) the positive effect of product variety on brand equity is positively moderated
by BRiC and adding product variations results in higher brand equity in high-BRiC categories
than in low-BRiC categories and (2) the positive effect of distribution coverage on brand equity
30
is positively moderated by BRiC, with increasing distribution coverage resulting in higher brand
equity in high-BRiC categories than in low-BRiC categories.
Comparing studies 1 and 2, we found an interesting contrast regarding the effects of
product variety. A comparison of results across the two studies suggests that product variety has
a weaker association with brand sales but stronger association with brand equity in high-BRiC
categories than in low-BRiC categories.
In summary, our findings provide support for our conceptual model. Our results show
that the effects of marketing mix variables on brand performance are systematically and
predictably moderated by BRiC. The findings of this study are important from a theoretical
perspective because they offer insights into the relevance of including BRiC for understanding
the contribution of the marketing mix to brand performance. The study is also important from an
applied perspective because more and more companies operate in multiple CPG categories, and
these companies need to make informed marketing mix decisions.
Theoretical Implications
This work contributes to the current state of the literature in three ways. First, this research
proposes and validates (both empirically and theoretically) a new proxy measure of BRiC. We
point out that the original measure of BRiC proposed by Fischer, Volckner, and Sattler (2010),
although valid and powerful, has some drawbacks inherent to survey measures. For example, it
cannot effectively capture latent motives (e.g., pursuing named brand) of which consumers are
not aware or not willing to admit. Enlightened by the operationalization of brand equity, we
proposed a new measure of BRiC that uses consumer choices (i.e., the extent to which
consumers choose named brands over unnamed brands in a product category) to infer the
importance of brand for consumer choices in a product category. This indirect measure of BRiC

31
takes into account consumers’ latent motives and thus avoids a survey measure problem. We also
validated the new proxy measure of BRiC by examining its correlation with survey-measured
BRiC. The correlation between the two was substantive, which provided evidence of
measurement validity.
Second, this work contributes to the stream of marketing mix research by introducing
BRiC as a key construct that can explain category-level variation in the effects of marketing mix
variables on brand sales and brand equity. Although research has recognized BRiC as an
important category-level characteristic, no studies to date have examined how it affects
marketing decisions. The research presented here provides two overarching results that relate
BRiC to marketing mix decisions. First, the positive effect of marketing mix variables on brand
sales varies across categories depending on each category’s BRiC. Second, the effect of
marketing mix variables on customer-based brand equity varies across categories depending on
each category’s BRiC. Thus, this research illustrates the importance of BRiC for estimating
marketing mix effectiveness and represents an early application of the concept of BRiC in
studies about marketing mix decisions. As the first study of its kind, this research provides a
good starting point for further research on the influence of BRiC on the efficacy of marketing
mix variables.
Third, we address calls in top marketing literature pertaining to problems in product
category management. Category-level analysis is necessary for marketing resource allocation
decisions because the returns to marketing resource investment may vary across product
categories. Basuroy, Mantrala, and Walters (2001) provided an early glimpse into the effects of
category management on retailer prices and performance. More recently, Kushwaha and Shankar
(2013) studied the influence of product category characteristics on multichannel customer value.

32
No research has studied the existence and importance of cross-category variation in the effect of
marketing mix on brand equity. Our research contributes to this small but growing body of
research by studying the cross-category variation in the effects of marketing mix variables on
customer-based brand equity.
Managerial Implications
The empirical results from our two studies provide much needed empirical evidence regarding
resource allocation decisions in product category management and have important implications
for both retailers and brand managers who are responsible for coordinating pricing, promotion,
and distribution activities across product categories. While the effects of marketing mix variables
on brand sales are generally positive, our research shows that the contribution of marketing mix
variables to brand sales (as a short-term goal) and brand equity (as a long-term goal) vary
significantly across product categories. Thus, managers need to customize their marketing mix
strategies for each category. Employing a “wrong” strategy for the brand in a specific product
category without considering BRiC can lead to marketing inefficiency. For example, with the
information that toothpaste has a higher BRiC than toothbrushes, a Crest brand manager should
conclude that extending product variety will be less successful in increasing brand sales for Crest
toothpaste than for Crest toothbrushes (in Table 4, b(toothpaste)=-0.21 < b(toothbrush)=-0.03),
whereas extending channel distribution will be more successful in increasing brand sales for
Crest toothpaste than for Crest toothbrushes (in Table 4, b(toothpaste)=0.09 >
b(toothbrush)=0.04). The overall sales of the Crest brand can be improved by better managing
the resources on different marketing activities across Crest toothpaste and toothbrushes.
This research also underlines the importance of considering BRiC in marketing mix
decisions when building customer-based brand equity is the main business objective. We use

33
Crest as an example to illustrate its managerial relevance. Given that toothpaste has higher BRiC
than toothbrushes, if the brand manager of Crest holds the goal of building customer-based brand
equity as a priority, he/she should consider investing more resources to extend product line depth
and distribution channels for Crest toothpaste and less for Crest toothbrushes.
We call for special attention to product line extension (or product proliferation) strategy.
If generating more brand sales in the short term is the main business goal, adding product variety
(or extending product line depth) seems to be a better strategy for brands in low-BRiC categories
than for those in high-BRiC categories. However, when cultivating high brand equity in the long
term is the main business goal, such a product proliferation strategy seems to work better for
brands in high-BRiC categories than for those in low-BRiC categories.
Limitations and Future Research
Our study is subject to several limitations. First, the current research has focused on the
short-term sales effect of marketing mix. A large body of literature has emphasized that the long-
term effect of marketing mix on brand sales is an important consideration for firms. Hence, it
would be interesting for future research to examine whether the effects of marketing mix
variables on long-term brand sales vary across product categories.
Second, in the current research, our investigation of marketing mix elements is mainly
focused on analysis of the frequency of marketing mix activities. We admit that the variables
may be too broad to provide tips for detailed marketing practices. One promising direction for
future research is to investigate the interaction between BRiC and the specific content of the
marketing mix elements.
Third, the marketing mix variables included in our analysis are not exhaustive. Several
other marketing variables, such as media selection and product innovativeness, are not
34
considered in this study. Future research should examine a wider range of marketing mix actions
to enhance the explanatory power of the study.
Fourth, we did not consider possible interactions among marketing mix variables. Prior
research has addressed the interactive effects of different marketing mix elements. Synergies
have been shown among feature advertising, displays, and price discounts. However, to reduce
the complexity and maintain some parsimony of the research model, we did not consider the
interactions among marketing mix elements. Thus, it is still unknown if synergistic effects of
marketing mix elements vary across product categories.
Fifth, the validity of the results for non-CPG markets and other cultures is unknown. The
generalizability of the study can be enhanced by replicating the study with additional product
categories (e.g., electronics, automotive) and/or additional markets (e.g., China). For example,
cross-cultural differences may exist in the interpretation of and reaction to marketing mix
variables and in the level of BRiC for different categories. Cross-cultural research on the current
topic may reveal different results.
Finally, research has recognized the following vacancy in the literature: Limited research
has been conducted on the profitability of a given marketing mix element and its division across
manufacturers and retailers (Srinivasan et al., 2004). Manufacturers may profit more or less from
a marketing mix element than retailers (Ailawadi et al., 2001). This research did not consider the
division of profit from marketing mix across manufacturers and retailers. Future research can
examine whether BRiC influences this profit division.

35
APPENDICES

36
APPENDIX A
TABLES
Table 1-1: Descriptive Statistics and Correlations (Study 1)
Variable Mean SD 1 2 3 4 5 6 7 8 9 10
[1] Brand Unit Sales 7.18 3.15 -- -0.01 -0.01 -0.02 0.19 0.06 -0.05 -0.38a -0.36a -0.27
[2] Product Variety 0.86 0.90 0.11a -- 0.04 0.11 0.23 0.35b -0.01 0.13 0.02 -0.05
[3] Brand Price 1.13 0.81 -0.01a 0.06a -- 0.23 0.34b -0.24 -0.07 0.28 -0.15 0.01
[4] Price Reductions 3.39 3.04 0.20a 0.28a -0.02a -- 0.30b 0.37a -0.25 0.20 -0.11 0.14
[5] Feature Advertisements 1.90 2.81 0.14a 0.18a 0.00 0.50a -- -0.19 0.09 0.30 -0.32b 0.12
[6] Displays 2.24 2.58 0.18a 0.27a 0.02a 0.58a 0.43a -- -0.44a -0.10 0.06 -0.24
[7] Distribution Coverage 3.59 2.18 0.28a 0.32a 0.06a 0.62a 0.42a 0.52a -- -0.13 0.13 -0.21
[8] BRiC 3.74 2.64 -- -- -- -- -- -- -- -- 0.33b 0.41a
[9] Category Price 4.42 3.10 -- -- -- -- -- -- -- -- -- 0.05
[10] Category Size 6.30 0.93 -- -- -- -- -- -- -- -- -- --
Notes: All variables (except category price) are log transformed; Correlations below the diagonal are based on within-brand (Level 1)
scores (N=138032), and those above the diagonal are based on scores aggregated to the category level (Level 3) (N=31). a Statistically significant at the 0.05 level (two-tailed). b Statistically significant at the 0.1 level (two-tailed).

37
Table 1-2: Variance Estimates of Null Models for All Level 1 Variables (Study 1)
Variable Intercept
(γ000)
Variance
within Brands
(e2)
Variance between brands
within categories (r2)
Variance
between
categories (u2)
% Variance between
categories
Brand Sales 7.38 1.08 7.56 1.35 13.47
Product Line Depth 0.86 0.05 0.64 0.09 11.56
Brand Price 1.06 0.02 0.35 0.25 40.47
Price Reductions 3.74 1.32 7.02 0.86 9.39
Feature Advertisements 2.32 0.98 5.86 0.92 11.88
Displays 2.44 0.96 4.49 0.85 13.43
Distribution
Coverage
3.94 0.48 3.76 0.56 11.71
Notes: N(Level 1)=138032, N(Level 2) = 7680, N(Level 3) = 31; γ000=pooled intercept representing the average level of variable on
level 1. Percentage of variance between categories was computed as: u2/(ε2+ r2 +u2)
38
Table 1-3: Three-Level Mixed Effect Model Results (Study 1, DV: Brand Sales)
Variable Model 1 Model 2
Brand Price -0.85 (-14.20) -0.83 (-12.28)
Product Variety 0.13 (3.65) 0.29 (9.05)
Feature Advertisements 0.03 (10.54) 0.03 (12.07)
Price Promotions 0.07 (11.47) 0.08 (12.44)
In-Store Displays 0.11 (11.69) 0.11 (11.63)
Distribution Coverage 1.01 (51.07) 1.06 (63.12)
Brand Size 4.40 (115.80) 4.40 (115.80)
Category Size -0.26 (-1.43) -0.17 (-0.86)
Category Price -0.15 (-2.14) -0.12 (-1.66)
BRiC -0.13 (-1.08) -0.14 (-1.18)
Interactions on Level 2
BRiC × Average Price -0.01 (-0.13)
BRiC × Product Variety -0.31(-11.69)
BRiC × Feature Advertisements 0.00 (0.95)
BRiC × Price Reductions -0.01 (-1.42)
BRiC × In-Store Displays -0.00 (-0.00)
BRiC × Distribution Coverage -0.12 (-8.32)
Interactions on Level 3
BRiC × Average Price -0.01 (-0.16)
BRiC × Product Variety -0.05 (-3.04)
BRiC × Feature Advertisements 0.00(0.90)
BRiC × Price Reductions 0.00 (0.65)
BRiC × In-Store Displays 0.00 (0.06)
BRiC × Distribution Coverage 0.02 (1.75)
Category Size × Average Price -0.05 (-0.76)
Category Size × Product Variety 0.10 (3.36)
Category Size × Feature Advertisements -0.00 (-1.68)
Category Size × Price Reductions -0.01 (-1.76)
Category Size × In-Store Displays -0.02 (-1.57)
Category Size × Distribution Coverage -0.05 (-3.23)
Category Price × Average Price 0.02 (0.87)
Category Price × Product Variety 0.02 (1.78)
Category Price × Feature Advertisements -0.00 (-2.69)
Category Price × Price Reductions -0.00 (-0.86)
Category Price × In-Store Displays -0.00 (-0.46)
Category Price × Distribution Coverage 0.01 (2.38)
Wald χ2 19108.68
Log likelihood -87913.38
LR χ2
Notes: Number in parentheses are t values. N(Level 1)=138032, N(Level 2) = 7680, N(Level 3)
= 31.

39
Table 1-4: Best Linear Unbiased Predictions of Random Slopes
Category Product Variety Price Price Reductions Feature Ads Displays Distribution
Beer -0.06 -0.08 0.02 -0.01 0.01 0.04
Blades 0.04 0.09 -0.02 0.00 0.00 0.14
Cigarettes 0.23 -0.27 -0.05 -0.03 -0.05 0.12
Coffee 0.16 -0.03 0.02 -0.01 -0.04 -0.06
Cold Cereal -0.19 -0.01 -0.03 -0.03 -0.01 0.08
Deodorants -0.03 0.22 0.01 0.01 -0.05 0.02
Diapers 0.07 0.32 0.03 0.01 0.04 0.01
Facial Tissues -0.06 -0.22 0.00 0.00 0.04 0.08
Frozen Diner 0.01 -0.24 0.06 0.02 -0.01 0.01
Frozen Pizza 0.01 -0.18 0.01 0.00 0.00 -0.07
Hotdog 0.05 -0.24 0.00 0.01 0.03 -0.14
Household Cleaner -0.10 -0.02 0.01 0.00 0.01 -0.02
Laundry Detergent -0.09 0.01 0.01 0.00 -0.01 -0.02
Margarine/Spreads -0.12 -0.27 0.01 0.00 -0.06 0.03
Mayo -0.04 -0.15 -0.01 -0.01 0.02 -0.05
Milk 0.39 0.39 -0.02 0.00 -0.07 -0.07
Mustard & Ketchup 0.11 -0.10 -0.03 0.00 -0.02 0.00
Paper Towels -0.16 -0.13 0.04 0.00 0.09 0.01
Peanut Butter -0.05 0.04 0.01 0.00 -0.05 0.02
Photo -0.05 0.41 0.05 0.02 0.04 0.08
Razor -0.07 0.06 -0.02 0.00 0.05 0.05
Salty Snacks 0.04 -0.21 -0.02 0.00 0.05 -0.19
Shampoo -0.08 0.34 -0.02 0.00 -0.05 0.03
Soft Drinks 0.05 -0.28 -0.02 0.00 0.05 -0.11
Soup -0.09 -0.13 0.03 0.01 -0.01 0.01
Spaghetti Sauce 0.19 -0.09 -0.01 0.00 -0.02 -0.11
Sugar Substitution -0.03 0.15 -0.03 0.00 -0.06 0.08
Toilet Paper -0.16 -0.04 0.01 0.00 0.09 0.06
Toothbrush -0.03 0.30 0.01 0.01 0.02 0.04
Toothpaste -0.21 0.38 -0.02 0.00 0.00 0.09
Yogurt 0.27 -0.02 -0.01 0.00 -0.03 -0.16

40
Table 1-5: Descriptive Statistics and Correlations (Study 2)
Variable Mean SD 1 2 3 4 5 6 7 8 9 10
[1] Brand Equity 4.88 1.41 0.90 0.03 0.40a 0.21 0.23 0.36 0.10 0.13 0.48 a 0.25
[2] Product Variety 4.83 1.38 0.14a 0.79 0.04 0.69a 0.35b 0.34b 0.35b 0.45a 0.23 0.04
[3] Brand Price 3.82 1.61 0.01 0.07b 0.95 0.19 0.48a 0.58a 0.34 -0.10 0.31 -0.17
[4] Price Promotion 3.58 1.72 0.16a 0.32a 0.01 0.97 0.72a 0.62a 0.77a 0.71a 0.38a -0.01
[5] Advertisement 4.05 1.66 0.19a 0.38a 0.35a 0.39a 0.85 0.68a 0.87a 0.70a 0.57a 0.16
[6] Display 3.99 1.88 0.22a 0.41a 0.19a 0.46a 0.68a 0.96 0.67a 0.38a 0.33b -0.17
[7] Advertising Mail 2.12 1.44 0.18a 0.25a 0.21a 0.41a 0.43a 0.42a 0.94 0.72a 0.41a 0.08
[8] Distribution Coverage 5.75 1.50 0.14a 0.37a 0.09a 0.29a 0.57a 0.47a 0.12a 0.88 0.56a 0.22
[9] BRiC (survey measure) 4.50 0.57 -- -- -- -- -- -- -- -- 0.90 0.34b
[10] BRiC (proxy measure) 2.80 1.81 -- -- -- -- -- -- -- -- -- --
Notes: Correlations below the diagonal are based on brand-level (Level 1) scores (N=933), and those above the diagonal are based on
scores aggregated to the category level (Level 2) (N=29). AVE values are on the diagonal. a Statistically significant at the 0.05 level (two-tailed). b Statistically significant at the 0.1 level (two-tailed).
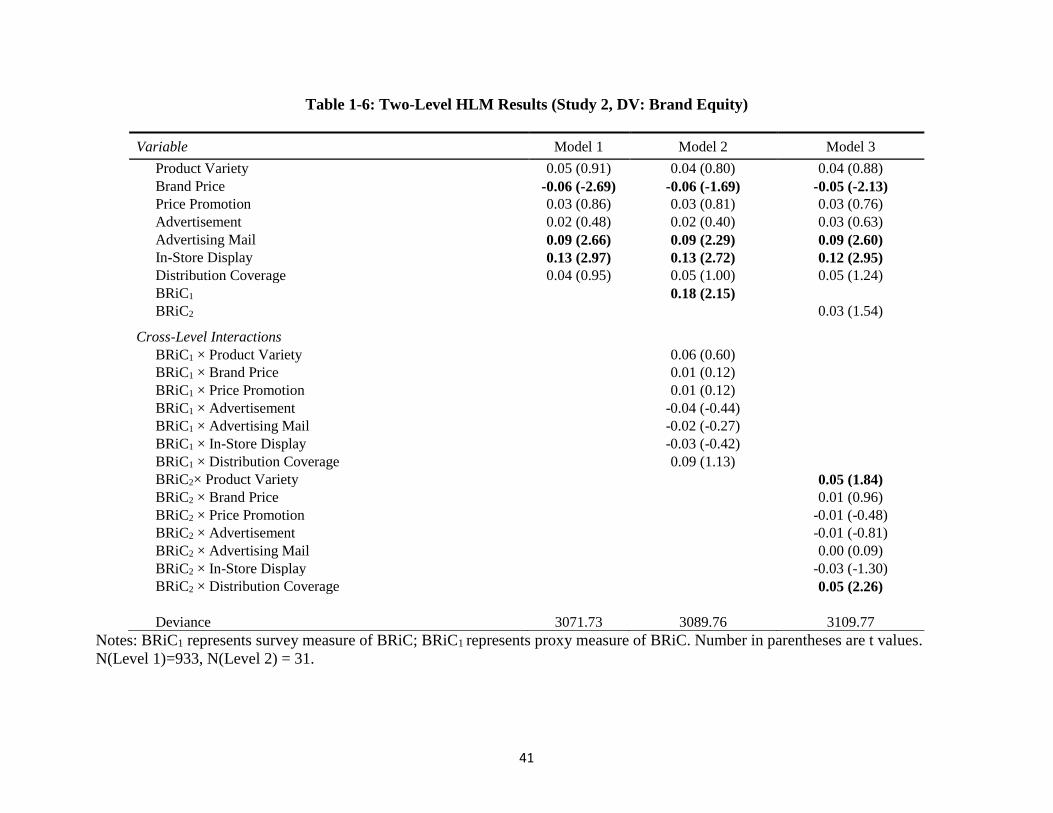
41
Table 1-6: Two-Level HLM Results (Study 2, DV: Brand Equity)
Variable Model 1 Model 2 Model 3
Product Variety 0.05 (0.91) 0.04 (0.80) 0.04 (0.88)
Brand Price -0.06 (-2.69) -0.06 (-1.69) -0.05 (-2.13)
Price Promotion 0.03 (0.86) 0.03 (0.81) 0.03 (0.76)
Advertisement 0.02 (0.48) 0.02 (0.40) 0.03 (0.63)
Advertising Mail 0.09 (2.66) 0.09 (2.29) 0.09 (2.60)
In-Store Display 0.13 (2.97) 0.13 (2.72) 0.12 (2.95)
Distribution Coverage 0.04 (0.95) 0.05 (1.00) 0.05 (1.24)
BRiC1 0.18 (2.15)
BRiC2 0.03 (1.54)
Cross-Level Interactions
BRiC1 × Product Variety 0.06 (0.60)
BRiC1 × Brand Price 0.01 (0.12)
BRiC1 × Price Promotion 0.01 (0.12)
BRiC1 × Advertisement -0.04 (-0.44)
BRiC1 × Advertising Mail -0.02 (-0.27)
BRiC1 × In-Store Display -0.03 (-0.42)
BRiC1 × Distribution Coverage 0.09 (1.13)
BRiC2× Product Variety 0.05 (1.84)
BRiC2 × Brand Price 0.01 (0.96)
BRiC2 × Price Promotion -0.01 (-0.48)
BRiC2 × Advertisement -0.01 (-0.81)
BRiC2 × Advertising Mail 0.00 (0.09)
BRiC2 × In-Store Display -0.03 (-1.30)
BRiC2 × Distribution Coverage 0.05 (2.26)
Deviance 3071.73 3089.76 3109.77
Notes: BRiC1 represents survey measure of BRiC; BRiC1 represents proxy measure of BRiC. Number in parentheses are t values.
N(Level 1)=933, N(Level 2) = 31.

42
APPENDIX B
FIGURES
Figure 1-1: Conceptual Model
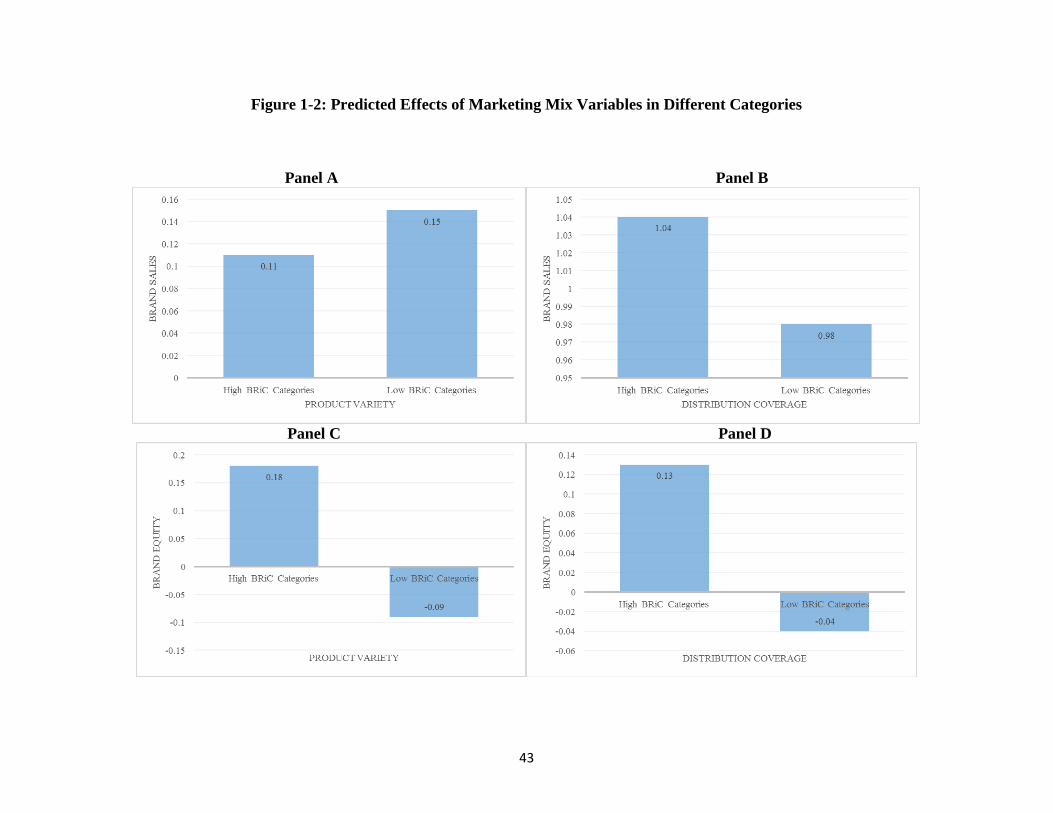
43
Figure 1-2: Predicted Effects of Marketing Mix Variables in Different Categories
Panel A Panel B
Panel C Panel D

44
APPENDIX C
Study 2 Measures
Brand relevance in category beer
When I purchase beer, the brand—compared to other things—plays an important role.
When purchasing beer, I focus mainly on the brand.
To me, it is important to purchase a brand-name beer.
The brand plays a significant role as to how satisfied I am with the beer.
Perceived price of X brand beer
Perceived Price of X brand beer
The price of X brand beer is high.
X brand beer is expensive.
X brand beer is a pricey beer.
Perceived distribution intensity of X brand beer
X brand beer is distributed through many stores.
Many stores have X brand beer on their shelves.
Compared to competing brands, X is more available in retail stores.
Perceived advertising intensity of X brand beer
X brand beer is intensively advertised.
The ad campaigns for X brand beer seem very expensive, compared to campaigns for
competing brands.
The ad campaigns for X brand beer are seen frequently.
Perceived display intensity of X brand beer
X brand beer is frequently displayed in retail stores.
The in-store displays for X brand beer are seen frequently.
I often see X brand beer on display in retail stores.
Perceived product variety of X brand beer
The X brand provides a lot of products that I can choose from.
There are different kinds of X brand beer on retail store shelves.
Compared to competing brands, the X brand has more product variety.
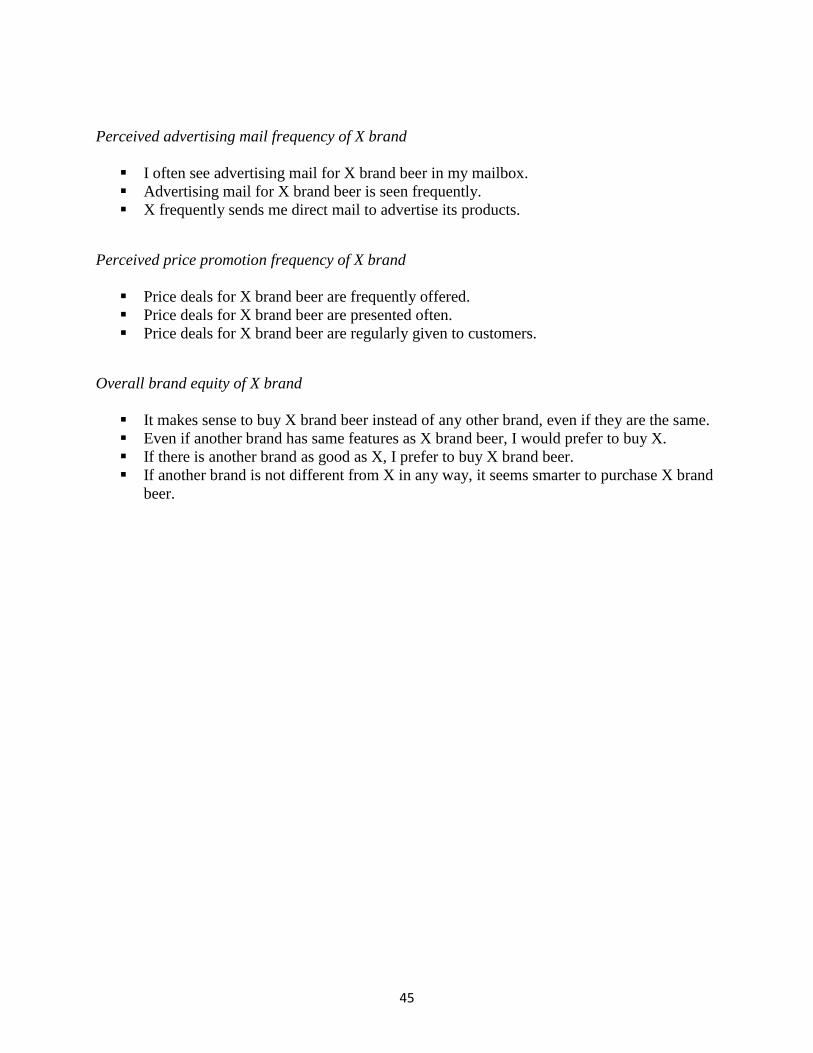
45
Perceived advertising mail frequency of X brand
I often see advertising mail for X brand beer in my mailbox.
Advertising mail for X brand beer is seen frequently.
X frequently sends me direct mail to advertise its products.
Perceived price promotion frequency of X brand
Price deals for X brand beer are frequently offered.
Price deals for X brand beer are presented often.
Price deals for X brand beer are regularly given to customers.
Overall brand equity of X brand
It makes sense to buy X brand beer instead of any other brand, even if they are the same.
Even if another brand has same features as X brand beer, I would prefer to buy X.
If there is another brand as good as X, I prefer to buy X brand beer.
If another brand is not different from X in any way, it seems smarter to purchase X brand
beer.

46
REFERENCES

47
REFERENCES
Aaker, David A. (1996), "Measuring Brand Equity across Products and Markets," California
Management Review, 38 (3), 102-20.
Ailawadi, Kusum L., Donald R. Lehmann, and Scott A. Neslin (2003), "Revenue Premium as An
Outcome Measure of Brand Equity," Journal of Marketing, 67 (4), 1-17.
Ataman, M. Berk, Harald J. Van Heerde, and Carl F. Mela (2010), "The Long-Term Effect of
Marketing Strategy on Brand Sales," Journal of Marketing Research, 47 (5), 866-82.
Baldauf, Artur, Karen S. Cravens, Adamantios Diamantopoulos, and Katharina Petra Zeugner-
Roth (2009), "The Impact of Product-Country Image and Marketing Efforts on Retailer-
Perceived Brand Equity: An Empirical Analysis," Journal of Retailing, 85 (4), 437-52.
Basuroy, Suman, Murali K. Mantrala, and Rockney G. Walters (2001), "The Impact of Category
Management on Retailer Prices and Performance: Theory and Evidence." Journal of
Marketing, 65 (4), 16-32.
Bayus, Barry L. and William P. Putsis Jr (1999), "Product Proliferation: An Empirical Analysis
of Product Line Determinants and Market Outcomes," Marketing Science, 18 (2), 137-53.
Berger, Jonah, Michaela Draganska, and Itamar Simonson (2007), "The Influence of Product
Variety on Brand Perception and Choice," Marketing Science 26 (4), 460-72.
Blattberg, Robert C., Richard Briesch, and Edward J. Fox (1995), "How Promotions Work,"
Marketing Science, 14 (3), 122-32.
Boulding, William, Eunkyu Lee, and Richard Staelin (1994), "Mastering the Mix: Do
Advertising, Promotion, and Sales Force Activities Lead to Differentiation?" Journal of
Marketing Research, 159-72.
Buil, Isabel, Leslie De Chernatony, and Eva Martínez (2013), "Examining The Role of
Advertising and Sales Promotions in Brand Equity Creation," Journal of Business
Research, 66 (1), 115-22.
Chevalier, Michel (1975), "Increase in Sales Due to In-Store Display," Journal of Marketing
Research, 12 (4), 426-31.
Clarke, Darral G. (1976), "Econometric Measurement of the Duration of Advertising Effect on
Sales," Journal of Marketing Research, 13 (4), 345-57.
Curhan, Ronald C. (1974), "The Effects of Merchandising and Temporary Promotional
Activities on The Sales of Fresh Fruits and Vegetables In Supermarkets," Journal of
Marketing Research, 11 (3), 286-294.

48
Dhar, Sanjay K., Stephen J. Hoch, and Nanda Kumar (2001), "Effective Category Management
Depends on the Role of the Category," Journal of Retailing, 77 (2), 165-84.
Erdem, Tülin, Joffre Swait, and Jordan Louviere (2002), "The Impact of Brand Credibility On
Consumer Price Sensitivity," International journal of Research in Marketing, 19 (1), 1-
19.
Fader, Peter S. and Leonard M. Lodish (1990), "A Cross-Category Analysis of Category
Structure and Promotional Activity for Grocery Products," Journal of Marketing, 52-65.
Fein, Adam J. and Erin Anderson (1997), "Patterns of Credible Commitments: Territory and
Brand Selectivity in Industrial Distribution Channels," Journal of Marketing, 19-34.
Fischer, Marc, Franziska Völckner, and Henrik Sattler (2010), "How Important are Brands? A
Cross-Category, Cross-Country Study," Journal of Marketing Research, 47 (5), 823-39.
Fornell, Claes, and David F. Larcker (1981), "Evaluating Structural Equation Models with
Unobservable Variables and Measurement Error," Journal of Marketing Research, 18 (1),
39-50.
Frazier, Gary L. (1999), "Organizing and Managing Channels of Distribution," Journal of the
Academy of Marketing Science, 27 (2), 226-40.
Frazier, Gary L. and Walfried M. Lassar (1996), "Determinants of Distribution Intensity,"
Journal of Marketing, 39-51.
Hawkins, Delbert and David Mothersbaugh (2012), Consumer Behavior: Building Marketing
Strategy, 12th edition, McGraw-Hill Education.
Karande, Kiran W. and V. Kumar (1995), "The Effect of Brand Characteristics and Retailer
Policies on Response to Retail Price Promotions: Implications for Retailers," Journal of
Retailing, 71 (3), 249-78.
Keller, Kevin Lane (1993),"Conceptualizing, Measuring, and Managing Customer-Based Brand
Equity," Journal of Marketing, 57 (1), 1-22.
Keller, Kevin Lane, and Donald R. Lehmann (2003), "How Do Brands Create Value?"
Marketing Management, 12 (3), 26-31.
Kirmani, Amna, and Akshay R. Rao (2000), "No Pain, No Gain: A Critical Review of the
Literature on Signaling Unobservable Product Quality," Journal of Marketing, 64 (2), 66-
79.
Kushwaha, Tarun, and Venkatesh Shankar (2013), "Are Multichannel Customers Really More
Valuable? The Moderating Role of Product Category Characteristics," Journal of
Marketing, 77 (4), 67-85.

49
Mason, Charlotte H., and George R. Milne (1994), "An Approach for Identifying
Cannibalization Within Product Line Extensions and Multi-Brand Strategies." Journal of
Business Research, 31 (2-3), 163-70.
Milgrom, Paul, and John Roberts (1986), "Price and Advertising Signals of Product Quality,"
Journal of Political Economy, 94 (4), 796-821.
Moorthy, Sridhar, and Scott A. Hawkins. "Advertising Repetition and Quality Perception."
Journal of Business Research, 58 (3), 354-60.
Narasimhan, Chakravarthi, Scott A. Neslin, and Subrata K. Sen (1996), "Promotional Elasticities
and Category Characteristics," Journal of Marketing, 17-30.
Pappu, Ravi, and Pascale G. Quester (2008), "Does Brand Equity Vary between Department
Stores and Clothing Stores? Results of An Empirical Investigation," Journal of Product
& Brand Management, 17 (7), 425-35.
Podsakoff, Philip M., and Dennis W. Organ. "Self-Reports in Organizational Research: Problems
and Prospects," Journal of Management, 12 (4), 531-44.
Rabe-Hesketh, Sophia and Anders Skrondal (2012). Multilevel and Longitudinal Modeling Using
Stata Volume I: Continuous Responses, College Station, TX: Stata Press.
Rao, Akshay R., and Kent B. Monroe (1989), "The Effect of Price, Brand Name, And Store
Name On Buyers' Perceptions of Product Quality: An Integrative Review," Journal of
Marketing Research, 26 (3), 351-57.
Raudenbush, Stephen W., and Anthony S. Bryk (2002), Hierarchical Linear Models:
Applications and Data Analysis Methods, Vol. 1. Sage
Srinivasan, V. Seenu and Anand V. Bodapati (2006), “The Impact of Feature Advertising on
Customer Store Choice,” Stanford University Graduate School of Business Research
Paper No. 1935, Available at SSRN: http://ssrn.com/abstract=901458
Srinivasan, Shuba, Koen Pauwels, Dominique M. Hanssens, and Marnik G. Dekimpe (2004),
"Do Promotions Benefit Manufacturers, Retailers, or Both?" Management Science, 50
(5), 617-29.
Sriram, Srinivasaraghavan, and Manohar U. Kalwani (2007), "Optimal Advertising and
Promotion Budgets in Dynamic Markets with Brand Equity as A Mediating Variable,"
Management Science, 53 (1), 46-60.
Steenkamp, Jan-Benedict EM, and Inge Geyskens (2006), "How Country Characteristics Affect
the Perceived Value of Web Sites," Journal of Marketing, 70 (3), 136-50.
50
Steenkamp, Jan-Benedict EM, and Hans CM Van Trijp (1991), "The Use of LISREL In
Validating Marketing Constructs," International Journal of Research in Marketing 8 (4),
283-99.
Stern, Louis W., Adel I El-Ansary, and Anne T. Coughlan (1996), Marketing Channels, Prentice
Hall Upper Saddle River, NJ.
Valette-Florence, Pierre, Haythem Guizani, and Dwight Merunka (2011), "The Impact of Brand
Personality And Sales Promotions on Brand Equity." Journal of Business Research, 64
(1), 24-8.
Walters, Rockney G., and Scott B. MacKenzie (1988), "A Structural Equations Analysis of the
Impact of Price Promotions On Store Performance," Journal of Marketing Research, 25
(1), 51-63.
Winer, Russell S. (1986), "A Reference Price Model of Brand Choice for Frequently Purchased
Products," Journal of Consumer Research, 13 (2), 250-6.
Yoo, Boonghee, Naveen Donthu, and Sungho Lee (2000), "An Examination of Selected
Marketing Mix Elements and Brand Equity," Journal of the Academy of Marketing
Science, 28 (2), 195-211.
Zhang, Jie, Michel Wedel, and Rik Pieters (2009), "Sales Effects of Attention to Feature
Advertisements: A Bayesian Mediation Analysis," Journal of Marketing Research, 46
(5), 669-81.
51
CHAPTER 2
Rebranding and Firm Value: An Event Study on Abnormal Returns to Rebranding
Announcements
Marketing managers are under increasing pressure to demonstrate the contribution of marketing
investments to firm value (Wiles and Danielova, 2009). Understanding the financial impact of
marketing and estimating the effect of marketing investment on firm value have long been
research priorities (Swaminathan, Murshed and Hulland 2008, Srivastava, Shervani, and Fahey
1998). Brand management resources and activities represent a major form of marketing
investments for many firms. Marketing-finance interface literature has provided strong evidence
that brands are an importance source of competitive advantage, and that some brand management
practices (e.g., new brand introduction, brand extension, brand disposal) can significantly affect
shareholder value (Lane and Jacobson, 1995; Wiles, Morgan and Rego, 2012; Varadarajan,
DeFanti and Busch 2006; Madden, Fehle and Fournier 2006; Shocker, Srivastava and Ruekert
1994).
However, as marketing organizations’ internal and external environments are dynamic,
existing brand management practices can become outdated and fail to sustain competitive
advantage. As such, internal and external changes can make firm efforts to update brand identity
and brand strategy imperative and of important consequence. For example, in response to
changes in strategic focus and industrial environments, Domino’s Pizza changed its name to
Domino’s in July 2014. Since then, Domino’s has been working with its advertising agency,
Crispin Porter + Bogusky (CPB), to rebrand itself, including updates to its logo, packaging,
broadcasting, websites and print materials. Other firms, such as Hershey’s (August 2014), Visa

52
(January 2014), Verizon (September 2015), Alaska Airline (January 2016) have all recently
launched rebranding campaigns.
Firms undertake rebranding campaigns for many reasons. Rebranding has been touted as
an effective means of building renewed brand associations, which reconstruct brand image and
brand equity. Such marketing objectives are especially salient when there are changes in
corporate strategy or industry environments (Kaikati and Kaikati 2003). Thus, facing significant
change, firms can use rebranding campaigns as strategic signals to deliver messages to
customers, competitors, and investors.
At the same time, firms may be reluctant to rebrand for many reasons. Rebranding often
requires significant investments. More importantly, rebranding campaigns carry the risk of losing
or blurring original, favorable brand associations. In many rebranding cases, consumers have
evaluated new brand associations unfavorably. For example, when Starbucks refreshed its brand
identity by dropping “STARBUCKS COFFEE” from its long-existing logo in 2011, a backlash
ensued on social media. Starbucks received complaints from many consumers about how they
disliked the new logo and how they missed the old one. This example underscores the fact that
rebranding campaigns involve the risk of lost brand equity (in the form of favorable brand
associations) (Muzellec and Lambkin 2006; Kaikati and Kaikati 2003).
Despite the increasing pervasiveness of rebranding in many industries, existing research
provides little understanding of this important branding initiative. For example, we have very
limited knowledge of the determinants of the degree of rebranding. We also do not know
whether the stock market provides a timely and accurate responses to a firm’s rebranding efforts.
There is no evidence showing that there is a significant increase in shareholder value (a key
performance metric for top management) associated with rebranding. Thus, there is no evidence
53
of whether firms’ investments in rebranding projects are generally worthwhile. This uncertainty
surrounding rebranding has fundamental implications for research and practice. On the research
side, a lack of empirical examination of the financial returns from rebranding would lead scholar
to question whether the topic of rebranding deserves further attention, which would eventually
hinder the understanding of rebranding strategy. On the practice side, the mystery surrounding
rebranding’s financial impacts could give top executives an impression that that rebranding is a
waste of resources. Such an impression would reduce managers’ determination and ability to
compete for the resources needed to carry out rebranding plans. In light of practical rebranding
concerns as well as the lack of empirical evidence in the area, this research focuses on answering
on two research questions of managerial and theoretical importance. First, given the benefits and
risks of rebranding, what factors should firms consider in determining the degree of rebranding?
Second, and more importantly, from a shareholder value standpoint, do the benefits of
rebranding outweigh its risks?
Figure 1 outlines the research framework we adopt to examine the two questions and
guide our empirical analysis. The framework is built upon the concept of “fit” in strategy
research (Venkatraman, 1989). Venkatraman (1989) identifies different perspectives of “fit”,
including “fit as mediation” and “fit as moderation”. We apply the two perspectives in our
conceptual model. Building on “fit as mediation” and the classical “structure → conduct →
performance” paradigm from industrial organization theory, we propose a “competition →
rebranding → performance” chain wherein competitive factors, such as firm competitive position
and competitive intensity in the industry, determine the degree of rebranding, and the degree of
rebranding affects firm financial performance. Building on the “fit as moderation” perspective,

54
we propose a “competition × rebranding → performance” relationship wherein we explore how
interactions between the degree of rebranding and competitive factors affect shareholder value.
We test our hypotheses empirically using data compiled from multiple sources, including
the Center for Research in Security Prices (CRSP), firm press releases, Compustat, and the
United States Patent and Trademark Office (USPTO). Results from our simultaneous equation
modeling suggest that firms’ rebranding decisions are fundamentally affected by firms’
competitive position and the intensity of competition in the industry. We assess the worth of
rebranding via event study. Event study methodology enables us to isolate and estimate the
unique contribution of rebranding to firm value (Hyman and Mathur 2005). By examining 229
rebranding announcements, we demonstrate that rebranding campaigns, on average, are
associated with significant and positive abnormal returns. As such, this research provides the
first empirical evidence to support the value of rebranding projects. In addition, the empirical
results support the contention that the fit between degree of rebranding and firm and industry
factors affect rebranding worth. We believe that our results have the potential to provide
guidance to firms designing rebranding projects (or considering such projects), with the goal of
maximizing shareholder value.
We organize the remainder of the article as follows. After a brief review of current
research on the topic of rebranding, we integrate insights from rebranding, strategic fit, and
marketing-finance interface literature to develop research hypotheses regarding the relationships
among competitive factors, degree of rebranding, and abnormal returns. We then present
empirical results and findings from simultaneous equation modeling and an event study. We find
strong support for our hypothesized model. We discuss our findings and their theoretical and

55
managerial implications. We conclude by identifying limitations and providing directions for
future research.
Literature Review
What is Rebranding?
As brand images and brand strategies can become outdated, firms often resort to rebranding
campaigns to reinvent a brand. Rebranding is seen as an important brand management practice
that a firm undertakes to update or reinvent a brand (Daly and Moloney 2004; Lambkin and
Muzellec 2008). Muzellec and Lambkin (2006) define rebranding as the “creation of a new
name, term, symbol, design or a combination of them for an established brand with the intention
of developing a differentiated (new) position in the minds of stakeholders and competitors”. This
definition of rebranding reveals two unique features of rebranding: (1) rebranding involves
changes in brand identity (name, color, symbol, etc.); (2) the objective of rebranding is
repositioning. The first feature of rebranding noted above suggests that rebranding is partly
destructive in nature. Rebranding is destructive because it breaks established brand associations
and previous branding investments become sunk costs (Kaikati and Kaikati 2003; Madden, Fehle
and Fournier 2006; Muzellec and Lambkin 2006). The second feature of rebranding noted above
suggests that rebranding is also constructive in nature. Rebranding is constructive in that it
attempts to create brand equity and establish new brand associations and new positioning.
Depending on the specific content, rebranding projects can be seen as existing along a
continuum. Rebranding efforts can vary from a low degree of rebranding, which typically
involves slight changes in brand identity (e.g., brand logo) or brand strategy, to a high degree of
rebranding, which typically involves significant changes in brand identity (e.g., brand name) or
56
brand strategy (Stuart and Muzellec 2004; Daly and Moloney 2004; Muzellec and Lambkin
2006).
Depending on the branding architecture (branded house vs. house of brands), rebranding
can occur on two levels: corporate level (e.g., Philip Morris rebranded as Altria, Federated
Department Stores rebranded as Macy’s) or SBU level (e.g., the rebranding of Olive Garden by
Darden Restaurants, the rebranding of Tropicana by PepsiCo) (Muzellec and Lambkin 2006;
Muzellec and Lambkin 2007). Firms using a branded-house architecture normally choose to
rebrand the whole corporation, given that they use the same brand name for all subsidiaries and
business units (Muzellec and Lambkin 2008). Firms using a house-of- brands architecture may
choose to either rebrand the whole corporation or only one subsidiary or business unit. Give the
difficulties in accessing SBU-level data and evaluating SBU-level performance, we only
consider corporate rebranding in our research.
Why Rebrand?
The decision to rebrand is usually made after a firm scrutinizes changes in its internal and
external environments (Juntunen, Saraniemi and Jussila 2009). When internal or external
environments change, a firm’s brand identity or brand strategy may become outdated or obsolete.
In such cases, rebranding campaigns can become necessary in order to to regain or recreate brand
identity, or enhance brand strategy (Muzellec and Lambkin 2006; Lee 2013; Muzellec and
Lambkin 2007).
External drivers. External drivers of rebranding include challenges and opportunities that
emerge in the marketplace (i.e., with competitors or customers). When a firm holds an inferior
competitive position against its competitors, rebranding may be perceived as a way of
revitalizing the brand, enhancing brand recognition, and gaining or regaining competitive

57
advantage (Merrilees and Miller 2008; Muzellec, Doogan, and Lambkin 2003). In these
situations, rebranding may allow firms to escape from hostile situations. Opportunities in the
marketplace also motivate a firm to do rebranding (Singh, Tripathi, and Yadav, 2012).
Expanding markets may encourage firms to update brand identity or brand strategy,
repositioning to target new customers. In these situations, rebranding allows a firm to exploit a
favorable situation.
Internal drivers. A firm may choose to rebrand when strategic changes occur within the
firm (Lee, 2013). A firm opts for rebranding projects so that brand identity and brand strategy
communicate the true value (or mission, culture), structure, and strategic focus of the firm
(Muzellec, Doogan, and Lambkin 2003). Therefore, important internal drivers of rebranding are
changes in a firm’s value (or mission, culture), structure, or strategic focus. When there are
changes in these factors, a firm may undertake a rebranding campaign in an attempt to update its
public image in ways that reflect the internal changes. Corporate value (mission or culture)
changes usually involve updates in management principles guiding employee activities. For
example, Southwest Airlines unveiled a new logo “Southwest Heart” in September, 2014 to
express “the warmth, the compassion, and the smiles” of their people. Structural changes at a
firm may involve forming a strategic alliance, M&As, diversifying or divesting, or going into
internationalization (Muzellec, Doogan, and Lambkin 2003; Muzellec and Lambkin 2008). For
example, Liz Claiborne changed its name to Fifth & Pacific in 2012 because the Liz Claiborne
brand was sold to J.C. Penney in 2011. Changes in strategic focus may occur when a firm enters
a new market segment. For example, Aetna launched a rebranding campaign in 2012 to reflect
“its evolution from a health insurance carrier to a health solutions company”. In these cases,
58
rebranding projects were undertaken to align external branding communications with internal
operations (Lambkin and Muzellec 2008).
So What?
There have been controversial perspectives as to whether rebranding positively or negatively
influences firm performance.
Negative influences of rebranding. Rebranding projects introduce the threat of lost brand
equity and brand heritage. Rebranding projects break existing brand associations in customer
memories, which are an important element of customer-based brand equity (Keller, 1993). Thus,
a rebranding project may result in significant losses in brand awareness, brand familiarity, and
even brand loyalty (Gotsi and Andriopoulos 2007). Especially when there is a high degree of
rebranding, changes in brand identity and brand strategy may harm brand equity (Lee, 2013).
Positive influences of rebranding. One of the most important purposes of rebranding is to
create a differentiated position in stakeholders’ mind (Muzellec, Doogan, and Lambkin 2003).
Rebranding initiatives represent a firm’s effort in building new brand equity. Thus, rebranding,
although risky and expensive, can be an effective tool to create updated brand associations and
build brand equity in the mind of customers (Muzellec, Doogan, and Lambkin 2003; Muzellec
and Lambkin 2006). For example, Horsky and Swyngedouw (1987) posit that a corporate name
change is positively associated with stock market value because it enhances market recognition.
A rebranding project can have positive effects on firm performance when (1) there is a
successful transfer of the brand equity of the prior brand (Jaju, Joiner and Reddy 2006; Lee
2013), and (2) there is a successful establishment of a differentiated position in stakeholders’
mind (Lee 2013).

59
Academic research in the burgeoning area of rebranding remains rare. Much of what is
known about the drivers and outcomes of rebranding is based on anecdotal evidences (e.g.,
business news, press releases). No empirical evidence exists to relate various internal and
external drivers to rebranding or relate rebranding to firm performance. Therefore, firms have
limited guidance regarding the nature of rebranding efforts and limited knowledge about
expected outcomes. These are surprising literature oversights, given (1) the prevalence of
rebranding in practice and (2) research interest in financial returns to brand management
activities. Our research is uniquely suited to fill these gaps.
Conceptual Framework and Hypotheses
Our literature review suggests that several research gaps remain in our understanding of
rebranding. Importantly, there is a need for research that empirically examines the motives
behind rebranding decisions and the worth of rebranding projects. We specifically focus on the
role played by competitive factors (firm competitive position and industry competition intensity)
as rebranding motives. This is because brands are often viewed as firm assets and sources of
competitive advantage. An outdated brand identity and brand strategy can undermine
competitive advantage. Thus, we posit competitive factors may be the most important
determinants of firm rebranding decisions and rebranding worth. Our conceptual model (Figure
1) is based on perspectives of “strategic fit” and the “structure-conduct-performance” paradigm
from industry organization theory. Figure 1 presents our conceptual framework that comprises
two major parts. The first part delineates the competitive factors influencing the degree of
rebranding. The second part discerns factors including investors’ reaction to rebranding.
Hypotheses underlying this framework are discussed subsequently.

60
Two Dimension of Rebranding
Degree of brand identity change. Brand identity refers here to visual elements of a
brand’s image, including a brand’s name, logo, color, and symbol. Changes in brand identity are
an intrinsic feature of a rebranding project and the degree of brand identity change is an indicator
of the degree of rebranding (Lee, 2013; Stuart and Muzellec 2004). A high degree of brand
identity change usually involves a brand name change, although some brand name changes are
more significant than others. For example, we deem Philips Morris changing its name to Altria
as a significant brand name change because Altria was an entirely different name from Philips
Morris. Research In Motions (RIM) changing name to BlackBerry was deemed as a medium
degree of change because BlackBerry was previously affiliated with RIM. Polo Ralph Lauren
changing name to Ralph Lauren was deemed as a minimal degree of change because the new
name was a simple alteration of the original name.
Change in marketing aesthetics (e.g., logo, color, symbol) without a brand name change
are often seen by prior research (e.g., Muzellec and Lambkin, 2006) as a low degree of brand
identity change, although some marketing aesthetics changes are more significant than others.
For example, Microsoft’s rebranding in 2012 was significant because there were dramatic
differences between new marketing aesthetic elements and previous versions. However,
Facebook’s logo change in 2015 was not significant considering that there were just slight
changes to its logo.
Degree of brand strategy change. More often than not, a brand identity change in
rebranding is accompanied by changes in a firm’s brand strategy (Muzellec and Lambkin 2006).
Through rebranding, a firm creates an opportunity to reinforce or alter its brand positioning
strategy, and to enhance the value imbedded in its products or services (Muzellec, Doogan, and
61
Lambkin 2003). The degree of brand strategy change varies across rebranding projects. A high
degree of brand strategy change involves significant changes in brand positioning, brand
promises, and the value of offerings delivered to customers. For example, Pitney Bowes Inc.
unveiled a new brand strategy in a rebranding announcement on January 14, 2015 by stating the
following:
“Our new brand strategy and identity not only reflect who we are today, but also where
we are going in the future …The new brand strategy will clarify our role in the changing world
of commerce, emphasizing …and also spotlighting ... Importantly, the new brand differentiates
Pitney Bowes and makes us more relevant to a wider audience around the world.”
Some rebranding projects involve no changes - or only minimal changes - to brand
strategy. For example, Scripps Networks Interactive Inc. issued a rebranding announcement on
January 19, 2010 and stated the following:
“In re-designing our company logo, we wanted to … remind our many stakeholders of
the great heritage of the Scripps name that serves as the solid foundation for the company”
In this announcement, Scripps provided brief explanation of the logo change but did not
mention any significant changes to its brand strategy.
Some rebranding projects may be high (low) on the degree of brand identity change but
low (high) on the degree of brand strategy change, while others can be high (low) on both.
Figure 2 illustrates the relationship between the two dimensions of rebranding using examples of
rebranding projects.
The Impact of Competitive Factors on Rebranding
The “structure-conduct-performance” framework suggests that firms make strategic choices
based on market structure. Given the importance of brands for building competitive advantage,
62
we posit that competitive factors are important driver of rebranding decisions. In this research,
we consider two competitive factors, namely, (1) relative market share, which reflects a firm’s
competitive position, and (2) competitive intensity within the industry, a measure of competitive
pressure.
We believe that rebranding projects may be firm reactions to the erosion of market
position. Relative market share is a marketing metric used by a firm to compare its market share
to its largest competitor in the industry. Relative market share is a better indicator of competitive
position than market share because market share only compares a firm’s sales to the industry
total sales. Relative market share also enables the comparison of competitive positions of firms
across different industries. A larger relative market share means a more favorable competitive
position regardless of what industry the firm belongs. We expect an inverse relationship between
the change in relative market share and the degree of rebranding, meaning that a declining
relative market share would be associated with a high degree of brand identity change and brand
strategy change. A shrinkage in relative market share hints an increase in external competition
which imposes great pressure on top executives and brand managers. In these situations,
rebranding (i.e., changing brand identity or brand strategy) becomes an available marketing
action to deter competition and to regain a favorable competitive position (Singh, Tripathi, and
Yadav, 2012). Significant brand identity changes enable a firm to better signal to customers who
the firm is and what the firm is capable of offering. Significant brand strategy changes enhance a
firm’s ability to serve its existing customer as well as attract new customers. In declining markets
(or otherwise deteriorating competitive situations), the benefits of brand identity change and
brand strategy change may motivate marketing managers to undertake significant (high degree)
rebranding projects. Conversely, when a firm is enjoying an improving competitive position, the
63
firm would be less motived to make significant (high degree) brand identity changes and brand
strategy changes. Therefore,
H1: Change in relative market share is inversely related to the degree of brand identity
change (a) and the degree of brand strategy change (b).
Competitive intensity in an industry is an important industry-level driver of rebranding.
In a competitive industry where firms face intense competitive pressures, one firm’s gain is
another’s loss. Hence, not losing customers to competitors is one of the dominating motives
behind marketing actions in a competitive industry. Outdated brand identity or brand strategy
undermines a firm’s ability to leverage brands as assets to build competitive advantage. Thus, the
intense competition may compel a firm to invest resources to reinvent its brand identity and
brand strategy, building up-to-date brand associations (Singh, Tripathi, and Yadav, 2012). With
such reasoning, we expect that firms in competitive industries are more likely to adopt a higher
degree of brand identity change and brand strategy change than those firms in less competitive
industries. More formally,
H2: Competitive intensity in an industry is positively related to the degree of brand
identity change (a) and the degree of brand strategy change (b).
How Rebranding Affects Future Shareholder Value
The effectiveness of rebranding efforts may be measured by the rebranding effort’s influence on
shareholder value. Even though rebranding campaigns lead to temporary losses in brand equity,
we expect rebranding efforts to be associated with positive abnormal returns. Findings from
recent research (e.g., Wiles, Morgan, and Rego 2012) imply that financial markets are forward-
looking regarding the financial impact of brand management. Financial markets consider newly
announced public rebranding information and assess the extent to which it foreshadows a change

64
in a firm’s prospective cash flows. Investors in financial markets then adjust stock prices, leading
to a corresponding change in the firm’s shareholder value even before brand changes actually
happen. Investors’ assessments of the worth of a marketing action is largely determined by the
impact of the marketing actions on customers (Lane and Jocobson 1995; Wiles and Danielova
2009). Hence, we need to examine rebranding’s expected impact on customers to estimate
financial returns.
Given that rebranding represents firms’ efforts to build customer-based brand equity, we
argue that rebranding campaigns, on average, have positive implications for firms’ future cash
flows. By building (or rebuilding) customer-based brand equity, rebranding projects can affect
shareholder value by (1) increasing cash flow levels, and (2) accelerating cash flow timing; (3)
reducing cash flow vulnerability, and (4) increasing the firm’s residual value (c.f., Fornell et al.
2006; Srivastava, Shervani, and Fahey 1998). Specifically, (1) refreshed brand identity and
improved brand strategy collectively enhance communications between a firm and its customers
so that customers better “understand” the firm and what the firm is capable of offering. This
should ultimately result in increased customer demand and customer loyalty, thus increasing
cash flow levels; (2) rebranding accelerates firm cash flow timing because it proactively renews
brand associations and facilitates a firm’s adjustment to the marketplace challenges and
opportunities in a timely manner; (3) an updated brand identity and brand strategy increases
firms’ ability to adjust to internal and external contingencies and thus reduce firm’s vulnerability
to unforeseeable uncertainties. Moreover, rebranding creates enhanced brand communication and
strong customer loyalty, and thus reduce vulnerability of the firm’s cash flows; (4) rebranding
increases a firm’s residual value by giving firm access to new segments of customers. One key
65
purpose of rebranding is to reposition the firm to target new customers. This may result in
expanded customer base, bringing additional revenue to the firm.
For the above reasons, we argue that rebranding should lead investors to develop positive
expectations regarding the firm’s future financial performance.
H3: Corporate rebranding is positively associated with abnormal returns.
For any rebranding project to change investors’ expectations about firm future financial
performance, the degree of brand identity change involved in rebranding projects have to be
significant enough to draw any attention in public media. Any brand identity changes (with or
without a name change) below the level of “just noticeable differences (J.N.D)” will go
unnoticed by customers and investors. Thus, insignificant brand identity changes associated with
a rebranding project are less likely to cause any reactions from investors. For example, a very
small change in the font of a brand name (e.g., Facebook) probably would not change investors’
expectation. We expect that only when changes in brand name, or logo, or in other marketing
aesthetics exceed the level of “J.N.D” does rebranding have any effect on stock market returns.
Therefore, we expect a positive relationship between the degree of brand identity changes and
abnormal returns.
Similarly, the degree of brand strategy change is also expected to be positively associated
with abnormal returns. Significant changes in brand strategy represent firms’ efforts to improve
its value proposition to customers. Such changes give rise to the likelihood that a rebranding
project is successful in helping a brand build a differentiated position in customers’ mind, and
thus will enhance shareholders’ confidence in the success of the rebranding project. A rebranding
project without any significant changes in brand strategy may be seen as a superficial “face-lift”

66
for the brand, and thus will be less likely to create a new and differentiated position - and less
likely to be rewarded by the stock market. Therefore,
H4: The degree of brand identity change (a) and the degree of brand strategy change (b)
are positively associated with abnormal returns.
The Fit between the Degree of Rebranding and Competitive Factors
When reacting to rebranding projects, investors assess not only the degree of rebranding but also
the rationale behind such decisions. Considering the potential negative consequences of
rebranding, such rationale may be even more important for investors’ evaluation. Given that
competitive factors are the primary reasons of rebranding (Singh, Tripathi, and Yadav, 2012), we
expect that the financial impact of rebranding projects depends crucially on the fit between the
degree of rebranding and competitive factors.
Prior research has suggested that investors react more favorably to marketing actions with
high legitimacy and justification (e.g., Balasubramanian, Mathur, and Thakur 2005). Generally
speaking, the stock market reactions to rebranding announcements are determined by the
information released to shareholders about the current and future financial performance of a firm.
As rebranding is associated with significant costs (e.g., the loss of brand equity, marketing costs
of rebuilding new brand identity) and risks (e.g., customers’ reactions to the new brand identity
are unknown), rebranding efforts must be well-justified (Stuart and Muzellec 2004; Tevi 2013).
Shareholders may combine and evaluate firm-level and industry-level information to determine
the necessity of rebranding. Thus, we posit that reactions from shareholders to a rebranding
project are more favorable if the shareholders regard it as justified, necessary, and important for
generating future cash flows. The two competitive factors driving rebranding decisions–

67
disadvantageous competitive position and intense industry competition – provide necessary
justification for rebranding decisions.
From an investor viewpoint, a decrease in relative market share should provide necessary
justification and legitimacy for a high degree of rebranding - and for the associated higher costs
and risks. The key purpose of rebranding is to rebuild brand associations and a differentiated
position in consumers’ minds. Such repositioning is more necessary and legitimate when a firm’s
performance is suffering. In other words, a decreasing relative market share makes high degree
of rebranding a reasonable and acceptable action to investors. Rational investors should
recognize such necessity and legitimacy when rebranding information is released publicly. These
investors will adjust their expectation of the firm’s future cash flow and reward the rebranding
firms for finding a fit between the degree of rebranding and the changes in competitive position.
As such, we hypothesize that,
H5: Firm competitive position negatively interacts with the degree of brand identity
change (a) and the degree of brand strategy change (b) to affect abnormal returns.
The same pattern of interaction should be expected for the degree of rebranding and
competitive intensity in the industry. Rebranding regarded as significantly necessary should be
more acceptable to investors, while fierce competition in the marketplace provides evidence of
necessity and thus offers justification and rationale for a high degree of rebranding. Customer-
based brand equity can easily erode in a fast moving industry (Shocker, Srivastava and Ruekert
1994; Muzellec and Lambkin 2006; Lee 2013). Thus, it is necessary and legitimate for a firm to
proactively or reactively refresh its brand identity and update its brand strategy to fit ever-
changing market conditions. We expect that investors will reward such fit. Thus,

68
H6: Industry competition intensity positively interacts with the degree of brand identity
change (a) and the degree of brand strategy change (b) to affect abnormal returns.
Data and Method
Data Sources
We searched announcements of rebranding campaigns in major daily newspapers (e.g., WSJ,
NYTimes) and wire services (e.g., Business Wire, PR Newswire). Our sampling frame consists
of rebranding statements announced by publicly-traded firms across 20 years (1996 to 2015). We
limited our sample only to publicly traded firms because we are interested in verifiable financial
returns to rebranding announcements. However, we did not restrict the industries sampled. The
key words for searching included “rebrand”, “rename”, “reposition”, “name change”, “logo
change”, “new name”, “new logo”, and “new brand identity”. We carefully scanned more than
2,000 announcements to identify true rebranding announcements that are of interest to this
project. We only included in our final sample those that explicitly stated that the announcements
were related to the updates of brand identity or brand strategy. Several rounds of painstaking
search were conducted to retrieve an accurate date for each event, which is the earliest date when
the rebranding information was revealed to the public. The final sample consists of 229
rebranding projects announced by 208 firms across 102 industries. The data show that rebranding
projects are announced by all types of firms, ranging from large firms (assets > $10 billion) to
small firms (assets < 10 million), and including new firms (age <10 years) and old firms (age >
100 years).
Key variables in our model were measured using data collected from different sources.
The two dimensions of rebranding (i.e., brand identity change and brand strategy change) were

69
coded by different raters. Change in relative market share and competitive intensity in the
industry competition were calculated using data from Compustat. Financial returns to rebranding
campaigns were estimated using an event study. Event study methodology assumes markets are
efficient and stock prices should reflect the effect of all publicly available information on firm
value (Fama 1970). Thus, in an event study, stock market reactions, measured as abnormal
returns, provide a direct assessment of variation in shareholder value. Event study methodology
assumes that all public information of a firm is incorporated in its stock prices and only
unexpected information can cause changes in stock prices (Fama, Fisher, Jensen and Roll 1969).
If the unexpected information signals that a firm has favorable or unfavorable future financial
performance, investors will update their expectations of firm future cash flow and the stock price
will rise or drop correspondingly. Event study methodology is well suited for this research
because it empirically isolates the financial impact of rebranding campaigns from other
marketing activities (Geyskens, Gielens, and Dekimpe 2002). We followed standard protocols
for event study analysis (Srinivasan and Bharadwaj 2004).
Measures of Key Variables
We used coded and secondary data to measure the key independent variables and
abnormal returns to measure changes in shareholder value. Table 1 contains an overview of the
measures and the source from which we collected the data.
Abnormal stock returns. In event study methodology, the effect of an event on firm
financial performance is measured by abnormal stock returns. Abnormal returns are an unbiased
estimate of shareholder value change, and are calculated as the difference between the stock’s
actual returns and its expected returns (Brown and Warner 1980).
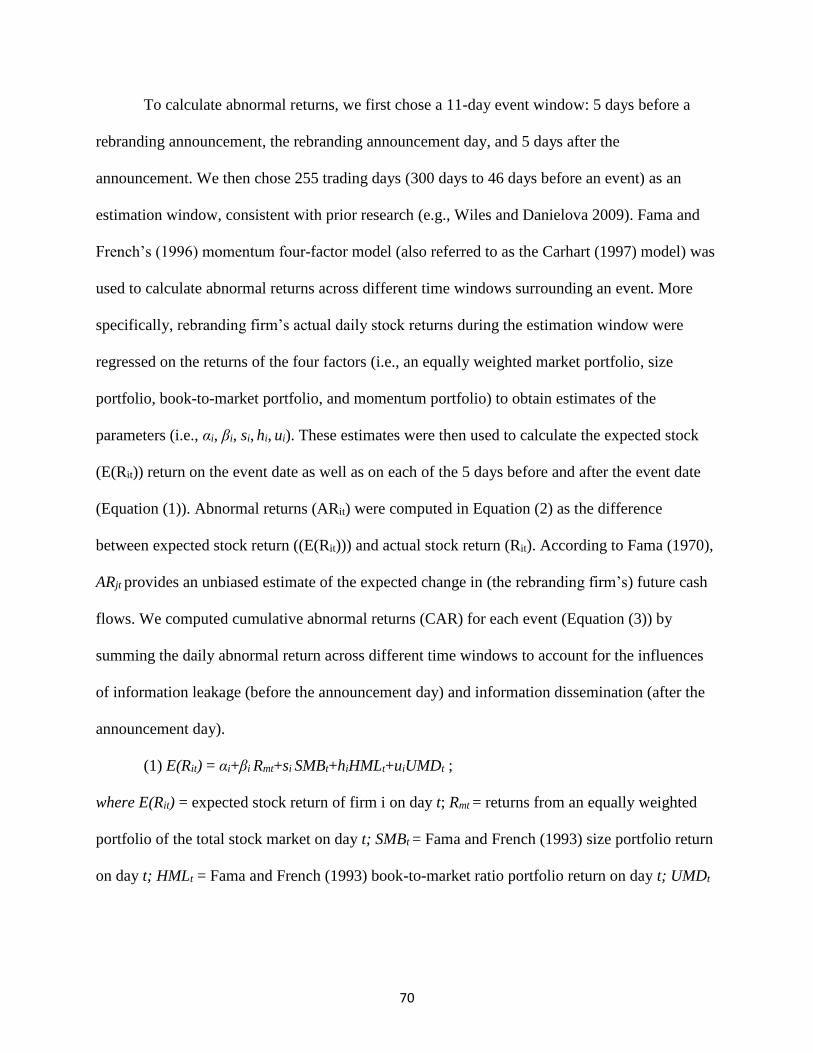
70
To calculate abnormal returns, we first chose a 11-day event window: 5 days before a
rebranding announcement, the rebranding announcement day, and 5 days after the
announcement. We then chose 255 trading days (300 days to 46 days before an event) as an
estimation window, consistent with prior research (e.g., Wiles and Danielova 2009). Fama and
French’s (1996) momentum four-factor model (also referred to as the Carhart (1997) model) was
used to calculate abnormal returns across different time windows surrounding an event. More
specifically, rebranding firm’s actual daily stock returns during the estimation window were
regressed on the returns of the four factors (i.e., an equally weighted market portfolio, size
portfolio, book-to-market portfolio, and momentum portfolio) to obtain estimates of the
parameters (i.e., αi, βi, si, hi, ui). These estimates were then used to calculate the expected stock
(E(Rit)) return on the event date as well as on each of the 5 days before and after the event date
(Equation (1)). Abnormal returns (ARit) were computed in Equation (2) as the difference
between expected stock return ((E(Rit))) and actual stock return (Rit). According to Fama (1970),
ARjt provides an unbiased estimate of the expected change in (the rebranding firm’s) future cash
flows. We computed cumulative abnormal returns (CAR) for each event (Equation (3)) by
summing the daily abnormal return across different time windows to account for the influences
of information leakage (before the announcement day) and information dissemination (after the
announcement day).
(1) E(Rit) = αi+βi Rmt+si SMBt+hiHMLt+uiUMDt ;
where E(Rit) = expected stock return of firm i on day t; Rmt = returns from an equally weighted
portfolio of the total stock market on day t; SMBt = Fama and French (1993) size portfolio return
on day t; HMLt = Fama and French (1993) book-to-market ratio portfolio return on day t; UMDt

71
= Carhart (1997) momentum portfolio return on day t; αi, βi, si, hi, ui = parameters estimated over
a 255-day period ending 46 days before the event date.
(2) ARit = Rit − E(Rit).
(3) CARi(n, m ) = ∑ 𝐴𝑅𝑖𝑡𝑚𝑛
Degree of brand identity change. A high degree of rebranding is identified as one
involving significant changes in brand-identity-related elements, such as brand names and brand
logos. The degree of brand identity change of each rebranding project was rated on a 1-10 scale,
with 1 indicating the lowest degree of brand identity change and 10 indicating the highest. We
used 1 instead of 0 as the lower limit because brand identity change is a criterion we applied to
identify rebranding projects. Prior research (e.g., Muzellec and Lambkin, 2006) suggests that a
high degree of brand identity change usually involves brand name change whereas a low degree
of brand identity change only involves marketing aesthetic changes, typically a logo change.
Thus, the specific coding criteria we used were:
(1) Degree 1-6: if a rebranding project only involves marketing aesthetic changes
(without a name change), we assigned it a score ranging from 1 to 6, depending on raters’
judgement of the degree of changes in marketing aesthetics;
(2) Degree 5-10: if a rebranding project involves a name change, we assigned it a score
ranging from 5-10, depending on raters’ judgement of the degree of changes in corporate name.
We allowed a 1-point overlap between the two criteria because there were cases where
the name change was really minor (e.g., Polo Ralph Lauren changing name to Ralph Lauren) or
the marketing aesthetic changes were very significant (Microsoft’s logo change). One author and
a research assistant rated the degree of brand identity change associated with each rebranding
project. Consistent with prior research (e.g., Honburg and Fürst 2005), we computed intraclass

72
correlation coefficient (ICC) (1) to assess the reliability and consistency of responses between
two raters. In our study, ICC (1) of this measure is 0.88, which is considered very high (Bliese,
2000).
Degree of brand strategy change. Degree of brand strategy change is operationalized as
the magnitude of modifications or improvements to a firm’s brand strategy stated in a rebranding
announcement. Raters read each announcement carefully and rated on a 0 to 10 scale to indicate
to what extent the firm attempted to change or update its brand strategy through the rebranding
project. We used 0 instead of 1 as the lower limit because some rebranding announcements did
not mention any changes in brand strategy. More specifically, the following coding criteria were
applied by the raters:
(1) Degree 0-3: if the firm states in the rebranding announcement that it is rebranding to
give itself a sweet-sounding name or give its marketing aesthetics a refreshed modern look. In
such announcement, the firm does not mention any ongoing or planned changes in its brand
strategy;
(2) Degree 4 to 6: if the firm indicates in the rebranding announcement that it is
rebranding with the purpose of reflecting previous changes in brand strategy. In such
announcement, the firm does not mention any future changes to its brand strategy.
(3) Degree 7 to 10: If the firm indicates in the rebranding announcement that it is
rebranding to update its brand strategy to expand businesses, to reposition, or to enter new
market or target new customers.
We again computed ICC (1) to examine consistency of responses between the two raters.
ICC (1) is 0.69, which again is considered very high (Bliese, 2000).

73
Change in competitive position. As maintaining and gaining market share is a primary
goal of marketing competition, we use change in relative market share as a proxy for change in
competitive position. Change in relative market share was computed as the difference between
the relative market share two years prior to rebranding and the share one year prior to
rebranding.
Industry Competition. Consistent with prior research (Jacquemin and Berry 1979), we
measured industry competition using an entropy measure.
E = ∑ si
N
i=1
ln1
si
where si is the market share of i firm in a 4-digit SIC code.
Measures of Additional Variables
In addition to the focal variables in our conceptual model, we measured some other factors that
may also influence firms’ rebranding decision and investors’ expectation about firm future
financial performance. These factors are included in the estimation as controls.
Firm restructuring. We created a dummy variable to indicate whether there were any
structure changes (e.g., M&As, brand disposals, strategic alliances) associated with the
rebranding announcement. The dummy variable takes the value of 1 if there are structure
changes mentioned in the rebranding announcement, and takes the value of 0 if otherwise.
Cash flow. When rebranding plans are released publicly, investors may assess the extent
to which the rebranding project can be carried out with the support from various resources.
Research suggests that a firm’s free cash flow is used by investors as a key signal of a firm’s
ability to fund major strategic activities. Therefore, we included free cash flow as a predictor of
abnormal returns, with the expectation that higher free cash flow is associated with higher

74
abnormal returns to rebranding. Consistent with prior research (Slotegraaf, Moorman, and Inman
2003), free cash flow is calculated using the following formula:
Free cash flow = Operating income - Total income taxes - Gross interest expenses - Dividends
Brand identity age. Brand identity age refers here to how long the old brand identity
(brand name or brand logo) had existed until the rebranding campaign. It was operationalized as
the number of years from the brand identity being invented to being rebranded. We expected that
investors may penalize firms for abandoning long-standing brand names or logos. Financial
returns to the rebranding of a younger brand identity might be larger than the returns to the
rebranding of an older brand identity. We obtained the information about the year of a brand
name being invented from Compustat. We obtained the information about the year of a logo
being first registered from a USPTO database.
Advertising and Promotion efficiency. Advertising and promotion efficiency refers to a
firm’s ability to effectively combine and deploy advertising and promotion expenses to achieve
sales goals. It was our expectation that advertising and promotion efficiency positively affects
abnormal stock returns to rebranding announcements. Researchers have adopted two main
approaches to measure advertising and promotion efficiency. Traditionally, research has directly
modeled efficiency using output/input ratios. Simple ratio measures reflect average performance
without accounting for individual heterogeneity. The other approach used more in recent
research (e.g., Luo and Homburg, 2007) is the Data Envelopment Analysis (DEA) approach
developed by Charnes, Cooper, and Rhodes (1978). DEA efficiency measures are based on the
comparison with the most efficient firms that operate under similar situations. Hence, DEA
accounts for firm heterogeneity (Luo and Homburg, 2007). To model advertising and promotion

75
efficiency using the DEA approach, we used selling, general, and administrative expenses as the
input variable and sales and ROA as the output variables.
Market share. Market share was computed as the firm’s share of the 4-digit SIC total
sales.
Firm diversification. Firm diversification is computed using the widely used entropy
measure (Jacquemin and Berry 1979):
E = ∑ pi
N
i=1
ln1
pi
where pi is the share of the ith segment (four-digit SIC level) of the firm’s total sales.
Firm Age. Firm age is the number of years from firm establishment to the rebranding
project. The information about the year of establishment was collected from Gale Directory
Library and MarketLine Advantage (formerly known as Datamonitor 360)
Services or products. We control for whether major offerings of a firm are services or
products. Consistent with prior research (Bahadir, Bharadwaj, and Srivastava, 2008), we created
a dummy variable that takes the value of 1 if the firm’s 4-digit SIC code begins with 4-9 and 0 if
otherwise.
Firm Size. Firm size was computed by taking natural log of total assets (e.g., Sorescu,
Shankar, and Kushwaha, 2007).
Industry sales growth. Consistent with prior research (Balasubramaniam 1990), we
measured industry sales growth as the average three-year sales growth for a 4-digit SIC code in
the sample.
Industry R&D emphasis. Consistent with prior research (e.g., Boyd, Chandy, and Cunha,
2010), we use total R&D expenditures divided by total assets in a 4-digit SIC code as the proxy
measure of industry R&D emphasis.

76
Industry advertising emphasis. We use total advertising expenditures divided by total
assets in a 4-digit SIC code as the proxy measure of industry advertising emphasis (e.g., Boyd,
Chandy, and Cunha, 2010).
Analysis
We model the impact of firm-level and industry-level factors on the two dimensions of degree of
rebranding (H1 and H2) as follows:
(1) IdentityChange = α0 + α1Δ(RelativeMarketShare) + α2IndustryCompetition + α3Restructuring
+ α4IndustryGrowth +α5MarketShare + α6FirmSize + α7FirmAge +
α8Service + α9IndustryR&D + α10IndustryAdvertising + u
(2) StrategyChange = β0 + β1Δ(RelativeMarketShare) + β2IndustryCompetition +
β3Restructuring + β4IndustryGrowth + β5MarketShare + β6FirmSize +
β7FirmAge + β8Service + β9IndustryR&D + β10IndustryAdvertising + v
We use the following model specification to predict cumulative abnormal returns (CAR) (H3-
H6):
(3) CAR =γ0+ γ1 IdentityChange + γ2StrategyChange + γ3Δ(RelativeMarketShare) +
γ4IndustryCompetition + γ5IdentityChange× Δ(RelativeMarketShare) +
γ6StrategyChange × Δ(RelativeMarketShare) + γ7IdentityChange×
IndustryCompetition + γ8StrategyChange× IndustryCompetition + γ9Restructuring +
γ10BrandAge + γ11PromotionEfficiency + γ12FirmSize + γ13Cash + γ14MarketShare +
γ15FirmAge + γ16Service + γ17IndustryGrowth + γ18IndustryR&D +
γ19IndustryAdvertising + r

77
Equations (1), (2), and (3) were estimated simultaneously with sem command in Stata 13.0. Two
notable model specifications include: (1) we allowed u and v to be correlated with each other,
and (2) we obtained clustered robust standard errors which relaxed the assumption of
independence among errors and allows for correlation at the industry level.
Hypotheses Testing
Hypothesis Testing: Model-Free Evidence
Table 2 provides the correlation matrix and descriptive statistics for all the variables. Brand
identity change is positively correlated with firm restructuring (r=0.32, p<0.05) and industry
growth (r=0.20, p<0.05). Brand strategy change is positively correlated with firm restructuring
(r=0.25, p<0.05) and industry competition (r=0.12, p<0.1). CARs have a significant positive
correlation with both brand identity change (r=0.19, p<0.05) and brand strategy change (r=0.17,
p<0.05). In addition, CARs are positively correlated with firm restructuring (r=0.19, p<0.05),
and negatively correlated with brand identity age (r=-0.15, p<0.05) and firm age (r=-0.17,
p<0.05). These correlations present some model-free evidence in support of your hypotheses
before we formally test our model.
Next, we will present the results from our formal hypothesis testing. Even though the
structural equations were estimated simultaneously, we report the results separately: degree of
rebranding results (Part 1 of the path model) and abnormal returns results (Part 2 of the path
model).
Hypothesis Testing: Degree of Rebranding Results
Table 3 provides the path-model estimation results, where the two dimensions of rebranding
were predicted by firm-level and industry-level factors. In H1, we predict that there is a negative

78
impact of firm competitive position on two dimensions of degree of rebranding. The results in
Table 3 suggest that firm competitive position has a negative, significant influence on the degree
of brand strategy change (β=-0.10, p<0.05), but no influence on the degree of brand identity
change (β=-0.04, p<0.05). Thus, H1b is supported but H1a is not.
In H2, we expect positive impacts of industry competition on both dimensions of
rebranding. The results showed that industry competition has a significantly positive impact on
the degree of brand strategy change (β =0.22, p<0.01). Surprisingly, we did not find the support
for its impact on degree of brand identity change (β =0.08, p>0.05). These results provide
supports for H2b, but not for H2a.
Taken together, the degree of rebranding results suggest that inferior competitive position
and a competitive industry environment motivate firms to modify brand strategy via rebranding.
However, these competitive factors do not motivate the changes in brand identity.
Among the control variables, structure change and firm size were found to affect both
dimensions of rebranding. Structure change has a significant positive impact on degree of brand
identity change (β=0.23, p<0.01) and brand strategy change (β=0.24, p<0.01). This finding is
consistent with qualitative findings in prior research (e.g., Muzellec and Lambkin, 2006). Firm
size has a significant negative impact on the degree of brand identity change (β=-0.21, p<0.01)
and brand strategy change (β=-0.17, p<0.01). This confirms our conventional wisdom that large
firms are more reluctant (or less flexible) to change their brand identity and brand strategy.
The Worth of Rebranding
The average abnormal returns and test statistics for various event windows (time frames)
surrounding the rebranding announcement date are in Table 4. To estimate the impact of
rebranding on firm value (H3), we examined whether cumulative abnormal returns for event

79
windows surrounding the rebranding announcement date are significantly different from zero.
The results from time series standard deviation tests and generalized sign z values suggest that
cumulative abnormal returns in various event windows are significantly larger than 0, and the
effect is robust across different event windows. This result indicates that rebranding
announcements are associated with significantly positive stock returns. If we focus on the -5-day
to +5-day event window, we observe an average increase of 2.15% (t=3.03, p<0.05) in stock
prices, which corresponds to an average of $27 million gain in market value for sampled firms.
The generalized sign statistic (Z) provides support for the robustness of the positive abnormal
returns (Z=2.91, p<0.05, 131 positive vs. 98 negative). On the event day (Day 0), 132 out of 229
(i.e., 58% of) abnormal returns were positive. All the above results lend strong support for H3.
Consistent with prior research (e.g., Boyd, Chandy and Cunha, 2010; Raassens, Wuyts,
and Geyskens, 2012), we choose the event window with the most significant abnormal returns.
In our data, both -5-day to +5-day window and -3-day to +5-day window have significant
abnormal returns. We estimated CAR(-5, +5) in our main analysis and use CAR(-3, +5) for a
robustness check.
Hypothesis Testing: Abnormal Returns Results
Results from firm and industry controls. The control model (Model 1, Table 5) only explains
7.92% of the variance in abnormal returns. Results in Table 5 indicate that abnormal returns to
rebranding announcement are positively associated with firm restructuring (β=0.15, p<0.01).
This is probably because, for investors, firm restructuring provides necessary legitimacy or
rationality to rebranding projects. We also find abnormal returns to rebranding are diminished by
brand identity age (β=-0.08, p<0.05). Consistent with theory and intuition, this suggests that
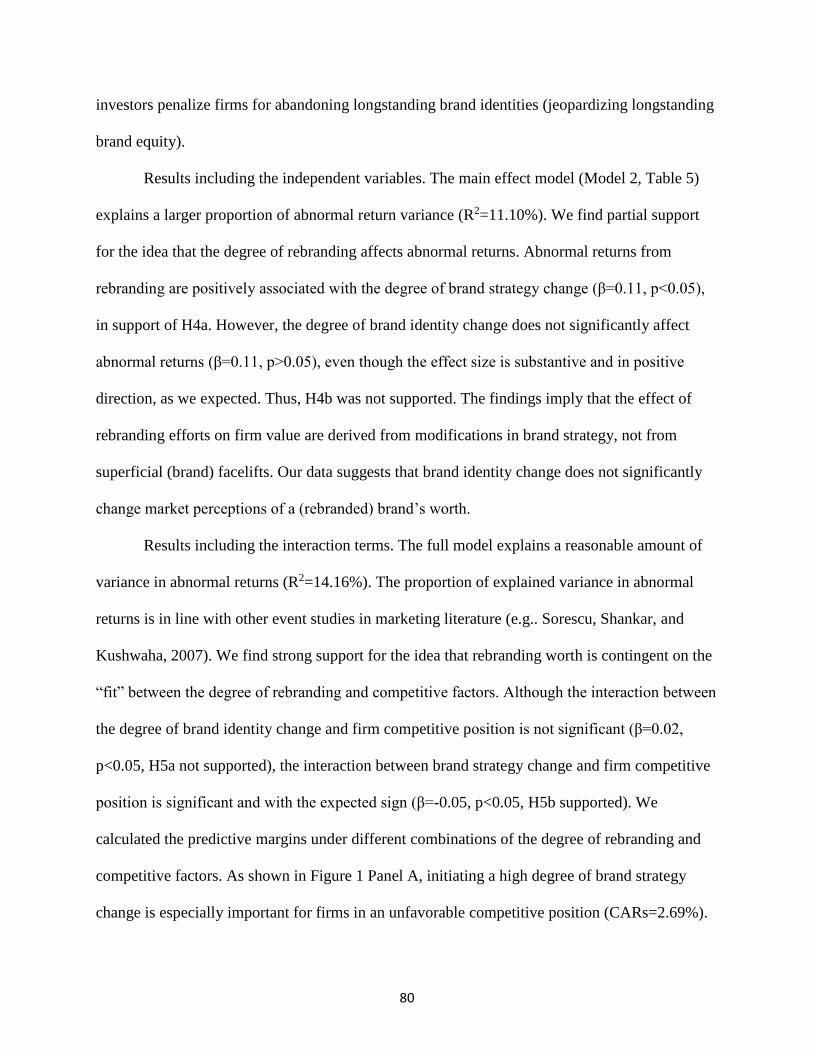
80
investors penalize firms for abandoning longstanding brand identities (jeopardizing longstanding
brand equity).
Results including the independent variables. The main effect model (Model 2, Table 5)
explains a larger proportion of abnormal return variance (R2=11.10%). We find partial support
for the idea that the degree of rebranding affects abnormal returns. Abnormal returns from
rebranding are positively associated with the degree of brand strategy change (β=0.11, p<0.05),
in support of H4a. However, the degree of brand identity change does not significantly affect
abnormal returns (β=0.11, p>0.05), even though the effect size is substantive and in positive
direction, as we expected. Thus, H4b was not supported. The findings imply that the effect of
rebranding efforts on firm value are derived from modifications in brand strategy, not from
superficial (brand) facelifts. Our data suggests that brand identity change does not significantly
change market perceptions of a (rebranded) brand’s worth.
Results including the interaction terms. The full model explains a reasonable amount of
variance in abnormal returns (R2=14.16%). The proportion of explained variance in abnormal
returns is in line with other event studies in marketing literature (e.g.. Sorescu, Shankar, and
Kushwaha, 2007). We find strong support for the idea that rebranding worth is contingent on the
“fit” between the degree of rebranding and competitive factors. Although the interaction between
the degree of brand identity change and firm competitive position is not significant (β=0.02,
p<0.05, H5a not supported), the interaction between brand strategy change and firm competitive
position is significant and with the expected sign (β=-0.05, p<0.05, H5b supported). We
calculated the predictive margins under different combinations of the degree of rebranding and
competitive factors. As shown in Figure 1 Panel A, initiating a high degree of brand strategy
change is especially important for firms in an unfavorable competitive position (CARs=2.69%).

81
Those firms in an unfavorable competitive position that adopt only a low degree of brand
strategy change are indeed penalized by investors (CAR=-0.96%).
We hypothesized a positive interaction between brand identity change and industry
competition intensity in H6a. Contrary to our prediction, we find that the interaction is
significant but with an opposite sign (β=-0.15, p<0.05). This suggests that investors react less
favorably to a high degree of brand identity change in a highly competitive industry. Figure 1
Panel B illustrates the predicted effect of the interaction between brand identity change and
competitive position on abnormal returns. As shown in Figure 1 Panel B, in a competitive
environment, rebranding projects with a low degree of brand identity change create high firm
value than those with high degree of brand identity change (CAR=2.25 vs. 1.05). However, in a
less competitive environment, rebranding projects with a high degree of brand identity change
create significantly higher value than those with low degree of brand identity change (CAR=
4.82 vs. -1.23). This is perhaps because investors factored in the significant loss of customer-
based brand equity associated with identity changes. In a highly competitive environment, it may
be more crucial for firms to preserve their brand-identity-related elements to protect its current
brand equity. When firms abandon their names or logos and customers are not familiar with the
new names or logos, firms can more easily lose their customers to competitors in a competitive
industry. Therefore, investors may reward firms for keeping their brand identities intact in a
competitive environment.
Consistent with our prediction in H6b, we find that rebranding worth (abnormal stock
return) is positively related to the interaction between brand strategy change and industry
competition (β=0.17, p<0.05). This result indicates that investors reward a high degree of brand
strategy change in highly competitive environments. Figure 1 Panel C illustrates the predicted

82
effect of the interaction between brand strategy change and competitive position on abnormal
returns. As shown in Figure 1 Panel C, in a highly competitive environment, rebranding projects
with a high degree of brand strategy change create significantly higher shareholder value than
those projects with a low degree of brand strategy change (CAR=4.89 vs. -1.65). However, in a
less competitive environment, rebranding projects with a low degree of brand strategy change
can create higher value than those with high degree of brand strategy change (CAR=2.36 vs.
1.17).
Robustness Tests
Several robustness checks were performed on our results. First, we reestimated our models using
alternative measures of industry competition (Herfindahl-Hirschmann index computed as the
sum of square of market shares at the 4-digit SIC level). The magnitudes and signs of the path
coefficients remained unchanged. Second, we used alternative expected return models (e.g.,
Fama-French three-factor model) for calculating abnormal returns. The magnitudes and signs of
the path coefficients remained unchanged. Finally, we reesimated the models used an alternative
event window, -3-day to +5-day window, and again the magnitudes and signs of the path
coefficients did not change.
Discussion
This research examines the antecedents of firms’ rebranding decisions and the conditions under
which rebranding projects have positive or negative influences on firm value. Building upon
“structure-conduct-performance” paradigm and strategic fit perspectives in literature, we propose
a research model that specifies relationship among competitive factors (firm competitive position
and industry competition intensity), two dimension of rebranding, and shareholder value. We
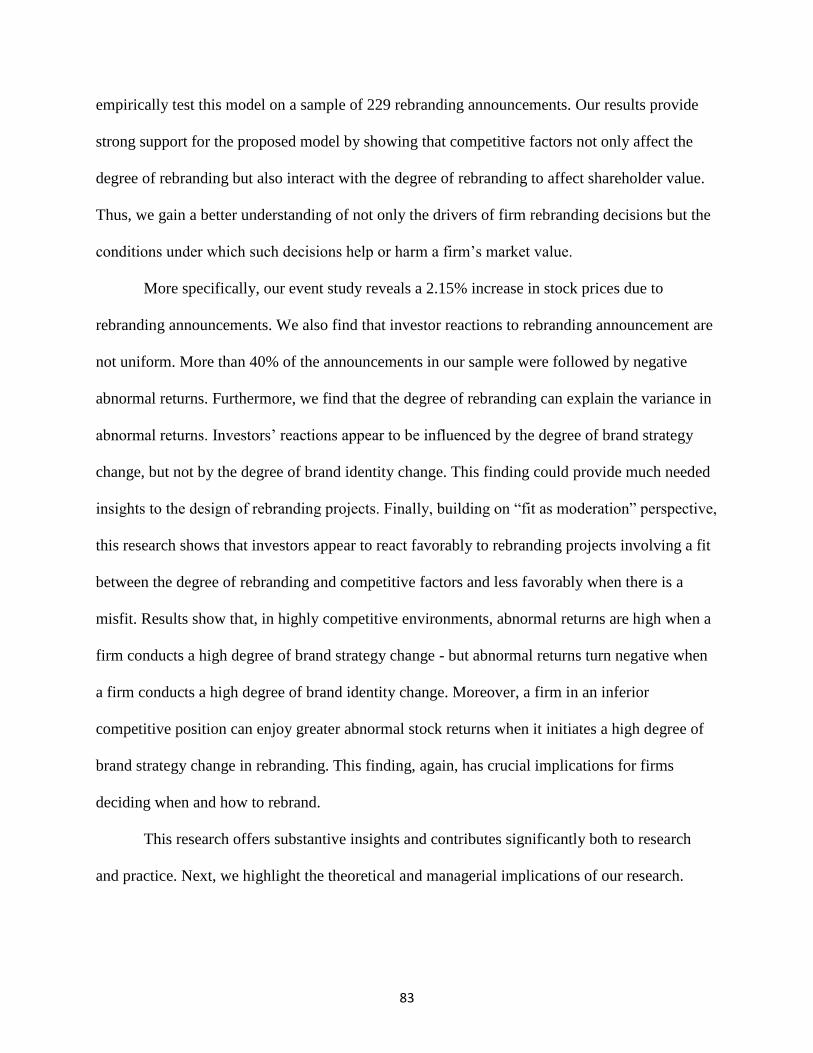
83
empirically test this model on a sample of 229 rebranding announcements. Our results provide
strong support for the proposed model by showing that competitive factors not only affect the
degree of rebranding but also interact with the degree of rebranding to affect shareholder value.
Thus, we gain a better understanding of not only the drivers of firm rebranding decisions but the
conditions under which such decisions help or harm a firm’s market value.
More specifically, our event study reveals a 2.15% increase in stock prices due to
rebranding announcements. We also find that investor reactions to rebranding announcement are
not uniform. More than 40% of the announcements in our sample were followed by negative
abnormal returns. Furthermore, we find that the degree of rebranding can explain the variance in
abnormal returns. Investors’ reactions appear to be influenced by the degree of brand strategy
change, but not by the degree of brand identity change. This finding could provide much needed
insights to the design of rebranding projects. Finally, building on “fit as moderation” perspective,
this research shows that investors appear to react favorably to rebranding projects involving a fit
between the degree of rebranding and competitive factors and less favorably when there is a
misfit. Results show that, in highly competitive environments, abnormal returns are high when a
firm conducts a high degree of brand strategy change - but abnormal returns turn negative when
a firm conducts a high degree of brand identity change. Moreover, a firm in an inferior
competitive position can enjoy greater abnormal stock returns when it initiates a high degree of
brand strategy change in rebranding. This finding, again, has crucial implications for firms
deciding when and how to rebrand.
This research offers substantive insights and contributes significantly both to research
and practice. Next, we highlight the theoretical and managerial implications of our research.

84
Theoretical Implications
Considering that there has been scant empirical research in the area of rebranding, we
have limited understanding of the causes and performance consequences of rebranding decisions.
This work contributes to nascent academic research on this topic in the following ways.
First, building on “structure-conduct-performance” paradigm, this work (1) brings
insights and clarity to rebranding issues (2) can serve as a foundation for more future research on
this topic. Discussion of the causes and consequences of rebranding in prior research is mainly
based on anecdotal evidences. To the best of our knowledge, our work is the first to empirically
examine rebranding. We argue and empirically demonstrate that competitive factors, such as
declining relative market share and competitive industrial environments, influence not only the
degree of rebranding, but also interact with the degree of rebranding to influence shareholder
value. Thus, we provide a more nuanced understanding of the antecedents and performance
outcomes of rebranding decisions.
Second, this research can potentially bring some closure to the debates in prior literature
over the influence of rebranding on firm performance. There have been controversial arguments
regarding the effects of rebranding (Muzellec, Doogan, and Lambkin 2003; Muzellec and
Lambkin 2006). It can be argued that rebranding undermines a firm’s existing brand associations
and customer-based brand equity, and thus is risky and a potential waste of resources. It can also
be argued that rebranding updates brand associations and should generate positive customer-
based brand equity (and shareholder value as a consequence). Considering the conflicting
arguments, scholarly examination is imperative, to understand whether and under what
conditions the risks and investments associated with rebranding translate to financial
performance of the firm. We help resolve this controversy by assessing financial returns that
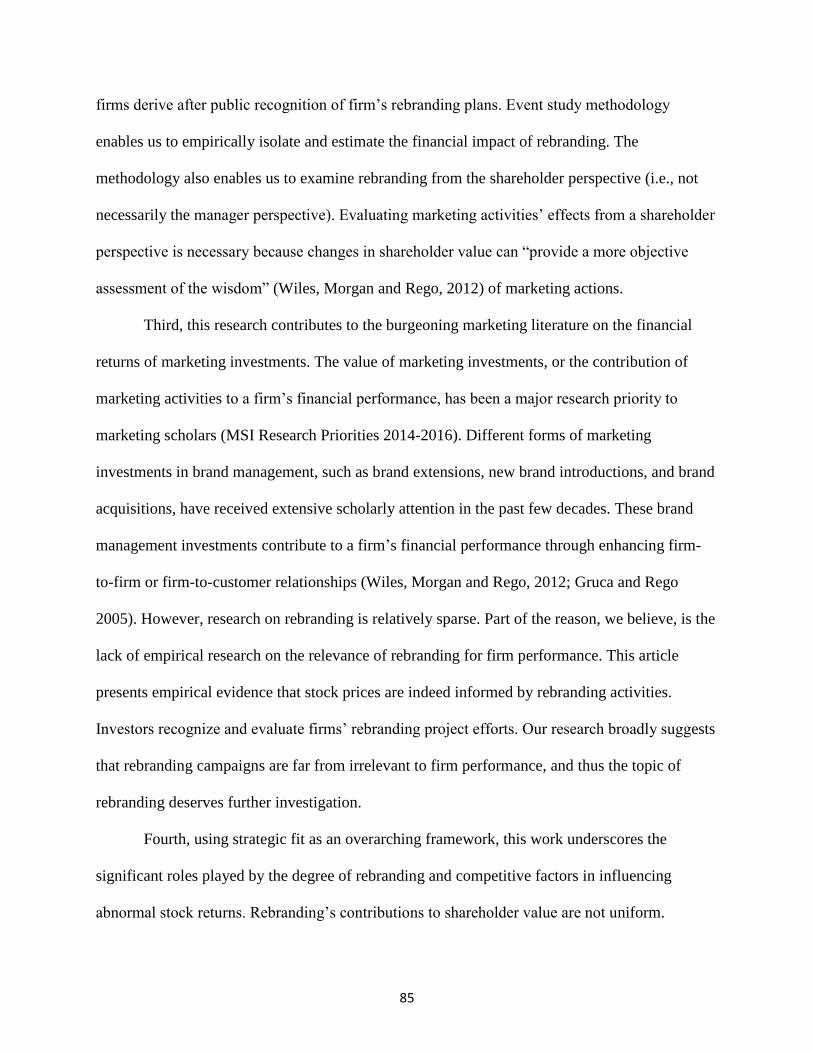
85
firms derive after public recognition of firm’s rebranding plans. Event study methodology
enables us to empirically isolate and estimate the financial impact of rebranding. The
methodology also enables us to examine rebranding from the shareholder perspective (i.e., not
necessarily the manager perspective). Evaluating marketing activities’ effects from a shareholder
perspective is necessary because changes in shareholder value can “provide a more objective
assessment of the wisdom” (Wiles, Morgan and Rego, 2012) of marketing actions.
Third, this research contributes to the burgeoning marketing literature on the financial
returns of marketing investments. The value of marketing investments, or the contribution of
marketing activities to a firm’s financial performance, has been a major research priority to
marketing scholars (MSI Research Priorities 2014-2016). Different forms of marketing
investments in brand management, such as brand extensions, new brand introductions, and brand
acquisitions, have received extensive scholarly attention in the past few decades. These brand
management investments contribute to a firm’s financial performance through enhancing firm-
to-firm or firm-to-customer relationships (Wiles, Morgan and Rego, 2012; Gruca and Rego
2005). However, research on rebranding is relatively sparse. Part of the reason, we believe, is the
lack of empirical research on the relevance of rebranding for firm performance. This article
presents empirical evidence that stock prices are indeed informed by rebranding activities.
Investors recognize and evaluate firms’ rebranding project efforts. Our research broadly suggests
that rebranding campaigns are far from irrelevant to firm performance, and thus the topic of
rebranding deserves further investigation.
Fourth, using strategic fit as an overarching framework, this work underscores the
significant roles played by the degree of rebranding and competitive factors in influencing
abnormal stock returns. Rebranding’s contributions to shareholder value are not uniform.

86
Although abnormal returns from rebranding campaigns, on average, are positive, these returns
are negative in over 40% of the cases in our sample. Thus, it is important for researchers to
identify specific conditions under which rebranding campaigns contribute more or less to firm
value. Our findings suggest that financial returns from rebranding are highly contingent on
specific features (or dimensions) of rebranding. We find that abnormal stock returns are
influenced by the degree of brand strategy change but not by the degree of brand identity change.
Our work is the first to empirically test the differential influences of two dimension of
rebranding on firm performance. More importantly, we find evidence that investors consider the
fit between brand strategy change and firm competitive position and industry competitive
intensity in judging the implications of rebranding for future cash flow. The finding suggests that
investors do consider firm competitive position and industry competitive intensity when judging
the justification or rationality of rebranding decisions.
Managerial Implications
This work has some noteworthy implications for contemporary marketing practice. First, we
offer some guidelines (or at least insight) to investors for evaluating rebranding projects. This
work is the first to present the evidence that investors consider rebranding as a wise marketing
practice. The relevance of rebranding to stock prices suggest that investors (1) are aware of
rebranding announcements and (2) pay close attention to the specific content of those
announcements. One specific insight from our research is that investors rely on competitive
factors as cues to evaluate the legitimacy of rebranding decisions. Investors also reward firms for
identifying a match between the degree of rebranding and competitive factors.
Second, we provide some new insights for managers who are considering launching
rebranding projects. The finding that rebranding campaigns bring about significant financial
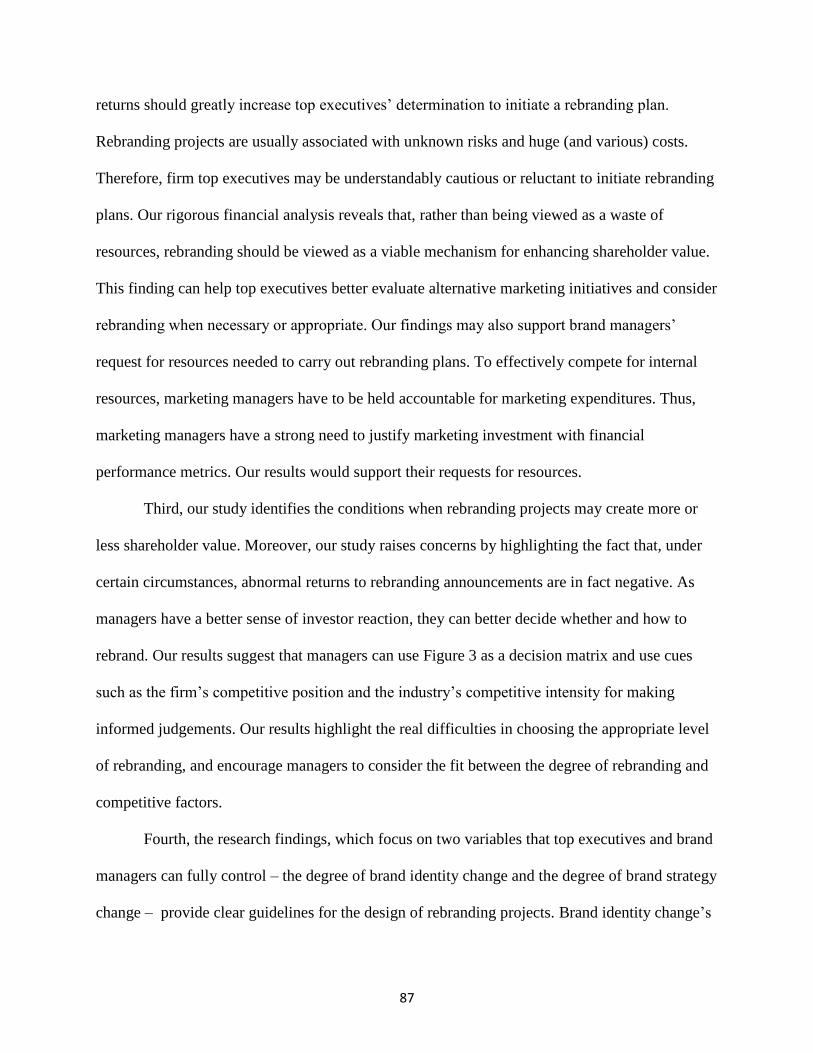
87
returns should greatly increase top executives’ determination to initiate a rebranding plan.
Rebranding projects are usually associated with unknown risks and huge (and various) costs.
Therefore, firm top executives may be understandably cautious or reluctant to initiate rebranding
plans. Our rigorous financial analysis reveals that, rather than being viewed as a waste of
resources, rebranding should be viewed as a viable mechanism for enhancing shareholder value.
This finding can help top executives better evaluate alternative marketing initiatives and consider
rebranding when necessary or appropriate. Our findings may also support brand managers’
request for resources needed to carry out rebranding plans. To effectively compete for internal
resources, marketing managers have to be held accountable for marketing expenditures. Thus,
marketing managers have a strong need to justify marketing investment with financial
performance metrics. Our results would support their requests for resources.
Third, our study identifies the conditions when rebranding projects may create more or
less shareholder value. Moreover, our study raises concerns by highlighting the fact that, under
certain circumstances, abnormal returns to rebranding announcements are in fact negative. As
managers have a better sense of investor reaction, they can better decide whether and how to
rebrand. Our results suggest that managers can use Figure 3 as a decision matrix and use cues
such as the firm’s competitive position and the industry’s competitive intensity for making
informed judgements. Our results highlight the real difficulties in choosing the appropriate level
of rebranding, and encourage managers to consider the fit between the degree of rebranding and
competitive factors.
Fourth, the research findings, which focus on two variables that top executives and brand
managers can fully control – the degree of brand identity change and the degree of brand strategy
change – provide clear guidelines for the design of rebranding projects. Brand identity change’s
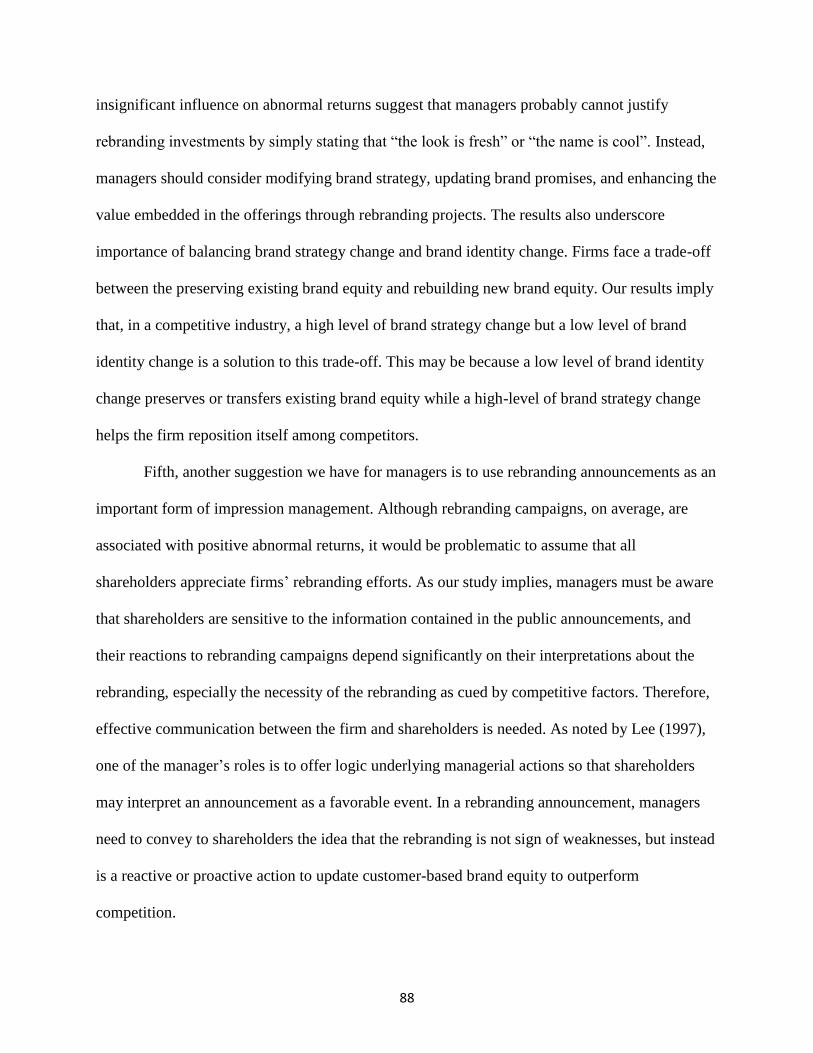
88
insignificant influence on abnormal returns suggest that managers probably cannot justify
rebranding investments by simply stating that “the look is fresh” or “the name is cool”. Instead,
managers should consider modifying brand strategy, updating brand promises, and enhancing the
value embedded in the offerings through rebranding projects. The results also underscore
importance of balancing brand strategy change and brand identity change. Firms face a trade-off
between the preserving existing brand equity and rebuilding new brand equity. Our results imply
that, in a competitive industry, a high level of brand strategy change but a low level of brand
identity change is a solution to this trade-off. This may be because a low level of brand identity
change preserves or transfers existing brand equity while a high-level of brand strategy change
helps the firm reposition itself among competitors.
Fifth, another suggestion we have for managers is to use rebranding announcements as an
important form of impression management. Although rebranding campaigns, on average, are
associated with positive abnormal returns, it would be problematic to assume that all
shareholders appreciate firms’ rebranding efforts. As our study implies, managers must be aware
that shareholders are sensitive to the information contained in the public announcements, and
their reactions to rebranding campaigns depend significantly on their interpretations about the
rebranding, especially the necessity of the rebranding as cued by competitive factors. Therefore,
effective communication between the firm and shareholders is needed. As noted by Lee (1997),
one of the manager’s roles is to offer logic underlying managerial actions so that shareholders
may interpret an announcement as a favorable event. In a rebranding announcement, managers
need to convey to shareholders the idea that the rebranding is not sign of weaknesses, but instead
is a reactive or proactive action to update customer-based brand equity to outperform
competition.
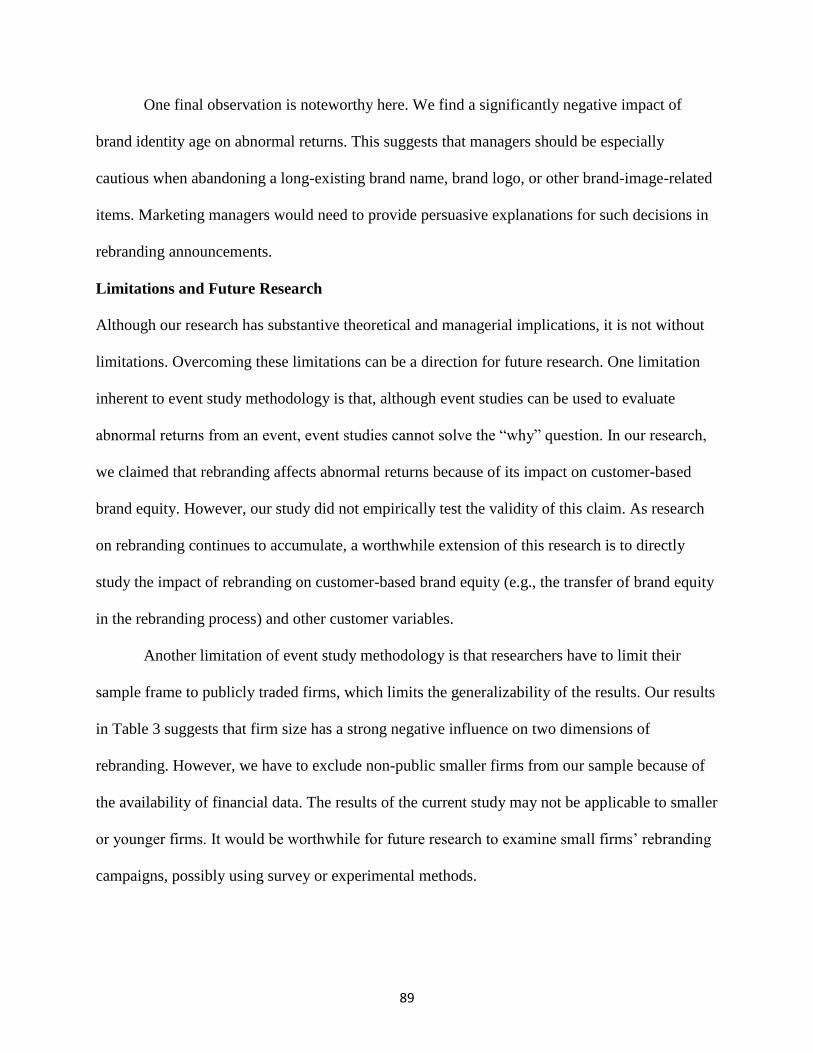
89
One final observation is noteworthy here. We find a significantly negative impact of
brand identity age on abnormal returns. This suggests that managers should be especially
cautious when abandoning a long-existing brand name, brand logo, or other brand-image-related
items. Marketing managers would need to provide persuasive explanations for such decisions in
rebranding announcements.
Limitations and Future Research
Although our research has substantive theoretical and managerial implications, it is not without
limitations. Overcoming these limitations can be a direction for future research. One limitation
inherent to event study methodology is that, although event studies can be used to evaluate
abnormal returns from an event, event studies cannot solve the “why” question. In our research,
we claimed that rebranding affects abnormal returns because of its impact on customer-based
brand equity. However, our study did not empirically test the validity of this claim. As research
on rebranding continues to accumulate, a worthwhile extension of this research is to directly
study the impact of rebranding on customer-based brand equity (e.g., the transfer of brand equity
in the rebranding process) and other customer variables.
Another limitation of event study methodology is that researchers have to limit their
sample frame to publicly traded firms, which limits the generalizability of the results. Our results
in Table 3 suggests that firm size has a strong negative influence on two dimensions of
rebranding. However, we have to exclude non-public smaller firms from our sample because of
the availability of financial data. The results of the current study may not be applicable to smaller
or younger firms. It would be worthwhile for future research to examine small firms’ rebranding
campaigns, possibly using survey or experimental methods.

90
In the current research, our focus is the short-term impact of rebranding announcements
on stock price. However, investors may revise their initial expectation of a firm’s prospective
cash flow as they gain a better understanding of the implementation of a rebranding project.
Rebranding is a not a one-time announcement, but more a systematically planned, structured, and
implemented process (Tevi 2013; Juntunen, Saraniemi and Jussila 2009). Thus, although
rebranding may be associated with positive short-term stock returns, a further challenge for firms
is executing rebranding as planned to ensure long-term returns. Future research should go
beyond a short-term window in estimating the effect of rebranding on firm value.

91
APPENDICES

92
APPENDIX A
TABLES
Table 2-1: Variable Operationalization
Variable Operationalization Data Source
Abnormal Returns ARit = Rit − E(Rit). Carhart (1997) model. CRSP
Degree of Brand
Identity Change
A 1-10 scale measuring the extent to which brand-
identity-related elements, such as brand name or
brand logo, are changed. Band name change (5-10) is
generally regarded as a higher degree of brand
identity change than a marketing aesthetic change (1-
6).
Press reports
Degree of Brand
Strategy Change
A 0-10 scale measuring the extent to which brand
strategy is modified or improved. The modifications
or improvements can be zero or minimal (0-3),
medium (4-6), or high (7-10).
Press reports
Change in
Competitive
Position
Δ(relative market share) = relative market share at
Year(t-1) - relative market share at Year(t-2)
Compustat
Industry
Competition
Entropy measure Compustat
Firm
Restructuring
1 if there are firm structure changes before a
rebranding project; 0 if otherwise
Press reports
Free Cash Flow Free cash flow = Operating income - Total income
taxes - Gross interest expenses-Dividends
Compustat
Brand Identity
Age
The number of years from the brand identity being
invented to being rebranded.
Compustat;
USPTO
Advertising and
Promotion
efficiency
A firm’s ability to convert advertising and
promotional expenditures to marketing outputs. It is
computed using DEA approach.
Compustat
Market Share A firm’s share of the 4-digit SIC total sales at Year(t-
1)
Compustat
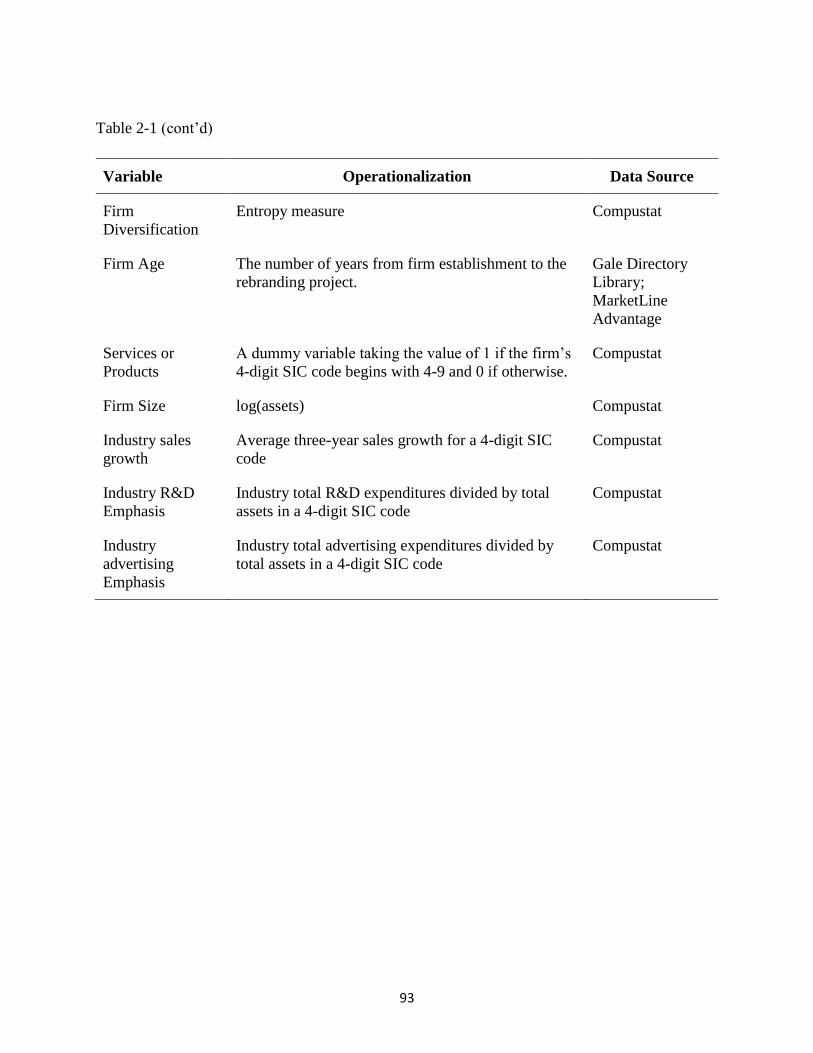
93
Table 2-1 (cont’d)
Variable Operationalization Data Source
Firm
Diversification
Entropy measure Compustat
Firm Age The number of years from firm establishment to the
rebranding project.
Gale Directory
Library;
MarketLine
Advantage
Services or
Products
A dummy variable taking the value of 1 if the firm’s
4-digit SIC code begins with 4-9 and 0 if otherwise.
Compustat
Firm Size log(assets) Compustat
Industry sales
growth
Average three-year sales growth for a 4-digit SIC
code
Compustat
Industry R&D
Emphasis
Industry total R&D expenditures divided by total
assets in a 4-digit SIC code
Compustat
Industry
advertising
Emphasis
Industry total advertising expenditures divided by
total assets in a 4-digit SIC code
Compustat

94
Table 2-2: Correlations and Descriptive Statistics
Mean S.D. 1 2 3 4 5 6 7 8 9
[1] CAR(-5, +5) 1.81 11.43
[2] Brand Identity Change 5.81 2.71 0.19a
[3] Brand Strategy Change 5.13 1.93 0.17a 0.32a
[4] Restructuring 0.27 0.44 0.19a 0.29a 0.25a
[5] Δ(Market Share) 0.00 0.02 0.04 -0.04 -0.06 0.09
[6] Industry Competition 2.38 1.02 0.01 0.08 0.12b 0.05 -0.06
[7] Industry Growth 6.05 10.47 0.02 0.20a 0.03 0.09 -0.04 0.07
[8] Cash 1264.74 3889.86 -0.04 -0.14a -0.08 -0.11 0.00 -0.02 0.03
[9] Brand Identity Age 14.69 13.80 -0.15a 0.06 0.08 -0.12b -0.14a -0.15a -0.04 0.15a
[10] Promotion Efficiency 0.06 0.12 -0.02 0.04 0.03 0.00 0.23a -0.18a 0.12b -0.09 0.00
[11] Market Share 0.09 0.17 -0.08 -0.12b 0.00 -0.07 0.19a -0.44a 0.00 0.36a 0.29a
[12] Diversification 0.27 0.38 0.03 -0.01 -0.01 0.04 0.00 -0.17a -0.04 0.20a 0.14a
[13] Firm Age 41.01 35.89 -0.17a -0.17a -0.03 -0.13b -0.05 -0.14a -0.16a 0.09 0.41a
[14] Service 0.66 0.48 0.01 -0.01 -0.04 -0.04 -0.05 0.34a 0.20a 0.06 -0.15a
[15] Industry R&D 1.76 7.08 0.01 0.17a 0.06 0.11 0.00 0.09 0.19a -0.02 -0.07
[16] Industry Advertising 0.13 0.41 0.02 0.11 0.08 0.09 0.03 0.08 0.24a -0.05 -0.06
a Statistically significant at the 0.05 level (two-tailed). b Statistically significant at the 0.1 level (two-tailed).

95
Table 2-2 (cont’d)
10 11 12 13 14 15
[1] CAR(-5, +5)
[2] Brand Identity Change
[3] Brand Strategy Change
[4] Restructuring
[5] Δ(Market Share)
[6] Industry Competition
[7] Industry Growth
[8] Cash
[9] Brand Age
[10] Promotion Efficiency
[11] Market Share 0.22a
[12] Diversification 0.05 0.18a
[13] Firm Age 0.07 0.27a 0.23a
[14] Service 0.00 -0.12b -0.12b -0.14a
[15] Industry R&D -0.06 -0.09 -0.09 -0.10 -0.19a
[16] Industry Advertising -0.05 -0.08 -0.04 -0.15a 0.06 0.31a

96
Table 2-3: Degree of Rebranding Results (Path Model Part 1)
Independent Variables Brand Identity Change Brand Strategy Change
Estimate Conclusion Estimate Conclusion
Hypothesized Factors
H1ab: Firm Competitive Position -0.04 Not Supported -0.10b Supported
H2ab: Industry Competition Intensity 0.08 Not Supported 0.22a Supported
Controls:
Structure Change 0.23a 0.24a
Industry Growth 0.14a -0.01
Market Share 0.04 0.18a
Firm Size -0.21a -0.17a
Firm Age -0.05 0.04
Service -0.04 -0.09
Industry R&D 0.09 -0.02
Industry Advertising -0.01b 0.06
R2 17.80% 12.24%
Notes: T values were calculated based on cluster-robust standard errors which were adjusted for 102 clusters in 4-digit SIC a Statistically significant at the 0.05 level (two-tailed).
b Statistically significant at the 0.1 level (two-tailed).

97
Table 2-4: Abnormal Returns and Test Statistics Across Various Event Windows
Event Window Abnormal Returns (%) Positive: Negative Time Series Standard Deviation Test Generalized Sign Z
-5 -0.02 107:122 -0.09 -0.26
-4 0.13 120:109 0.62 1.46
-3 0.05 111:118 0.22 0.27
-2 0.13 116:113 0.61 0.93
-1 0.55 117:112 2.56a 1.06
0 0.48 132:97 2.24a 3.04b
1 -0.06 109:120 -0.27 0.00
2 0.37 117:112 1.71b 1.06
3 -0.03 114:115 -0.14 0.66
4 0.41 113:116 1.93b 0.53
5 0.14 105:124 0.66 -0.53
(-5,+5) 2.15 131:98 3.03a 2.91a
(-3,+3) 1.48 125:104 2.62a 2.12a
(-1,+1) 0.97 121:108 2.62a 1.59
(0,0) 0.48 132:97 2.24a 3.04a
(-1,+3) 1.30 116:113 2.73a 0.93
(-2,+5) 1.99 119:110 3.29a 1.32
(-3,+5) 2.04 121:108 3.17a 1.59
(+1,+3) 0.28 117:112 0.75 1.06 a Statistically significant at the 0.05 level (two-tailed).
b Statistically significant at the 0.1 level (two-tailed).

98
Table 2-5: Abnormal Returns Results (Path Model Part 2)
Independent Variables Cumulative Abnormal Returns
Model 1 Model 2 Model 3 Conclusion
Hypothesized Factors
H4a: Brand Identity Change 0.11 0.11
H4b: Brand Strategy Change 0.11b 0.12b
Firm Competitive Position 0.04 0.06
Industry Competition Intensity -0.03 -0.01
H5a: Identity × Competitive Position 0.02 Not Supported
H5b: Strategy × Competitive Position -0.05b Supported
H6a: Identity × Competition Intensity -0.15b Not Supported
H6b: Strategy × Competition Intensity 0.17a Supported
Controls:
Restructuring 0.15a 0.09 0.09
Brand Age -0.08b -0.11a -0.13a
Promotion Efficiency -0.02 -0.04 -0.03
Firm Size -0.11 -0.10 -0.10
Cash -0.05 -0.02 -0.03
Market Share 0.04 0.02 0.05
Firm Age -0.07 -0.05 -0.05
Service 0.00 0.01 0.00
Industry Growth -0.01 -0.02 -0.02
Industry R&D -0.02 -0.03 -0.03
Industry Advertising -0.02 -0.02 -0.03
R2 7.92% 11.10% 14.16%
Notes: T values were calculated based on cluster-robust standard errors which were adjusted for 102 clusters in 4-digit SIC a Statistically significant at the 0.05 level (two-tailed).
b Statistically significant at the 0.1 level (two-tailed).

99
APPENDIX B
FIGURES
Figure 2-1: Research Model
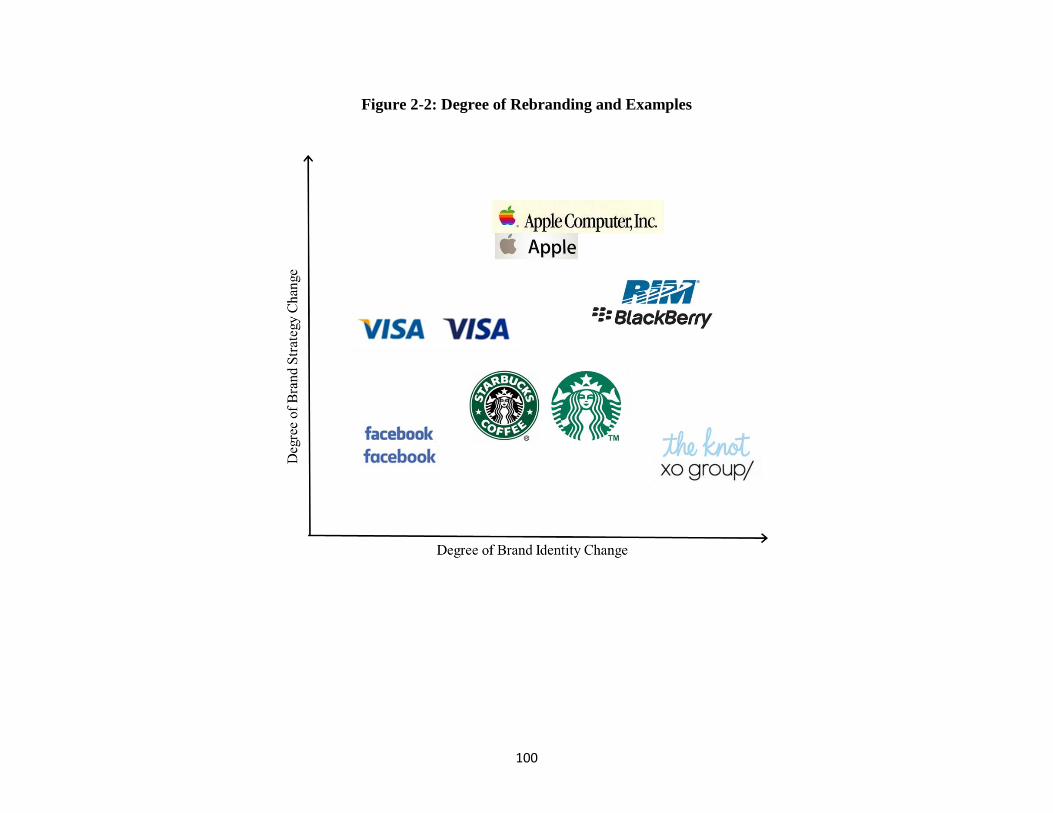
100
Figure 2-2: Degree of Rebranding and Examples

101
Figure 2-3: Interactions between Degree of Rebranding and Competition Factors
Panel A. Strategy Change × Competitive Position Panel B. Identity Change × Competition Intensity
Panel C. Strategy Change × Competition Intensity

102
REFERENCES
103
REFERENCES
Bahadir, S. Cem, Sundar G. Bharadwaj, and Rajendra K. Srivastava (2008), "Financial Value of
Brands in Mergers and Acquisitions: Is Value in the Eye of the Beholder?" Journal of
Marketing, 72 (6), 49-64.
Balasubramanian, Siva K., Ike Mathur, and Ramendra Thakur (2005), "The Impact of High-
Quality Firm Achievements on Shareholder Value: Focus on Malcolm Baldrige and JD
Power and Associates Awards," Journal of the Academy of Marketing Science, 33 (4),
413-22.
Balasubramanian, Siva K., and Vipin Kumar (1990), "Analyzing Variations in Advertising and
Promotional Expenditures: Key Correlates in Consumer, Industrial, and Service
Markets," Journal of Marketing, 54 (2), 57-68.
Bliese, Paul D. (2000), "Within-Group Agreement, Non- Independence, and Reliability:
Implications for Data Aggregation and Analysis," in Multilevel Theory, Research, and
Methods in Organizations, Katherine J. Klein and Steve W.J. Kozlowski, eds. San
Francisco: Jossey-Bass, 349-81.
Brown, Stephen J., and Jerold B. Warner (1980), "Measuring Security Price Performance."
Journal of Financial Economics, 8 (3), 205-58.
Charnes, Abraham, William W. Cooper, and Edwardo Rhodes (1978), "Measuring the Efficiency
of Decision Making Units," European Journal of Operational Research, 2 (6), 429-44.
Boyd, Eric D., Rajesh K. Chandy, and Marcus Cunha Jr. (2010), "When Do Chief Marketing
Officers Affect Firm Value? A Customer Power Explanation," Journal of Marketing
Research, 47 (6), 1162-76.
Brown, Stephen J. and Jerold B. Warner (1980), "Measuring Security Price Performance,"
Journal of Financial Economics, 8 (3), 205-58.
Carhart, Mark M. (1997), "On Persistence in Mutual Fund Performance," Journal of Finance, 52
(1), 57-82.
Daly, Aidan and Deirdre Moloney (2005), "Managing Corporate Rebranding," Irish Marketing
Review, 17 (1/2), 30-36.
Fama, Eugene F. (1970), "Efficient Capital Markets: A Review of Theory and Empirical Work,"
Journal of Finance, 25 (2), 383-417.
Fama, Eugene F., Lawrence Fisher, Michael C Jensen, and Richard Roll (1969), "The
Adjustment of Stock Prices to New Information," International Economic Review, 10 (1),
1-21.

104
Fama, Eugene F., and Kenneth R. French (1993), "Common Risk Factors in The Returns On
Stocks and Bonds," Journal of Financial Economics, 33 (1), 3-56.
Fama, Eugene F., and Kenneth R. French (1996), "Multifactor Explanations of Asset Pricing
Anomalies," Journal of Finance, 51 (1), 55-84.
Fornell, Claes, Sunil Mithas, Forrest V. Morgeson III, M.S. Krishnan (2006), "Customer
Satisfaction and Stock Prices: High Returns, Low Risk," Journal of Marketing, 70 (1), 3-
14.
Geyskens, Inge, Katrijn Gielens, and Marnik G. Dekimpe (2002), "The Market Valuation of
Internet Channel Additions," Journal of Marketing, 66 (2), 102-19.
Gotsi, Manto, and Constantine Andriopoulos (2007), "Understanding the Pitfalls in The
Corporate Rebranding Process," Corporate Communications: An International Journal,
12 (4), 341-55.
Gruca, Thomas S., and Lopo L. Rego (2005), "Customer Satisfaction, Cash Flow, and
Shareholder Value," Journal of Marketing, 69 (3), 115-130.
Horsky, Dan and Patrick Swyngedouw (1987), "Does It Pay to Change Your Company's Name?
A Stock Market Perspective," Marketing Science, 6 (4), 320-35.
Homburg, Christian, and Andreas Fürst (2005), "How Organizational Complaint Handling
Drives Customer Loyalty: An Analysis of the Mechanistic and the Organic
Approach," Journal of Marketing, 69 (3), 95-114.
Hyman, Michael R., and Ike Mathur (2005), "Retrospective and Prospective Views on the
Marketing-Finance Interface," Journal of the Academy of Marketing Science, 33 (4), 390-
400.
Jacquemin, Alexis P., and Charles H. Berry (1979), "Entropy Measure of Diversification and
Corporate Growth," Journal of Industrial Economics, 27 (4), 35.9-69.
Jaju, Anupam, Christopher Joiner, and Srinivas K. Reddy (2006), "Consumer Evaluations of
Corporate Brand Redeployments," Journal of the Academy of Marketing Science, 34 (2),
206-15.
Juntunen, Mari, S. Saraniemi, and R. Jussila (2009), "Corporate Re-Branding as a Process in a
Professional Health Care Organization," in Proceedings of the 5th Thought Leaders
International Conference on Brand Management, April 6-7, Greece, Athens.
Kaikati, Andrew M. and Jack G. Kaikati (2004), "Stealth Marketing: How to Reach Consumers
Surreptitiously," California Management Review, 46 (4), 6-22.

105
Keller, Kevin Lane (1993), "Conceptualizing, Measuring, and Managing Customer-Based Brand
Equity," Journal of Marketing, 57 (1), 1-22.
Lambkin, Mary and Laurent Muzellec (2008), "Rebranding in the Banking Industry Following
Mergers and Acquisitions," International Journal of Bank Marketing, 26 (5), 328-52.
Lane, Vicki and Robert Jacobson (1995), "Stock Market Reactions to Brand Extension
Announcements: The Effects of Brand Attitude and Familiarity," Journal of Marketing,
63-77.
Lee, Zoe (2013), "Rebranding in Brand-Oriented Organisations: Exploring Tensions in the
Nonprofit Sector," Journal of Marketing Management, 29 (9-10), 1124-42.
Luo, Xueming, and Christian Homburg (2007), "Neglected Outcomes of Customer Satisfaction."
Journal of Marketing, 71 (2), 133-49.
Madden, Thomas J., Frank Fehle, and Susan Fournier (2006), "Brands Matter: An Empirical
Demonstration of the Creation of Shareholder Value through Branding," Journal of the
Academy of Marketing Science, 34 (2), 224-35.
Marketing Science Institute (2014), 2014–2016 Research Priorities, Cambridge, MA.
Merrilees, Bill, and Dale Miller (2008), "Principles of Corporate Rebranding," European Journal
of Marketing, 42 (5/6), 537-52.
Muzellec, Laurent, Manus Doogan, and Mary Lambkin (2003), "Corporate Rebranding-an
Exploratory Review," Irish Marketing Review, 16, 31-40.
Muzellec, Laurent and Mary Lambkin (2007), "Does Diageo Make Your Guinness Taste
Better?" Journal of Product & Brand Management, 16 (5), 321-33.
Muzellec, Laurent and Mary Lambkin (2008), "Corporate Rebranding and the Implications for
Brand Architecture Management: The Case of Guinness (Diageo) Ireland," Journal of
Strategic Marketing, 16 (4), 283-99.
Raassens, Néomie, Stefan Wuyts, and Inge Geyskens (2012), "The Market Valuation of
Outsourcing New Product Development," Journal of Marketing Research, 49 (5), 682-
95.
Shocker, Allan D., Rajendra K Srivastava, and Robert W Ruekert (1994), "Challenges and
Opportunities Facing Brand Management: An Introduction to the Special Issue," Journal
of Marketing Research, 149-58.
Singh, Anil Kumar, Vikas Tripathi, and Priyender Yadav (2012), "Rebranding and
Organisational Performance-Some Issues of Relevance," American Journal of
Sociological Research, 2 (5), 90-7.

106
Slotegraaf, Rebecca J., Christine Moorman, and J. Jeffrey Inman (2003), "The Role of Firm
Resources in Returns to Market Deployment," Journal of Marketing Research, 40 (3),
295-309.
Sorescu, Alina, Venkatesh Shankar, and Tarun Kushwaha (2007), "New Product
Preannouncements and Shareholder Value: Don't Make Promises You Can't
Keep," Journal of Marketing Research, 44 (3), 468-89.
Srinivasan, Raji, and Sundar Bharadwaj (2004), "Event Studies in Marketing Strategy Research,"
in Assessing Marketing Strategy Performance, Christine Moorman and Donald R.
Lehmann, eds. Cambridge, MA: Marketing Science Institute, 9-28.
Srivastava, Rajendra K., Tasadduq A. Shervani, and Liam Fahey (1998), "Market-Based Assets
and Shareholder Value: A Framework for Analysis," Journal of Marketing, 62 (1), 2-18.
Stuart, Helen and Laurent Muzellec (2004), "Corporate Makeovers: Can a Hyena Be
Rebranded?" Journal of Brand Management, 11 (6), 472-82.
Swaminathan, Vanitha, Feisal Murshed, and John Hulland (2008), "Value Creation Following
Merger and Acquisition Announcements: The Role of Strategic Emphasis Alignment."
Journal of Marketing Research, 45 (1), 33-47.
Tevi, Alexander (2013), "The Effect of Multiple Rebranding on Customer Loyalty in Nigerian
Mobile Telephony," International Journal of Marketing Studies, 5 (2), 120-30.
Varadarajan, Rajan, Mark P. DeFanti, and Paul S. Busch (2006), "Brand Portfolio, Corporate
Image, and Reputation: Managing Brand Deletions," Journal of the Academy of
Marketing Science 34 (2), 195-205.
Venkatraman, Nenkat. "The Concept of Fit in Strategy Research: Toward Verbal and Statistical
Correspondence," Academy of Management Review, 14 (3), 423-44.
Wiles, Michael A., and Anna Danielova (2009), "The Worth of Product Placement In Successful
Films: An Event Study Analysis," Journal of Marketing, 73 (4), 44-63.
Wiles, Michael A., Neil A. Morgan, and Lopo L. Rego (2012), "The Effect of Brand Acquisition
and Disposal on Stock Returns," Journal of Marketing, 76 (1), 38-58.