the impact of the panafrican orogeny sout river …apelm/pub/soutriver.pdf · the impact of the...
TRANSCRIPT

1
THE IMPACT OF THE PANAFRICAN OROGENY IN THE SOUT RIVER AREA, CAPE PROVINCE
by Marcus Apel, University of Cape Town
ABSTRACT The impact of the Pan-African orogeny in the Sout River area southwest of Bitterfontein on rocks of the Namaqualand Metamorphic Complex and on metasedimentary rocks of the Gariep Supergroup has been determined. Structural analysis, absolute geothermobarometry and fluid inclusion microthermobarometry were used to analyse the tectonic relationships of the various lithological units. The main Pan-African deformational phase caused eastsoutheast-verging normal folds which are often sheared in the late Proterozoic cover rocks. In the basement comprised by the Namaqualand Metamorphic Complex this event is reflected by the formation of a new foliation and lineation. A subsequent weaker phase led to northeast-ward thrusting of allochthonous units.The conditions of Pan-African thermal metamorphism in both basement and cover rocks are estimated at 560°C and 4kbar. The deformational succession in the study area and the Port Nolloth Zone of the northern Gariep belt is similar. Although the metamorphic grade experienced by the Sout River area is slightly higher than in the Port Nolloth Zone, the observations allow the correlation of the deformational events in the study area with the Panafrican northern Gariep Belt

2
1. INTRODUCTION The study area is situated at the Atlantic coast approximately 70 km southwest of Bitterfontein in the Cape Province, South Africa (Figure 1).
Figure 1. Schematic map showing the situation of the study area. After Gresse et al. 1993. The coast and the incised beds of the Sout River provide well-exposed Kibaran and Pan-African rocks. The spatial alignment of the various rock types and the structures is shown on the geological map and profile (Enclosure 1). The investigated area features a Kibaran basement comprised by rocks of the Bushmanland Subprovince of the Namaqualand Metamorphic Complex (N.M.C.). They form a northnortheast- southsouthwest trending synformal belt containing a sequence of quartzite’s, garnet-bearing mica-schists, paragneiss and migmatitic schists. A similar succession occurs within the Bitterfontein belt (Moore 1989) and shows chemical characteristics of acid metavolcanics. This psammitic-pelitic belt is underlain by ortho- and paragneisses of the Bushmanland subprovince of the Namaqualand Metamorphic Complex.. The synformal belt is surrounded by monotonous quartzo-feldspathic para- and orthogneisses. These rocks disappear to the west under younger metasedimentary rocks. Germe et al. (1991) correlated metasedimentary rocks in the Vanrhynsdorp area to the Gariep Supergroup. They represent a southern part of the Gariep Belt. Other workers ascribed the cover rocks in the study area to the Nama group (e.g. Waters et al. 1983). The unconformity between these rocks and the older basement has been described by Waters et al. (1983). The younger metasedimentary rocks form a shallow, unconformable syncline near the mouth of the Sout River and on the coast. Dating of mica from garnet-schists, of quartzite from a shear zone within the N.M.C. and of Stinkfontein Subgroup quartzite using the 40Ar/39Ar method (Frimmel et al. 1998) revealed Pan-African ages of 497±5 to 503±2 Ma for these rocks.

3
1.2. THE GEOTECTONIC FRAMEWORK The area has been affected by two Proterozoic orogenies. The Kibaran orogeny included a series of events, the latest of which is dated at about 1050 Ma (Waters 1990) and is responsible for granulite- to higher amphibolite facies metamorphism with mainly east-west trending structures of the Bushmanland subprovince. Between this event and the deposition of the Gariep Supergroup, a large scale sinistral rotation of the basement into north-south strike occurred along the west coast (Joubert 1971) and is of unknown tectonic relationship. The Gariep Supergroup sediments were deposited at a passive continental margin. It evolved to the west of the Kalahari craton after rifting and opening of the Adamastor Ocean at 741±6 Ma (Frimmel et al. 1996). This rifting event is related to the break-up of the Rodinia Supercontinent (Hartnady et al. 1985). Pan-African tectonics led to the closure of the Adamastor Ocean and oblique collision between the Kalahari craton and the Rio de la Plata plate at about 500 Ma (Frimmel et al. 1992, 1998). The main tectonic transport direction was southsoutheast, and metamorphism is low- to medium grade in the northern part of the Gariep belt (Frimmel 1995). Rifting in the Cretaceous led to the opening of the South Atlantic Ocean. The proposed stratigraphic succession of lithological units in the study area is shown in Table 1. STRATIGRAPHIC UNIT LITHOLOGY
syenite intrusion and rhyolitic dikes Phanerozoic intrusive rocks bostonite dikes
Hilda Subgroup dolomite with thin biotite schist layers Kaigas Formation
Diamictite Gariep Supergroup (late Proterozoic; Pan-African)
Stinkfontein Subgroup
Lekkersing Formation
gritty quartzite with basal conglomerate
migmatitic two-mica schist migmatitic biotite-plagioclase-quartz schist paragneiss garnet schist Quartzite syenitic augengneiss
Namaqua- Land Metam. Complex (mid- Proterozoic; Kibaran)
Bushmanland Subprovince
(supracrustal sequence) (basement)
quartz-biotite-plagioclase-K-feldspar paragneiss Table 1. Stratigraphic / lithologic subdivision of rocks present in the study area. The aim of this study is to determine the deformational and metamorphic history of the different lithologic units including their regional tectonic and sedimentary relationships. Data obtained by structural analysis, geothermobarometry and fluid inclusion studies are integrated to provide a model of the tectonic evolution of the area.

4
3. STRUCTURAL GEOLOGY 3.1. STRUCTURAL GEOLOGY OF ROCKS OF THE NAMAQUALAND METAMORPHIC COMPLEX The structural features were mapped and major elements - combined with data collected by A. Kroener (1968) - are shown in Appendix 1. The following chapter includes the gneisses, quartzites, schists and migmatitic biotite schists below the Lower Stinkfontein quartzite (PaS-Q) unconformity described by Waters et al. (1983). On a macro-scale, the Sout River region features SSW-NNE trending synforms and antiforms with moderate plunging eastern and steep to overturned western limbs. Two main deformational events are reflected by foliations or lineations. Kibaran structures were largely overprinted during Panafrican refoliation. The earliest preserved and most penetrative foliation s1 occurs parallel to lithological boundaries or banding - except for the fold hinges - and is defined by biotite, white mica and strained tectosilicates. This foliation is associated with a SSW- NNE striking lineation. This lineation is reflected by isoclinal folds and mineral preferred orientations. The foliation forms a partial great circle around the lineation direction, but because both limbs of the isoclinal folds are flat lying their poles plot in similar directions (Figure 2).

5
Figure 2. Schmidt net featuring structural data from the Sout River region. Symbols: • - poles to foliation Pa-s1 + - lineation Pa-l1 - lineation Pa-l2 + - poles to foliation Pa-s2 In hinges of isoclinal folds, white mica and biotite in paragneiss were found to show shape-preferred orientation in the fold axis direction and apparently random orientation perpendicular to it. This indicates syn-deformational refoliation s2. To the west of the contact to the N.M.C. basement paragneiss, the quartzite dips 293/28 and is characterized by strong isoclinal folding and flexural slip folding with sheared limbs and axial planes, and fold axes striking ca. 195/30. The lineation direction coincides with the biotite-defined lineation of 188/20 of Namaqua paragneiss east of the contact. It is to note that syenitic N.M.C.- derived augengneiss outcropping at the coast (31°12’50’’S 17°49’00’’E) west of the synformal belt shows a similar lineation of 230/12. Thus, they were probably affected by the same Panafrican deformational event Pa-D1. The isoclinal folds have amplitudes of 1-30 cm, and very tight limbs parallel to the axial plane foliation are common. The contact itself is it not exposed but is indicated by a zone of highly weathered quartzite. Pegmatoid quartz and quartz-feldspar segregations of up to 30 cm thickness occur in the quartzite-schist-migmatite sequence, and were also observed in the Namaqua paragneiss to the east of the contact and in Stinkfontein Subgroup quartzites on the coast. They are especially evolved within the shear bands of flexured isoclinal folds and are parallel to the lithological banding. They often form disrupted lensoid bodies. From field evidence, these are considered to represent first local partial melts. Near the N.M.C. paragneiss contact (31°91’51’’S, 17°55’23’’E), these sweats were conformably deformed during isoclinal folding - indicating their age to be pre/syn-Pa-D1. 3.1.1. QUARTZ C-AXIS PREFERRED ORIENTATION STUDIES
6
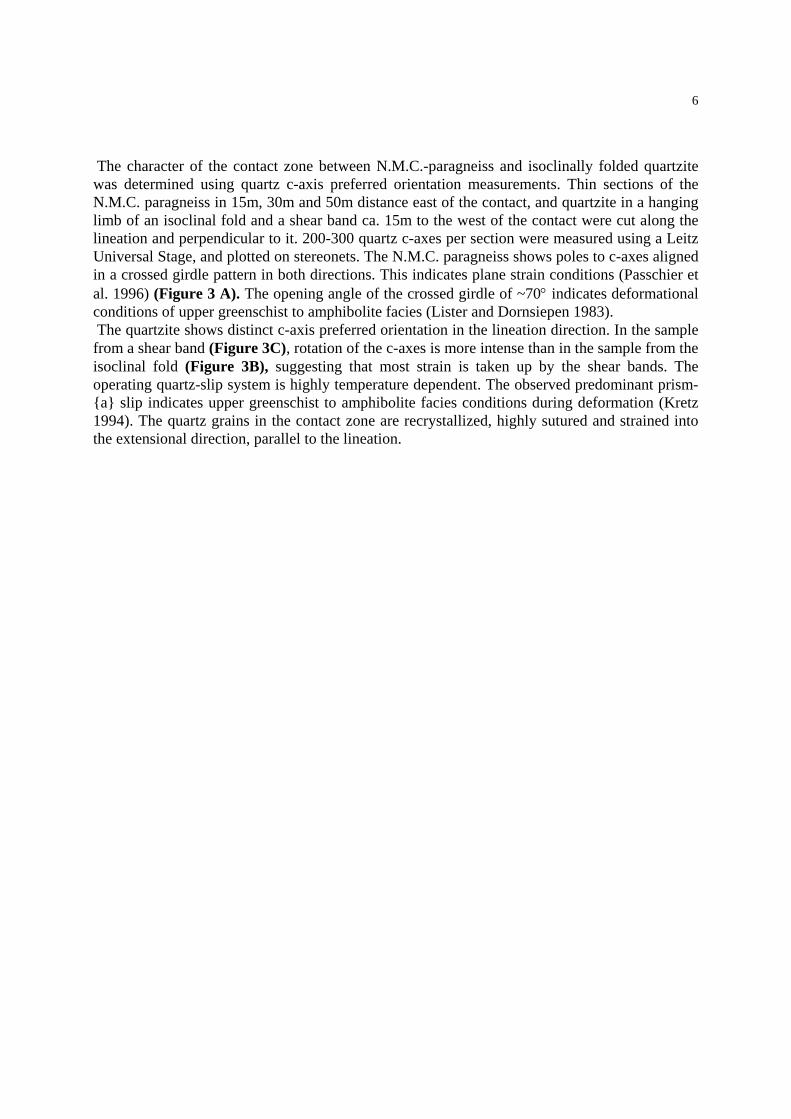
The character of the contact zone between N.M.C.-paragneiss and isoclinally folded quartzite was determined using quartz c-axis preferred orientation measurements. Thin sections of the N.M.C. paragneiss in 15m, 30m and 50m distance east of the contact, and quartzite in a hanging limb of an isoclinal fold and a shear band ca. 15m to the west of the contact were cut along the lineation and perpendicular to it. 200-300 quartz c-axes per section were measured using a Leitz Universal Stage, and plotted on stereonets. The N.M.C. paragneiss shows poles to c-axes aligned in a crossed girdle pattern in both directions. This indicates plane strain conditions (Passchier et al. 1996) (Figure 3 A). The opening angle of the crossed girdle of ~70° indicates deformational conditions of upper greenschist to amphibolite facies (Lister and Dornsiepen 1983). The quartzite shows distinct c-axis preferred orientation in the lineation direction. In the sample from a shear band (Figure 3C), rotation of the c-axes is more intense than in the sample from the isoclinal fold (Figure 3B), suggesting that most strain is taken up by the shear bands. The operating quartz-slip system is highly temperature dependent. The observed predominant prism-{a} slip indicates upper greenschist to amphibolite facies conditions during deformation (Kretz 1994). The quartz grains in the contact zone are recrystallized, highly sutured and strained into the extensional direction, parallel to the lineation.

7
Figure 3a-c). Stereographic equal area plots of quartz c-axes. See text for sample localities. Contours: 2-4-6-8 %; 200-300 c-axis measurements per plot.
At locality (31°10’20S 17°54’50’’E), southeast of the Witkoppies farmhouse, two deformational events of Panafrican age can be distinguished. Here, the basal quartzite outcrops in a narrow anticline and comprises a large scale fold limb which dips more shallow than the underlaying
8
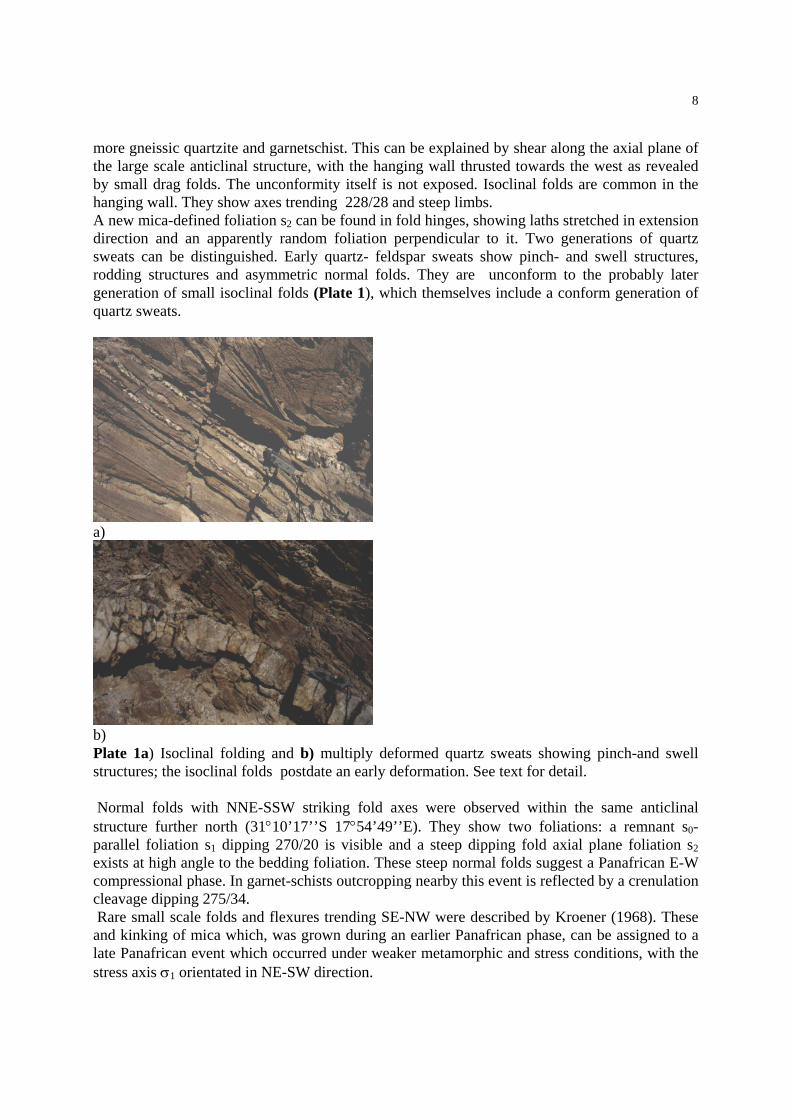
more gneissic quartzite and garnetschist. This can be explained by shear along the axial plane of the large scale anticlinal structure, with the hanging wall thrusted towards the west as revealed by small drag folds. The unconformity itself is not exposed. Isoclinal folds are common in the hanging wall. They show axes trending 228/28 and steep limbs. A new mica-defined foliation s2 can be found in fold hinges, showing laths stretched in extension direction and an apparently random foliation perpendicular to it. Two generations of quartz sweats can be distinguished. Early quartz- feldspar sweats show pinch- and swell structures, rodding structures and asymmetric normal folds. They are unconform to the probably later generation of small isoclinal folds (Plate 1), which themselves include a conform generation of quartz sweats.
a)
b) Plate 1a) Isoclinal folding and b) multiply deformed quartz sweats showing pinch-and swell structures; the isoclinal folds postdate an early deformation. See text for detail. Normal folds with NNE-SSW striking fold axes were observed within the same anticlinal structure further north (31°10’17’’S 17°54’49’’E). They show two foliations: a remnant s0- parallel foliation s1 dipping 270/20 is visible and a steep dipping fold axial plane foliation s2 exists at high angle to the bedding foliation. These steep normal folds suggest a Panafrican E-W compressional phase. In garnet-schists outcropping nearby this event is reflected by a crenulation cleavage dipping 275/34. Rare small scale folds and flexures trending SE-NW were described by Kroener (1968). These and kinking of mica which, was grown during an earlier Panafrican phase, can be assigned to a late Panafrican event which occurred under weaker metamorphic and stress conditions, with the stress axis σ1 orientated in NE-SW direction.
9
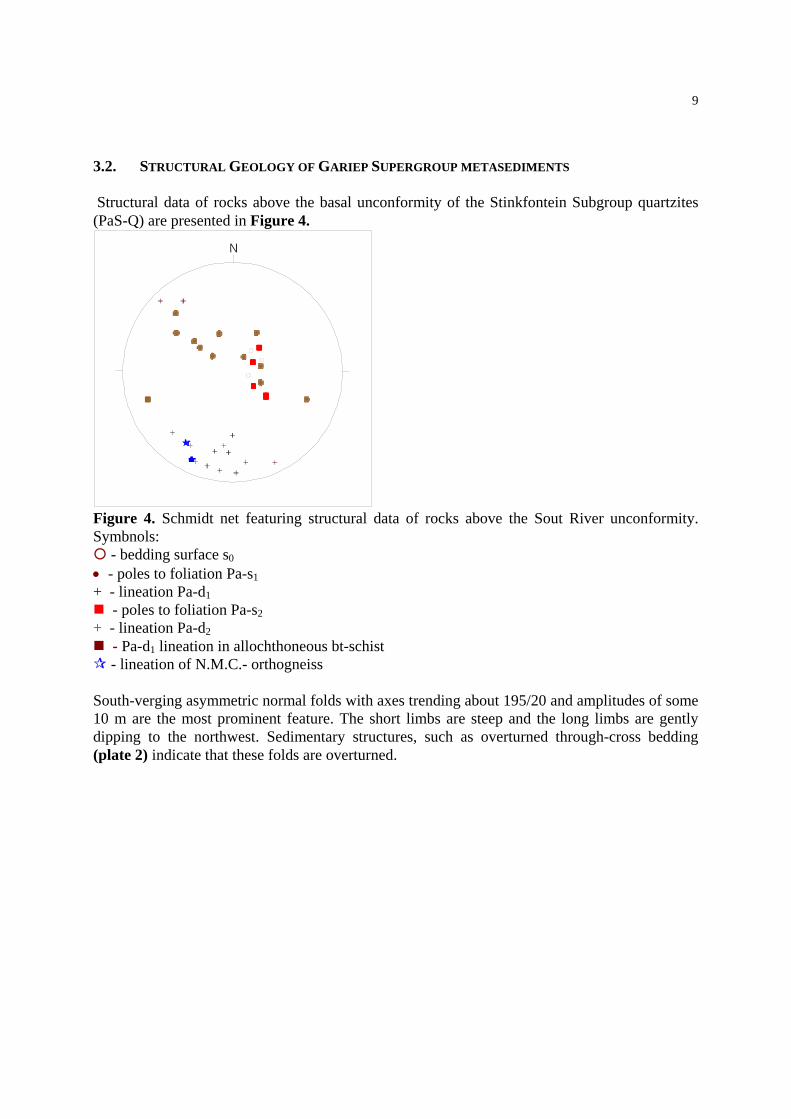
3.2. STRUCTURAL GEOLOGY OF GARIEP SUPERGROUP METASEDIMENTS Structural data of rocks above the basal unconformity of the Stinkfontein Subgroup quartzites (PaS-Q) are presented in Figure 4.
Figure 4. Schmidt net featuring structural data of rocks above the Sout River unconformity. Symbnols:
- bedding surface s0 • - poles to foliation Pa-s1 + - lineation Pa-d1
- poles to foliation Pa-s2 + - lineation Pa-d2
- Pa-d1 lineation in allochthoneous bt-schist - lineation of N.M.C.- orthogneiss
South-verging asymmetric normal folds with axes trending about 195/20 and amplitudes of some 10 m are the most prominent feature. The short limbs are steep and the long limbs are gently dipping to the northwest. Sedimentary structures, such as overturned through-cross bedding (plate 2) indicate that these folds are overturned.

10
Plate 2. Stinkfontein Subgroup quartzites showing overturned through cross-bedding. Near Strandbaai, diamiktite of the Kaigas Formation forms an erosional unconformity over syenitic gneiss of the N.M.C. (plate 3). This is evidence for the autochthoneous character of the Kaigas Formation and the stratigraphically underlying Stinkfontein Subgroup rocks.
Plate 3). Erosional unconformity of the Kaigas Formation over gneiss of the N.M.C.. The axial plane foliation s1 is parallel or at low angle to the bedding surface s0 and defined by white mica and strained quartz grains. The poles to s1 form a great circle whose pole coincides with the fold axis measurements. These structures are the effect of SSE directed compression during the first and most intense Panafrican phases of deformation. Early Pa-D1-related quartz- and quartz-feldspar veins and lensoid sweats of up to 30 cm thickness were unconformably deformed during these phases of southeast-verging folding resulting in disrupted irregular folded veins. The Stinkfontein quartzite near Malkop Baai is in part unconformably overlain by a duplicated sequence of dolomites and biotite schists. Isoclinal folding and thrusting about 315/08 trending axes is related to ENE-WSW directed compression during Pa-D2. This allochthoneous sequence dips at moderate angles to WSW (Figure 5) and shows minor fold axes striking 252/15. These folds may be attributed to an earlier SE-vergent Panafrican phase D1. In the schists, strained pseudomorphs of mica after porphyroblasts with a X/(Y,Z) ratio of 5:1
11
and extensional axes orientated 315/40 were found, acting as strainmarker. The associated foliation dips 300/40. At high angle to the latter, an older foliation defined by migmatitic lenses and biotite dips 280/20. The contact between the Stinkfontein rocks, the Hilda Subgroup dolomites and the migmatitic gneisses is tectonic in origin, respectively. This is revealed by unconform lithologic boundaries, different structural characteristics and metamorphic grade. The duplication of dolomite and migmatitic biotite schist is caused by thrusting of the schist over the dolomite during a first phase of deformation -which might be Pa-D1- and subsequent isoclinal folding during Pa-D2. Tremolite bearing horizons in the dolomite layer are evidence of shear zone related fluid activity. At Brand-se-Baai, about 3 km to the south of the South River mouth, a late stage NE-verging Panafrican phase Pa-D2 refolded normal folds derived from Pa-D1 resulting in interference fold patterns. This event can be related to Pa-D2 structures to the north of the Sout River mouth and in the Sout River region. At locality (31°19’36’’S 17°49’39’’E) Kaigas Formation diamictite forms an erosional contact over Namaqua augengneiss revealing the autochthoneous origin of the Gariep Supergroup rocks. 3.3 POST-PANAFRICAN DEFORMATIONAL AND MAGMATIC EVENTS Several intrusives provide evidence for extensional phases during Phanerozoic times. Plastic deformed rocks with structures of Panafrican age are crosscut unconformably by hydrothermal quartz dikes, rhyolitic dikes, and an occurrence of intrusive rocks of syenitic composition in the Sandkop area. Former assumptions (Kroener 1968) according to which the syenitic pluton in the Sandkop area is related to the Namaqua orogeny can thus not be further maintained. K-feldspar bearing quartz-veins up to 20 cm wide, dipping 176/18 (Sout River) and 34/15 (coast), occur throughout the metamorphic rocks. They appear to form a conjugate set of veins and may be related to late Gariep transtensional tectonics Pa-D5 or an even later event associated with the emplacement of the Sandkop pluton. Rhyolitic (“Bostonite”) dikes 1-5 m wide and dipping 22/60 and 275/50 were observed near the syenite complex, and were also found on the coast with similar orientation. Using zones of structural weakness, these dikes preferentially intruded between lithological units of the pelitic schist sequence, so between paragneiss and migmatite schist. They are of unknown age. A 1m wide shear zone dipping 95/78 occurs within the N.M.C. orthogneiss. It was dated at 500 Ma (Frimmel 1997) and displaces a Bostonite dike. 3. PETROGRAPHY AND MINERALOGY 3.1. PETROGRAPHY AND MINERALOGY OF ROCKS OF THE NAMAQUALAND METAMORPHIC COMPLEX Monotonous syenitic and metasedimentary plagioclase-biotite-quartz gneisses of the N.M.C. comprise the basement of the entire area. Basement gneisses are overlain by massive quartzite with muscovite, plagioclase and hamatite as minor phases. Jansen described sillimanite from one locality in the Groot River valley (in Kroener 1968). These quartzites are highly strained and recrystallised, showing polygonal textures, sutured grain boundaries and abundant shape and lattice preferred orientation.
12
The hanging garnet-schist layer forms a marker horizon. It is composed of varying amounts of quartz, plagioclase, biotite, white mica and garnet porphyroblasts as major constituents. Minor phases include staurolite, sillimanite and ilmenite. Other workers (Waters et al. 1983) observed kyanite, microcline and chlorite within the same horizon. The following description focuses on the mineralogy of garnet-bearing schists as they contain the mineral assemblage with the lowest degree of freedom. This is relevant for the study of metamorphic history of the area. Samples from three localities were taken (locality B in Encl.1: 31°9’53’’S 17°55’19’’E; C: 31°10’20’’S 17°54’50’’E; D: 31°12’20’’S 17°53’15’’E). Samples from localities B and C were subjected to chloritisation and leaching due to weathering and are thus not appropriate for the determination of peak conditions of metamorphism. Thin sections of the samples were prepared and described using optical microscopy. Phases in textural equilibrium were analysed for major and minor element using a CAMECA “Camebax” electron microprobe. An acceleration voltage of 15 kV and 10 sec counting time were used. The electron beam was focused to a diameter of 1 µm. Natural mineral standard were used for calibration and the analytical data were corrected for mass absorption effects using the ZAF method. Analyses are presented in Appendix 1. Quartz is often strained and forms polygonal textures with mica controlling the grain size. Fine grained quartz-sillimanite clusters occur which are commonly wrapped by white mica and appear to pseudomorph cordierite. Plagioclase is albite rich (An20), seldom twinned and appears as equigranular polygonal crystals. Zoning was not observed. Plagioclase growth preceded the mica-defined foliation. Inclusions of staurolite and quartz are common. White mica laths up to 2 mm in length are present and define the foliation to a large extend. In stress shadows, like in the vicinity of syn-tectonic garnets, they show a more random orientation. These and small muscovite inclusions in syn-tectonic and post-tectonic garnet can be attributed to an earlier generation. Muscovites have a constant, slightly phengitic composition of K1.4Na0.1(Al3.7Fe2+
0.25Mg0.1)(Si6.0Al2.0O20)(OH)4. Biotite is present in two textural types with similar composition. Large stubby flakes of apparently random distribution are overgrown by matrix mica. A younger generation of sheaves up to 1.5 mm long define, together with white mica, the foliation and have a composition of K1.6Na0.1(Fe2+Mg)2.0(Fe3+
0.8Al0,2Ti0.2)(Si5.3Al3.4O20)(OH)4 with no significant variation. A late generation of fine grained biotite intergrown with fibrolite occurs in samples from localities B and C. Sillimanite occurs as euhedral prisms and as fibrolitic mats. Euhedral prisms occur in clusters together with quartz or muscovite and might have been derived by breakdown of cordierite or K-Feldspar, respectively. They are commonly wrapped by later mica foliation. The fibrolitic mats are usually intergrown with biotite. They contain garnet with embayment structures, minor fragments of muscovite and could have formed by the reaction: garnet+muscovite ↔ biotite+sillimanite+quartz (1) Kyanite was observed by former workers (Waters 1983) in aggregate pseudomorphs together with biotite. These are considered to result from the breakdown of cordierite by the retrograde reaction: cordierite+K-feldspar+H2O ↔ biotite+kyanite+quartz (2) Transitions of pseudomorph-rich garnet-schists along strike into garnetiferous two-mica schists
13
and across strike into mica schists seems due to the breakdown of alkali feldspar to muscovite coupled with the aquisition of a new penetrative schistosity (Waters et al. 1983). The garnet-schists were shown to texturally and mineralogically resemble garnet-cordierite-gneisses within the N.M.C. in the Bitterfontein area (Waters et al. 1983). Staurolite is also present in the form of two generations: a pre/syn-tectonic generation is highly poikiloblastic with abundant quartz inclusions, fractured and wrapped by a later white mica formation; whereas a second generation transects the mica-defined foliation. The early staurolite and biotite appear to have grown simultaneously as indicated by intergrown crystals. However, the generations are chemically not to distinguish, with a consistent composition of Fe2+
1.5Mg0.3(Al0.95Ti0.01Fe3+0.03)9O6(Si0.95Al0.05O4)4(OH,O)2.
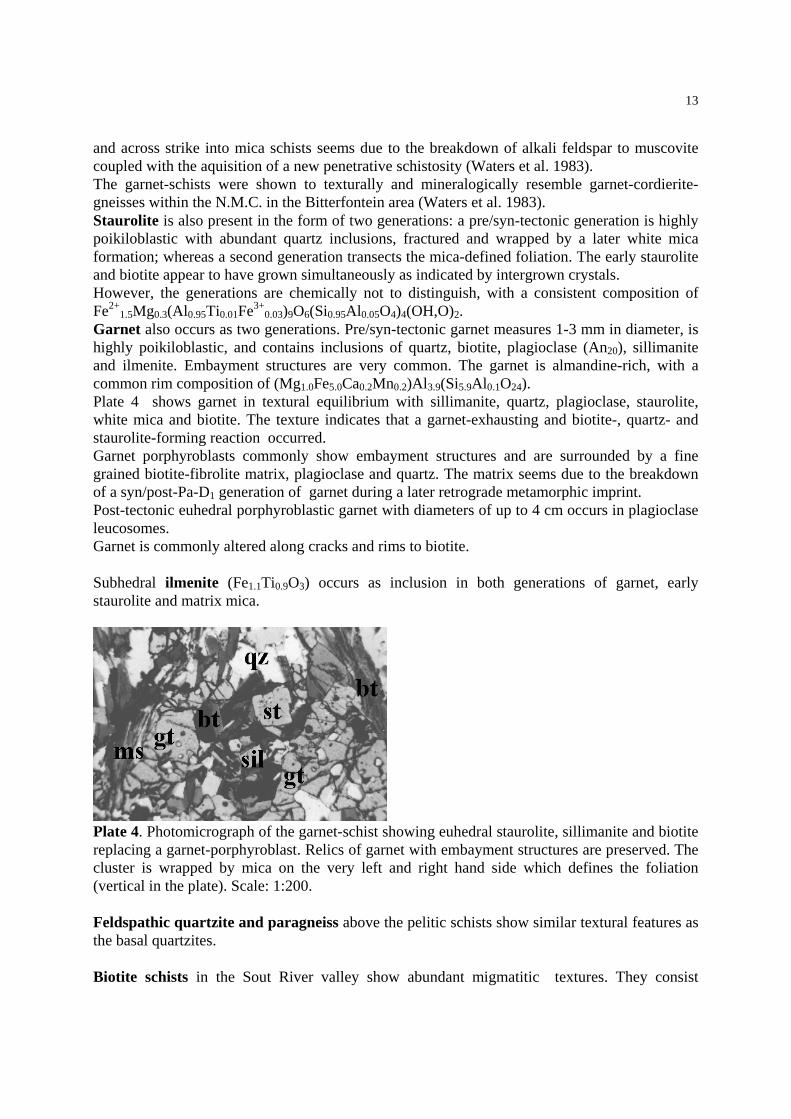
Garnet also occurs as two generations. Pre/syn-tectonic garnet measures 1-3 mm in diameter, is highly poikiloblastic, and contains inclusions of quartz, biotite, plagioclase (An20), sillimanite and ilmenite. Embayment structures are very common. The garnet is almandine-rich, with a common rim composition of (Mg1.0Fe5.0Ca0.2Mn0.2)Al3.9(Si5.9Al0.1O24). Plate 4 shows garnet in textural equilibrium with sillimanite, quartz, plagioclase, staurolite, white mica and biotite. The texture indicates that a garnet-exhausting and biotite-, quartz- and staurolite-forming reaction occurred. Garnet porphyroblasts commonly show embayment structures and are surrounded by a fine grained biotite-fibrolite matrix, plagioclase and quartz. The matrix seems due to the breakdown of a syn/post-Pa-D1 generation of garnet during a later retrograde metamorphic imprint. Post-tectonic euhedral porphyroblastic garnet with diameters of up to 4 cm occurs in plagioclase leucosomes. Garnet is commonly altered along cracks and rims to biotite. Subhedral ilmenite (Fe1.1Ti0.9O3) occurs as inclusion in both generations of garnet, early staurolite and matrix mica.
Plate 4. Photomicrograph of the garnet-schist showing euhedral staurolite, sillimanite and biotite replacing a garnet-porphyroblast. Relics of garnet with embayment structures are preserved. The cluster is wrapped by mica on the very left and right hand side which defines the foliation (vertical in the plate). Scale: 1:200. Feldspathic quartzite and paragneiss above the pelitic schists show similar textural features as the basal quartzites. Biotite schists in the Sout River valley show abundant migmatitic textures. They consist
14
predominantly of plagioclase-quartz leucosomes and biotite melanosomes. Within the leucosomes K-feldspar-biotite-chlorite clusters occur which are likely to represent pseudomorphs after garnet. Biotite schists from the coastal outcrops are tectonically associated with dolomite and consist of fine grained quartz, biotite, white mica and plagioclase with matrix mica controlling the grain size. 3.2. PETROGRAPHY AND MINERALOGY OF METASEDIMENTARY PAN-AFRICAN COVER ROCKS Quartzite of the Pan-African cover sequence is coarse grained with poorly rounded, partly recrystallised detrital quartz grains and contains muscovite of metamorphic origin. Sedimentary structures like tabular cross bedding, trough cross bedding and ripple marks (Kroener 1968, p. 104) are abundant. It petrographically resembles quartzite of the Stinkfontein Subgroup occurring in the northern part of the Gariep Belt (von Veh 1993). It can be distinguished from highly recrystallised and annealed N.M.C. quartzite The diamictite consists of a quartzite matrix with layers of well-rounded gneissic and granitic pebbles. The pebbles might be derived from the N.M.C.. It could not be established if the diamictite is glaciogenic in origin and if it can be correlated with the Kaigas Formation. Yellow-brownish dolomite is recrystallized and shows stylolites as indicators of pressure solution. Thin lenses and layers of biotite schist occur within the rock. Tremolite was observed in a dike of approximately 20 cm thickness. 4. METAMORPHISM 4.1. METAMORPHISM OF THE GARNET-SCHISTS WITHIN THE QUARTZITE-SCHIST SEQUENCE OF THE NAMAQUALAND METAMORPHIC COMPLEX Petrographic indicators and absolute geothermobarometry were used to constrain the metamorphic history of the garnet-schist. Several indicators of a former high-grade assemblage are present. Pseudomorphs, possibly after cordierite, indicate that these rocks experienced higher amphibolite or even granulite facies metamorphism during a preceding event. According to Waters et al. (1983), the previous mineral assemblage was garnet-cordierite-K-feldspar. Migmatitic textures in biotite-schists reveal that these rocks experienced partial melting. The event that can be correlated with high grade metamorphism in this area is the Kibaran orogeny. Accordingly, these rocks were interpreted to be part of the Bushmanland Subprovince of the N.M.C. (Waters et al. 1983). Migmatitic textures and retrograde features like mica-pseudomorphs after strained porphyroblasts observed in allochthonous biotite-schist at the coast near Malkopbaai also indicate that this rock experienced pre-Pan-African high grade metamorphism. In the Sout River area, Pan-African metamorphism led to new mineral growth associated with a new mica-defined foliation. The order of appearance of the present minerals as defined by micro-textures in the garnet-schist is supposed to be:

15
biotite/ garnet/ plagioclase/ staurolite - biotite/ garnet/ staurolite/ sillimanite/ quartz - muscovite/ biotite/ fibrolite. With 6 components (SiO2-Al2O3-FeO-MgO-CaO-K2O-H2O) and 7 phases (quartz, sillimanite, biotite, muscovite, garnet, staurolite, plagioclase, H2O) in textural equilibrium the system is univariant.
Figure 6. Thompson-AFM diagram of a local equilibrium mineral assemblage from the garnet schist layer. Muscovite, quartz and H2O are considered to be excess phases. This allows the plot of the remaining phase in the AFM model system (Figure 6). Figure 6 and textural observations suggest the discontinuous staurolite forming reaction: biotite+garnet+sillimanite ↔ staurolite (3) The growth of post-deformational staurolite indicates that these rocks have experienced amphibolite facies conditions during the last metamorphic phase. The occurrence of an early generation of kyanite and sillimanite along strike within the same horizon indicate that the maximum pressures achieved during an early phase of metamorphism exceeded the stability field of sillimanite, which was formed during later thermal metamorphism under lower pressure.
The metamorphic grade of a textural equilibrium mineral assemblage of the garnet-bearing schist sequence was determined using a geothermometer based on Fe-Mg fractionation between garnet and biotite. The experimentally calibrated formulations by Bhattacharya et al. (1992) and Dasgupta et al. (1991) were chosen because they consider quarternary Fe-Mg-Ca-Mn garnet solid solution and correct for interaction between the components of the solid solutions. The geothermometer by Bhattacharya et al. (1992) regards nonideal mixing in the annite-phlogopite binary solution. Error sources for both thermometers include analytical errors, errors of the experimental calibration, and uncertainties related to the impact of the not analysed Fe3+ content on the Fe-Mg partitioning.
Temperatures were calculated at 556°C (Bhattacharya et al. 1991) and 560°C (Dasgupta et al. 1991) at 4 kbar (for calculations see Appendix 2). The pT-stability curve of the reactions: (4) 25muscovite+17almandine+6Fe-staurolite ↔ 25annite+96sillimanite+12H2O (5) 6Fe-staurolite+25quartz ↔ 8almandine+46sillimanite+12H2O in the FASH model has been estimated using the THERMOCALC program (Powell and Holland 1990) at p[bar]= 19*T[°C]-6640bar. The activities of the endmembers within the solid solutions
16
were considered. Using these reactions as a geobarometer and the garnet/biotite geothermometer, pT-conditions are estimated at 560°C and 4kbar.
In order to apply relative geothermobarometry using garnet zonation, a garnet porphyroblast of 4 cm diameter was analysed for major elements. The lack of element zonation rendered the application of relative geothermobarometry impossible. The homogeneity of the garnet is evidence for growth during one phase of metamorphism. Diffusional resetting can not account for homogenization. 5 Ga were required for the diffusional homogenisation of Mg2+ in these large porphyroblasts (see Appendix 3 for calculations), which is a geologically inordinate time. Thus, the garnet porphyroblast has grown during one period of metamorphism under relatively constant pT-conditions. The succession of metamorphic grades suggests a Pan-African syndeformational phase of high pressure and a subsequent phase of medium pressure-temperature metamorphism. 4.2. FLUID INCLUSION STUDIES AND METAMORPHISM OF
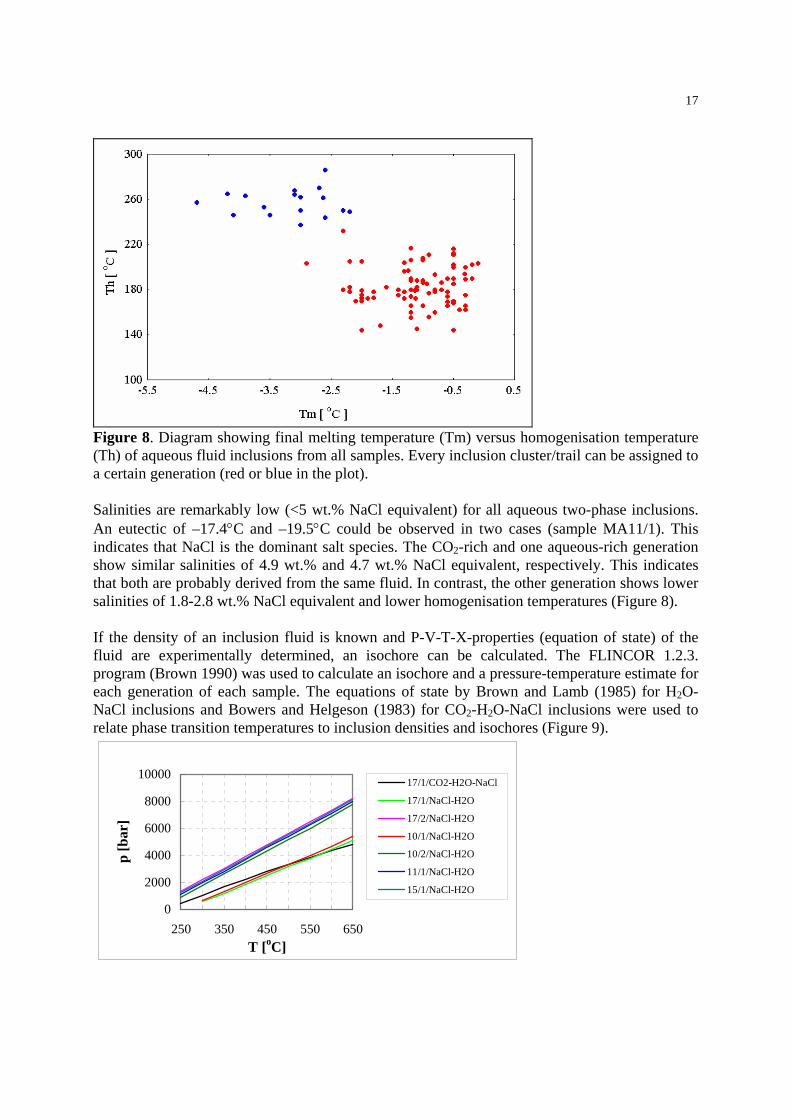
PANAFRICAN METASEDIMENTARY ROCKS The pressure-temperature conditions of Pan-African metamorphism in both the quartzite-schist sequence of the N.M.C. in the Sout River valley and the Stinkfontein Subgroup quartzites at the coast are determined in order to show if they were affected by the same degree of Pan-African metamorphism. Fluid inclusions from quartz segregations and quartz veins from the quartzite-schist sequence in the Sout River valley (locality C in map Enclosure 1) and from Stinkfontein Subgroup quartzites (locality F) were used to determine the pressure-temperature conditions during their entrapment. Doubly polished thick sections were prepared. Three types of inclusions were distinguished using optical microscopy: • Aqueous two-phase inclusions from at least two generations are present in the sample from the segregation at localities C (sample MA10) and F (sample MA17); the samples from younger, post-deformational quartz-veins from localities C (sample MA11) and F (sample MA15) contain only one generation of two-phase inclusions. • Aqueous CO2-rich inclusions occur only in sample MA17. • Aqueous one phase inclusions represent a late generation entrapped under low pT- conditions and are not considered in this study. An optical microscope with an attached heating-cooling stage was used to determine eutectic, melting and homogenisation temperatures of aqueous inclusions, and melting, clathrate melting and homogenisation temperatures of aqueous CO2 inclusions. All obtained data are shown in Appendix 4. Only inclusions defining a single healed microfracture (‘trail’) or clusters were examined. Aqueous samples were cooled down to –30°C while CO2-rich inclusions were cooled down to –90°C. Afterwards the thick sections were slowly heated and the phase transitions in the fluid inclusions were observed. All data obtained are enclosed in Appendix 4. Data obtained from aqueous inclusions are illustrated in Figure 8. Structural relationships as well as the presence of two clusters of data points in Figure 8 allow the discrimination of two generations of inclusions.
17
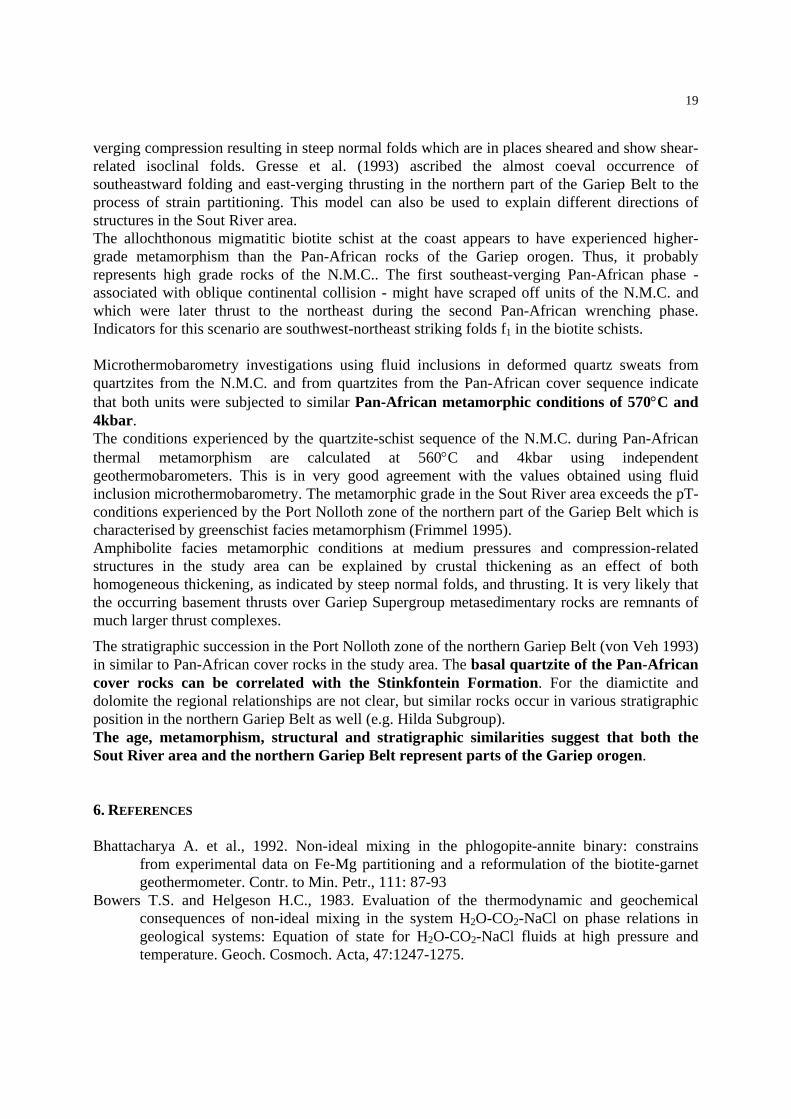
Figure 8. Diagram showing final melting temperature (Tm) versus homogenisation temperature (Th) of aqueous fluid inclusions from all samples. Every inclusion cluster/trail can be assigned to a certain generation (red or blue in the plot). Salinities are remarkably low (<5 wt.% NaCl equivalent) for all aqueous two-phase inclusions. An eutectic of –17.4°C and –19.5°C could be observed in two cases (sample MA11/1). This indicates that NaCl is the dominant salt species. The CO2-rich and one aqueous-rich generation show similar salinities of 4.9 wt.% and 4.7 wt.% NaCl equivalent, respectively. This indicates that both are probably derived from the same fluid. In contrast, the other generation shows lower salinities of 1.8-2.8 wt.% NaCl equivalent and lower homogenisation temperatures (Figure 8). If the density of an inclusion fluid is known and P-V-T-X-properties (equation of state) of the fluid are experimentally determined, an isochore can be calculated. The FLINCOR 1.2.3. program (Brown 1990) was used to calculate an isochore and a pressure-temperature estimate for each generation of each sample. The equations of state by Brown and Lamb (1985) for H2O-NaCl inclusions and Bowers and Helgeson (1983) for CO2-H2O-NaCl inclusions were used to relate phase transition temperatures to inclusion densities and isochores (Figure 9).
0
2000
4000
6000
8000
10000
250 350 450 550 650T [oC]
p [b
ar]
17/1/CO2-H2O-NaCl
17/1/NaCl-H2O
17/2/NaCl-H2O
10/1/NaCl-H2O
10/2/NaCl-H2O
11/1/NaCl-H2O
15/1/NaCl-H2O

18
Figure 9. Pressure-temperature diagram showing isochores for all samples. Note the crossing isochores of CO2-H2O-NaCl-inclusions and H2O-NaCl-inclusions from sample 17 (folded segregation within Stinkfontein subgroup quartzite). The legend refers to ‘sample no./generation/type of inclusion’. Provided that the CO2-H2O-NaCl-inclusions and H2O-NaCl-inclusions from sample 17 represent indeed one generation as indicated by the similar salinities, the obtained crossing isochores are consistent with entrapment conditions of 570°C and 4kbar. Both the samples from the unconformable veins and from the quartz sweats contain a generation of quartz sweats (15/1, 11/1, 10/2 and 17/2 in Figure 9) with a lower Th-value. This implies that this generation post-dates the generation of CO2-H2O-NaCl-inclusions (17/1) and H2O-NaCl-inclusions (17/1, 17/2) occurring only in the samples from the quartz sweats. 5. INTERPRETATION AND CONCLUSIONS - THE TECTONIC EVOLUTION OF THE AREA The impact of Kibaran and Pan-African tectonics on the rocks of the N.M.C. and on the overlying Pan-African metasedimentary rocks can be described as follows. The character of the contact zone between the N.M.C. basement and cover rocks has been determined. Dominant quartz c-axis orientation in extension direction is consistent with fold-related pure shear. Simple shear might have occurred on a small scale and is essentially restricted to sheared limbs of isoclinal folds. No evidence for a large simple shear component in the quartz microfabric was found. Thus, the quartzite-schist sequence of the Namaqualand Metamorphic Complex can be considered as relatively autochthonous. Accordingly, the transposition of the quartzitic-pelitic synform from W-E striking Nq-D3 - related structures (Joubert 1971) of the N.M.C. into the current northnortheast-southsouthwest strike should have occurred concurrently in the basement and the supracrustal sequence. This rotation is related to the large-scale sinistral displacement of parts of the N.M.C. along the west coast. The timing can be restricted to a period between the main deformation of the N.M.C. and the deposition of the Stinkfontein Subgroup quartzites PaS-Q which overlay rotated and non-rotated basement alike unconformably (Waters 1983). Although late Kibaran and early Pan-African tectonic transport direction coincide, the Pan-African phase appears to be the dominant factor for the formation of the structural patterns observed. Syn-deformational muscovite was dated at about 500 Ma (Frimmel et al. 1998) which is evidence that the structures at the boundary zone between basement gneiss and metapelites and quartzite of the N.M.C. in the Sout River synclinal structure are of Pan-African age. This suggests a first Pan-African phase Pa-D1 with eastsoutheast-vergence. Kibaran structures were largely overprinted during Pan-African refoliation. In the Pan-African cover rocks the first Pan-African phase Pa-D1 is dominated by eastsoutheast-verging folds. These structures are co-directional to the pattern observed in the Sout River valley and of the same age, which suggests that they were caused by the same event. The second phase Pa-D2 was northeast-verging and was weaker for it did not cause a new foliation. Conjugate sets of quartz veins are consistent with late Pan-African extensional tectonics. The Pan-African structural evolution in the Sout River area and the southern arc of the northern part of the Gariep Belt is similar. The main metamorphic phase is associated with eastsoutheast
19
verging compression resulting in steep normal folds which are in places sheared and show shear-related isoclinal folds. Gresse et al. (1993) ascribed the almost coeval occurrence of southeastward folding and east-verging thrusting in the northern part of the Gariep Belt to the process of strain partitioning. This model can also be used to explain different directions of structures in the Sout River area. The allochthonous migmatitic biotite schist at the coast appears to have experienced higher-grade metamorphism than the Pan-African rocks of the Gariep orogen. Thus, it probably represents high grade rocks of the N.M.C.. The first southeast-verging Pan-African phase - associated with oblique continental collision - might have scraped off units of the N.M.C. and which were later thrust to the northeast during the second Pan-African wrenching phase. Indicators for this scenario are southwest-northeast striking folds f1 in the biotite schists. Microthermobarometry investigations using fluid inclusions in deformed quartz sweats from quartzites from the N.M.C. and from quartzites from the Pan-African cover sequence indicate that both units were subjected to similar Pan-African metamorphic conditions of 570°C and 4kbar. The conditions experienced by the quartzite-schist sequence of the N.M.C. during Pan-African thermal metamorphism are calculated at 560°C and 4kbar using independent geothermobarometers. This is in very good agreement with the values obtained using fluid inclusion microthermobarometry. The metamorphic grade in the Sout River area exceeds the pT-conditions experienced by the Port Nolloth zone of the northern part of the Gariep Belt which is characterised by greenschist facies metamorphism (Frimmel 1995). Amphibolite facies metamorphic conditions at medium pressures and compression-related structures in the study area can be explained by crustal thickening as an effect of both homogeneous thickening, as indicated by steep normal folds, and thrusting. It is very likely that the occurring basement thrusts over Gariep Supergroup metasedimentary rocks are remnants of much larger thrust complexes.
The stratigraphic succession in the Port Nolloth zone of the northern Gariep Belt (von Veh 1993) in similar to Pan-African cover rocks in the study area. The basal quartzite of the Pan-African cover rocks can be correlated with the Stinkfontein Formation. For the diamictite and dolomite the regional relationships are not clear, but similar rocks occur in various stratigraphic position in the northern Gariep Belt as well (e.g. Hilda Subgroup). The age, metamorphism, structural and stratigraphic similarities suggest that both the Sout River area and the northern Gariep Belt represent parts of the Gariep orogen. 6. REFERENCES Bhattacharya A. et al., 1992. Non-ideal mixing in the phlogopite-annite binary: constrains from experimental data on Fe-Mg partitioning and a reformulation of the biotite-garnet geothermometer. Contr. to Min. Petr., 111: 87-93 Bowers T.S. and Helgeson H.C., 1983. Evaluation of the thermodynamic and geochemical consequences of non-ideal mixing in the system H2O-CO2-NaCl on phase relations in geological systems: Equation of state for H2O-CO2-NaCl fluids at high pressure and temperature. Geoch. Cosmoch. Acta, 47:1247-1275.

20
Dasgupta S. et al., 1991. A refined garnet-biotite exchange geothermometer and its application in amphibolites and granulites.
Contr. to Mineralogy and Petrology, 109: 130-137 Diamond L.W., 1994. Introduction to phase relations of CO2-H2O fluid inclusions.
In: De Vivo B. and Frezzotti M.L. (eds.), 1994. Fluid inclusions in minerals: methods and applications. Short course of the working group “Inclusions in minerals”, Siena Frimmel H.E., 1995. Metamorphic evolution of the Gariep Belt. S. Afr. J. Geol., 98: 176-190 Frimmel H.E. and Frank W., 1998. Neoproterozoic tectono-thermal evolution of the Gariep Belt and its basement, Namibia/South Africa. Precambrian Research, in press Frimmel H.E., Kloetzli U., and Siegfried P., 1996. New Pb-Pb single zircon age constraints on the timing of Neoproterozoic glaciation and continental break-up in Namibia.
J. of Geology, 104:459-469 Germs G.J.B. and Gresse P.G., 1991. The foreland basin of the Damara and Gariep orogens in Namaqualand and southern Namibia: stratigraphic correlations and basin dynamics.
S. Afr. J.Geol., 94: 159-169 Gresse P.G., 1994. Strain partitioning in the southern Gariep Arc as reflected by sheath folds and stretching directions. S. Afr. J. Geol., 97:52-61 Gresse P.G. and Scheepers R, 1993.Neoproterozoic to Cambrian rocks of South Africa: a geochronological and geotectonic review. J.Afr. Earth Sci., 16:375-393 Hartnady C., Joubert P., and Stowe C., 1985. Proterozoic crustal evolution in
southwestern Africa. Episodes, 8:236-244 Kroener A., 1968. The gneiss-sediment relationships north-west of Vanrhynsdorp, Cape Province. Bull. Precambrian Res. Unit, Univ. Cape Town, 3:233pp. Jansen H., 1960. The geology of the Bitterfontein area, Cape Province.
Explan. Sheet Geol. Surv S. Afr., 253 Joubert P. and Kroener A, 1971. The Stinkfontein Formation south of the Richtersveld.
Trans. geol. Soc. S. Afr., 75: 47-53 Moore J.M., 1989. A comparative study of metamorphosed supracrustal rocks from the western Namaqualand Metamorphic Complex.
Bull. Precambrian Res. Unit, Univ. Cape Town, 37, 211pp. Passchier C.W. and Trouw P., 1996. Microtectonics. Springer Verlag Berlin, 345pp. Powell R. and Holland T.J.B., 1988. An internally consistent dataset with uncertainties and correlations: 3. Application to geothermobarometry, worked examples and a computer program. J. metam. Geology, 6;173-204 Spear F.S., 1993. Mineral phase equilibria and metamorphic pressure-temperature-time paths. Min.Soc. Am., Monograph, Washington, 799pp. von Veh M.W., 1993. The stratigraphy and structural evolution of the Late Proterozoic
Gariep Belt in the Sendelingsdrif – Annisfontein area, northwestern Cape Province. Bull. Precambrian Res. Unit, Univ. Cape Town, 38, 174pp.
Waters D.J., 1990. Thermal history and tectonic setting of the Namaqualand granulites, Southern Africa: clues to Proterozoic crustal development. In: Vielzeuf D.and Vidal P.: Granulites and crustal differentiation. Kluwer Academic Publishers Waters D.J. et al., 1983. A suggested reinterpretation of Namaqua basement and cover rocks south and west of Bitterfontein. Transactions of the Geol. Soc. of S. Afr., 86: 293-299 APPENDIX I

21
TABLE 1. ELECTRON PROBE MICROANALYSES OF GARNETSCHIST SAMPLE HFG 60 mineral F Na2
O K2O SiO2 TiO2 Al2O
3
Cr2O3
FeO MnO MgO CaO Total
bt/1 0.304 0.435
8.474 33.253
1.451 18.841
0.061 22.471 0.050 8.570 0.028
93.940
bt/2 0.149 0.485
8.919 34.577
1.521 20.360
0.197 19.176 0.000 9.538 0.007
94.931
bt/3 0.122 0.342
8.983 33.940
1.496 19.418
0.064 21.008 0.000 8.640 0.000
94.013
bt/7 0.025 0.386
8.459 33.959
1.536 19.881
0.013 21.327 0.040 8.669 0.001
94.296
bt/8 0.165 0.400
8.445 33.931
1.526 19.539
0.056 21.859 0.000 8.918 0.000
94.839
bt/6 0.129 0.407
8.111 34.318
1.513 19.695
0.016 21.954 0.056 8.678 0.048
94.924
ms/1 0.000 0.51
2 6.684 45.99
3 0.662 37.41
4 0.028 2.335 0.025 0.625 0.02
4 94.302
ms/2 0.043 1.198
9.386 44.457
0.612 36.018
0.010 2.265 0.010 0.589 0.014
94.603
ms/3 0.078 1.382
8.914 44.204
0.469 35.737
0.038 2.465 0.045 0.615 0.130
94.077
ms/4 0.000 0.778
7.820 45.918
0.345 37.904
0.026 2.453 0.031 0.517 0.011
95.804
ms/5 0.000 0.744
7.481 45.595
0.689 37.473
0.016 2.559 0.019 0.526 0.006
95.107
ms/6 0.078 0.764
7.240 46.010
0.609 37.460
0.000 2.359 0.000 0.585 0.011
95.116
Descrip.
SiO2 TiO2 Al2O3
Cr2O3
FeO MnO MgO CaO Na2O Total
gt/1 35.974
0.018
20.976
0.031 34.919
1.245 4.068 1.079 0.038 98.348
gt/2 35.908
0.005
20.952
0.031 35.967
2.033 2.578 1.119 0.030 98.602
gt/3 36.379
0.003
20.963
0.003 35.506
1.382 3.574 0.933 0.042 98.784
gt/4 35.084
0.010
20.804
0.000 36.218
2.148 2.786 1.112 0.044 98.208
gt/5 35.427
0.000
20.735
0.026 36.605
2.402 2.527 0.826 0.020 98.568
gt/6 35.630
0.027
20.946
0.039 36.337
2.204 2.666 0.923 0.070 98.843
gt/6 core
36.062
0.048
20.980
0.029 35.351
2.447 2.481 1.233 0.027 98.658
22
Descrip.
Na2O K2O SiO2 Al2O3
FeO MgO CaO Total
pl/1 9.236 0.104
63.188
22.671
0.072 0.000 4.405 99.676
pl/2 9.161 0.090
63.323
23.331
0.242 0.002 4.742 100.890
pl/3 9.382 0.114
64.129
23.055
0.059 0.000 4.137 100.877
pl/4 9.308 0.093
64.065
23.004
0.032 0.013 4.216 100.731
pl/5 9.192 0.096
63.836
23.397
0.129 0.012 4.711 101.372
pl/6 9.279 0.095
63.357
22.582
0.096 0.000 4.260 99.671
pl/6 core
9.325 0.099
63.331
22.756
0.051 0.003 4.326 99.893
Descrip.
SiO2 TiO2 Al2O3
Cr2O3
FeO MnO MgO CaO Na2O Total
st/6 27.098
0.602
53.195
0.079 14.777
0.124 1.501 0.008 0.008 97.392
st/1 26.987
0.594
53.155
0.126 15.076
0.128 1.453 0.000 0.007 97.525
st/2 27.340
0.562
54.620
0.129 14.113
0.108 1.320 0.004 0.008 98.204
st/4 26.854
0.572
53.382
0.073 15.182
0.147 1.501 0.000 0.031 97.742
st/5 27.126
0.547
53.699
0.140 13.868
0.118 1.497 0.007 0.046 97.049
st/6 27.242
0.595
53.146
0.108 15.065
0.083 1.469 0.000 0.016 97.724
st/6 core
27.205
0.564
52.702
0.072 15.211
0.133 1.509 0.000 0.011 97.407
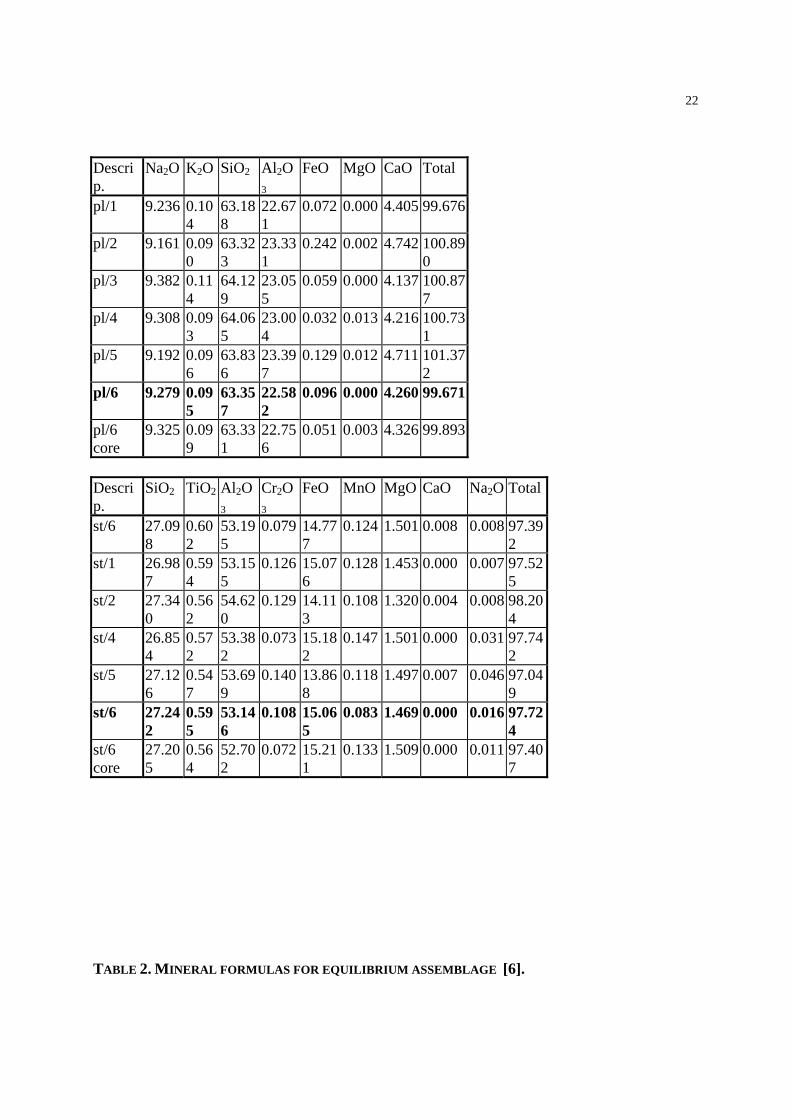
TABLE 2. MINERAL FORMULAS FOR EQUILIBRIUM ASSEMBLAGE [6].
23
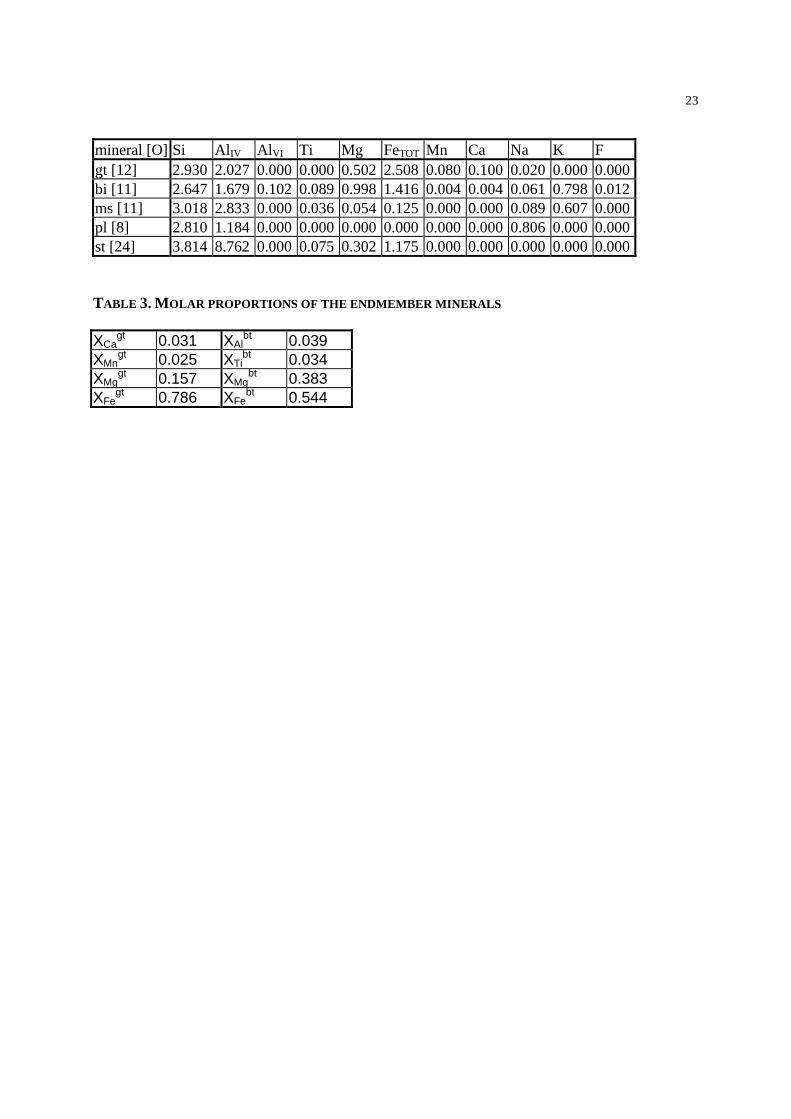
mineral [O] Si AlIV AlVI Ti Mg FeTOT Mn Ca Na K F gt [12] 2.930 2.027 0.000 0.000 0.502 2.508 0.080 0.100 0.020 0.000 0.000 bi [11] 2.647 1.679 0.102 0.089 0.998 1.416 0.004 0.004 0.061 0.798 0.012 ms [11] 3.018 2.833 0.000 0.036 0.054 0.125 0.000 0.000 0.089 0.607 0.000 pl [8] 2.810 1.184 0.000 0.000 0.000 0.000 0.000 0.000 0.806 0.000 0.000 st [24] 3.814 8.762 0.000 0.075 0.302 1.175 0.000 0.000 0.000 0.000 0.000 TABLE 3. MOLAR PROPORTIONS OF THE ENDMEMBER MINERALS XCa
gt 0.031 XAlbt 0.039
XMngt 0.025 XTi
bt 0.034 XMg
gt 0.157 XMgbt 0.383
XFegt 0.786 XFe
bt 0.544

24
GEOTHERMOMETRIC CALCULATIONS Fe/Mg distribution coefficient: ln KD = ln (XFe/XMg)bt = -1.707 (XFe/XMg)gt
Geothermometer formulation and thermodynamic data by Dasgupta et al. (1991): ∆G(P,T) = O = ∆H-SδT+pδV+RTlnKD+ RTln(νFe/νMg)bi-RTln(νFe/νMg)gt
T = ∆H+ RTln(νFe/νMg)bi-RTln(νFe/νMg)gt-pδV S-RlnKD
where ∆H: enthalpy change in cal ∆S : entropy change in cal νi
a : activity coefficient of component i in phase a T : temperature in K p : pressure in bar δV : molar volume change in cal/bar R : gas constant in J/(mol*K) T = 4301+(-463)-(-437)-0.246p 1.85-[8.3145*(-1.707)] T = 4275+0.246p 5.249 Geothermometer formulation and thermodynamic data by Bhattacharya et al. (1992): T = 22733+0.0193p 27.52

25