the impact of photovoltaic on power market in italy - d.migali, r.covicchio, gse
TRANSCRIPT

The impact of photovoltaic on power market in Italy
Rome, 27 April 2017
Ing. Dario Migali, Ing. Valerio Covicchio
Forecasting and optimisation unit
Content
1. PV systems overview
1. GSE’s energy sold and relevance in PV market
2. Installed capacity of PV systems
3. Geographical Distribution of GSE’s PV capacity
2. Impact of PV systems on Day-Ahead Market
1. System Marginal Price
2. Demand
3. Constraints
4. Wholesale energy price (PUN)
5. Zero prices
2

3
PV systems overview Gse’s energy sold and relevance in PV market
11
During 2016 GSE has sold in the Italian electricity market*, commonly called Italian Power Exchange (IPEX), around 27 TWh of electricity produced by RES power plants.
The share of solar energy is 49% (13,4 TWh) of total renewable energy sources sold on the market.
(*) Data are reffered to Day Ahead Market’s sales
0
500
1000
1500
2000
2500
3000
3500
4000
Jan Feb Mar Apr May jun jul Ago Sep Oct Nov Dec
GWh
Energy sold in Day-Ahead Market 2016
Others
Biogas
Hydro
Wind
PV
Thermal
49%
6%
15%
25%
5%
%Share of RES 2016
PV Wind Hydro Biogas Others
4
PV systems overview Installed capacity ,production
12
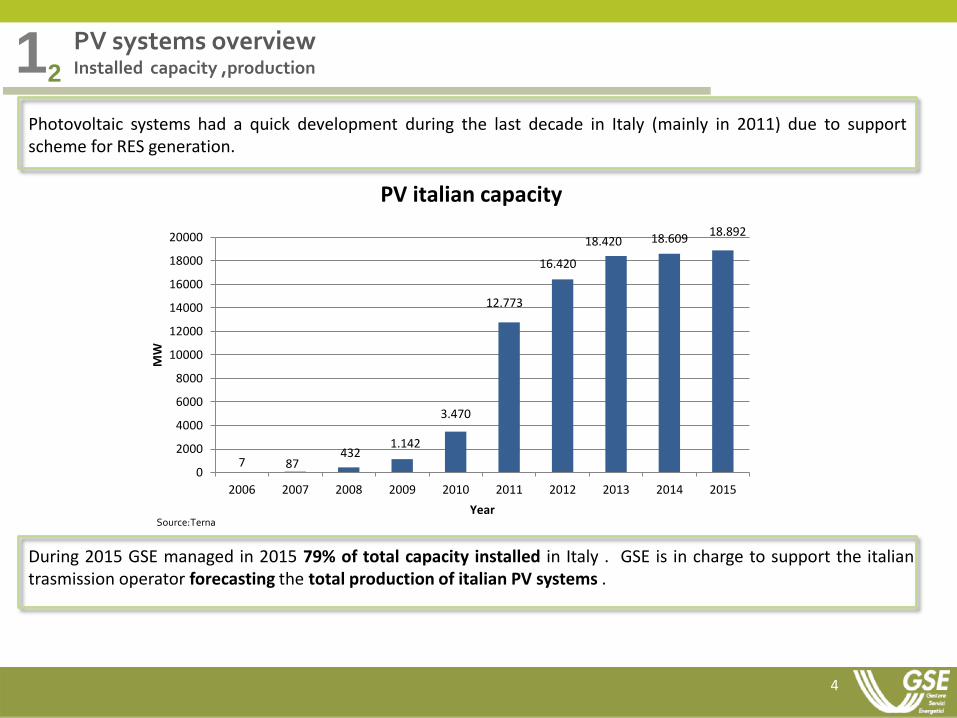
Photovoltaic systems had a quick development during the last decade in Italy (mainly in 2011) due to support scheme for RES generation.
7 87 432
1.142
3.470
12.773
16.420
18.420 18.609 18.892
0
2000
4000
6000
8000
10000
12000
14000
16000
18000
20000
2006 2007 2008 2009 2010 2011 2012 2013 2014 2015
MW
Year
PV italian capacity
During 2015 GSE managed in 2015 79% of total capacity installed in Italy . GSE is in charge to support the italian trasmission operator forecasting the total production of italian PV systems .
Source:Terna

5
PV systems overview Geographical Distribution of PV power
13
The italian market is splitted in 6 market zones (NORD , CNORD, CSUD, SUD, SICI, SARD), each of these zones is considered by TSO as a delivery point of elecrtical energy. The figure represents the GSE capacity of PV systems installed* for each zone.
NORD; 7143
CNORD; 1830
CSUD; 2058
SUD; 2419
SICI; 981
SARD; 499
(*) Year 2015
Zonal Capacity in MW

6
Impact of PV systems on Day-Ahead Market Marginal price system and main actors
21
The Day-Ahead market is based on marginal price system. In this kind of system offers and bids are collected and ordered by price. The clearing price (marginal price) is the highest price offered and accepted in the market session. Each power plant that offered a lower price is paid at the same price (marginal price). Accordingly the intoduction of PV systems (with almost zero variable costs) affects the accepted offer, lowering the clearing price.
RES
2
1
3
1 2 Coal
3 Gas
PV
3
2
4
1 2 RES
3 Coal
4 Gas
1
Price
Quantity
Price
Quantity
7
Impact of PV systems on Day-Ahead Market Demand
22
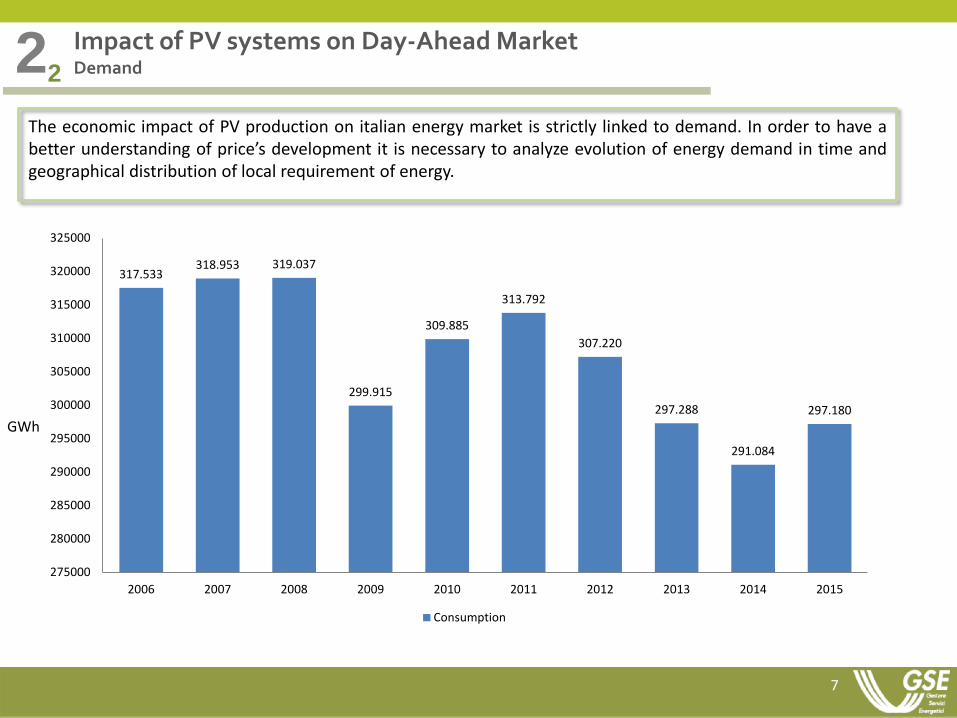
The economic impact of PV production on italian energy market is strictly linked to demand. In order to have a better understanding of price’s development it is necessary to analyze evolution of energy demand in time and geographical distribution of local requirement of energy.
317.533 318.953 319.037
299.915
309.885
313.792
307.220
297.288
291.084
297.180
275000
280000
285000
290000
295000
300000
305000
310000
315000
320000
325000
2006 2007 2008 2009 2010 2011 2012 2013 2014 2015
Consumption
GWh

8
Impact of PV systems on Day-Ahead Market Demand
22
The consumption of electrical energy is not homogeneously distributed over the grid. The NORD market zone consumption is 57% of the national consumption*.
(*) Year 2015, SourceTerna
Zonal Consumption in GWh
NORD; 169241,3
CNORD; 31344,4
CSUD; 45030
SUD; 25804,6
SICI; 17355,9
SARD; 8403,5

9
Impact of PV systems on Day-Ahead Market Constraints
23
Terna (TSO) evaluates power flows limitations on the grid and provide this information before Day-Ahead market opening. The market’s algorithm collects all natiolan supply offers and demand bids (described in terms of quantity and price) and calculates the marginal price of accepted quantities. If equilibrium between supply and demand does not satisfy these constraints the market algorithm runs again splitting one or more market zones.
Example of market split (14/04/2017)
0
20
40
60
80
100
1 3 5 7 9 11 13 15 17 19 21 23
€/MWh
NORD CNOR CSUD SUD SARD SICI

10
Impact of PV systems on Day-Ahead Market Wholesale energy price (PUN)
24
The single national price (PUN) is the wholesale price of weighted average of zonal prices formed in each market zone. Contraction of demand, development of fuel’s cost, increase of PV installations and evolution of imports are the main factors that affect PUN’s evolution in time.
74,8 71,0
87,0
63,7 64,1
72,2 75,5
63,0
52,1 52,3
0
10
20
30
40
50
60
70
80
90
100
275000
280000
285000
290000
295000
300000
305000
310000
315000
320000
325000
2006 2007 2008 2009 2010 2011 2012 2013 2014 2015
Pu
n E
uro
/MW
h
De
man
d G
Wh
Demand/Pun
Demand Pun

11
Impact of PV systems on Day-Ahead Market Wholesale energy price (PUN)
24
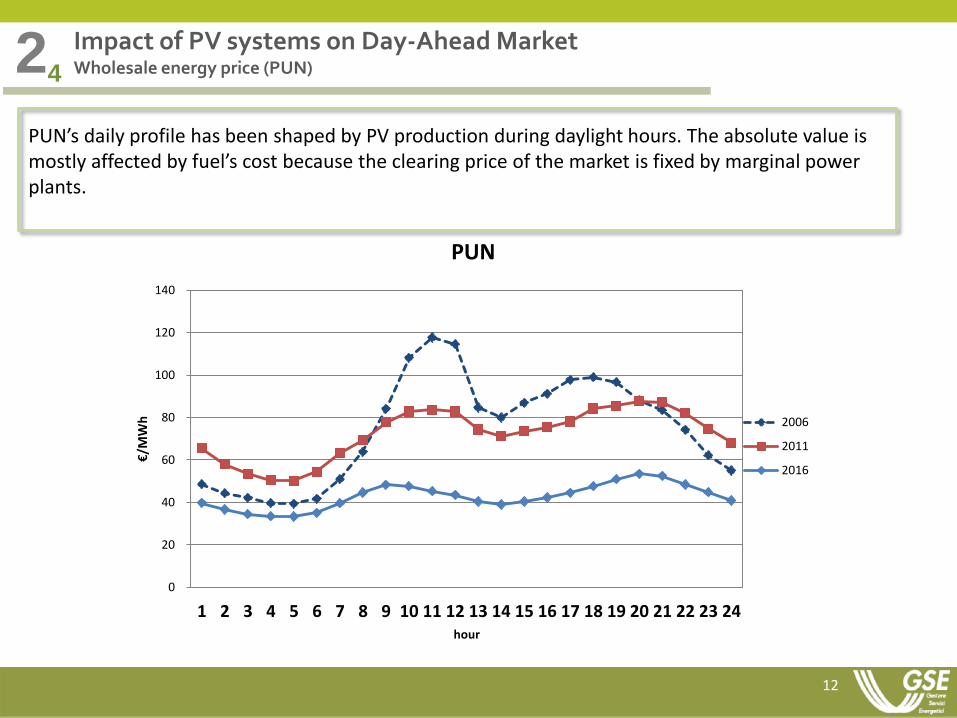
PV production has a direct impact on hourly national price evolution over a day. This penomenon is not evident in annual average PUN’s trend. The figure below shows the average value of hourly price.
0
20
40
60
80
100
120
140
1 2 3 4 5 6 7 8 9 10 11 12 13 14 15 16 17 18 19 20 21 22 23 24
€/M
Wh
hour
PUN
2006
12
Impact of PV systems on Day-Ahead Market Wholesale energy price (PUN)
24
0
20
40
60
80
100
120
140
1 2 3 4 5 6 7 8 9 10 11 12 13 14 15 16 17 18 19 20 21 22 23 24
€/M
Wh
hour
PUN
2006
2011
2016
PUN’s daily profile has been shaped by PV production during daylight hours. The absolute value is mostly affected by fuel’s cost because the clearing price of the market is fixed by marginal power plants.

13
Impact of PV systems on Day-Ahead Market Wholesale energy price (PUN)
24
Peak price hours shift and increased stability of mean hourly price over the day
0
20
40
60
80
100
120
140
1 2 3 4 5 6 7 8 9 10 11 12 13 14 15 16 17 18 19 20 21 22 23 24
€/M
Wh
hour
PUN
2006
2016

14
Impact of PV systems on Day-Ahead Market Zero Prices
24
PUN is an averaged macro parameter which is not suitable to describe sporadic events that are nevertheless emblematic for the market. Italian market doesn’t allow dispatching users to offer negative prices. The floor is equal to zero. In the figure is shown the number of hours in which the marginal price of the power market have been equal to zero.
0 0 0 0 0 0 0 0 0
69
34
8
20
48
4
48
91 89
61 71
0
71
163
139
15 15
0
15
29 19
0 0 0 0 0 0 0
20
40
60
80
100
120
140
160
180
CN
OR
CSU
D
NO
RD
SAR
D
SIC
I
SUD
CN
OR
CSU
D
NO
RD
SAR
D
SIC
I
SUD
CN
OR
CSU
D
NO
RD
SAR
D
SIC
I
SUD
CN
OR
CSU
D
NO
RD
SAR
D
SIC
I
SUD
CN
OR
CSU
D
NO
RD
SAR
D
SIC
I
SUD
CN
OR
CSU
D
NO
RD
SAR
D
SIC
I
SUD
2011 2012 2013 2014 2015 2016
Hours with zero zonal prices

15
Impact of PV systems on Day-Ahead Market Zero Prices
24
PUN is an averaged macro parameter which is not suitable to describe sporadic events that are nevertheless emblematic for the market. Italian market doesn’t allow dispatching users to offer negative prices. The floor is equal to zero. In the figure is shown the number of hours in which the marginal price of the power market have been equal to zero.
0 0 0 0 0 0 0 0 0
69
34
8
20
48
4
48
91 89
61 71
0
71
163
139
15 15
0
15
29 19
0 0 0 0 0 0 0
20
40
60
80
100
120
140
160
180
CN
OR
CSU
D
NO
RD
SAR
D
SIC
I
SUD
CN
OR
CSU
D
NO
RD
SAR
D
SIC
I
SUD
CN
OR
CSU
D
NO
RD
SAR
D
SIC
I
SUD
CN
OR
CSU
D
NO
RD
SAR
D
SIC
I
SUD
CN
OR
CSU
D
NO
RD
SAR
D
SIC
I
SUD
CN
OR
CSU
D
NO
RD
SAR
D
SIC
I
SUD
2011 2012 2013 2014 2015 2016
Hours with zero zonal prices
275000
280000
285000
290000
295000
300000
305000
310000
315000
320000
325000
2006 2007 2008 2009 2010 2011 2012 2013 2014 2015
De
man
d G
Wh
Demand
Demand
16
Next steps
3
The anomalies underlined require investments in grid development and
improvement of market rules and structure The main issues authorities and stakeholders are working on are: • Capacity Market
• Dispacthing services in MT/BT (DSO)
• Ancillary services provided by FER

17
Thanks for your attention