the impact of phosphorous species on dewaterability of
TRANSCRIPT
Marquette Universitye-Publications@Marquette
Master's Theses (2009 -) Dissertations, Theses, and Professional Projects
The Impact of Phosphorous Species onDewaterability of Wastewater SolidsErik AndersonMarquette University
Recommended CitationAnderson, Erik, "The Impact of Phosphorous Species on Dewaterability of Wastewater Solids" (2018). Master's Theses (2009 -). 454.https://epublications.marquette.edu/theses_open/454

THE IMPACT OF PHOSPHOROUS SPECIES ON DEWATERABILITY OF
WASTEWATER SOLIDS
by
Erik Anderson
A Thesis submitted to the Faculty of the Graduate School,
Marquette University,
in Partial Fulfillment of the Requirements for
the Degree of Master of Science
Milwaukee, Wisconsin
May 2018

ABSTRACT
THE IMPACT OF PHOSPHOROUS SPECIES ON DEWATERABILITY OF
WASTEWATER SOLIDS
Erik Anderson
Marquette University, 2018
Phosphorus regulations are causing Water Resource Recovery Facilities (WRRFs) to
implement new technologies to remove phosphorus (P) before they discharge liquid
effluent. Enhanced Biological Phosphorus Removal (EBPR) is often employed to
remove P from water. However, sludges from EBPR plants have shown decreases in
dewaterability soon after EBPR was initiated. This decline in dewaterability is not well
understood, nor is the best way to improve the dewatering EBPR sludge. Specifically, the
role of different P species on sludge dewaterability is not well understood. Several
laboratory experiments were conducted at the Marquette University Water Quality Center
with the following objectives: i) determine the impact of P speciation on dewaterability
of various sludges, ii) determine an effective method for converting non-reactive P to
reactive P in sludge, and iii) determine the impact of acid treatment and decanting on
anaerobic digester dewaterability. P speciation and capillary suction time (a measurement
of dewaterability) of sludge were the main characteristics measured in this research. A
survey of various sludges from full-scale WRRFs was conducted and revealed that
particulate P correlated to poor dewaterability in undigested sludges. Lab-scale anaerobic
digesters were fed acid pretreated sludge to determine the impact of pretreatment and P
species on the dewaterability of anaerobic digester biosolids. Acid pretreatment did not
significantly affect dewaterability relative to control digesters that received untreated
sludge. Centrate reactive P, which would contain orthophosphate, was correlated to poor
dewaterability in anaerobic digester biosolids. It was suspected that orthophosphate
reacted with divalent cations and increased the monovalent to divalent (M/D) cation ratio.
The M/D ratio was previously suggested to correlate to dewaterability. Indeed, results
from these lab-scale studied revealed that an increase in M/D ratio correlated with higher
CST values, i.e. worse dewaterability.

i
ACKNOWLEDGEMENTS
Erik Anderson
I would like to thank the Water Equipment and Policy Center for funding and
support of this research. I would also like to thank the staff at the Fond du Lac and South
Shore treatment facilities for their help in long term sample gathering. I am also very
thankful for the help I received in the Marquette Laboratory from Mike Dollhopf,
Viviana Sanchez, Lee Kimbell, and Dylan Friss. A special thanks to Eileen Kennedy for
her sustained help with the experiments. Much appreciation is given to my thesis
committee members, Dr. Daniel Zitomer and Dr. Brooke Mayer for their help in
supporting and reviewing my thesis. Ultimately, I would like to express my appreciation
for my thesis advisor Dr. Patrick McNamara. His guidance and mentorship throughout
this project has given me valuable insight and learning opportunities to the scientific
process.

ii
DEDICATION
I would like to dedicate this work to the wonderful God that created this Earth and
to all of humanity that is making efforts to preserve it.

iii
TABLE OF CONTENTS
ACKNOWLEDGEMENTS ................................................................................................. i
DEDICATION .................................................................................................................... ii
LIST OF TABLES ............................................................................................................. vi
LIST OF FIGURES .......................................................................................................... vii
1 INTRODUCTION ........................................................................................................... 8
1.1 Motivation ......................................................................................................... 8
1.2 Objectives ......................................................................................................... 9
1.3 Approach ........................................................................................................... 9
1.4 Thesis Structure .............................................................................................. 10
2 LITERATURE REVIEW .............................................................................................. 11
2.1 Goals of Biosolids Handling ........................................................................... 11
2.2 Wastewater Solids Characteristics that Affect Dewaterability ....................... 12
2.2.1 Monovalent to Divalent (M/D) Cation Ratio ................................... 13
2.2.2 Floc Structure ................................................................................... 14
2.2.3 Particle Size Distribution ................................................................. 14
2.2.4 Phosphorus ....................................................................................... 15
2.3 P Species in Sludge ......................................................................................... 15
2.4 Summary of Research Needs .......................................................................... 16
3 METHODS .................................................................................................................... 18

iv
3.1Phosphorus Species Characterization .............................................................. 18
3.1.1 Particulate and Centrate P ................................................................ 18
3.1.2 Reactive P and Non-reactive P ........................................................ 19
3.2 QA/QC ............................................................................................................ 20
3.2.1 Impact of Solids on P Measurements............................................... 20
3.2.2 Reproducibility of P Species Measurements ................................... 21
3.3 Dewaterability Characterization by Capillary Suction Time .......................... 21
3.4 Full-scale Sludge Survey to Determine Links between P Species and
Dewaterability ....................................................................................................... 22
3.5 Lab-Scale Anaerobic Digestion Experiments to Test Impact of Acid
Pretreatment on Dewaterability ............................................................................ 24
3.5.1 Purpose of Experiments ................................................................... 24
3.5.2 Sample Procurement ........................................................................ 24
3.5.3 Selection and Implementation of Acid Pretreatment Step ............... 25
3.5.4 Digester Set Up & Operation ........................................................... 27
3.5.5 Analytical Methods .......................................................................... 29
4 RESULTS & DISCUSSION................................................................................. 30
4.1 QA/QC for P Measurements ........................................................................... 30
4.1.1 Reproducibility of P Speciation Measurement.............................. 30
4.1.2 Impact of Solids on P Measurements............................................... 31
4.2 Full-Scale Sludge Survey: Correlations Between Dewaterability and Sludge
Characteristics ....................................................................................................... 32

v
4.3 Bench Scale Digesters: Dewatering Performance ......................................... 33
4.3.1 Impact of Acid Pretreatment Followed by Decanting of Centrate on
Dewaterability ........................................................................................... 33
4.3.2 Correlation between anaerobic digester effluent sludge
characteristics and dewaterability. ............................................................ 36
4.3.3 Impact of Digestion on P Speciation ............................................. 40
5 CONCLUSIONS................................................................................................... 44
BIBLIOGRAPHY ............................................................................................................. 46
APPENDIX ....................................................................................................................... 50
A: Results from Pre-treatment testing................................................................... 50
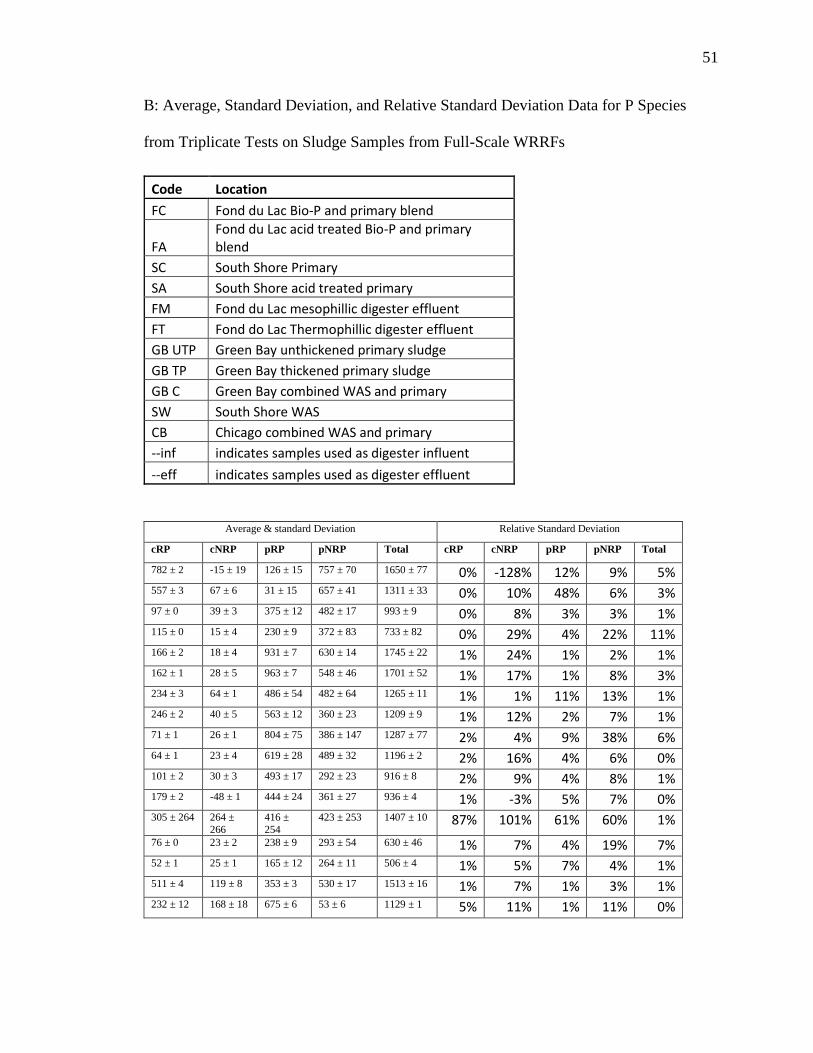
B: Average, Standard Deviation, and Relative Standard Deviation Data for P
Species from Triplicate Tests on Sludge Samples from Full-Scale WRRFs ........ 51
C: cRP vs CST scatter plot................................................................................... 53
D: Time series of P Species for Every Digester ................................................... 54
vi
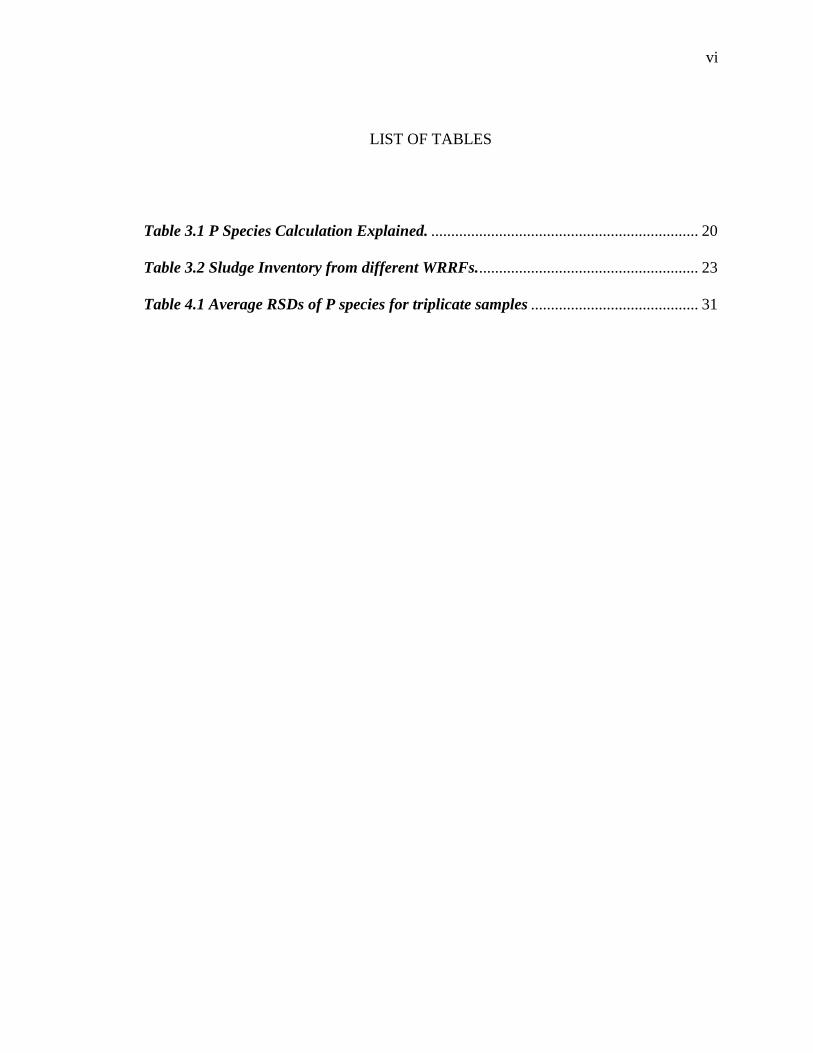
LIST OF TABLES
Table 3.1 P Species Calculation Explained. ................................................................... 20
Table 3.2 Sludge Inventory from different WRRFs........................................................ 23
Table 4.1 Average RSDs of P species for triplicate samples .......................................... 31

vii
LIST OF FIGURES
Figure 3.1 Sludge pre-treatment process schematic. ...................................................... 27
Figure 4.1 Solids concentration can affect P measurements ........................................ 32
Figure 4.2 Acid pretreatment did not impact dewaterability. ......................................... 34
Figure 4.3 Acid pretreatment did not impact dewaterability. ......................................... 35
Figure 4.4 Digester effluent from Bio-P (Fond du Lac) fed digesters is statistically
higher than primary (South Shore) fed digesters. .......................................................... 36
Figure 4.5 Dewaterability becomes worse as cRP concentration increases. ................. 37
Figure 4.6 cNRP, pRP, and pNRP, plotted against CST. ............................................... 39
Figure 4.7 Volatile solids plotted against CST................................................................ 40
Figure 4.8 Particulate reactive P increases in control digesters fed with primary sludge
from South Shore treatment plant. .................................................................................. 42
Figure 4.9 Particulate reactive P increases in acid treated digesters fed with primary
sludge from South Shore treatment plant. ...................................................................... 42
Figure 4.10 Particulate reactive P increases in control digesters fed with Fond du Lac
sludge. ............................................................................................................................... 43
Figure 4.11 Particulate reactive P increases in acid treated digesters fed with Fond du
Lac sludge. ........................................................................................................................ 44
8
1 INTRODUCTION
1.1 Motivation
Phosphorus (P) is a valuable commodity due to its need as a fertilizer, but an over-
abundance of P in wastewater effluent can lead to eutrophication (Mayer et al. 2013).
Stricter effluent limits on P are forcing water resource recovery facilities (WRRFs) to
consider technologies to remove P from their effluent (Wisconsin DNR 2010). Enhanced
biological phosphorous removal (EBPR) is one technology that can aid in reducing P
from liquid effluent. The sludge generated from EBPR, also known as Bio-P solids, carry
high amounts of P in their cell structure. It has been observed at full-scale WRRF
facilities that, when EBPR is implemented, dewaterability of wastewater solids has
decreased (Higgins et al. 2014). A decline in dewaterability is a major issue for WRRFs
because polymer costs increase as dewaterability decreases.
Phosphorus-accumulating organisms (PAOs) are bacteria that perform EBPR.
Soluble phosphate (PO43-), is taken up into the organism and converted to polyphosphate,
a form of P that is not as reactive as phosphate. Wastewater solids that contain these PAO
organisms have high amounts of P. If the P in the wastewater solids could be converted
to soluble phosphate and removed prior to anaerobic digestion, then P possibly could be
recycled as a fertilizer and the dewaterability of the anaerobic digester effluent solids
could potentially improve. While phosphate is suspected to negatively impact
dewaterability (Higgins et al. 2014), it is possible that other P species, such as particulate
P, could also impact dewaterability, but, to the author’s knowledge, no research has been
done to determine the impact of various P species on dewaterability. Research is required
9
to better understand how altering and potentially removing P species could impact
dewaterability and potentially reduce dewaterability costs.
1.2 Objectives
The goal of this research was to investigate the impact of P speciation in wastewater
solids samples on dewaterability and to determine if an anaerobic digestion pretreatment
method to reduce P content could improve dewaterability of digester effluent samples. It
is not clearly understood why bio-P sludges have poorer dewaterability. The specific
objectives of this research were to:
• Determine the impact of P speciation on dewaterability of available unthickened
sludges from full-scale WRRFs specifically including sludge from the Bio-P
process
• Determine the impact of acid pretreatment followed by replacement of centrate
with de-ionized water on downstream anaerobic digester biosolids dewaterability
• Determine the impact of P speciation on anaerobic digester biosolids
dewaterability
• Determine the impact of anaerobic digestion on P speciation
1.3 Approach
Primary sludge, waste activated sludge (WAS), and bio-P sludge were collected
from four full-scale WRRFs. The sludge samples were characterized for four different P
species as described in Section 3.1: i) centrate reactive P (cRP), ii) centrate non-reactive

10
P (cNRP), iii) particulate reactive P (pRP) and iv), particulate non-reactive P (pNRP).
Volatile solids (VS), total solids (TS), monovalent cations, and divalent cations were also
measured. In addition, dewaterability was quantified by capillary suction time (CST).
Lab-scale anaerobic digestion experiments were conducted to determine how P
species and other sludge properties correlated to the dewaterability of anaerobic digester
effluent biosolids. One set of digesters was fed primary sludge and another set was fed a
sludge blend that contained Bio-P sludge. Each set included digesters fed acid pre-treated
sludge for which feed sludge was mixed with acid to alter P speciation as well as control
digesters fed conventional sludge that was not pretreated (Lhao, Mavinic, and Koch,
2003). Microsoft Excel and Graphpad Prism (Graphpad Software Inc., CA, USA) were
used to conduct linear regressions and determine correlations between sludge
characteristics, including P species, and dewaterability. Finally, the impact of anaerobic
digestion on P speciation was determined.
1.4 Thesis Structure
A literature review on relevant sludge properties that affect dewaterability is
presented in Chapter 2. The experimental approach and methods are presented in
Chapter 3. The results and discussion are found in Chapter 4. Finally, the summary of key
findings and recommendations for future work are shown in Chapter 5. Appendices are
attached with supporting graphics and data. Appendix A contains a graphic explaining P
speciation and appendices B-E contain supporting data and graphs for discussion in
Chapter 4.

11
2 LITERATURE REVIEW
2.1 Goals of Biosolids Handling
Wastewater solids are a byproduct of wastewater treatment. The United States
Environmental Protection Agency estimated that over 8 million dry tons of biosolids
were produced in the US in 2000 (U.S. Environmental Protection Agency 1999). The
handling of wastewater solids at a WRRF can range from 25%-50% of the operational
cost (Batstone, Darvodelsky, and Keller 2014). At such a large portion of operating
costs, there is a large financial incentive to reduce the costs associated with biosolids
handling. Finding ways to reduce the volume of biosolids has been the main method to
reduce solids handling costs (Tchobanoglous et al. 2003). Biosolids volume reduction can
be achieved through anaerobic digestion as well as thickening and dewatering.
Anaerobic digestion is a solids handling process whereby sludges generated from
primary and secondary treatment processes are placed in an anaerobic environment with
microbes that convert a portion of the organic material to biogas. Anaerobic digestion
has been reported to reduce total solids by as much as 50% to 60% (Appels et al. 2008).
The effectiveness to stabilize sludge, reduce odor, and reduce sludge volume has made
anaerobic digestion a common process in the United States, with over 1200 digesters
operating at WRRFs across the country (Edwards, Othman, and Burn 2015). As an
additional benefit, methane is created during the anaerobic digestion process which
facilities can use for energy recovery, typically as electricity or heat (Batstone,
Darvodelsky, and Keller 2014). While some solids are destroyed and converted to biogas

12
during digestion, some undigested biosolids still remain that must be handled and
transported off-site.
Thickening and dewatering are processes used to remove water from sludge.
Thickening generally describes removing water from sludge with the product being a
pumpable liquid. Thickening is often achieved using gravity thickeners, gravity belt
thickeners or dissolved air flotation. Influent digester solids are typically thickened to be
between four and six percent total solids. Dewatering generally describes the process of
removing water from sludge with the product being a solid-like cake with final solids
concentration of 15% or greater. Dewatering commonly occurs via belt filter presses or
centrifuges (Tchobanoglous et al. 2003). Dewatering aids such as polymers are used with
thickening and dewatering processes to alter the characteristics of the sludge to allow
greater water removal (Reynolds and Richards 1996). Polymers can be very effective at
increasing the amount of water removed, but some WRRFs spend hundreds of thousands
of dollars a year to purchase the polymer (McNamara and Lawler 2008). Polymer
demand is impacted by the sludge characteristics that affect dewaterability.
2.2 Wastewater Solids Characteristics that Affect Dewaterability
Many characteristics of wastewater solids affect dewaterability, and not one
characteristic completely governs dewaterability. The monovalent to divalent (M/D)
cation ratio, floc structure, particle size distribution, sludge type, and characteristics of
extracellular polymeric substances (EPS) have all been investigated for their impacts on
dewaterability (Neyens et al. 2004). Yet no consensus has been reached regarding the

13
impacts of a given characteristic. Indeed sludge is a complex matrix, and in specific
cases, certain factors are correlated to dewaterability for one type of sludge, but the
correlation was not found when considering other sludge types (Poxon and Darby 1997).
The following characteristics have been studied in the greatest detail with respect to their
effects on dewaterability: cation ratio, floc structure, particle size distribution, and
phosphorus.
2.2.1 Monovalent to Divalent (M/D) Cation Ratio
The M/D cation ratio was first used by Higgins and Novak (1997) to explain the
impact of cations on sludge dewaterability. In their work, the M/D ratio was related to the
divalent cation bridging theory which postulates that divalent cations can bridge together
flocs (the connection of flocs is the goal of adding polymer) and improve dewaterability.
Higgins and Novak (1997) suspected that monovalent cations would replace divalent
cations in sludge flocs mimicking the ion-exchange reaction. This reaction would
remove the bridging ability of the floc, thereby weakening the bonds between flocs.
This weakened floc structure would then lead to worse dewaterability. Higgins and
Novak (1997) added varying ratios of four common cations: sodium, potassium,
magnesium, and calcium. They found that sludge with higher M/D ratios resulted in
poorer dewaterability than sludge with lower M/D ratios. Thus, chemical or biological
reactions in wastewater sludge that decrease the available magnesium or calcium content
would likely hurt dewaterability.

14
2.2.2 Floc Structure
Extracellular polymeric substances (EPS) are the non-living organic materials that
are found in flocs and can negatively or positively affect dewaterability. The structures
that EPS forms between cells have the ability to hold water. EPS slime can bind cells
together, creating flocs, and with more EPS, bigger flocs form, allowing for better
dewaterability (Lima et al. 2005). Many of these bonds, however, can lead to bound
water within the flocs and decrease dewaterability. Houghton, Quarmby, and Stephenson
(2001) found that there is an amount of EPS that is beneficial to creating sludge flocs
until a threshold is achieved where increased amounts of EPS becomes detrimental as
more water is trapped inside the flocs.
Interestingly, there is not agreement in the literature for how to quantify EPS.
Previously, classification of EPS was conducted by protein and polysaccharide
measurement until Shao et al. (2009) created a method that defined EPS into categories
of loosely bound EPS, tightly bound EPS and slime layer. Sometimes EPS can be found
as a slime layer containing up to 99% water that covers bacteria (Costerton and Irvin
1981) suggesting an important role in dewaterability.
2.2.3 Particle Size Distribution
The particle size distribution of wastewater solids has commonly been investigated
for its impact on dewaterability (Jin, Wilén, and Lant 2004; Filali et al. 2012; McNamara
and Lawler 2008; Lawler et al. 1986; Higgins, Tom, and Sobeck 2004). Floc size has a
significant correlation to CST and dewaterability, but also bound water. Usually larger
floc size correlates to more free water and better overall dewaterability. However, flocs

15
too large in size result in higher percentages of bound water in the sludge (Jin, Wilén, and
Lant 2004).
2.2.4 Phosphorus
P can be found in different forms in a wastewater solids matrix, and certain forms
of P can influence dewaterability more than others, with ortho-phosphate suspected to
have the greatest impact on dewaterability. Struvite, which is a phosphate crystal bound
with magnesium (MgNH4PO4 ∙6H2O), has been observed to precipitate in digesters
(Doyle and Parsons 2002; E. Neyens and Baeyens 2003). Struvite contains magnesium.
Therefore, the formation of struvite can reduce the soluble divalent cation concentration
in the wastewater solids; a drop in divalent cations can be linked to poor dewaterability
(Higgins et al. 2014; Higgins and Novak 1997; Higgins, Tom, and Sobeck 2004).
Soluble ortho-P could be related to floc structure and dewatering by reducing the
available divalent cations, but there is a gap in knowledge of how other forms of P
influence dewaterability.
2.3 P Species in Sludge
P can be found in many forms in sludge, yet only a few forms have been
investigated in relation to dewaterability. Soluble ortho-phosphate and total P have been
the prevailing forms of P measured in sludge (Novak et al. 2017; Popel and Jardin 1993;
Barnard and Shimp 2013). Ortho-phosphate, also known as reactive P, is observed to
create precipitates and influence dewaterability in sludge and biosolids (Popel and Jardin

16
1993; Doyle and Parsons 2002). Some researchers have begun to define and measure
other forms of P, such as loosely-bound P, resin exchangeable P, and organic P (Huang,
Chen, and Shenker 2006).
P classified as non-reactive P encompasses any form of P that is stable and does not
react chemically in solution when measuring reactive P according to standard
methods(Rice et al. 2012). Examples of non-reactive P are P bound to organic
compounds or as phosphate bound to multiple phosphates in a chain called poly-
phosphates.
Based on the literature reviewed, it is not known if soluble non-reactive P impacts
dewaterability. Guibaud et al. (2005) stated in their study on the complexation potential
of EPS that their measurement method of P did not determine the species of P but only
total P, thus exposing the need for research in this area. Park et al (2007) found that total
P influenced the hydrophobicity of EPS, which strongly correlated to bound water and
poor dewaterability. No explanation for P speciation was given in this research so it was
not determined if poor dewaterability was impacted by a specific P species or simply total
P. The lack of reporting on specific P species highlights the lack of knowledge regarding
the impacts of different P species on dewaterability.
2.4 Summary of Research Needs
Existing literature has several gaps in knowledge regarding how P speciation affects
dewaterability in sludge and digested biosolids. A deeper understanding of P speciation
and its effects on dewaterability could allow WRRFs to implement new technologies and

17
processes to help reduce polymer costs and create new value-added products. In this
study, the impact of P on sludge and biosolids dewaterability was evaluated through four
research objectives.
Objective 1: Determine the impact of P speciation on dewaterability of WRRF
sludges
Hypothesis: Higher soluble reactive P (most closely measured in this study as
centrate reactive P (cRP)) decreases dewaterability
Objective 2: Determine the impact of acid treatment and replacement of supernatant
on anaerobic digester biosolids dewaterability.
Hypothesis: Acid treatment will improve digester biosolids dewaterability.
Objective 3: Determine the impact of P speciation on anaerobic digester effluent
sludge dewaterability.
Hypothesis: Higher cRP will decrease digester biosolids dewaterability
Objective 4: Determine the impact of anaerobic digestion on P speciation.
Hypothesis: Non-reactive P species will increase due to the formation of struvite.
18
3 METHODS
3.1 Phosphorus Species Characterization
3.1.1 Particulate and Centrate P
Four types of P are reported in this work: centrate reactive P (cRP), centrate non-
reactive P (cNRP), particulate reactive P (pRP), and particulate non-reactive P (pNRP),
and are further detailed in Table 3.1. P speciation in wastewater solids was defined and
measured in these experiments to mimic a wastewater solids centrifuge system since
centrifugation is used in full-scale systems (Dueñas et al. 2003), i.e, solids and liquids are
commonly separated by a centrifuge and not a 0.45 micron filter in a full-scale system.
Measuring P speciation in a sample of centrate can be helpful to WRRFs looking to
design P recovery processes from the centrifuge effluent stream.
Centrate P was the P remaining in the centrate from a sludge sample that was
centrifuged at 6000 rpm for 7 minutes. Rotation speed was the maximum speed of the
existing equipment, and centrifuge time was determined experimentally to ensure all
visible sludge particles were found in pellet form. To quantify particulate P, total
phosphorus (TP) concentration was measured in a well-mixed (uncentrifuged) sludge
sample and in a centrate sample; the difference in TP between the sludge sample and the
centrate sample concentrations was calculated as the particulate P concentration.
Determining particulate P by difference of two values followed the assumption, but not
the process, laid out by standard methods, i.e., that all P not in centrate is assumed to be
particulate (Rice et al. 2012).

19
3.1.2 Reactive P and Non-reactive P
Reactive P was measured according to standard methods (Rice et al. 2012). Briefly,
a sample was diluted with DI water to be within the limits of the standard curve values.
Then, 1.6 mL of a reagent containing potassium tartrate, ammonium molybdate, sulfuric
acid, and ascorbic acid were added to 10 mL of sample. The sample was mixed and
reacted for ten minutes. Then absorbance at 880 nm wavelength was measured on a
spectrophotometer. A standard curve was made by adding dipotassium phosphate to de-
ionized water at concentrations ranging from 0.12 to 3 mg/L as ortho-P.
TP was measured according to standard methods (Rice et al. 2012). Briefly, solids
digestion was performed to break down organic matter and convert all phosphorus to
ortho-P. Section B of method 4500-P was followed whereby persulfate and acid were
added to a sample prior to autoclaving (Higgins et al. 2014; Britton et al. 2015). For the
results reported, 0.5 grams of potassium persulfate and 1 mL of 30% sulfuric acid were
used in each sample. Non-reactive P was calculated by subtracting the measured reactive
P from the TP measurement (Table 3.1). In standard methods, the difference between
total P and reactive P is defined as organic P, non-reactive P. However not all P
converted in the digestion process is in organic form; there are inorganic polyphosphates
converted as well (Moore 2010). Therefore, the term non-reactive was used to encompass
all P species converted via persulfate digestion.

20
Table 3.1 P Species Calculation Explained.
Four P species were analyzed in sludge samples (labeled with *). P species that were
measured directly via a single lab method are indicated with the word “measured” below
the name. P species that were calculated by the difference of other measured P values are
indicated by “Calc” followed by the equation used to determine the value.
Total P Reactive P Non-reactive P
total P total P (TP)
measured
total reactive P (tRP)
measured
total non-reactive P (tNRP)
Calc: TP-tRP
centrate P
centrate total P
(cTP)
measured
*centrate reactive P (cRP)
measured
* centrate non-reactive P
(cNRP)
Calc: cTP-cRP
particulate
P
particulate total P
(pTP)
Calc: TP-cTP
* particulate reactive P
(pRP)
Calc: tRP-cRP
*particulate reactive P
(pNRP)
Calc: pTP-pRP
3.2 QA/QC
3.2.1 Impact of Solids on P Measurements
The solids present in wastewater could interfere with P measurements, ostensibly
due to solids reacting with the oxidant. To test this effect, aliquots from the same batch of
sludge were diluted to different ratios before being digested with the same amount of acid
and oxidant. The TP values of the diluted samples were measured and normalized by the
dilution factor so that, if solids had no impact on P measurements, then all reported TP
values would be the same. Solids interference would result in lower TP measurements.
21
3.2.2 Reproducibility of P Species Measurements
P species were measured in triplicate in a subset of sludge samples to determine the
reproducibility and variability of the P species measurements. Three aliquots were taken
from the same sludge sample and all four P species (cRP, cNRP, pRP, pNRP) were
measured for each aliquot resulting in three values for each P species. The average and
standard deviation of the three values were determined, and the relative standard
deviation (RSD) was calculated by dividing the standard deviation by the average. In
total, 38 sludge aliquots were analyzed in triplicate. The average RSD value from the 38
samples was calculated to find the largest variability.
3.3 Dewaterability Characterization by Capillary Suction Time
CST was conducted to determine dewaterability of sludges ( Higgins, Tom, and
Sobeck 2004) . A multi-purpose CST apparatus (Triton Electronics Limited, Great
Dunmow, Essex, England) measured the time for water to move across filter paper (GE
Whatman, Grade 17 7x9cm) from an inner diameter near an input well to an outer
diameter. The sludge solids remained in the well on top of the filter paper, and the water
from the sludge flows out of the sludge and through the paper. The time for water to
move from inner diameter to outer diameter was measured by electrodes and is typically
called CST. A low CST value indicates good dewaterability, while a higher CST value
indicates poorer dewaterability.

22
3.4 Full-scale Sludge Survey to Determine Links between P Species and
Dewaterability
Sludge samples were collected from four different wastewater reclamation districts
to test the hypothesis that cRP decreases dewaterability (CST). This survey was
conducted to complete the following objective:
Objective 1: Determine the impact of P speciation on dewaterability of WRRF
sludges
Hypothesis: Higher soluble reactive P (most closely measured in this study as
centrate reactive P (cRP)) decreases dewaterability
Sludge samples were characterized by measuring P speciation (cRP, cNRP, pRP,
pNRP), TP, TS, and VS). Dewaterability was characterized by measuring CST. Four
sewerage districts in the midwest US contributed sludge; Milwaukee Metropolitan
Sewerage District (MMSD), Green Bay Metropolitan Sewerage District, City of Fond du
Lac Wastewater Treatment Division, and the Metropolitan Water Reclamation District of
Greater Chicago (MWRD). Different types of sludges were surveyed. A thickened blend
of primary and waste activate sludge (WAS) was analyzed from Green Bay, Fond du Lac,
and MWRD. Unthickened primary sludge was analyzed from Green Bay, MMSD Jones
Island plant, and MMSD South Shore plant. The WAS sample from Fond du Lac
included bio-P sludge 80% of the time, according to the superintendent of the facility (A
Fischer, Personal Communication, June 19, 2017). A thickened primary sludge sample
was analyzed from Green Bay, as well as WAS samples from MMSD Jones Island plant
and MMSD South Shore plant. All different types of samples from these locations were

23
analyzed once with the exception of the blended sludge from Fond du Lac and the
primary sludge from South Shore which were analyzed twice.
Table 3.2 Sludge Inventory from different WRRFs.
MMSD Green Bay Fond du Lac MWRD
Unthickened
primary,
WAS
Thickened blend,
Unthickened
primary,
thickened primary
Thickened blend,
WAS
Thickened blend
Linear regressions between the sludge characteristics and CST values were plotted.
Coefficient of determination (r2) values and linear regression slope values were
calculated. The slope of the linear regression trendline was used to determine the impact
of the correlation. A low slope value indicated less of an impact of a parameter on CST
than a higher slope value. GraphPad was used to determine if the mean slope from
replicate analyses was statistically different from zero.

24
3.5 Lab-Scale Anaerobic Digestion Experiments to Test Impact of Acid
Pretreatment on Dewaterability
3.5.1 Purpose of Experiments
Lab-scale anaerobic digesters were operated to meet the following research objectives
and test the following hypotheses:
Objective 2: Determine the impact of acid treatment and replacement of supernatant
on anaerobic digester biosolids dewaterability.
Hypothesis: Acid treatment will improve digester biosolids dewaterability.
Objective 3: Determine the impact of P speciation on anaerobic digester effluent
sludge dewaterability.
Hypothesis: Higher cRP will decrease digester biosolids dewaterability
Objective 4: Determine the impact of anaerobic digestion on P speciation.
Hypothesis: Non-reactive P species will increase due to the formation of struvite.
3.5.2 Sample Procurement
Two sets of lab-scale digesters were operated. One digester set was fed screened
primary sludge from the South Shore WRRF (Oak Creek, WI) and the other set was fed a
blend of primary and WAS from the city of Fond du Lac WRRF. According to the
wastewater superintendent, the activated sludge system at Fond du Lac was run
intermittently as bio-P approximately 70-80% of the time. The sludge from Fond du Lac
was shipped weekly on ice to the Water Quality Center lab. Primary sludge from the

25
South Shore facility was picked up from the facility on a weekly basis. Sludge fed to the
digesters was stored in refrigerators at 2-5 °C for up to two weeks.
Primary sludge samples were also procured from Jones Island for pre-treatment
tests described in the following section. This sludge was used for pre-treatment testing for
two reasons: 1) Jones Island primary sludge is piped to the South Shore facility for
anaerobic digestion and 2) Jones Island was more readily accessible for sample
procurement. Primary sludge from South Shore was used for the lab-scale anaerobic
digesters because it most closely represented the typical sludge fed to the anaerobic
digesters at the South Shore facility. For the remainder of this thesis, the primary sludge
from the South Shore facility will be referred to as South Shore sludge (SS), and the
blended sludge from Fond du Lac will be referred to as Fond du Lac sludge (FDL).
3.5.3 Selection and Implementation of Acid Pretreatment Step
Various pre-treatment processes, which occur directly before the anaerobic
digestion of sludge, were assessed to determine the impact of treatment on P-speciation in
sludge samples. The goal was to determine which pretreatment was most effective at
increasing cRP in sludge, because cRP is the form of P that is easiest to recover. These
pretreatment tests were conducted to determine which pre-treatment step would be used
to alter influent cRP levels for lab-scale digester experiments.
MMSD primary sludge from Jones Island WRRF was treated in the following
ways: sulfuric acid treatment, sodium hydroxide treatment, calcium hydroxide treatment,
mechanical lysis using a blender, and heat treatment using autoclave. The concentrations
of chemical addition can be found in Appendix A. One experiment was performed for

26
each method with a control for each due to the variability of the sludge used, as several
sludge samples from Jones Island were used to conduct the experiments. All control
samples underwent stirring and no pre-treatment for the same time the test sludge was
stirred (30 minutes) with the exceptions of the heat treatment that was not stirred and
blender treatment which was treated for 10 minutes. This step of stirring the control was
done to account for any effects from stirring. From the multiple pre-treatment methods
that were tested, acid pretreatment resulted in the largest increase in cRP (See Appendix
B). Acid pretreatment converted the highest percentage of P to cRP and was selected as
the process to increase the cRP content in sludge and subsequently remove it via
centrifuging the sludge and decanting the supernatant.
The acid pre-treatment process follows the steps depicted in Figure 3.1. First,
hydrochloric acid was used at a dosage of 180 meq/L. To treat the sludge, half of the
volume fed to the digesters (150 mL) was treated with 3.1 mL of 6N acid to create the
180 meq/L dosage conditions and stirred in an open beaker for 30 minutes. After
treatment, the sludge was centrifuged at 6000 rpm for 7 minutes in 50 mL centrifuge
tubes. The centrate was discarded and DI water was added to reconstitute the sludge to
the original solids concentration by matching the original volume. The reconstituted
sludge was then mixed with the same volume of untreated sludge to increase the pH of
the sludge and keep the digesters from becoming too acidic. This final mix was fed to the
acid digesters. Control digesters received the same volume of sludge without any pre-
treatment (Figure 3.1).

27
3.5.4 Digester Set Up & Operation
Four sets of duplicate digesters were operated. The sets included: i) test digesters fed
acid-treated primary sludge from SS (named SA1 and SA2), ii) control digesters fed
primary sludge from SS (named SC1 and SC2,) iii) test digesters fed acid-treated,
blended sludge from FDL (named FA1 and FA2), and iv) control digesters fed blend
sludge from FDL (named FC1 and FC2). All digesters were operated in a temperature-
controlled room at 35 °C on multi-position stir plates operated between 180 and 190 rpm.
The stir plates ran on a timer for 6 hours a day and digesters were fed during the stirring
hours. Intermittent stirring was conducted to match full scale digestion practices, as well
as for concern of erosion of internal stir bars due to sediment buildup. Each digester was
a cylinder of poly-carbonate with an acrylic lid and a ½” valve port on the lid and 1”
from the bottom as the feed and effluent ports respectively. A volume (2.25 L) of digester
effluent from full scale digesters at the South Shore WRRF were used to seed all
A Add acid
Stir 30 minutes
B Centrifuge 7 minutes
C Decant centrate, fill
to original volume
with DI
D Mix with non-treated half
Figure 3.1 Sludge pre-treatment process schematic. A Step: Addition of 3.1 mL of 6N
HCl into 150 mL of sludge and stirred for 30 minutes on a stir plate. B Step: Sludge
placed in centrifuge tubes and ran in centrifuge. C Step: Centrate decanted from tubes,
lost volume replaced with de-ionized water and remixed into sludge. D Step: 150 mL of
reconstituted sludge was mixed with 150 mL of untreated sludge.

28
digesters and the digesters were initially sparged with a 30% carbon dioxide and 70%
nitrogen gas. One small port was installed on each lid of the digester cylinders to release
the gas via Tygon tubing to a Tedlar bag which held the gas until analysis.
The digesters were operated on a 15-day solids retention time (SRT) for a total of
69 days, which was the amount of time needed to measure P speciation seven times each
for all digesters during steady state conditions. Feeding required 150 mL of sludge to be
removed and fed each day to the digesters. A funnel was placed in the top of the feed
valve to aid in sludge feeding and care was taken to close the valve quickly after the
sludge flowed into the digester. Original experimental planning estimated quasi-steady-
state to be attained after digesters were operated for 3 SRT values (i.e., after 45 days),
after which P measurements and CST measurements were taken to observe the effects of
P speciation on CST. However, after operation and data analysis, it was determined that
substantial variation in P speciation was still occurring after 45 days (see Appendix D).
Quasi-steady-state was assumed to occur when the average total P effluent concentration
was within 20% of the influent total P concentration. This definition resulted in n=4
steady state samples for the digesters fed SS sludge and n=6 steady state samples for the
digesters fed FDL sludge.
Several sludge and biogas characteristics were measured during digester operation
to monitor performance. The pH of the effluent sludge was measured every day after
feeding. The biogas methane concentration as well as TS, VS, CST, cation concentrations
and concentration of various P species were measured weekly in effluent from all
digesters. Biogas volume was measured as needed as the Tedlar bags filled up.

29
3.5.5 Analytical Methods
Biogas methane concentration and gas production volume from the digesters were
measured to determine overall digester function. Gas production was determined by
attaching Tedlar bags to the digester and measuring the gas volume in the bag using a wet
test meter (Precision Test Company, San Antonio, Texas, United States). Average daily
gas production was determined by dividing the measured volume in the bag by the
number of days gas was collected. Gas composition was determined by taking a well-
mixed gas sample from Tedlar bags attached to the digester vessel and analyzing the
sample using a gas chromatograph with a thermal conductivity detector (GC-TCD) as
described elsewhere (Venkiteshwaran 2010).

30
4 RESULTS & DISCUSSION
4.1 QA/QC for P Measurements
4.1.1 Reproducibility of P Speciation Measurement
Reproducibility of P measurements was investigated to understand precision of the
method. Triplicate P samples were taken from 38 samples and relative standard deviation
was calculated. For each sample, three values for each P species concentration were
generated and the average, standard deviation, and relative standard deviation (RSD)
were calculated for every sample. The RSD values from all triplicate sample groups were
averaged together for each species and the results are found in Table 4.1 (e.g., all cRP
RSDs were averaged). TP and cRP were determined from direct measurements, cNRP
and pRP were calculated by the difference of two measured values, and pNRP was
derived by taking the difference twice (see Table 3.1 for description of measurements and
calculations). The average RSD for TP was lowest which was expected because TP was
determined directly and did not encompass taking the difference of multiple values
determined in the lab. The pNRP, on the other hand, had the highest RSD value and
encompassed multiple measurements in the lab and inherently contained more steps for
variability. The determination of some P species concentrations by difference yielded
some individual results that were negative (see Appendix B for a list of all data from
these 38 triplicate measurements).

31
Table 4.1 Average RSDs of P species for triplicate samples
(n=38).
cRP cNRP pRP pNRP TP
10% 10% 12% 23% 6%
4.1.2 Impact of Solids on P Measurements
Experiments were performed to determine how solids concentration impacted P
measurements. Triplicate samples from the same sludge sample were diluted to different
solids concentrations. TP was measured in all samples, and the dilution factors were used
to determine original P concentrations. TP measurements fell within ten percent of the
average for diluted samples with solids concentrations less than or equal to 225 mg/L
(Figure 4.1). A variation of ten percent was deemed acceptable and was attributed to
inherent measurement variability. At solids concentrations higher than 225 mg/L, the
corrected TP values declined, indicating that solids were interfering with TP
measurements. Therefore, the concentration of solids in diluted sludge samples for
analysis in remaining experiments did not exceed 225 mg/L to minimize inhibition due to
solids. To be conservative, a solids concentration of 45 mg/L was used as a target in
diluted samples for P analysis.

32
Figure 4.1 Solids concentration can affect P measurements. A sludge sample was
diluted and the total P was measured. Dilution factors were taken into account such that
all samples should have the same total P values if solids were not inhibitory.
4.2 Full-Scale Sludge Survey: Correlations Between Dewaterability and Sludge
Characteristics
Analyses were performed to determine how P speciation in full-scale sludge
samples correlated to dewaterability. The hypothesis stated that higher cRP
concentrations would result in worse dewaterability. This hypothesis was rejected on the
grounds of the low r2 value between cRP and CST (r2= 0.06, n=8, see Appendix C).
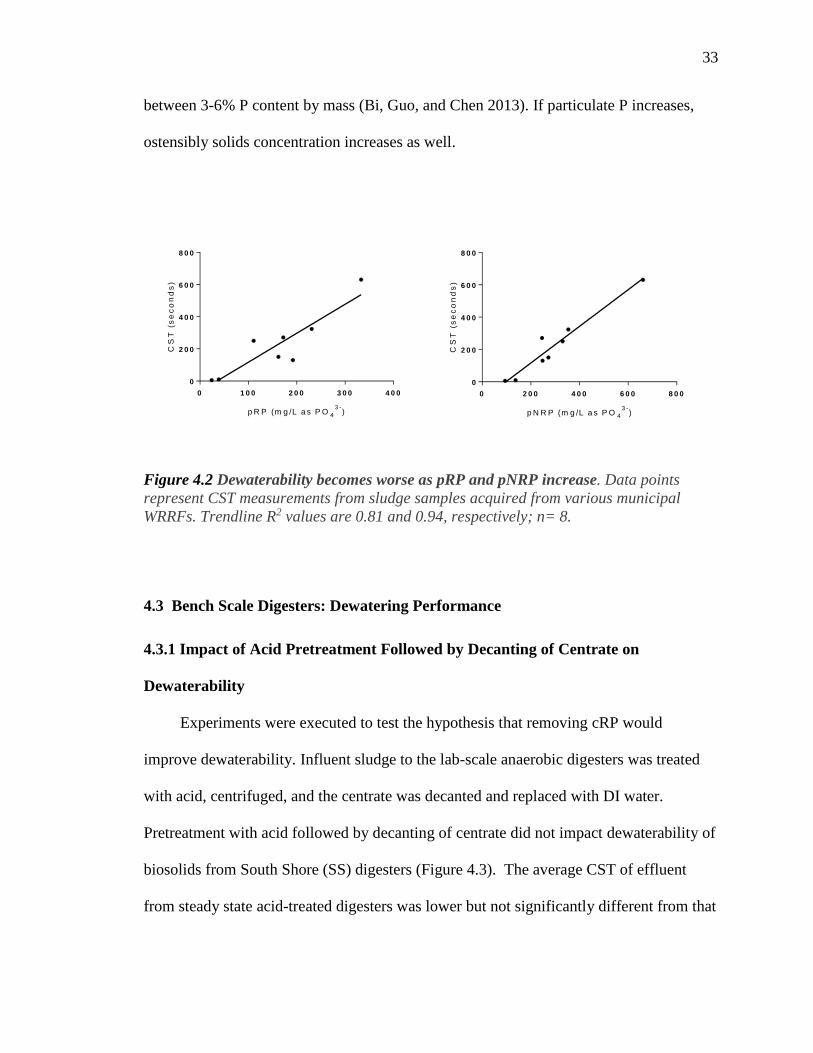
However, pRP and pNRP concentrations were found to trend with CST with slopes of
1.80 and 1.13, respectively (Figure 4.2). Raw EBPR sludge has been reported to have
y = 1808.2e-1E-04x
R² = 0.8926
800
1000
1200
1400
1600
1800
2000
2200
1 10 100 1000 10000
Origin
al S
am
ple
Tota
l P
(m
g/L
PO
43- )
Diluted sample solids concentration (mg/L)
33
between 3-6% P content by mass (Bi, Guo, and Chen 2013). If particulate P increases,
ostensibly solids concentration increases as well.
0 1 0 0 2 0 0 3 0 0 4 0 0
0
2 0 0
4 0 0
6 0 0
8 0 0
p R P (m g /L a s P O 4
3 -)
CS
T (
se
co
nd
s)
0 2 0 0 4 0 0 6 0 0 8 0 0
0
2 0 0
4 0 0
6 0 0
8 0 0
p N R P (m g /L a s P O 4
3 -)
CS
T (
se
co
nd
s)
Figure 4.2 Dewaterability becomes worse as pRP and pNRP increase. Data points
represent CST measurements from sludge samples acquired from various municipal
WRRFs. Trendline R2 values are 0.81 and 0.94, respectively; n= 8.
4.3 Bench Scale Digesters: Dewatering Performance
4.3.1 Impact of Acid Pretreatment Followed by Decanting of Centrate on
Dewaterability
Experiments were executed to test the hypothesis that removing cRP would
improve dewaterability. Influent sludge to the lab-scale anaerobic digesters was treated
with acid, centrifuged, and the centrate was decanted and replaced with DI water.
Pretreatment with acid followed by decanting of centrate did not impact dewaterability of
biosolids from South Shore (SS) digesters (Figure 4.3). The average CST of effluent
from steady state acid-treated digesters was lower but not significantly different from that

34
of the control (t-test, p = 0.366). Centrate was decanted to mimic removal of soluble
phosphates, which in this work was qualified as cRP. This step, however, would also
remove other constituents such as soluble anions and cations like sodium and
magnesium. Any effects on dewaterability would have to consider effects of removing
chemical species beyond P. Nevertheless, this step had minimal impact on
dewaterability.
So
uth
Sh
ore
Co
ntr
ol
So
uth
Sh
ore
Acid
0
5 0
1 0 0
1 5 0
2 0 0
CS
T (
se
co
nd
s)
Figure 4.3 Acid pretreatment did not impact dewaterability. Error bars represent
average CST values of South Shore Digesters. Error bars represent ± 1 standard
deviation; n=8
Similarly, pretreatment with acid followed by decanting of centrate did not impact
dewaterability of biosolids from Fond Du Lac (FDL) digesters (Figure 4.4). Again,
average CST of effluent from acid-treated digesters was lower but not significantly

35
different from that of the control (p = 0.456). This trend was observed in both SS and
FDL digesters. Therefore, acid-pretreatment followed by decanting of centrate is not
recommended as an approach to improve downstream dewaterability.
Co
ntr
ol
Acid
Tre
ate
d
0
1 0 0
2 0 0
3 0 0C
ST
(s
ec
on
ds
)
Figure 4.4 Acid pretreatment did not impact dewaterability. Bars represent average
CST values of Fond du Lac Digesters. Error bars represent ± 1 standard deviation; n=12
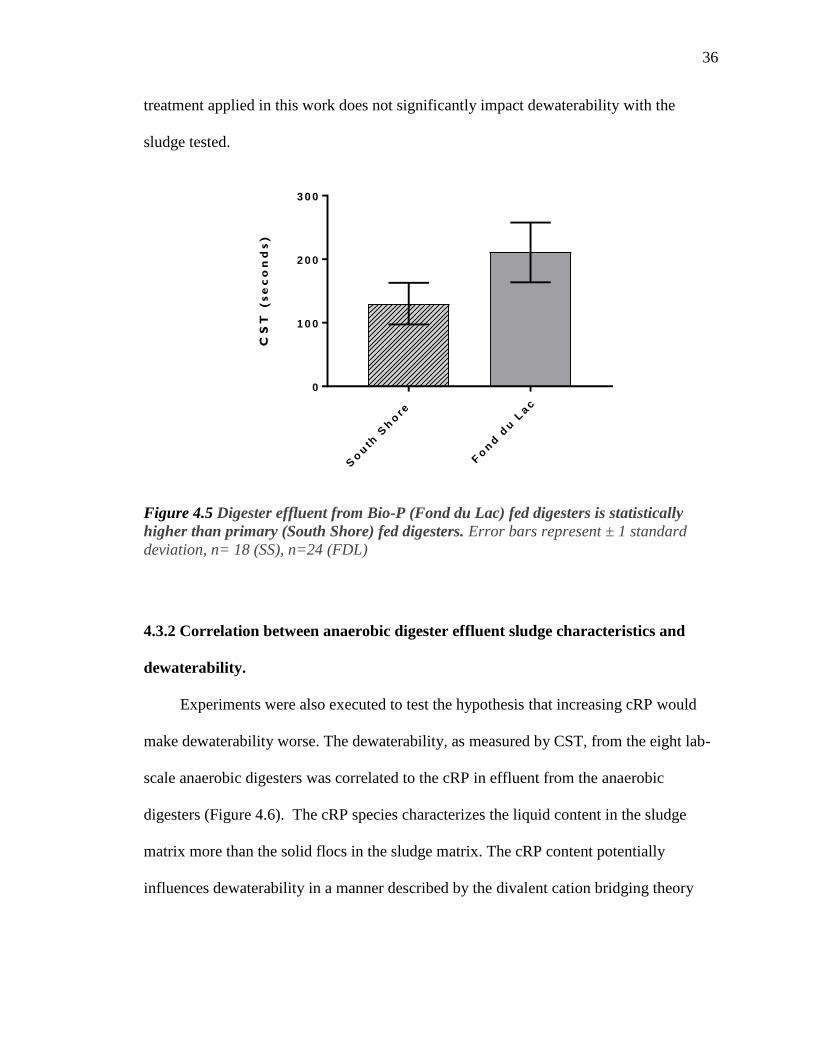
Interestingly, feed sludge type did have an impact on biosolids dewaterability
(Figure 4.5). The average CST values for digesters fed SS sludge were significantly
lower than CST values for digesters fed FDL sludge (p<0.001) These findings are in line
with previously reported results from literature indicating that bio-P sludge is more
difficult to dewater (Roeleveld et al. 2004; Britton et al. 2015). These data indicate there
are inherent characteristics of sludge that influence dewaterability, but the acid pre-
36
treatment applied in this work does not significantly impact dewaterability with the
sludge tested.
So
uth
Sh
ore
Fo
nd
du
Lac
0
1 0 0
2 0 0
3 0 0
CS
T (
se
co
nd
s)
Figure 4.5 Digester effluent from Bio-P (Fond du Lac) fed digesters is statistically
higher than primary (South Shore) fed digesters. Error bars represent ± 1 standard
deviation, n= 18 (SS), n=24 (FDL)
4.3.2 Correlation between anaerobic digester effluent sludge characteristics and
dewaterability.
Experiments were also executed to test the hypothesis that increasing cRP would
make dewaterability worse. The dewaterability, as measured by CST, from the eight lab-
scale anaerobic digesters was correlated to the cRP in effluent from the anaerobic
digesters (Figure 4.6). The cRP species characterizes the liquid content in the sludge
matrix more than the solid flocs in the sludge matrix. The cRP content potentially
influences dewaterability in a manner described by the divalent cation bridging theory
37
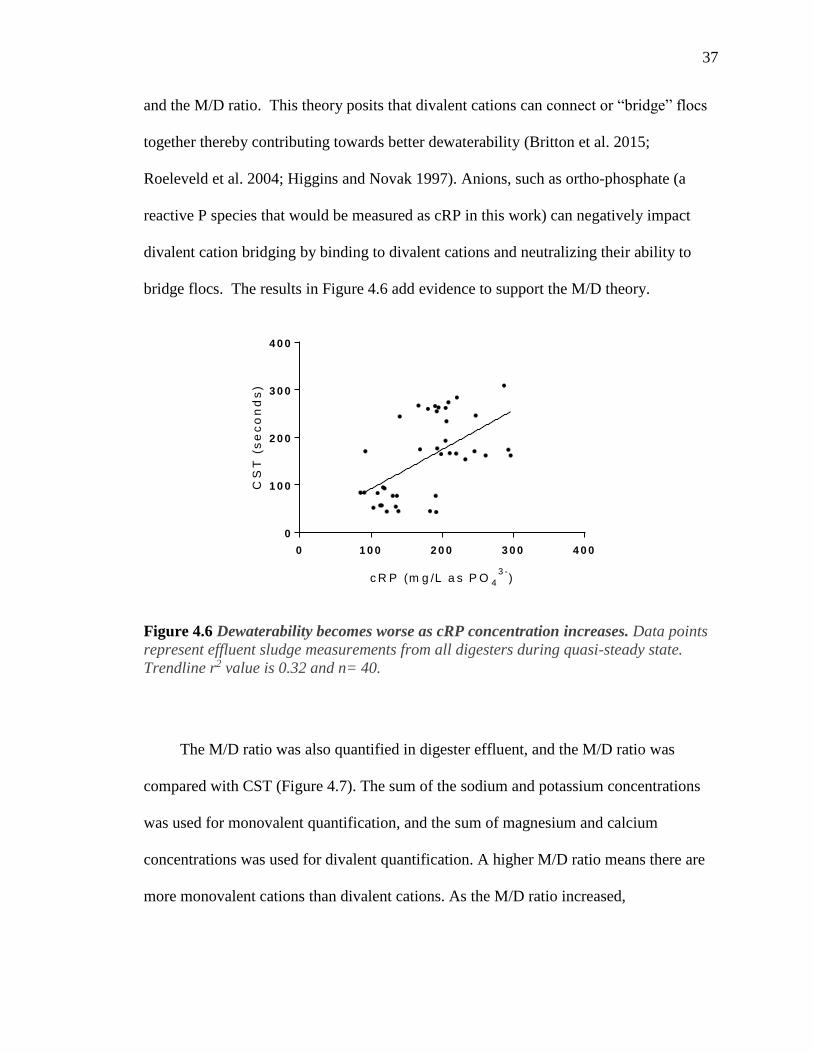
and the M/D ratio. This theory posits that divalent cations can connect or “bridge” flocs
together thereby contributing towards better dewaterability (Britton et al. 2015;
Roeleveld et al. 2004; Higgins and Novak 1997). Anions, such as ortho-phosphate (a
reactive P species that would be measured as cRP in this work) can negatively impact
divalent cation bridging by binding to divalent cations and neutralizing their ability to
bridge flocs. The results in Figure 4.6 add evidence to support the M/D theory.
0 1 0 0 2 0 0 3 0 0 4 0 0
0
1 0 0
2 0 0
3 0 0
4 0 0
c R P (m g /L a s P O 4
3 -)
CS
T (
se
co
nd
s)
Figure 4.6 Dewaterability becomes worse as cRP concentration increases. Data points
represent effluent sludge measurements from all digesters during quasi-steady state.
Trendline r2 value is 0.32 and n= 40.
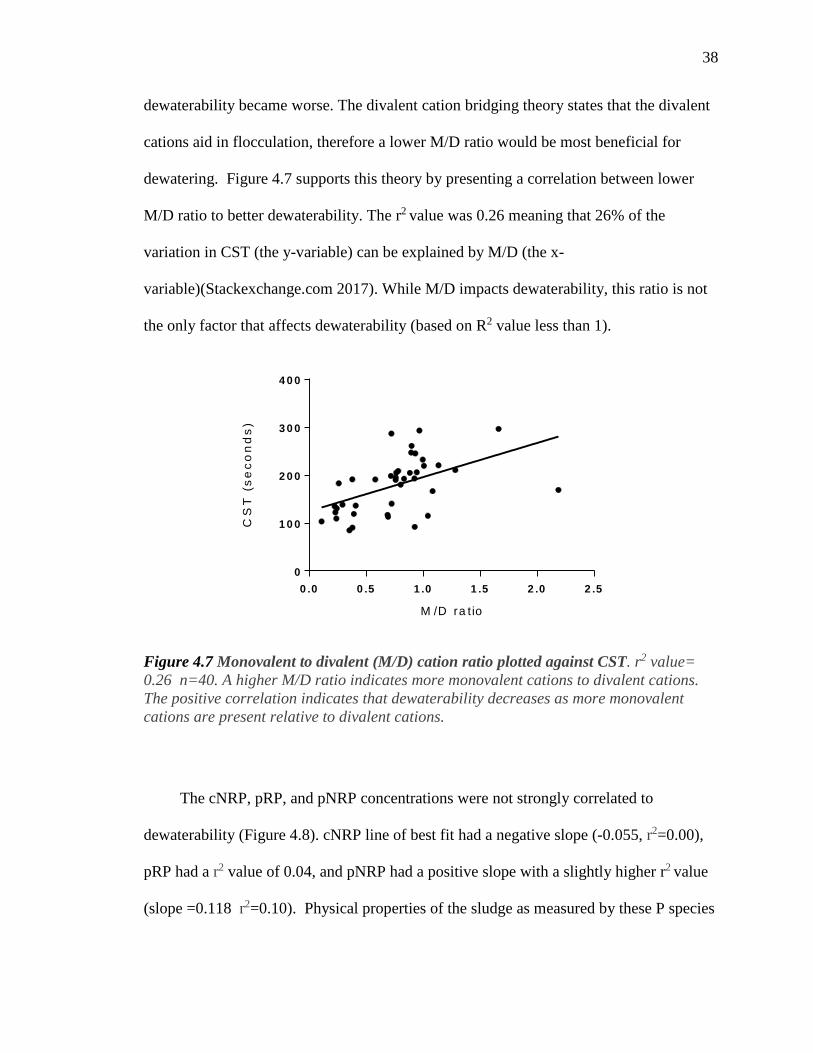
The M/D ratio was also quantified in digester effluent, and the M/D ratio was
compared with CST (Figure 4.7). The sum of the sodium and potassium concentrations
was used for monovalent quantification, and the sum of magnesium and calcium
concentrations was used for divalent quantification. A higher M/D ratio means there are
more monovalent cations than divalent cations. As the M/D ratio increased,
38
dewaterability became worse. The divalent cation bridging theory states that the divalent
cations aid in flocculation, therefore a lower M/D ratio would be most beneficial for
dewatering. Figure 4.7 supports this theory by presenting a correlation between lower
M/D ratio to better dewaterability. The r2 value was 0.26 meaning that 26% of the
variation in CST (the y-variable) can be explained by M/D (the x-
variable)(Stackexchange.com 2017). While M/D impacts dewaterability, this ratio is not
the only factor that affects dewaterability (based on R2 value less than 1).
0 .0 0 .5 1 .0 1 .5 2 .0 2 .5
0
1 0 0
2 0 0
3 0 0
4 0 0
M /D ra t io
CS
T (
se
co
nd
s)
Figure 4.7 Monovalent to divalent (M/D) cation ratio plotted against CST. r2 value=
0.26 n=40. A higher M/D ratio indicates more monovalent cations to divalent cations.
The positive correlation indicates that dewaterability decreases as more monovalent
cations are present relative to divalent cations.
The cNRP, pRP, and pNRP concentrations were not strongly correlated to
dewaterability (Figure 4.8). cNRP line of best fit had a negative slope (-0.055, r2=0.00),
pRP had a r2 value of 0.04, and pNRP had a positive slope with a slightly higher r2 value
(slope =0.118 r2=0.10). Physical properties of the sludge as measured by these P species

39
may not affect dewaterability, while other qualities such as particle size, sludge age, and
EPS could impact dewaterability.
-5 0 0 5 0 1 0 0 1 5 0
0
1 0 0
2 0 0
3 0 0
4 0 0
c N R P (m g /L a s P O 4
3 -)
CS
T (
se
co
nd
s)
0 2 0 0 4 0 0 6 0 0 8 0 0 1 0 0 0 1 2 0 0
0
1 0 0
2 0 0
3 0 0
4 0 0
p R P (m g /L a s P O 4
3 -)
CS
T (
se
co
nd
s)
-2 0 0 0 2 0 0 4 0 0 6 0 0 8 0 0 1 0 0 0
0
1 0 0
2 0 0
3 0 0
4 0 0
p N R P (m g /L a s P O 4
3 -)
CS
T (
se
co
nd
s)
Figure 4.8 cNRP, pRP, and pNRP, plotted against CST. Data points represent effluent
sludge measurements from all digesters during quasi-steady state. Trendline r2 values
0.00, 0.04, and 0.10 respectively. n= 40
Interestingly, pNRP and pRP had higher r2 values with CST of non-digested sludge
samples in the full-scale survey (Section 4.2) than in the lab-scale anaerobic digester
study. The major difference between the full-scale survey and the lab-scale digester
experiments was the type of sludge analyzed, specifically related to if the sludge had
undergone anaerobic digestion. The r2 values from data in Figures 4.6-4.8 was comprised
40
of only anaerobic digested biosolids samples. The full-scale survey was comprised of
sludge samples such as primary or WAS that had not undergone digestion. These two sets
of results reflect comparisons between sludge characteristics and dewaterability on
different types of sludge. Therefore, sludge type, and characteristics not measured in this
work that describes these sludge types such as floc structure could impact dewaterability.
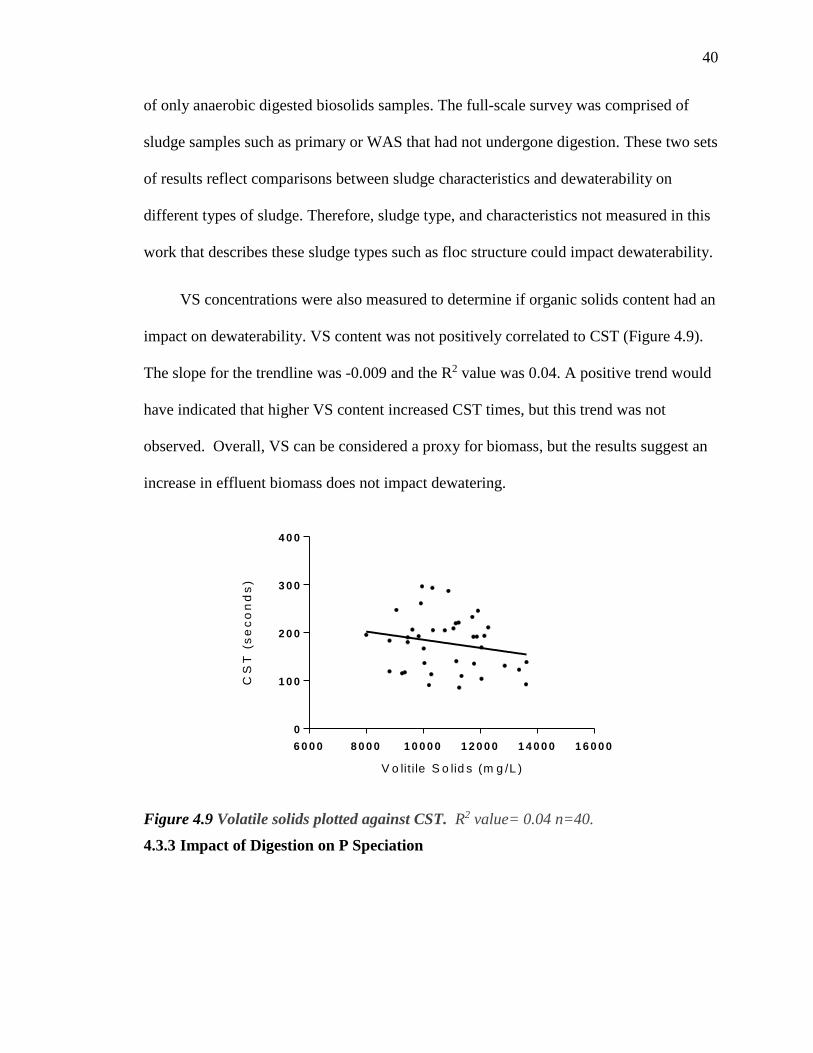
VS concentrations were also measured to determine if organic solids content had an
impact on dewaterability. VS content was not positively correlated to CST (Figure 4.9).
The slope for the trendline was -0.009 and the R2 value was 0.04. A positive trend would
have indicated that higher VS content increased CST times, but this trend was not
observed. Overall, VS can be considered a proxy for biomass, but the results suggest an
increase in effluent biomass does not impact dewatering.
6 0 0 0 8 0 0 0 1 0 0 0 0 1 2 0 0 0 1 4 0 0 0 1 6 0 0 0
0
1 0 0
2 0 0
3 0 0
4 0 0
V o lit ile S o lid s (m g /L )
CS
T (
se
co
nd
s)
Figure 4.9 Volatile solids plotted against CST. R2 value= 0.04 n=40.
4.3.3 Impact of Digestion on P Speciation
41
The third objective of these lab-scale anaerobic digestion experiments was to
determine the effect of digestion on P speciation. Note that the sample size for the
influent was less than the sample size for the effluent because the influent was
characterized and fed to duplicate digesters. Therefore, both duplicates received the same
influent sludge, but each produced independent effluent results.
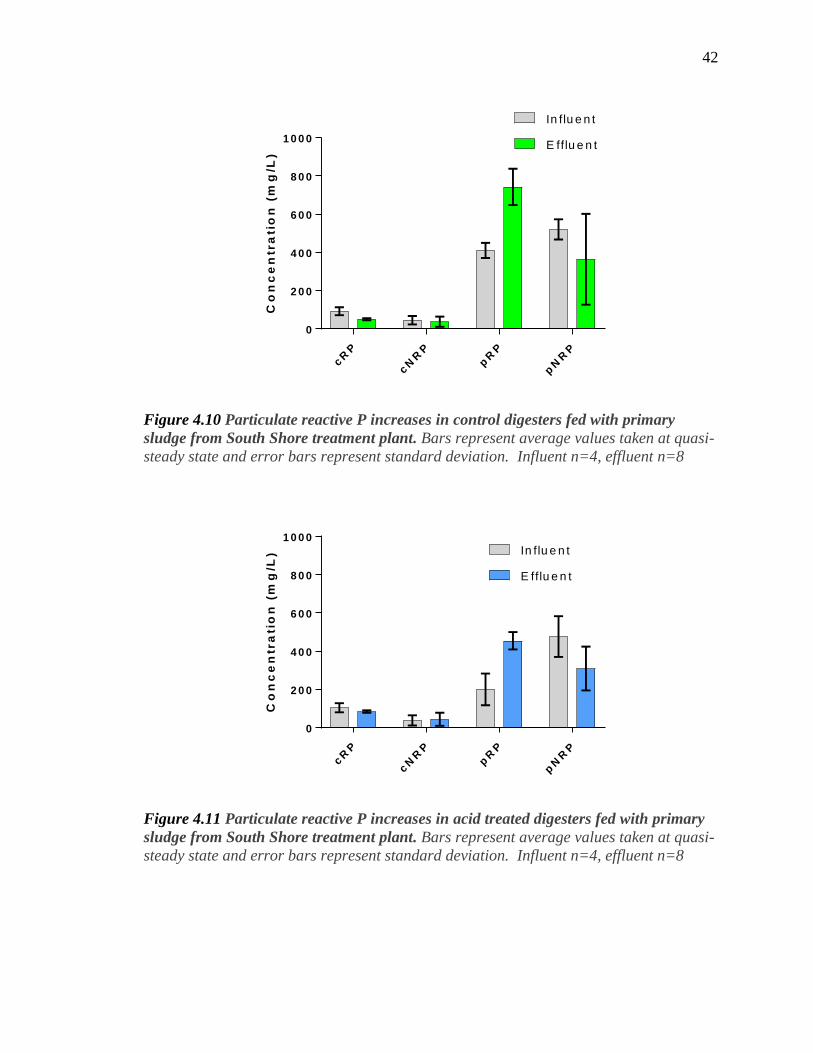
The pRP species increased after digestion in both the SS fed control digesters and
SS acid treated digesters (Figures 4.10 & 4.11, p-value for influent vs effluent in control
and acid digesters = 0.001 and 0.001, respectively). P was ostensibly converted from
pNRP to pRP. In other words, the P converted from a non-reactive form to a reactive
form. Reactive forms of P are chemically reactive (ortho-phosphate) and can interact
with cations. Non-reactive forms of P are P in forms that do not chemically react and
need to be digested with acid and heat to be measured by the method employed herein.
The increased pRP in effluent could be struvite, brushite, or could indicate biomass
destruction in digester (Poxon and Darby 1997)
42
cR
P
cN
RP
pR
P
pN
RP
0
2 0 0
4 0 0
6 0 0
8 0 0
1 0 0 0
Co
nc
en
tra
tio
n (
mg
/L)
In flu e n t
E fflu e n t
Figure 4.10 Particulate reactive P increases in control digesters fed with primary
sludge from South Shore treatment plant. Bars represent average values taken at quasi-
steady state and error bars represent standard deviation. Influent n=4, effluent n=8
cR
P
cN
RP
pR
P
pN
RP
0
2 0 0
4 0 0
6 0 0
8 0 0
1 0 0 0
Co
nc
en
tra
tio
n (
mg
/L) In flu e n t
E fflu e n t
Figure 4.11 Particulate reactive P increases in acid treated digesters fed with primary
sludge from South Shore treatment plant. Bars represent average values taken at quasi-
steady state and error bars represent standard deviation. Influent n=4, effluent n=8

43
Unlike digesters fed SS sludge, the biggest change for the digesters fed FDL sludge
for P speciation was from high cRP in the influent to high pRP in the effluent. In contrast
to the primary-fed digesters, cRP decreased after digestion in the FDL fed control and
acid digesters (Figures 4.12, 4.13. FC p=0.001, FA p=0.002). P was converted from a
centrate form to a non-centrate form during digestion. It is possible that P was used for
growth of anaerobic microbial biomass or used to create EPS by the microbes. Another
possibility was that struvite or brushite was formed (Guibaud et al. 2005). Phosphorus
accumulating organisms in Bio-P sludge accumulate high amounts of P as polyphosphate
and release P as ortho-P, this behavior could explain the elevated cRP levels observed
and the higher overall P levels in the FDL sludge(Bi, Guo, and Chen 2013).
cR
P
cN
RP
pR
P
pN
RP
0
5 0 0
1 0 0 0
1 5 0 0
Co
nc
en
tra
tio
n (
mg
/L)
In flu e n t
E fflu e n t
Figure 4.12 Particulate reactive P increases in control digesters fed with Fond du Lac
sludge. Bars represent average values taken at quasi-steady state and error bars
represent standard deviation. Influent n=5, effluent n=12

44
cR
P
cN
RP
pR
P
pN
RP
0
2 0 0
4 0 0
6 0 0
8 0 0
Co
nc
en
tra
tio
n (
mg
/L)
In flu e n t
E fflu e n t
Figure 4.13 Particulate reactive P increases in acid treated digesters fed with Fond du
Lac sludge. Bars represent average values taken at quasi-steady state and error bars
represent standard deviation. Influent n=5, effluent n=12
5 CONCLUSIONS
The goal of this research was to investigate the impact of P speciation in various
sludges on dewaterability and to determine if an anaerobic digestion pretreatment method
to reduce P content could improve dewaterability. It is not clearly understood why bio-P
sludges are observed to have poorer dewaterability. A more detailed understanding of the
speciation of P in raw sludge is necessary to understand what pre-treatment technologies
would be most effective at converting P to a recoverable form. These conclusions are
based on the experiments performed at the Marquette University Water Quality Center:
1. Particulate P speciation had r2 values of 0.81 and 0.94 for CST of raw
wastewater sludges. These results imply that solids concentration is correlated

45
with poorer dewatering. Further work should be done to determine if other
sludge characteristics correlate to dewaterability for these sludge types, or if
particulate P is the dominant characteristic impacting dewaterability..
2. Acid pre-treatment of sludge was conducted in attempt to remove soluble
reactive P. However, the method conducted for P removal allowed for cation
removal as well. If future work were to be completed, development of a
method to selectively remove P without affecting cations would provide a
clearer understanding of the effects P has on dewaterability.
3. Acid pretreatment and decanting did not significantly influence the
dewaterability of digested sludge. The sludge used for this experiment was a
primary and WAS blend, and perhaps the effects of P removal could have
been more pronounced if complete bio-P sludge with more total P was
characterized and treated.
4. Anaerobic digestion resulted in the conversion of centrate P to particulate
reactive phosphorus. Further work could be done to investigate the chemical
nature of the particulate reactive P. Knowledge on whether struvite was
formed would be helpful for solids handling design.

46
BIBLIOGRAPHY
Appels, Lise, Jan Baeyens, Jan Degrève, and Raf Dewil. 2008. “Principles and Potential
of the Anaerobic Digestion of Waste-Activated Sludge.” Progress in Energy and
Combustion Science 34 (6): 755–81. doi:10.1016/j.pecs.2008.06.002.
Barnard, J L, and G Shimp. 2013. “The Impact of Biological Phosphorus Removal on
Biosolids Dewatering.” WEF/IWA Nutrient Removal and Recovery 2013, 5668–85.
Batstone, DJ, P. Darvodelsky, and J. Keller. 2014. “Trends in Biosolids Handling
Technologies : Economics and Environmental Factors,” no. 6.
Bi, Dongsu, Xiaopin Guo, and Donghui Chen. 2013. “Phosphorus Release Mechanisms
during Digestion of EBPR Sludge under Anaerobic, Anoxic and Aerobic
Conditions.” Water Science and Technology 67 (9): 1953–59.
doi:10.2166/wst.2013.045.
Britton, Ahren;, Steve; Wirtel, Ram; Prasad, and Nate Turner. 2015. “Industry Update for
WASSTRIP® Impacts on Nutrient Flows, Digestion and Dewatering of EBPR
Solids.” In , 1–10.
Costerton, J W, and R T Irvin. 1981. “THE BACTERIAL GLYCOCALYX IN NATURE
AND DISEASE.” Annual Reviews in Microbiology 35 (1): 299–324.
Doyle, James D., and Simon A. Parsons. 2002. “Struvite Formation, Control and
Recovery.” Water Research 36 (16): 3925–40. doi:10.1016/S0043-1354(02)00126-
4.
Dueñas, Joel Fernández, Josep Ribas Alonso, Àngel Freixó Rey, and Antoni Sánchez
Ferrer. 2003. “Characterisation of Phosphorous Forms in Wastewater Treatment
Plants.” Journal of Hazardous Materials 97 (1): 193–205. doi:10.1016/S0304-
3894(02)00260-1.
Edwards, Joel, Maazuza Othman, and Stewart Burn. 2015. “A Review of Policy Drivers
and Barriers for the Use of Anaerobic Digestion in Europe, the United States and
Australia.” Renewable and Sustainable Energy Reviews 52. Elsevier: 815–28.
doi:10.1016/j.rser.2015.07.112.
Filali, Ahlem, Angéla Mañas, Myriam Mercade, Yolaine Bessière, Béatrice Biscans, and
Mathieu Spérandio. 2012. “Stability and Performance of Two GSBR Operated in
Alternating Anoxic/aerobic or Anaerobic/aerobic Conditions for Nutrient Removal.”
Biochemical Engineering Journal 67: 10–19. doi:10.1016/j.bej.2012.05.001.
Guibaud, Gilles, Sophie Comte, François Bordas, Sèverine Dupuy, and Michel Baudu.
2005. “Comparison of the Complexation Potential of Extracellular Polymeric
Substances (EPS), Extracted from Activated Sludges and Produced by Pure Bacteria

47
Strains, for Cadmium, Lead and Nickel.” Chemosphere 59 (5): 629–38.
doi:10.1016/j.chemosphere.2004.10.028.
Higgins, M, Charles Bott, Peter Schauer, and Steven Beightol. 2014. “Does Bio-P Impact
Dewatering after Anaerobic Digestion? Yes, and Not in a Good Way! Matthew
Higgins, Bucknell University, Charles Bott, Hampton Roads Sanitation District,
Peter Schauer, Clean Water Services, Steven Beightol, Bucknell University.” In
Proceedings of the Water Environment Federation, Residuals and Biosolids 2014,
2:1–11.
Higgins, M, and John T Novak. 1997. “Characterization of Exocellular Protein and Its
Role in Bioflocculation” 123 (May): 479–85.
Higgins, Matthew J., and John T. Novak. 1997. “The Effect of Cations on the Settling
and Dewatering of Activated Sludges: Laboratory Results.” Water Environment
Research 69 (2): 215–24. doi:10.2175/106143097X125371.
Higgins, Matthew J., Lou Ann Tom, and David C. Sobeck. 2004. “Case Study I:
Application of the Divalent Cation Bridging Theory to Improve Biofloc Properties
and Industrial Activated Sludge System Performance—direct Addition Of Divalent
Cations.” Water Environment Research 76 (4): 344–52.
doi:10.2175/106143004X141933.
Houghton, J. I., J. Quarmby, and T. Stephenson. 2001. “Municipal Wastewater Sludge
Dewaterability and the Presence of Microbial Extracellular Polymer.” Water Science
and Technology 44 (2–3): 373–79.
Huang, Xiao-lan, Yona Chen, and Moshe Shenker. 2006. “Chemical Fractionation of
Phosphorus in Stabilized Biosolids,” 1949–58. doi:10.2134/jeq2007.0220.
Jin, Bo, Britt Marie Wilén, and Paul Lant. 2004. “Impacts of Morphological, Physical
and Chemical Properties of Sludge Flocs on Dewaterability of Activated Sludge.”
Chemical Engineering Journal 98 (1–2): 115–26. doi:10.1016/j.cej.2003.05.002.
Lawler, Desmond, Yoon Jin Chung, Shiaw-Jy Hwang, Barbara Hull, Yoon Jin Chung,
Shiaw-Jy Hwang, and Barbara Hull. 1986. “Anaerobic Digestion: Effects on Particle
Size and Dewaterability.” Water Pollution Control Federation 58 (12): 1107–17.
Lima, Cláudio Antonio Andrade, Rogers Ribeiro, Eugenio Foresti, and Marcelo Zaiat.
2005. “Morphological Study of Biomass during the Start-up Period of a Fixed-Bed
Anaerobic Reactor Treating Domestic Sewage.” Brazilian Archives of Biology and
Technology 48 (5): 841–49. doi:10.1590/S1516-89132005000600020.
Mayer, Brooke K., Daniel Gerrity, Bruce E. Rittmann, Daniel Reisinger, and Sherry
Brandt-Williams. 2013. “Innovative Strategies to Achieve Low Total Phosphorus
Concentrations in High Water Flows.” Critical Reviews in Environmental Science

48
and Technology 43 (4): 409–41. doi:10.1080/10643389.2011.604262.
McNamara, Patrick J., and Desmond F. Lawler. 2008. “A Comprehensive Study to
Reduce Polymer Usage at Austin’s Biosolids Management Plant,” 1–68.
Moore, George T. 2010. “Nutrient Control Design Manual.” Cincinnati, Ohio, 45268.
Neyens, E., and J. Baeyens. 2003. “A Review of Thermal Sludge Pre-Treatment
Processes to Improve Dewaterability.” Journal of Hazardous Materials 98 (1–3):
51–67. doi:10.1016/S0304-3894(02)00320-5.
Neyens, Elisabeth, Jan Baeyens, Raf Dewil, and Bart De Heyder. 2004. “Advanced
Sludge Treatment Affects Extracellular Polymeric Substances to Improve Activated
Sludge Dewatering.” Journal of Hazardous Materials 106 (2–3): 83–92.
doi:10.1016/j.jhazmat.2003.11.014.
Novak, John, Matthew J. Higgins, George Sprouse, Esther Rus Perez, and J D Nicholson.
2017. “The Science, Engineering, and Unknowns of Dewatering.” In , 100. Water
Environment Federation.
Park, Chul. 2007. “Extracellular Polymeric Substances in Activated Sludge Flocs:
Extraction, Identification, and Investigation of Their Link with Cations and Fate in
Sludge Digestion.” Virginia Polytechnic Institute and State University.
doi:10.1017/CBO9781107415324.004.
Popel, H. J., and N. Jardin. 1993. “Influence of Enhanced Biological Phosphorus
Removal on Sludge Treatment.” Water Science and Technology 28 (1): 263–71.
Poxon, Theresa L., and Jeannie L. Darby. 1997. “Extracellular Polyanions in Digested
Sludge: Measurement and Relationship to Sludge Dewaterability.” Water Research
31 (4): 749–58. doi:10.1016/S0043-1354(96)00319-3.
Reynolds, Tom D., and Paul A. Richards. 1996. Unit Operations and Processes in
Environmental Engineering. 2nded. PWS Publishing Company.
https://books.google.com/books/about/Unit_Operations_and_Processes_in_Environ.
html?id=9oViQgAACAAJ.
Rice, E.W., R.B. Baird, A.D. Eaton, and L.S. Clesceri. 2012. Standard Methods for the
Examination of Water and Wastewater. 22nded. American Public Health
Association, American Water Works Association, Water Environment Federation.
Roeleveld, Paul, P. Loeffen, H. Temmink, and Bram Klapwijk. 2004. “Dutch Analysis
for P-Recovery from Municipal Wastewater.” Water Science and Technology 49
(10): 191–99.
SHAO, Liming, Peipei HE, Guanghui YU, and Pinjing HE. 2009. “Effect of Proteins,

49
Polysaccharides, and Particle Sizes on Sludge Dewaterability.” Journal of
Environmental Sciences 21 (1). The Research Centre for Eco-Environmental
Sciences, Chinese Academy of Sciences: 83–88. doi:10.1016/S1001-
0742(09)60015-2.
“Stackexchange.com.” 2017. Stack Exchange.
https://stats.stackexchange.com/questions/32464/how-does-the-correlation-
coefficient-differ-from-regression-slope.
Tchobanoglous, George, Franklin L Burton, David H Stensel, and Inc Metcalf and Eddy.
2003. Wastewater Engineering: Treatment and Reuse. Wastewater Engineering.
Illustrate. McGraw-Hill Education. doi:10.1016/0309-1708(80)90067-6.
U.S. Environmental Protection Agency. 1999. “Biosolids Generation , Use , and Disposal
in The United States.” Washington, DC 20460.
Venkiteshwaran, Kaushik. 2010. “Improving Methane Production Form a Two Stage
Anarobic Digestion Process for Dairy Manure by Adding Cheese Whey as a Co-
Substrate.” Clarkson University.
Wisconsin DNR. 2010. “Effluent Standards And Limitations For Phosphorus.” US.

50
APPENDIX
A: Results from Pre-treatment testing
C A O H 1 3 5 M E Q / L
C A O H I N F L U E N T
C A O H 2 7 0 M E Q / L
C A O H I N F L U E N T
N A O H 1 4 0 M E Q / L
N A O H I N F L U E N T
N A O H 2 7 0 M E Q / L
N A O H I N F L U E N T
S U L F U R I C A C I D 9 0 M E Q / L
S U L F U R I C A C I D I N F L U E N T
S U L F U R I C A C I D 1 8 0 M E Q / L
S U L F U R I C A C I D I N F L U E N T
B L E N D E R
B L E N D E R I N F L U E N T
RESULTS OF VARIOUS PRETREATMENT PROCESSES
Reactive Soluble Non-reactive Soluble Reactive Solid Non-reactive Solid
51
B: Average, Standard Deviation, and Relative Standard Deviation Data for P Species
from Triplicate Tests on Sludge Samples from Full-Scale WRRFs
Code Location
FC Fond du Lac Bio-P and primary blend
FA Fond du Lac acid treated Bio-P and primary blend
SC South Shore Primary
SA South Shore acid treated primary
FM Fond du Lac mesophillic digester effluent
FT Fond do Lac Thermophillic digester effluent
GB UTP Green Bay unthickened primary sludge
GB TP Green Bay thickened primary sludge
GB C Green Bay combined WAS and primary
SW South Shore WAS
CB Chicago combined WAS and primary
--inf indicates samples used as digester influent
--eff indicates samples used as digester effluent
Average & standard Deviation Relative Standard Deviation
cRP cNRP pRP pNRP Total cRP cNRP pRP pNRP Total
782 ± 2 -15 ± 19 126 ± 15 757 ± 70 1650 ± 77 0% -128% 12% 9% 5% 557 ± 3 67 ± 6 31 ± 15 657 ± 41 1311 ± 33 0% 10% 48% 6% 3% 97 ± 0 39 ± 3 375 ± 12 482 ± 17 993 ± 9 0% 8% 3% 3% 1% 115 ± 0 15 ± 4 230 ± 9 372 ± 83 733 ± 82 0% 29% 4% 22% 11% 166 ± 2 18 ± 4 931 ± 7 630 ± 14 1745 ± 22 1% 24% 1% 2% 1% 162 ± 1 28 ± 5 963 ± 7 548 ± 46 1701 ± 52 1% 17% 1% 8% 3% 234 ± 3 64 ± 1 486 ± 54 482 ± 64 1265 ± 11 1% 1% 11% 13% 1% 246 ± 2 40 ± 5 563 ± 12 360 ± 23 1209 ± 9 1% 12% 2% 7% 1% 71 ± 1 26 ± 1 804 ± 75 386 ± 147 1287 ± 77 2% 4% 9% 38% 6% 64 ± 1 23 ± 4 619 ± 28 489 ± 32 1196 ± 2 2% 16% 4% 6% 0% 101 ± 2 30 ± 3 493 ± 17 292 ± 23 916 ± 8 2% 9% 4% 8% 1% 179 ± 2 -48 ± 1 444 ± 24 361 ± 27 936 ± 4 1% -3% 5% 7% 0% 305 ± 264 264 ±
266
416 ±
254
423 ± 253 1407 ± 10 87% 101% 61% 60% 1%
76 ± 0 23 ± 2 238 ± 9 293 ± 54 630 ± 46 1% 7% 4% 19% 7% 52 ± 1 25 ± 1 165 ± 12 264 ± 11 506 ± 4 1% 5% 7% 4% 1% 511 ± 4 119 ± 8 353 ± 3 530 ± 17 1513 ± 16 1% 7% 1% 3% 1% 232 ± 12 168 ± 18 675 ± 6 53 ± 6 1129 ± 1 5% 11% 1% 11% 0%

52
60 ± 1 17 ± 3 342 ± 37 665 ± 116 1084 ± 151
1% 17% 11% 17% 14%
65 ± 0 23 ± 2 161 ± 9 312 ± 17 560 ± 26 1% 8% 6% 5% 5% 566 ± 15 29 ± 10 374 ± 39 820 ± 61 1789 ± 94 3% 34% 11% 7% 5% 432 ± 20 20 ± 28 238 ± 39 465 ± 35 1155 ± 17 5% 139% 17% 7% 1% 96 ± 6 29 ± 7 269 ± 30 374 ± 20 767 ± 11 6% 24% 11% 5% 1% 125 ± 4 6 ± 5 200 ± 32 224 ± 25 556 ± 9 3% 85% 16% 11% 2% 508 ± 2 57 ± 8 254 ± 21 431 ± 37 1250 ± 41 0% 13% 8% 9% 3% 91 ± 2 23 ± 2 1028 ± 4 394 ± 12 1535 ± 9 2% 7% 0% 3% 1% 425 ± 547 -295 ±
548
666 ±
544
581 ± 535 1376 ± 15 129% -186% 82% 92% 1%
897 ± 3 -32 ± 12 163 ± 31 1664 ± 55 2691 ± 28 0% -38% 19% 3% 1% 1 ± 0 51 ± 1 544 ± 13 383 ± 9 979 ± 12 65% 3% 2% 2% 1% 850 ± 10 138 ± 19 99 ± 18 311 ± 1229 1398 ±
1211 1% 13% 18% 396% 87%
660 ± 9 111 ± 15 109 ± 18 716 ± 21 1596 ± 36 1% 14% 17% 3% 2%
2 ± 0 5 ± 1 17 ± 2 36 ± 4 59 ± 4 25% 23% 10% 11% 6% 12 ± 1 11 ± 1 72 ± 9 289 ± 38 383 ± 33 11% 10% 12% 13% 9% 105 ± 2 35 ± 2 1023 ±
57
2027 ± 71 3190 ±
125 2% 7% 6% 4% 4%
718 ± 33 59 ± 28 342 ± 49 1016 ± 37 2135 ± 29 5% 47% 14% 4% 1% 80 ± 0 38 ± 2 529 ± 56 755 ± 138 1402 ±
147 0% 6% 11% 18% 10%
4 ± 1 20 ± 1 120 ± 11 420 ± 20 565 ± 11 25% 3% 9% 5% 2% 730 ± 5 59 ± 7 708 ± 25 1086 ± 89 2583 ± 88 1% 11% 4% 8% 3% 362 ± 2 105 ± 7 498 ± 5 834 ± 145 1799 ±
138 1% 7% 1% 17% 8%

53
C: cRP vs CST scatter plot
0 5 0 1 0 0 1 5 0 2 0 0 2 5 0
0
2 0 0
4 0 0
6 0 0
8 0 0
c R P (m g /L a s P O 4
3 -)
CS
T (
se
co
nd
s)

54
D: Time series of P Species for Every Digester
1 0 2 0 3 0 4 0 5 0 6 0 7 0
-5 0 0
0
5 0 0
1 0 0 0
1 5 0 0
2 0 0 0
D a y s O p e ra te d
P c
on
ce
ntr
ati
on
(m
g/L
as
PO
4
3- )
Ic R P
Ic N R P
Ip R P
Ip N R P
I T o ta l P
E c R P
E c N R P
E p R P
E p N R P
E T o ta l P
1 0 2 0 3 0 4 0 5 0 6 0 7 0
-5 0 0
0
5 0 0
1 0 0 0
1 5 0 0
2 0 0 0
D a y s O p e ra te d
P c
on
ce
ntr
ati
on
(m
g/L
as
PO
4
3- )
Ic R P
Ic N R P
Ip R P
Ip N R P
I T o ta l P
E c R P
E c N R P
E p R P
E p N R P
E T o ta l P
Digesters FC1 and FC2 (Top and bottom respectively), ExXX stands for effluent
species, IxXX stands for influent species

55
1 0 2 0 3 0 4 0 5 0 6 0 7 0
-5 0 0
0
5 0 0
1 0 0 0
1 5 0 0
2 0 0 0
D a y s O p e ra te d
P c
on
ce
ntr
ati
on
(m
g/L
as
PO
4
3- )
Ic R P
Ic N R P
Ip R P
Ip N R P
I T o ta l P
E c R P
E c N R P
E p R P
E p N R P
E T o ta l P
1 0 2 0 3 0 4 0 5 0 6 0 7 0
-5 0 0
0
5 0 0
1 0 0 0
1 5 0 0
2 0 0 0
D a y s O p e ra te d
P c
on
ce
ntr
ati
on
(m
g/L
as
PO
4
3- )
Ic R P
Ic N R P
Ip R P
Ip N R P
I T o ta l P
E c R P
E c N R P
E p R P
E p N R P
E T o ta l P
Digesters FA1 and FA2, ExXX stands for effluent species, IxXX stands for influent
species

56
1 0 2 0 3 0 4 0 5 0 6 0 7 0
-5 0 0
0
5 0 0
1 0 0 0
1 5 0 0
2 0 0 0
D a y s O p e ra te d
P c
on
ce
ntr
ati
on
(m
g/L
as
PO
4
3- )
Ic R P
Ic N R P
Ip R P
Ip N R P
I T o ta l P
E c R P
E c N R P
E p R P
E p N R P
E T o ta l P
1 0 2 0 3 0 4 0 5 0 6 0 7 0
-5 0 0
0
5 0 0
1 0 0 0
1 5 0 0
2 0 0 0
D a y s O p e ra te d
P c
on
ce
ntr
ati
on
(m
g/L
as
PO
4
3- )
Ic R P
Ic N R P
Ip R P
Ip N R P
I T o ta l P
E c R P
E c N R P
E p R P
E p N R P
E T o ta l P
SC1 and SC2, ExXX stands for effluent species, IxXX stands for influent species

57
1 0 2 0 3 0 4 0 5 0 6 0 7 0
-5 0 0
0
5 0 0
1 0 0 0
1 5 0 0
2 0 0 0
D a y s O p e ra te d
P c
on
ce
ntr
ati
on
(m
g/L
as
PO
4
3- )
Ic R P
Ic N R P
Ip R P
Ip N R P
I T o ta l P
E c R P
E c N R P
E p R P
E p N R P
E T o ta l P
1 0 2 0 3 0 4 0 5 0 6 0 7 0
-5 0 0
0
5 0 0
1 0 0 0
1 5 0 0
2 0 0 0
D a y s O p e ra te d
P c
on
ce
ntr
ati
on
(m
g/L
as
PO
4
3- )
Ic R P
Ic N R P
Ip R P
Ip N R P
I T o ta l P
E c R P
E c N R P
E p R P
E p N R P
E T o ta l P
SA1 and SA2, ExXX stands for effluent species, IxXX stands for influent species