chemical pretreatment and dewaterability of aanaerobically
TRANSCRIPT

Marquette University Marquette University
e-Publications@Marquette e-Publications@Marquette
Master's Theses (2009 -) Dissertations, Theses, and Professional Projects
Chemical Pretreatment and Dewaterability of Aanaerobically Chemical Pretreatment and Dewaterability of Aanaerobically
Digested Bio-P Biosolids Digested Bio-P Biosolids
Eileen Margaret Kennedy Marquette University
Follow this and additional works at: https://epublications.marquette.edu/theses_open
Part of the Engineering Commons
Recommended Citation Recommended Citation Kennedy, Eileen Margaret, "Chemical Pretreatment and Dewaterability of Aanaerobically Digested Bio-P Biosolids" (2019). Master's Theses (2009 -). 568. https://epublications.marquette.edu/theses_open/568

CHEMICAL PRETREATMENT AND DEWATERABILITY OF ANAEROBICALLY
DIGESTED BIO-P BIOSOLIDS
by
Eileen M. Kennedy
A Thesis submitted to the Faculty of the Graduate School,
Marquette University,
in Partial Fulfillment of the Requirements for
the Degree of Master of Science
Milwaukee, Wisconsin
December 2019
ABSTRACT
CHEMICAL PRETREATMENT AND DEWATERABILITY OF ANAEROBICALLY
DIGESTED BIO-P BIOSOLIDS
Eileen M. Kennedy
Marquette University, 2019
Phosphorous (P) effluent regulations from water resource recovery facilities (WRRFs)
have become more stringent to reduce the damage of eutrophication caused by excess
amounts of P. Enhanced biological phosphorus removal (EBPR) is a popular method to
help comply with these regulations combined with other practices such as filtration.
However, the sludges from facilities that employ EBPR (bio-P sludges) are difficult to
dewater and require more polymer than conventional sludge, thereby increasing the cost
of solids handling at these facilities. The monovalent to divalent (M/D) cation ratio,
which is important in dewatering, is reportedly altered during the EBPR process. P
speciation has also been suggested to affect dewaterability. Dewaterability is defined as
the ease of separating water from the solids and was quantified by capillary suction time
(CST). Yet, it is not well understood how the M/D cation ratio or P speciation correlate to
dewaterability for different types of biosolids. Laboratory experiments were conducted in
the Water Quality Center at Marquette University to meet the following objectives: i)
determine the effects of the addition of different cations at various doses on
dewaterability as CST of non-digested sludges, ii) determine how the M/D cation ratio is
correlated to dewaterability as CST for various digested biosolids, and iii) determine if
the alteration of P speciation correlates to dewaterability as CST for various biosolids.
Batch studies were performed on primary and bio-P sludge to evaluate the effects of the
addition of different chemicals on CST and P speciation. Using results from the batch
study, a chemical pretreatment was chosen to be implemented in a lab-scale anaerobic
digestion study because it improved the dewaterability of the primary and bio-P sludges.
The pretreatment chosen was an addition of 200 meq/L calcium hydroxide followed by
the addition of hydrochloric acid for pH adjustment. Lab-scale anaerobic digesters were
fed with the chemically pretreated sludge to determine how altering the M/D cation ratio
and P speciation affected dewaterability as CST. The pretreatment significantly improved
the CST of the bio-P anaerobically digested biosolids relative to the control digesters but
had little to negative effect on the digested primary biosolids. The chemical pretreatment
decreased the M/D cation ratios for both types of biosolids, but the pretreatment had a
positive correlation with CST for only the bio-P biosolids. Interestingly, these results
reveal that the M/D ratio might not universally affect dewaterability as CST for all
sludges and biosolids. P speciation may also play a role in dewaterability as CST. Higher
amounts of particulate P improved the CST of the bio-P biosolids, but again, this was
opposite for the primary biosolids. The role of specific P species on dewaterability as
CST requires further investigation.

i
ACKNOWLEDGEMENTS
Eileen M. Kennedy
I would like to thank the Water Equipment and Policy (WEP) Center for funding
and support of this research. I would also like to thank the WEP member facilities of
South Shore Water Reclamation Facility and Fond du Lac Wastewater Treatment &
Resource Recovery Facility for providing samples so this study may be completed. I
would like to thank Mike Dollhopf, the lab director at the Water Quality Center at
Marquette University where this study was conducted, for his help. I would also like to
thank Kaushik Venkiteshwaran, Nick Benn and Saba Seyedi for the support and
knowledge. A special thanks to Viviana Sanchez for her help with experimentation and
understanding throughout this study. I would like to thank my committee members, Dr.
Daniel Zitomer and Dr. Brooke Mayer for their help in supporting and reviewing my
thesis. I would like to especially thank my advisor Dr. Patrick McNamara for his
knowledgeable guidance and support in my endeavors.

ii
DEDICATION
I would like to dedicate this thesis to my family for their continuous support
throughout my life, and to my friends whose encouragement gives me strength every day.

iii
TABLE OF CONTENTS
ACKNOWLEDGEMENTS ................................................................................................. I
DEDICATION .................................................................................................................... II
LIST OF TABLES ............................................................................................................. V
LIST OF FIGURES .......................................................................................................... VI
1 INTRODUCTION ........................................................................................................... 1
1.1 Motivation ......................................................................................................... 1
1.2 Objectives ......................................................................................................... 2
1.3 Approach ........................................................................................................... 3
1.4 Thesis Structure ................................................................................................ 4
2 LITERATURE REVIEW ................................................................................................ 5
2.1 General Goals of Biosolids Dewatering ........................................................... 5
2.2 Wastewater Solids Characteristics that Affect Dewaterability ......................... 6
2.2.1 Monovalent to Divalent (M/D) Cation Ratio ..................................... 6
2.2.2 Floc Structure ..................................................................................... 6
2.2.3 Phosphorus Speciation ....................................................................... 8
2.3 Impacts of Enhanced Biological Phosphorus Removal (EBPR) on
Dewaterability ......................................................................................................... 9
2.4 Alkaline Pre-Treatment to Improve Dewaterability ......................................... 9
2.5 Summary of Research Needs .......................................................................... 10

iv
3 METHODOLOGY ........................................................................................................ 12
3.1 Batch Studies to Assess Impacts of Chemical Pretreatments on
Dewaterability as Capillary Suction Time ............................................................ 12
3.1.1 Capillary Suction Time (CST) for Dewatering ................................ 13
3.2 Anaerobic Digester Lab-Scale Experiments ................................................... 14
3.2.1 Purpose of Experiments ................................................................... 14
3.2.2 Influent Sludge Sources ................................................................... 15
3.2.3 Digester Set Up & Operation ........................................................... 16
3.2.4 Statistical Analyses .......................................................................... 20
4 RESULTS & DISCUSSION................................................................................. 22
4.1 Preliminary Batch Capillary Suction Time Results ........................................ 22
4.2 Digester Health & Performance ...................................................................... 24
4.3 Capillary Suction Time of Effluent Biosolids from Bench Scale Digesters ... 28
4.4 Bench Scale Digesters: Sludge Characteristics............................................... 31
5 CONCLUSIONS................................................................................................... 38
BIBLIOGRAPHY ............................................................................................................. 40
APPENDIX ....................................................................................................................... 43
v
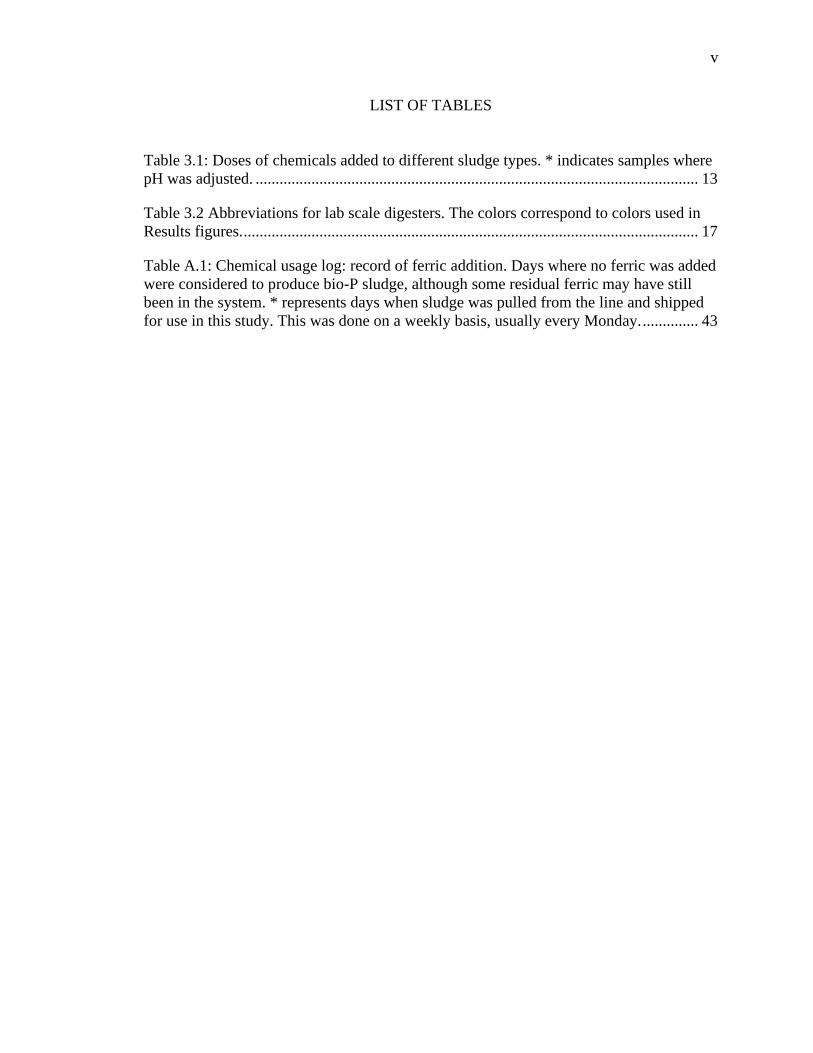
LIST OF TABLES
Table 3.1: Doses of chemicals added to different sludge types. * indicates samples where
pH was adjusted. ............................................................................................................... 13
Table 3.2 Abbreviations for lab scale digesters. The colors correspond to colors used in
Results figures. .................................................................................................................. 17
Table A.1: Chemical usage log: record of ferric addition. Days where no ferric was added
were considered to produce bio-P sludge, although some residual ferric may have still
been in the system. * represents days when sludge was pulled from the line and shipped
for use in this study. This was done on a weekly basis, usually every Monday. .............. 43

vi
LIST OF FIGURES
Figure 2.1: Diagram of a sludge floc including free and bound water. Adapted from
Vesilind, 1994. .................................................................................................................... 7
Figure 3.1 CST set up for dewatering test. The CST measuring device is shown on the
right with a close-up view of the input well and inner and outer diameters on the left. ... 14
Figure 3.2 Digester influent type and location. Each digester had a solids residence time
(SRT) of 15 days. 150 mL of effluent was taken out each day and 150 mL of the specific
influent was added each day. ............................................................................................ 17
Figure 4.1: Preliminary average CST results (top) and corresponding pH of each sample
(bottom). * Indicates data point off the plot. 200 meq/L NaOH resulted in a CST of 1970
seconds. Error bars represent one standard deviation of three replicate measurements.
Some error bars are small and not visible. ........................................................................ 23
Figure 4.2 Average methane production in percentage of biogas from all digesters during
quasi steady state. Error bars represent one standard deviation of all measurements taken
during quasi steady state. .................................................................................................. 24
Figure 4.3 Average effluent pH of all digesters during quasi steady state. Some error bars
are small and not visible. .................................................................................................. 25
Figure 4.4 Average alkalinity in mg/L as CaCO3 of all digesters during quasi steady state.
The error bars correspond to one standard deviation of all measurements taken during
quasi steady state............................................................................................................... 26
Figure 4.5: Conventional (left) and bio-P (right) cumulative biogas production during
quasi steady state............................................................................................................... 27
Figure 4.6 Volatile fatty acids measured during quasi steady state. Single measurements
taken at a time. .................................................................................................................. 28
Figure 4.7: Capillary suction time (CST) of digesters over quasi steady state for digesters
fed with bio-P sludge. Each measurement was performed in triplicate. ........................... 29
Figure 4.8: Capillary suction time of digesters over quasi steady state for digesters fed
with primary non-bio-P sludge. ........................................................................................ 30
Figure 4.9 Average capillary suction time (CST) during quasi steady state of digesters fed
with primary sludge (left) and bio-P sludge (right). The influent is untreated conventional
and untreated bio-P sludge. The error bars correspond to one standard deviation. .......... 31
Figure 4.10 Average effluent total monovalent to divalent cation ratio (M/D ratio) of all
digesters during quasi steady state. The error bars represent one standard deviation of all
measurements taken during quasi steady state.................................................................. 32

vii
Figure 4.11 Correlation plot comparing CST and M/D cation ratio. Note that the total
M/C cation ratio was measured and compared to CST values. ........................................ 33
Figure 4.12 Average effluent phosphorus concentrations of conventional sludge-fed
digesters and untreated influent. The different P species are identified by different colors.
The species are stacked to represent the total P concentration. ........................................ 34
Figure 4.13 Average effluent phosphorus concentrations of bio-P sludge-fed digesters
and untreated influent. The different P species are identified by different colors. The
species are stacked to represent the total P concentration. ............................................... 35
Figure A.1: Additional correlation plots comparing CST to various biosolids
characteristics. ................................................................................................................... 45
Figure A.2: Correlation plot comparing the M/D ratio, cations, and monovalent and
divalent sums to CST. The red indicates that as the parameter increases, the CST
increases, indicating poor dewaterability. The blue indicates that as the parameter
increases, the CST decreases, indicating improved dewaterability. ................................. 46

1
1 INTRODUCTION
1.1 Motivation
Regulations on phosphorus (P) effluent concentrations from water resource
reclamation facilities (WRRFs) have become more stringent, with some regulations as
low as 5-10 μg/L (Mayer, et al., 2016). P is essential to all life but can cause severe
aquatic health issues downstream of WRRFs. An excess of P in the presence of nitrogen
can cause eutrophication, or algae blooms, and create dead zones that are detrimental to
aquatic life (Macintosh, et al., 2018). A popular method for biological wastewater
treatment for removal of P is enhanced biological phosphorus removal (EBPR) (Yang,
Shi, Ballent, & Mayer, 2017).
Research has shown that EBPR biosolids are more difficult than conventional
biosolids to dewater, where biosolids are sludge that have been anaerobically digested
and dewatering is the separation of water from solid sludge matter (Vesilind, 1994).
Difficulty in dewatering results in higher solids handling costs (Higgins, Bott, Schauer, &
Beightol, 2014). The sludge produced from EBPR, i.e. bio-P sludge, releases phosphate
during anaerobic digestion, and phosphate readily binds with divalent cations. It has been
suggested that a high monovalent to divalent (M/D) cation ratio negatively affects
dewaterability, which might explain why EBPR sludge dewaters more poorly than
conventional sludge (Higgins & Novak, 1997). Research that investigates the role of the
M/D ratio on dewaterability of various types of sludges is sparse. Moreover, recent
research has started to consider there are different forms of P in sludge (i.e. reactive, non-
2
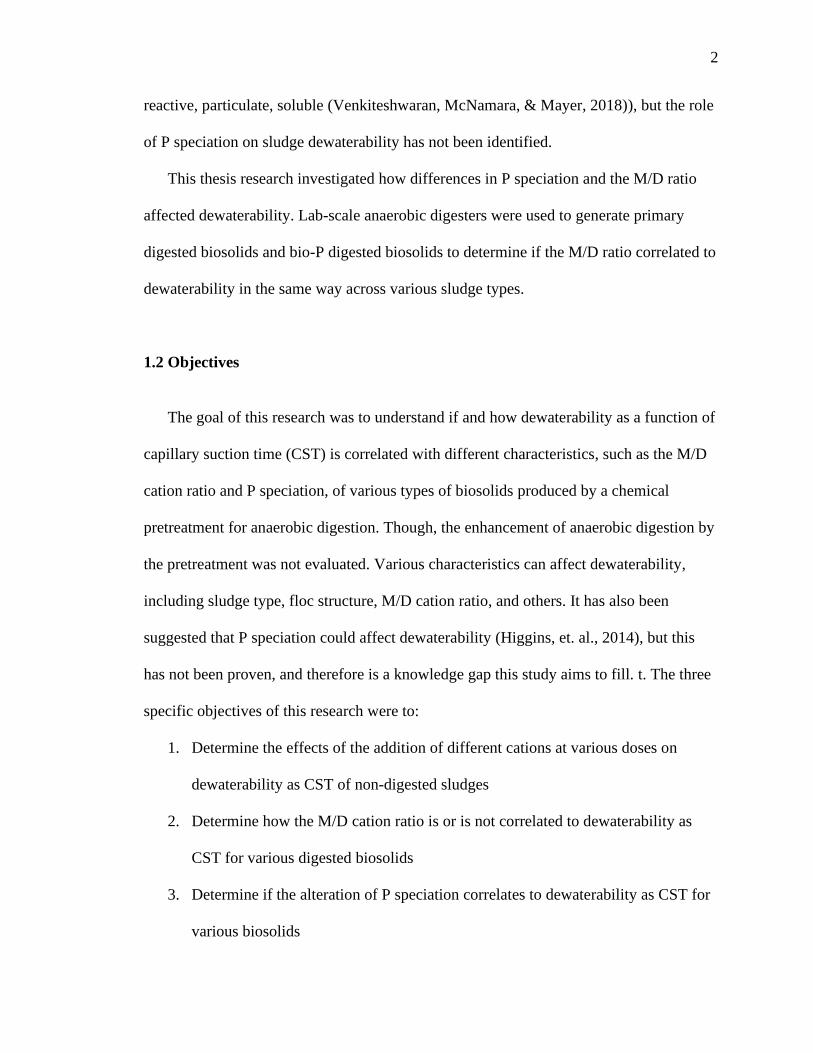
reactive, particulate, soluble (Venkiteshwaran, McNamara, & Mayer, 2018)), but the role
of P speciation on sludge dewaterability has not been identified.
This thesis research investigated how differences in P speciation and the M/D ratio
affected dewaterability. Lab-scale anaerobic digesters were used to generate primary
digested biosolids and bio-P digested biosolids to determine if the M/D ratio correlated to
dewaterability in the same way across various sludge types.
1.2 Objectives
The goal of this research was to understand if and how dewaterability as a function of
capillary suction time (CST) is correlated with different characteristics, such as the M/D
cation ratio and P speciation, of various types of biosolids produced by a chemical
pretreatment for anaerobic digestion. Though, the enhancement of anaerobic digestion by
the pretreatment was not evaluated. Various characteristics can affect dewaterability,
including sludge type, floc structure, M/D cation ratio, and others. It has also been
suggested that P speciation could affect dewaterability (Higgins, et. al., 2014), but this
has not been proven, and therefore is a knowledge gap this study aims to fill. t. The three
specific objectives of this research were to:
1. Determine the effects of the addition of different cations at various doses on
dewaterability as CST of non-digested sludges
2. Determine how the M/D cation ratio is or is not correlated to dewaterability as
CST for various digested biosolids
3. Determine if the alteration of P speciation correlates to dewaterability as CST for
various biosolids

3
1.3 Approach
The research focused on improving the dewaterability as a function of CST of
anaerobically digested biosolids and how the CST correlates to P speciation and M/D
cation ratio using a chemical pretreatment. This pretreatment was selected because batch
tests indicated it improved the CST of different sludge types (see Section 4.1).
The methods were designed to achieve the stated objectives. For each objective, a
hypothesis was formulated (stated in Chapter 2) and then tested. A batch study was
designed to test how various chemicals affected the CST and to select a pretreatment to
use later in lab-scale studies. Lab-scale digesters were used to examine how the chemical
pretreatment impacted the CST of different types of anaerobically digested biosolids.
Digesters receiving pre-treated sludge and control digesters receiving sludge that was not
pre-treated were operated in parallel. Half of the digesters were fed with primary sludge
and the other half were fed with a blend of primary and waste activated sludge (WAS)
bio-P sludge. The M/D cation ratio and P speciation were measured in effluent biosolids
from all digesters and correlation analysis was conducted with biosolids characteristics
and dewaterability as a function of CST. Graphpad Prism (Graphpad Software Inc., CA,
USA) and the open statistical program ‘R’ were used to determine correlations (R Core
Team, 2018).

4
1.4 Thesis Structure
A literature review describing sludge characteristics and how the characteristics relate
to dewaterability is presented in Chapter 2. The experimental methods are presented in
Chapter 3 to provide a detailed account of how results were obtained. Chapter 4
presents the experimental results and discussion. Conclusions drawn from the results and
a summary of the research is presented in Chapter 5. Appendices are attached with
supporting graphics and data.

5
2 LITERATURE REVIEW
2.1 General Goals of Biosolids Dewatering
Dewatering of sludge is the separation of water from solid sludge matter (Vesilind,
1994). Dewatering differs from thickening, as it aims to reduce the water adhered to
sludge particles, where thickening reduces overall water content (Vesilind,
1994).Dewatering is often completed before the solid sludge reaches its final destination,
although it is not required (Metcalf & Eddy, Inc., 2003). Sludge matter must be stabilized
before disposal but can be dewater before or after stabilization. The handling of these
solids is important for nutrient reuse and solids disposal and is related to the capital and
operating costs of water resource recovery facilities (WRRFs). The cost of solids
handling may equate to 25% to 50% of the total operations cost of a WRRF (Karr &
Keinath, 1978). These high costs are influenced by high polymer costs used to dewater
and trucking costs to transport the solids. To decrease the cost of solids handling and
disposal, the solid sludge matter is often dewatered (McNamara & Lawler, 2009). The
sludge has a high-water content and the water can be released through thickening and
dewatering systems such as gravity belt thickeners (before anaerobic digestion) and belt
filter presses or centrifuge systems (after anaerobic digestion). These processes can be
costly due to the required addition of polymers to aid the dewatering (Christensen,
Keiding, Nielsen, & Jørgensen, 2015). The dewaterability of different sludges is
influenced by sludge characteristics.

6
2.2 Wastewater Solids Characteristics that Affect Dewaterability
2.2.1 Monovalent to Divalent (M/D) Cation Ratio
The monovalent to divalent (M/D) cation ratio is associated with bioflocculation, or
the physical arrangement of bacterial flocs, and can also be used to predict dewaterability
of activated sludge (Higgins & Novak, 1997). According to the divalent cation bridging
theory (DCBT), when phosphate is released from the cell along with magnesium and
potassium, the amount of soluble magnesium and calcium decreases because phosphate
binds to these divalent cations. The release of potassium will then increase the
monovalent cation concentration and deteriorate the floc strength (Higgins & Novak,
1997; Sobeck & Higgins, 2002). The DCBT also suggests that decreasing the M/D cation
ratio will improve the dewaterability of activated sludge (Sobeck & Higgins, 2002).
Divalent cations, such as calcium and magnesium, were also added to industrial activated
sludge to decrease polymer use and improve overall dewaterability (Higgins, Tom, &
Sobeck, 2006). These studies focused on dewaterability and soluble M/D ratio of
activated sludge. However, additional research is required to determine if this ratio
correlates to dewaterability in anaerobically digested biosolids.
2.2.2 Floc Structure
Characteristics influencing sludge dewaterability include residual moisture of the
cake (bound water) and ease of filtration (Chen, Lin, & Lee, 1996). Specifically, floc
structure and the water contained within the floc play a large role in dewatering. Flocs
contain three different types of water: interstitial, vicinal, and bulk or free water. The

7
bulk water is the water surrounding the floc. As shown in Figure 2.1, interstitial water is
the water trapped in the spaces between particles and organisms (Vesilind, 1994). This
water is held in the floc structure or microbe structure and can be released if the structure
is destroyed. Vicinal water is the water on the surface of the particle. This layer is held by
hydrogen bonds that causes the water to adhere to the particle’s surface. The water of
hydration is the water chemically bound to the particles and can only be removed by
heating the solids (Vesilind, 1994). Vesilind (1994) determined that adding chemicals,
such as polymer, will only aid in releasing the interstitial water in the dewatering process.
Figure 2.1: Diagram of a sludge floc including free and bound water. Adapted from
Vesilind, 1994.
Extracellular polymer (ECP) is the organic polymer that allows microorganisms to
adhere to the surfaces of particles and other cells and can also affect dewaterability.
Increasing the amount of ECP in raw and digested sludges has been found to decrease
dewaterability (Houghton, Quarmby, & Stephenson, 2001). ECP is plentiful in activated

8
sludge and is dependent on pH. At neutral pH, the ECP is negatively charged
(Christensen, Keiding, Nielsen, & Jørgensen, 2015). This charge affects the structure of
the floc and how easily the activated sludge can be dewatered. The pH can also affect
particle size. At a high pH, there are more small particles and suspended ECP present that
negatively affect dewaterability (Christensen, et. al., 2015). Karr and Keinath (1978) note
that in anaerobic digestion specifically, dewaterability is poor at first, but improves once
the small particles are destroyed. According to Lawler et al. (1986), the specific surface
area directly impacts dewaterability of digested biosolids. If a sludge is digested properly,
the small particles are destroyed and allow for less surface area for water to adhere to,
therefore improving dewaterability.
2.2.3 Phosphorus Speciation
The P found in water can be divided into four fractions: soluble reactive P (sRP),
particulate reactive P (pRP), soluble nonreactive P (sNRP), and particulate nonreactive P
(pNRP) (Venkiteshwaran, McNamara, & Mayer, 2018). Soluble P is defined as the P that
passes through a 0.45 μm filter, whereas particulate P is retained on the filter (APHA,
1998). The reactive P is also known as orthophosphate, or inorganic P, and is readily
available to react with cations (Venkiteshwaran, et. al., 2018). From this, it can be
inferred that reactive P is not favorable for dewaterability because it readily binds with
divalent cations. No studies have been performed that definitively determined how other
P fractions affect dewaterability (Anderson, 2018).

9
2.3 Impacts of Enhanced Biological Phosphorus Removal (EBPR) on Dewaterability
Enhanced biological phosphorus removal (EBPR) results in a biological phosphorus
(bio-P) sludge that is often more costly to dewater than conventional WAS. According to
Higgins (2014), EBPR processes negatively affect dewaterability of sludge after
anaerobic digestion. EBPR decreases the monovalent to divalent (M/D) cation ratio of the
sludge and weakens floc structure resulting in poor dewaterability. The M/D cation ratio
directly relates to the concentration of cake solids produced after dewatering and the
amount of P directly relates to the M/D cation ratio (Higgins, et. al., 2014). The presence
of soluble P was also detrimental to the dewaterability of the bio-P sludge (Higgins, et.
al., 2014).
2.4 Alkaline Pre-Treatment to Improve Dewaterability
Many studies have added cations to activated sludge to improve dewaterability, but
the cations can also affect the pH of the sludge. High pH decreases dewaterability and the
addition of acid does not produce a noticeable effect on dewatering (Christensen, et. al.,
2015). When soluble calcium was added to activated sludge, the porosity of the flocs
decreased and created a stronger floc structure and dewaterability was improved.
Multivalent cations adhered to particle surfaces and reduced the amount of ECP by
neutralizing the charge and strengthening the floc (Christensen, et. al., 2015). The
addition of calcium and other cations affects the M/D cation ratio. More divalent cations
leads to better dewaterability (Higgins, Bott, Schauer, & Beightol, 2014). The soluble
calcium concentration was found to correlate with good dewaterability of anaerobically
10
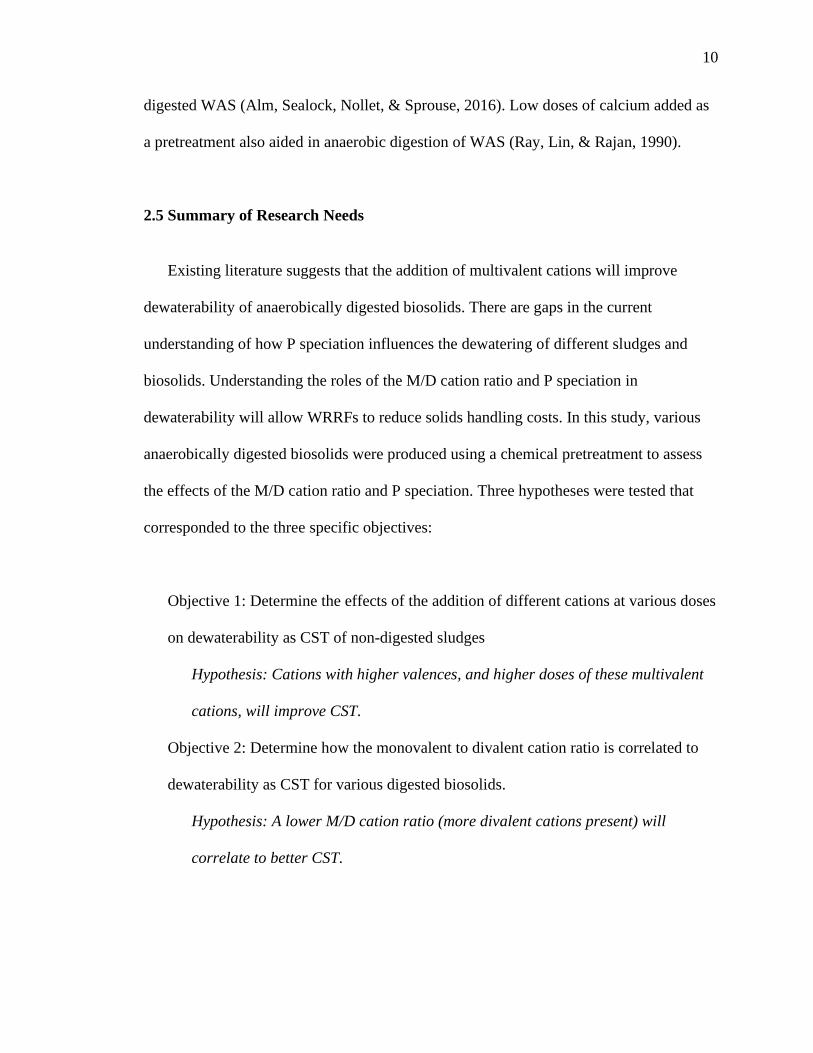
digested WAS (Alm, Sealock, Nollet, & Sprouse, 2016). Low doses of calcium added as
a pretreatment also aided in anaerobic digestion of WAS (Ray, Lin, & Rajan, 1990).
2.5 Summary of Research Needs
Existing literature suggests that the addition of multivalent cations will improve
dewaterability of anaerobically digested biosolids. There are gaps in the current
understanding of how P speciation influences the dewatering of different sludges and
biosolids. Understanding the roles of the M/D cation ratio and P speciation in
dewaterability will allow WRRFs to reduce solids handling costs. In this study, various
anaerobically digested biosolids were produced using a chemical pretreatment to assess
the effects of the M/D cation ratio and P speciation. Three hypotheses were tested that
corresponded to the three specific objectives:
Objective 1: Determine the effects of the addition of different cations at various doses
on dewaterability as CST of non-digested sludges
Hypothesis: Cations with higher valences, and higher doses of these multivalent
cations, will improve CST.
Objective 2: Determine how the monovalent to divalent cation ratio is correlated to
dewaterability as CST for various digested biosolids.
Hypothesis: A lower M/D cation ratio (more divalent cations present) will
correlate to better CST.

11
Objective 3: Determine if the alteration of P speciation correlates to dewaterability as
CST for various biosolids
Hypothesis: The addition of divalent cations will alter P speciation and breakdown
small sludge particles. The divalent cations will bind with the soluble P and cause
more particulate P to be present, decreasing the amount of small sludge particles
and free P, therefore improving CST.

12
3 METHODOLOGY
3.1 Batch Studies to Assess Impacts of Chemical Pretreatments on Dewaterability as
Capillary Suction Time
Batch tests were performed on different sludges to assess the effects of the addition of
different cations at various doses on dewaterability as CST (Objective 1). It was proposed
that adding cations with higher valences (trivalent > divalent > monovalent) and higher
concentrations of the multivalent cations would improve CST. Primary sludge was
collected from South Shore Water Reclamation Facility (SS) in Oak Creek, WI and bio-P
sludge was collected from Fond du Lac Wastewater Treatment & Resource Recovery
Facility (FDL) in Fond du Lac, WI. Hydrochloric acid, sodium hydroxide, calcium
hydroxide, sodium chloride, calcium chloride, and ferric chloride were added to 50 mL
samples of primary sludge. The chemicals were added at doses of 0.2, 2, and 200 meq/L
(Table 3.1). The sludge samples were stirred for approximately 5 minutes on a magnetic
stir plate before batch tests were performed. After this time, the pH of the samples was
measured and adjusted to the original pH of the sludge using hydrochloric acid or sodium
hydroxide. The dewaterability of each sample was measured using capillary suction time,
described in section 3.1.1. P speciation tests were performed using the ascorbic acid
method (Standard Method 4500-P E.).

13
Table 3.1: Doses of chemicals added to different sludge types. * indicates samples where
pH was adjusted.
Chemical Dose
(meq/L) pH
Sludge Type
HCl
200 1.29
Primary 20 5.13
2 5.63
NaOH
200 12.92
Primary 20 6.93
2 5.88
Ca(OH)2 200
12.54 Primary
5.17*
5.74* Bio-P
NaCl 200 5.53 Primary
CaCl2 200 5.41 Primary
FeCl3 200 2.79
Primary 5.93
3.1.1 Capillary Suction Time (CST) for Dewatering
Dewaterability was determined using a multi-purpose CST apparatus (Triton
Electronics Limited, Great Dunmow, Essex, England). The CST apparatus measured the
time for water to move across filter paper (GE Whatman, Grade 17 7x9cm) from an inner
diameter (31.75 mm) near an input well to an outer diameter (45.72 mm) (Figure 3.1).
The CST was measured as the time it took for water to travel through the filter from the
inner diameter to the outer diameter. The time was measured in seconds, and a high CST
value indicates poor dewaterability while a low CST value indicates good dewaterability.
Although using a CST device has shortcomings, such as limitations on measuring bond-
water content and percent of cake solids, it is the most widely used method to measure
dewaterability (Ngwenya, Higgins, Beightol, & Murthy, 2017; Scholz, 2005). CST has
been used to measure dewaterability in multiple studies for more than forty years because

14
the test is simple to conduct and it is precise (Vesilind, 1988; Houghton, Quarmby, &
Stephenson, 2001; Feng, et al., 2009; Yu, et al., 2009).
Figure 3.1 CST set up for dewatering test. The CST measuring device is shown on the
right with a close-up view of the input well and inner and outer diameters on the left.
3.2 Anaerobic Digester Lab-Scale Experiments
3.2.1 Purpose of Experiments
Lab-scale anaerobic digesters were operated to generate different biosolids types
and asses the correlations between M/D cation ratio, P speciation, and CST, as described
in the following research objectives to test the following hypotheses:
Objective 2: Determine how the M/D cation ratio is correlated to CST for various
digested biosolids.
Hypothesis: A lower M/D cation ratio (more divalent cations present) will
correlate to better CST.

15
Objective 3: Determine how the alteration of P speciation correlates to dewaterability as
CST for various biosolids
Hypothesis: The addition of divalent cations will alter P speciation and breakdown
small sludge particles. The divalent cations will bind with the soluble P and cause
more particulate P to be present, decreasing the amount of small sludge particles
and free P, therefore improving CST.
3.2.2 Influent Sludge Sources
Two types of sludge were used as influent feed for these lab-scale anaerobic
digestion experiments. Screened primary sludge was collected from SS. The sludge was
collected on site approximately every two weeks and stored at 4 °C until use (at most 1.5
weeks). The bio-P sludge used was a blend of primary and WAS from FDL. The bio-P
sludge was shipped weekly on ice to the Water Quality Center at Marquette University in
Milwaukee, WI. According to the wastewater superintendent, the activated sludge system
at Fond du Lac was run intermittently as bio-P approximately 50-60% of the time. A
daily log from FDL indicating the days the activated sludge system was running as bio-P
can be found in the Appendix. The bio-P sludge was stored in 4 °C fridge until use (at
most 1.5 weeks).
16
3.2.3 Digester Set Up & Operation
Four sets of duplicate digesters were used in this study (Figure 3.2). Two were
duplicate control digesters fed with untreated bio-P sludge from FDL. Effluent samples
from these two digesters are referred to as BC1 and BC2 because they were bio-P
influent sludge operated under control conditions (i.e. no pre-treatment). Two duplicate
digesters were fed with chemically treated bio-P sludge. Effluent samples from these two
digesters are referred to as BT1 and BT2 because they were bio-P influent sludge
operated under treated conditions. Two duplicate control digesters were fed with
untreated primary sludge from South Shore. Effluent samples from these two digesters
are referred to as PC1 and PC2 because they were primary influent sludge operated under
control conditions (i.e. no pre-treatment). The final two duplicate digesters were fed with
chemically treated primary sludge. Effluent samples from these two digesters are referred
to as PT1 and PT2 because they were primary influent sludge operated under chemically
treated conditions. Table 3.2 provides a summary of the four sets of digesters with the
corresponding abbreviation, sludge type, origin location, and color used in data
presentation.

17
Table 3.2 Abbreviations for lab scale digesters. The colors correspond to colors used in
Results figures.
Figure 3.2 Digester influent type and location. Each digester had a solids residence
time (SRT) of 15 days. 150 mL of effluent was taken out each day and 150 mL of the
specific influent was added each day.
Name Abbreviation WWRF Sludge Type Color
Primary Control 1 PC1 SS Primary
Primary Control 2 PC2 SS Primary
Primary Treated 1 PT1 SS Primary
Primary Treated 2 PT2 SS Primary
Bio-P Control 1 BC1 FDL Blended
Bio-P Control 2 BC2 FDL Blended
Bio-P Treated 1 BT1 FDL Blended
Bio-P Treated 2 BT2 FDL Blended
Bio-P Ca(OH)2 + Bio-P Primary Ca(OH)
2 + Primary
South Shore Fond du Lac

18
All lab-scale digesters were seeded with digester effluent from South Shore. The
operating volume of each digester was 2.25 L. Each digester was sparged with 30%
carbon dioxide and 70% nitrogen gas at the start of operation. A small port on the lid of
each digester was connected to a Tedlar bag for gas release and collection until gas
analysis. The digesters were operated with a 15-day SRT for 78 days total (i.e., more than
five SRT values to ensure quasi steady state was reached and to conduct quasi steady
state analysis). In accordance with the SRT, 150 mL of biosolids were removed as
effluent daily and 150 mL of feed sludge was added to each digester (Figure 3.2). Quasi
steady state was considered to be achieved after three SRT values (after 45 days).
Digesters were operated at 35 °C in a temperature-controlled room and stirred on
magnetic stir plates operated at 140 to 150 rpm for 7 hours a day. The magnetic stir plates
operated on a timer and digesters were stirred before, during, and after feeding.
The chemically treated influent was made by amending the control influent sludge
with 200 meq/L calcium hydroxide and mixing for two minutes using a stir bar and
magnetic stir plate. The sludge pH was then lowered to approximately 8.5 using
hydrochloric acid. Initially during Days 1-40, the pH was lowered to a neutral pH (7 to
7.5) but this method was adjusted to keep the effluent pH from dropping and prevent the
digesters from souring. A decline in pH was beginning to occur in the chemically treated
influent, possibly from acid addition. The switch to an influent pH of 8.5 occurred on
Day 41.
Effluent biosolids parameters were measured during operation to monitor digester
health including:
• pH (measured daily)

19
• biogas methane concentration (measured twice per week as previously described
by Venkiteshwaran, et al. (2017) using gas chromatography coupled to a thermal
conductivity detector (GC-TCD) (GC System 7890A, Agilent Technologies,
Irving, TX, USA)
• biogas volume (measured twice per week using a wet test meter (Precision Test
Company, San Antonio, Texas, United States))
• total and volatile solids (measured twice per week using Standard Method 2540-
G)
• alkalinity (measured twice per week according to Standard Method 2320 B:
Alkalinity by Titration)
• volatile fatty acids (VFAs) (measured twice per week via gas chromatography
(GC System 7890A, Agilent Technologies, Irving, TX, USA) using a flame
ionization detector as described in Venkiteshwaran, Benn, Seyedi, & Zitomer
(2019)).
The following effluent biosolids characteristics were measured for dewaterability
correlation analysis:
• Cation concentration (total concentration measured once per week using nitric
acid digestion and inductively coupled plasma mass spectrometry (ICP-MS) as
previously used in Kappell, Harrison, & McNamara (2019)). Monovalent (sodium
and potassium) and divalent (calcium and magnesium) cations were quantified
and used to determine the monovalent to divalent cation ratio.

20
• P speciation (measured once per week using the ascorbic acid method (Standard
Method 4500-P E.) The ascorbic acid method only measures total P (TP), total
soluble P (sTP), reactive P (RP), and soluble reactive P (sRP). The non-reactive P
(NRP) fractions and particulate P factions were determined by subtraction with
the knowledge that NRP and RP is equal to the TP and that sTP and particulate P
(pTP) is equal to TP).
• Dewaterability (measured two to five times per week via CST).
3.2.4 Statistical Analyses
Ordinary one-way analysis of variance (ANOVA) multiple comparisons tests were
used to compare digester data for each characteristic. Graphpad Prism (Graphpad
Software Inc., CA, USA) was used to determine if data was statistically significant (p-
value < 0.05).
Statistical analysis for the comparison of multiple characteristics was performed by
Dr. Anthony Kappell using the open statistical program ‘R’ (R Core Team, 2018). All
corresponding statistical plots were generated from the analysis. Analysis of variance
using the ‘anova’ function on ‘lm’ function of linear model was used to determine
significant factors contributing to the differences observed in the CST values for the main
factors. The main factors examined were measurements taken from the same sample (i.e.
CST, pH, M/D cation ratio). Consistent factors were the source of the sludge and if it was
treated or untreated. Groups for analysis consisted of P measurements (TP, sRP, pRP, and
sNRP), cation measurements (Mg, Ca, Na, K, divalent, monovalent, and M/D cation
ratio), the production of biogas and methane, and solids (total solids and volatile solids).
21
Post hoc multiple pairwise comparisons were conducted using Tukey’s honestly
significant differences (HSD) by the ‘TukeyHSD’ function. Pearson correlations for the
variables were calculated using the ‘cor.test’ function on measurements taken from the
same sample. Significant correlations were visualized utilizing ‘corrplot’ function from
the ‘corrplot’ R package (Wei & Simko, 2016). Significant differences were defined as p-
value less than 0.05.

22
4 RESULTS & DISCUSSION
4.1 Preliminary Batch Capillary Suction Time Results
Different chemicals were added to primary sludge to see how they affected CST.
The pH was adjusted with either hydrochloric acid or sodium hydroxide after chemical
addition when there was a large change in pH to determine if the CST results were related
to the chemical addition or change in pH. The optimal chemical for CST improvement
was chosen and then the test was performed on bio-P sludge to determine if the chemical
provided similar results.
Cation addition affected CST, and the effect was not just due to changes in pH
(Figure 4.1). Experiments with calcium hydroxide with and without pH adjustment both
resulted in improved CST (p-values < 0.0001, one-way ANOVA) (see 3rd and 4th bars
compared to 1st bar in Figure 4.1). The addition of calcium hydroxide improved CST
more than the addition of calcium chloride, but the difference was not due to pH. The
addition of monovalent cations, via sodium hydroxide addition, had a negative impact on
CST. The addition of ferric chloride also improved CST, but not to the extent that the
addition of calcium hydroxide improved CST.

23
Figure 4.1: Preliminary average CST results (top) and corresponding pH of each
sample (bottom). * Indicates data point off the plot. 200 meq/L NaOH resulted in a CST
of 1970 seconds. Error bars represent one standard deviation of three replicate
measurements. Some error bars are small and not visible.
Improved CST was not dependent on the pH of the sludge but was dependent on the
cations added. Calcium hydroxide raised the pH of the sludge and ferric chloride
decreased the pH, but both chemicals improved the CST of primary sludge significantly
(p-values <0.0001). Since ferric chloride is a common metal used for the removal of
phosphorus and residual ferric chloride does not already improve dewaterability, calcium
hydroxide with hydrochloric acid was chosen for the pre-treatment base addition.
Calcium hydroxide with hydrochloric acid was chosen over calcium hydroxide alone
because the CST was still improved when the pH was changed. The combination of
calcium hydroxide and hydrochloric acid was also used so that a near-neutral pH could be
fed to digesters to prevent the digesters from becoming extremely basic. This
Untreate
d P
200 meq/L
NaO
H P
200 meq C
aOH P
200 meq C
aOH p
H adj P
200 meq C
aCl2 P
200 meq N
aCl P
200 meq F
eCl3 P
200 meq F
eCl3 p
H adj P
Untreate
d Bio
-P
200 meq C
aOH p
H adj B
io-P
0
50
100
150
200
250
300
350
400
450
500
CS
T (
sec
)
200 meq/L NaOH P
Untreated P
200 meq CaOH P
200 meq CaOH pH adj P
200 meq CaCl2 P
200 meq NaCl P
200 meq FeCl3 P
200 meq FeCl3 pH adj P
Untreated Bio-P
200 meq CaOH pH adj Bio-P
Untreate
d P
200 meq/L
NaO
H P
200 meq C
aOH P
200 meq C
aOH p
H adj P
200 meq C
aCl2 P
200 meq N
aCl P
200 meq F
eCl3 P
200 meq F
eCl3 p
H adj P
Untreate
d Bio
-P
200 meq C
aOH p
H adj B
io-P
0
5
10
pH
Untreated P
200 meq/L NaOH P
200 meq CaOH P
200 meq CaOH pH adj P
200 meq CaCl2 P
200 meq NaCl P
200 meq FeCl3 P
200 meq FeCl3 pH adj P
Untreated Bio-P
200 meq CaOH pH adj Bio-P
Untr
eate
d P
200 meq/L
NaO
H P
200 meq C
aOH P
200 meq C
aOH p
H a
dj P
200 meq C
aCl2
P
200 meq N
aCl P
200 meq F
eCl3
P
200 meq F
eCl3
pH a
dj P
Untr
eated B
io-P
200 meq C
aOH p
H a
dj Bio
-P
0
100
200
300
400
5001500
2000
2500
CS
T (
se
c)
200 meq/L NaOH P
Untreated P
200 meq/L CaOH P
200 meq/L CaOH pH adj P
200 meq/L CaCl2 P
200 meq/L NaCl P
200 meq/L FeCl3 P
200 meq/L FeCl3 pH adj P
Untreated Bio-P
200 meq/L CaOH pH adj Bio-P

24
combination was then added to bio-P sludge and the treatment provided similar improved
CST as it did for the primary sludge (see and compare last two columns on righthand side
in Figure 4.1). There was significant difference between the untreated and the chemically
treated bio-P samples (p-value = 0.0019, one-way ANOVA).
4.2 Digester Health & Performance
Digester health and performance were monitored by measuring methane
production, pH, alkalinity, cumulative biogas production, and VFAs. Overall, digester
health and performance were similar between the four digester conditions, though PC2
had some outlier performance data.
On average, all digesters produced biogas with a methane concentration of over 60%
during quasi steady state (Figure 4.2). One-way ANOVA comparison tests showed no
significant difference among the biogas methane concentrations from all digesters (p-
values > 0.7).
PC1 PC2 PT1 PT2 BC1 BC2 BT1 BT2
0
20
40
60
80
100
Me
tha
ne
(%
)
Figure 4.2 Average methane production in percentage of biogas from all digesters
during quasi steady state. Error bars represent one standard deviation of all
measurements taken during quasi steady state.
25
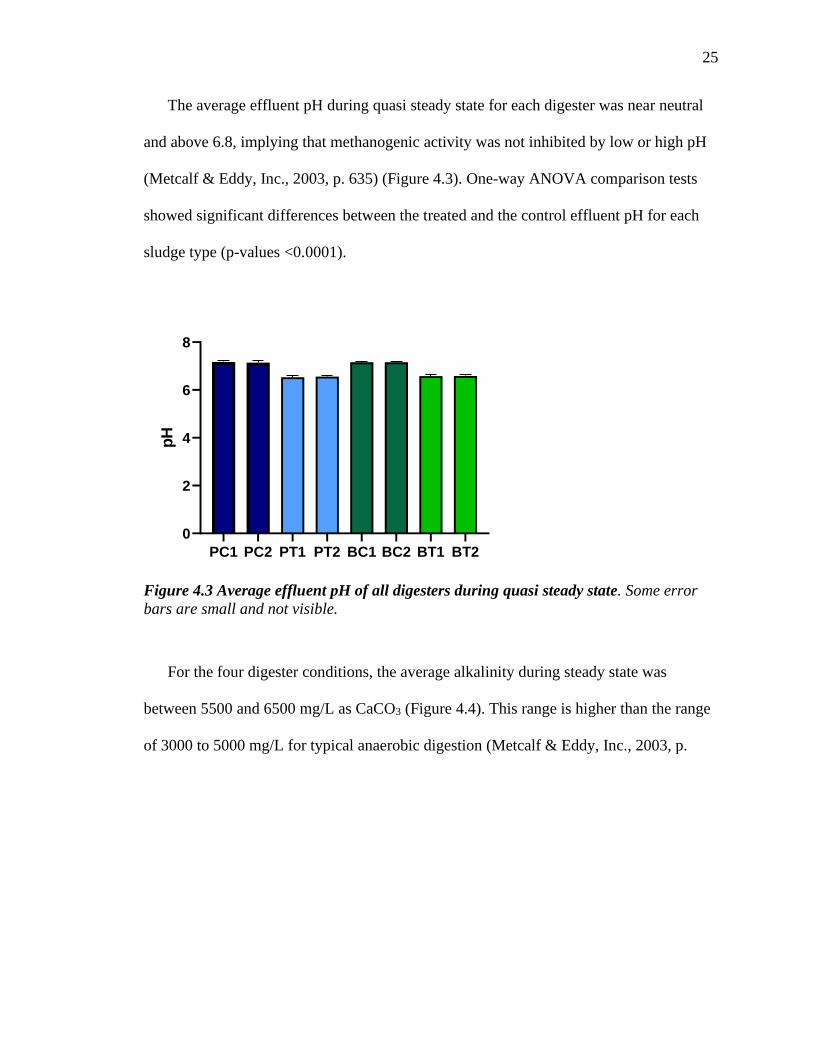
The average effluent pH during quasi steady state for each digester was near neutral
and above 6.8, implying that methanogenic activity was not inhibited by low or high pH
(Metcalf & Eddy, Inc., 2003, p. 635) (Figure 4.3). One-way ANOVA comparison tests
showed significant differences between the treated and the control effluent pH for each
sludge type (p-values <0.0001).
PC1 PC2 PT1 PT2 BC1 BC2 BT1 BT2
0
2
4
6
8
pH
Figure 4.3 Average effluent pH of all digesters during quasi steady state. Some error
bars are small and not visible.
For the four digester conditions, the average alkalinity during steady state was
between 5500 and 6500 mg/L as CaCO3 (Figure 4.4). This range is higher than the range
of 3000 to 5000 mg/L for typical anaerobic digestion (Metcalf & Eddy, Inc., 2003, p.

26
635). A one-way ANOVA comparison test showed no significant difference between the
control and treated effluent alkalinity for each sludge type (p-values > 0.05).
PC1 PC2 PT1 PT2 BC1 BC2 BT1 BT2
0
2000
4000
6000
8000
Alk
alin
ity m
g/L
as C
aC
O3
Figure 4.4 Average alkalinity in mg/L as CaCO3 of all digesters during quasi steady
state. The error bars correspond to one standard deviation of all measurements taken
during quasi steady state.
The cumulative biogas production for the bio-P digesters was less than that of the
primary digesters during quasi steady state (Figure 4.5). There was not much variation in
the cumulative gas production of the bio-P digesters (approximately 1.9 and 1.5 L biogas/
day for controls and treated, respectively). The treated primary digesters produced more
biogas than the primary control digesters (2.3 L biogas/ day). The second control for the
primary digesters (PC2) produced less biogas than its duplicate for a period during steady
state, but simple linear regression analysis determined that biogas production resumed.
The biogas production rates for both primary controls were almost the same (1.7 and 1.8

27
L biogas/day for PC1 and PC2, respectively). PC2 for the conventional control digesters
was determined to not be a true duplicate based on more analysis.
40 50 60 70 80
0
20
40
60
80
100
Day
Cu
mu
lati
ve
Bio
gas P
rod
ucti
on
(L
)
PC1
PC2
PT1
PT2
40 50 60 70 80
0
20
40
60
80
100
Day
Cu
mu
lati
ve
Bio
gas P
rod
ucti
on
(L
)
BT1
BT2
BC1
BC2
Figure 4.5: Conventional (left) and bio-P (right) cumulative biogas production during
quasi steady state.
PC2 had significantly higher total VFAs than the other digesters (Figure 4.6). The
effluent biosolids from PC2 became less viscous than its duplicate at the start of the quasi
steady state. The digester was fed with 50 mL of effluent from PC1 to reduce digestate
VFA concentration for one week after Day 46. It was determined later, at the end of this
study, that the stir bar got caught in solids built up and was not stirring properly.
Although the primary control duplicate malfunctioned, the digester still produced effluent
sludge that was used for analysis. The objective of this study was not to test the impact of
pre-treatment on anaerobic digestion, but to produce sludge of variable characteristics for
correlation analysis of CST and biosolids characteristics.

28
55 60 65 70 75 80
0
200
400
600
800
1000
Day
VF
As m
g/L
as A
ceti
c A
cid PC1
PC2
PT1
PT2
BC1
BC2
BT1
BT2
Figure 4.6 Volatile fatty acids measured during quasi steady state. Single measurements
taken at a time.
4.3 Capillary Suction Time of Effluent Biosolids from Bench Scale Digesters
The time series of CST data for the bio-P digester biosolids provides evidence that
the pretreatment improved dewaterability after anaerobic digestion; the digesters fed pre-
treated solids yielded biosolids with much lower CST values than the control digesters
(Figure 4.7). Since EBPR changes the M/D cation ratio, the pretreatment likely shifted
the ratio so that CST was improved (more divalent cations present), as suggested by
Sobeck and Higgins (2002). The data provide evidence that the divalent cation bridging
theory (DCBT) can also be applied to bio-P biosolids and not only activated sludge.

29
40 50 60 70 80
0
200
400
600
800
Day
CS
T (
se
c)
Control 1
Control 2
Treated 1
Treated 2
Influent
Figure 4.7: Capillary suction time (CST) of digesters over quasi steady state for
digesters fed with bio-P sludge. Each measurement was performed in triplicate.
Interestingly, the pretreatment did not improve the CST of the primary biosolids
(Figure 4.8). This provides evidence that the DCBT, as suggested by Sobeck and Higgins
(2002), cannot be applied to all sludge types. The M/D cation ratio may be a better
indicator of CST for some biosolids over others. The M/D cation ratio may not be an
indicator of improved CST for primary biosolids and may be only applicable to biosolids
similar to bio-P biosolids.

30
40 50 60 70 80
0
100
200
300
400
Day
CS
T (
se
c)
Control 1
Control 2
Treated 1
Treated 2
Influent
Figure 4.8: Capillary suction time of digesters over quasi steady state for digesters fed
with primary non-bio-P sludge.
There is a statistical difference between the average CST of the control and treated
digesters for the bio-P biosolids (Figure 4.9, right). A multiple comparison test revealed a
statistically significant difference between the bio-P control and treated effluents and
influent (p-values < 0.0001, one-way ANOVA). The average CST during quasi steady
state for the control and treated primary digester effluent were not significantly different
(Figure 4.9, left). A one-way multiple ANOVA comparisons test revealed no statistical
difference between the primary control and treated effluents and influent (p-values >
0.05). However, this was not true for the second primary control duplicate (p-values <
0.1, one-way ANOVA). The chemical treatment significantly improved the CST of the
bio-P digester effluent, but not the primary effluent.

31
Contr
ol 1
Contr
ol 2
Treat
ed 1
Treat
ed 2
Influ
ent
0
200
400
600
CS
T (
se
c)
Contr
ol 1
Contr
ol 2
Treat
ed 1
Treat
ed 2
Influ
ent
0
200
400
600
CS
T (
se
c)
Figure 4.9 Average capillary suction time (CST) during quasi steady state of digesters
fed with primary sludge (left) and bio-P sludge (right). The influent is untreated
conventional and untreated bio-P sludge. The error bars correspond to one standard
deviation.
4.4 Bench Scale Digesters: Sludge Characteristics
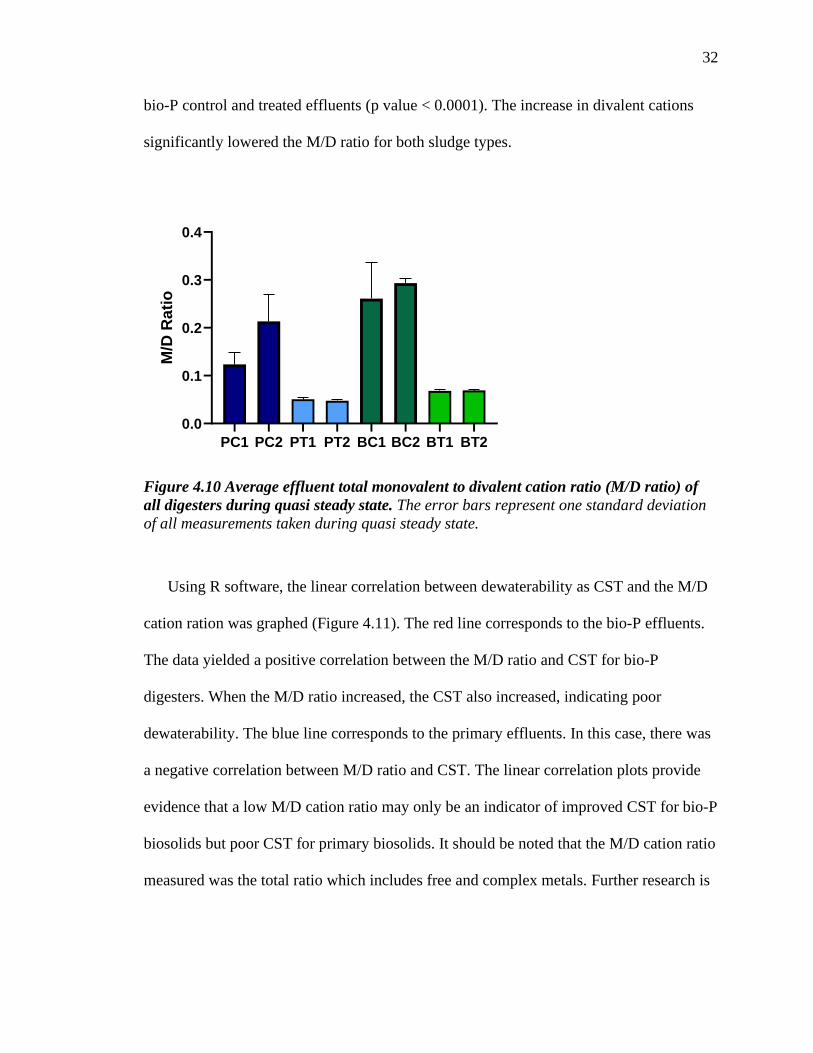
The chemical pretreatment significantly altered the M/D cation ratio of the treated
effluent biosolids (Figure 4.10). A one-way ANOVA multiple comparisons test revealed
statistical difference between the primary control and treated effluents (p values < 0.001).
However, there was a difference between the primary control duplicates. The ANOVA
multiple comparisons test also revealed statistically significant differences between the
32
bio-P control and treated effluents (p value < 0.0001). The increase in divalent cations
significantly lowered the M/D ratio for both sludge types.
PC1 PC2 PT1 PT2 BC1 BC2 BT1 BT2
0.0
0.1
0.2
0.3
0.4
M/D
Ra
tio
Figure 4.10 Average effluent total monovalent to divalent cation ratio (M/D ratio) of
all digesters during quasi steady state. The error bars represent one standard deviation
of all measurements taken during quasi steady state.
Using R software, the linear correlation between dewaterability as CST and the M/D
cation ration was graphed (Figure 4.11). The red line corresponds to the bio-P effluents.
The data yielded a positive correlation between the M/D ratio and CST for bio-P
digesters. When the M/D ratio increased, the CST also increased, indicating poor
dewaterability. The blue line corresponds to the primary effluents. In this case, there was
a negative correlation between M/D ratio and CST. The linear correlation plots provide
evidence that a low M/D cation ratio may only be an indicator of improved CST for bio-P
biosolids but poor CST for primary biosolids. It should be noted that the M/D cation ratio
measured was the total ratio which includes free and complex metals. Further research is

33
required to fully understand the correlation of the M/D cation ratio and CST across
biosolids types from different WRRFs, specifically how free metals can improve CST.
Supplemental linear correlation plots for various sludge characteristics are presented
in the Appendix.
Figure 4.11 Correlation plot comparing CST and M/D cation ratio. Note that the total
M/C cation ratio was measured and compared to CST values.
The chemical pretreatment also altered the phosphorus speciation by shifting soluble
P to particulate P (Figures 4.12 and 4.13). The amount of total P measured in this study
should be the same for influent and effluent samples, but that is not the case. The total P
values for bio-P biosolids are similar, but they are greater than the influent. The total P
values of primary-digested samples are more variable. While P speciation should change
during digestion, total P should not change. The differences in the amount of total P
could be due to limitations in the methods or due to variable nature of influent sludge

34
over time and, therefore, P speciation cannot be used as a clear indicator of CST in this
study, but the information gathered was still used in correlation analysis to gain insight
into how P speciation could be correlated to CST. More research must be performed to
fully understand the role of P speciation in reference to CST.
Figure 4.12 Average effluent phosphorus concentrations of conventional sludge-fed
digesters and untreated influent. The different P species are identified by different
colors. The species are stacked to represent the total P concentration.
0
100
200
300
400
500
600
700
800
900
PC1 PC2 PT1 PT2 Influent
P c
on
cen
trat
ion
(m
g/L)
sRP pRP sNRP pNRP

35
Figure 4.13 Average effluent phosphorus concentrations of bio-P sludge-fed digesters
and untreated influent. The different P species are identified by different colors. The
species are stacked to represent the total P concentration.
The primary biosolids, except for PC2, contained more total phosphorus than the bio-
P biosolids. The bio-P and primary biosolids had similar average amounts of soluble
reactive and nonreactive P. The available soluble reactive P possibly bonded with the
added Ca to form particulate P. The goal of the pretreatment was to precipitate out the
reactive P by binding it with the added calcium ions. Improved CST was still achieved
for the bio-P biosolids because the free calcium added as a pre-treatment lowered the
M/D cation ratio.
Using R software, CST was compared to P speciation, solids content, and cation
quantities. Though total P values did not match between influent and effluent, P
speciation of effluent samples were included in analysis of effluent samples only to glean
if P speciation might have an impact on CST. P speciation values were entered in as
fractions of total P for analysis. The analysis provides evidence that lowering the M/D
ratio could improve CST of sludge, but it is dependent on the sludge type. The CST of
0
100
200
300
400
500
600
700
800
900
BC1 BC2 BT1 FT2 Influent
P c
on
cen
trat
ion
(m
g/L)
sRP pRP sNRP pNRP

36
bio-P biosolids improved when the amount of divalent cations increased, but the opposite
was observed for the primary sludge. The amount of particulate P could also impact CST
because the increase of particulate P positively impacted the CST of the bio-P biosolids
but negatively impacted the CST of the primary biosolids. This indicates that biosolids
type matters when understanding the role of individual characteristics on CST. More
research is required to understand why trends are opposite between these two types of
biosolids. A plot generated from this analysis can be found in the Appendix.
It is unclear why the increase in particulate P improved the CST of the bio-P biosolids
but not the primary biosolids. It was expected that an increase in particulate P would
decrease CST for the primary biosolids because more particulate P is associated with
more organic matter. The organic matter creates higher amounts of ECP which
corresponds to poor dewaterability (Christensen, et. al., 2015). It was unexpected that the
opposite was true for the bio-P biosolids. More research should be conducted to better
understand if the improved CST could be explained chemically or biologically.
Anaerobic digestion and EBPR weaken floc structure, allowing for more particles and
surface area for water to adhere (Higgins, et.al., 2014). More small particles decreases
dewaterability. The chemical pretreatment increased the amount of divalent cations and
these cations, instead of vicinal water, possibly adhered to particle surfaces and
strengthened the structure of the bio-P flocs. The primary influent sludge may not have
had as many free particles for the calcium to adhere to as the bio-P influent sludge. The
lack of available particles in the primary sludge possibly did not allow the calcium to

37
adhere to its surfaces and the vicinal water could not be released, causing poor
dewaterability as CST.

38
5 CONCLUSIONS
The goal of this research was to determine the effect of changing the M/D cation
ratio, where the total cations were measured, and P speciation using a chemical
pretreatment on various anaerobically digested biosolids and how these characteristics
correlate to dewaterability as CST. A pretreatment with 200 meq/L calcium hydroxide
with the addition of hydrochloric acid for pH adjustment was selected because it
improved the CST of the primary and bio-P sludge in the batch study. A lab-scale study
was performed to test the impact the proposed pretreatment would have on CST after
anaerobic digestion, M/D cation ratio, and P speciation. The following conclusions are
based on the lab-scale anaerobic digestion study performed at the Marquette University
Water Quality Center:
1. The chemical pretreatment, calcium hydroxide-hydrochloric acid, was
selected from the initial batch study. The batch study revealed that the
improved CST was not dependent on pH, but due to the cations added. The
batch study also revealed that the improved CST could be attributed to the
cation addition because improved CST was seen before and after acid (anion)
addition. This study also revealed that ferric chloride can also improve CST.
Further work should be done to determine the effect of multivalent cations
with the same anion on other sludge and biosolids types and further provide
evidence that improved CST is dominated by cation addition.

39
2. The calcium hydroxide-hydrochloric acid pretreatment significantly improved
the dewaterability as CST of the bio-P biosolids (p-value s<0.0001, one-way
ANOVA). Contrarily, the pretreatment had little to negative effect on the
primary biosolids. Future research should be conducted to determine the
optimal dose of calcium hydroxide for improvement of dewaterability as CST.
3. The chemical pretreatment decreased the M/D cation ratios for both types of
biosolids. Based upon linear correlation analysis, the M/D cation ratio and
CST have a positive correlation for only the bio-P biosolids. Further work
should be performed to determine why the CST was not improved when the
M/D cation ratio was decreased in the primary digested biosolids. Future work
should also be performed on multiple biosolids of the same type from
different WRRFs. These results indicate that the M/D cation ratio is not
universally correlated to CST and the type of biosolids affects the correlation.
4. The chemical pretreatment altered the P speciation in favor of the particulate P
form. The amount of particulate P impacted CST for both sludge types. More
particulate P in bio-P biosolids may have improved CST, but the opposite
occurred for the primary biosolids. Future work could focus on the addition of
other cations to sludge and biosolids and determining how they might affect P
speciation. Calcium phosphate species should also be investigated to
determine if and how P binds to calcium.

40
BIBLIOGRAPHY
Alm, R., Sealock, A. W., Nollet, Y., & Sprouse, G. (2016, November). Investigations
into improving dewaterability at bio-P/anaerobic digestion plant. Water
Environment Research, 88(11), 2082-2093.
Anderson, E. (2018). The impact of phosphorous species on dewaterability of wastewater
solids. Master's Theses (2009-), 454. Retrieved from
https://epublications.marquette.edu/theses_open/454/
APHA. (1998). Standard Methods for the Examination of Water and Wastewater, 20th
Edition. Washington, D.C.: APHA.
Chen, G. W., Lin, W. W., & Lee, D. J. (1996). Capilary suction time (CST) as a measure
of sludge dewaterability. Great Britain: Elsevier Science Ltd.
Christensen, M. L., Keiding, K., Nielsen, P. H., & Jørgensen, M. K. (2015). Dewatering
in biological wastewater treatment: A review. Water Research, 82, 14-24.
Feng, X., Deng, J., Lei, H., Bai, T., Fan, Q., & Li, Z. (2009). Dewaterability of waste
activated sludge with ultrasound conditioning. Bioresource Technology, 100(3),
1074-1081.
Higgins, M. J., & Novak, J. T. (1997). The effect of cation of the settling and dewatering
of activated sludges: Laboratory results. Water Environment Research, 69, 215-
224.
Higgins, M. J., Tom, L. A., & Sobeck, D. C. (2006). Case study I: Application of the
divalent cation bridging theory to improve biofloc properties and industrial
activated sludge system performance—direct addition of divalent cations. Water
Environment Research, 76(4), 344-352.
Higgins, M., Bott, C., Schauer, P., & Beightol, S. (2014). Does Bio-P impact dewatering
after anaerobic digestion? Yes, and not in a good way! Proceedings of the Water
Environment Federation, Residuals Biosolids, 1-11.
Houghton, J. I., Quarmby, J., & Stephenson, T. (2001). Municipal wastewater sludge
dewaterability and the presence of microbial extracellular polymer. Water Science
and Technology, 44(2-3), 373-379.
Kappell, A., Harrison, K., & McNamara, P. (2019). Effects of zinc orthophosphate on the
antibiotic resistant bacterial community of a source water used for drinking water
treatment. Environmental Science: Water Research & Technology.
Karr, P. R., & Keinath, T. M. (1978). Influence of particle size on sludge dewaterability.
Water Pollution Control Federation, 50(8), 1911-1930.

41
Lawler, D. F., Chung, Y. J., Hwang, S.-J., & Hull, B. A. (1986, December). Anaerobic
digestion: Effects on particle size and dewaterability. Journal (Water Pollution
Control Federation), 58(12), 1107-1117.
Macintosh, K. A., Mayer, K. M., McDowell, R. W., Powers, S. M., Baker, L. A., Boyer,
T. H., & Rittmann, B. E. (2018). Managing diffuse phosphorus at the source
versus at the sink. Environmental Science & Technology, 52(21), 11995-12009.
Mayer, B. K., Baker, L. A., Boyer, T. H., Drechsel, P., Gifford, M., Hanjra, M. A., . . .
Rittmann, B. E. (2016). Total value of phosphorus recovery. Environmental
Science & Technology, 50(13), 6606-6620.
McNamara, P. J., & Lawler, D. F. (2009). A comprehensive study to reduce polymer
usage at austins biosolids management plant. Proceedings of the Water
Environment Federation. 19, pp. 782-800. Portland OR: Residuals and Biosolids
Conference.
Metcalf & Eddy, Inc. (2003). Wasterwater Engineering: Treatment and Reuse. New
York: McGraw-Hill Education.
Ngwenya, Z., Higgins, M. J., Beightol, S., & Murthy, S. N. (2017). A laboratory based
method for predicting dewaterability. WEF Residuals and Biosolids Conference
2017, 20.
R Core Team. (2018). R: A language and environment for statistical computing. Vienna,
Austria.
Ray, B. T., Lin, J.-G., & Rajan, R. V. (1990). Low-level alkaline solubilization for
enhanced anaerobic digestion. Research Journal of the Water Pollution Control
Federation, 62(1), 81-87.
Scholz, M. (2005). Review of recent trends in capillary suction time (CST) dewaterability
testing research. Industrial & Engineering Chemistry Research, 44(22), 8157-
8163.
Sobeck, D. C., & Higgins, M. J. (2002). Eamination of three thories for mechanisms of
cation-induced bioflocculation. Water Research, 36(3), 527-538.
Venkiteshwaran, K., Benn, N., Seyedi, S., & Zitomer, D. (2019). Methane yield and lag
correlate with bacterial community shift following bioplastic anaerobic co-
digestion. Bioresource Technology Reports, 7.
Venkiteshwaran, K., McNamara, P. J., & Mayer, B. K. (2018). Meta-analysis of non-
reactive phosphorus in water, wastewater, and sludge, and strategies to convert it
for enhanced phosphorus removal and recovery. Science of the Total
Environment, 644, 661-674.
42
Venkiteshwaran, K., Milferstedt, K., Hamelin, J., Fijimoto, M., Johnson, M., & Zitomer,
D. H. (2017). Correlating methane production to microbiota in anaerobic digesters
fed synthetic wastewater. Water Research, 110, 161-169.
Vesilind, P. A. (1988). Capillary suction time as a fundamental measue of sludge
dewaterability. Water Pollution Control Federation, 6.
Vesilind, P. A. (1994). The role of water in sludge dewatering. Water Environment
Research, 8.
Wei, T., & Simko, V. (2016). The corrplot package. CRAN Repos.
Yang, Y., Shi, X., Ballent, W., & Mayer, B. K. (2017). Biological phosphorus recovery:
Review of current progress and future needs. Water Environment Research,
89(12).
Yu, Q., Lei, H., Yu, G., Feng, X., Li, Z., & Wu, Z. (2009). Influence of microwave
irradiation on sludge dewaterability. Chemical Engineering Journal, 155(1-2), 88-
93.

43
APPENDIX
Table A.1: Chemical usage log: record of ferric addition. Days where no ferric was
added were considered to produce bio-P sludge, although some residual ferric may have
still been in the system. * represents days when sludge was pulled from the line and
shipped for use in this study. This was done on a weekly basis, usually every Monday.
Date Ferric addition by operators
9/20/2018 0 *
9/21/2018 991.1
9/22/2018 0
9/23/2018 0
9/24/2018 0 *
9/25/2018 0
9/26/2018 0
9/27/2018 0
9/28/2018 474.3
9/29/2018 0
9/30/2018 174.4
10/1/2018 87.5 *
10/2/2018 0
10/3/2018 0
10/4/2018 686.1
10/5/2018 171.2
10/6/2018 0
10/7/2018 0
10/8/2018 230.6 *
10/9/2018 473.2
10/10/2018 0
10/11/2018 658.1
10/12/2018 0
10/13/2018 0
10/14/2018 0
10/15/2018 0 *
10/16/2018 182.9
10/17/2018 0
10/18/2018 0
10/19/2018 0
10/20/2018 0
10/21/2018 0
10/22/2018 0 *
10/23/2018 0
10/24/2018 0

44
10/25/2018 0
10/26/2018 226
10/27/2018 0
10/28/2018 0
10/29/2018 0 *
10/30/2018 0
10/31/2018 0
11/1/2018 0
11/2/2018 0
11/3/2018 0
11/4/2018 0
11/5/2018 247.5 *
11/6/2018 146.3
11/7/2018 123.8
11/8/2018 228.3
11/9/2018 419.7
11/10/2018 298.1
11/11/2018 0
11/12/2018 437 *
11/13/2018 53.2
11/14/2018 195.6
11/15/2018 107.8
11/16/2018 916.5
11/17/2018 0
11/18/2018 0
11/19/2018 1,028.40 *
11/20/2018 956.7
11/21/2018 0
11/22/2018 0
11/23/2018 118
11/24/2018 641.3
11/25/2018 337.5
11/26/2018 0 *
11/27/2018 47.7
11/28/2018 0
11/29/2018 0
11/30/2018 641.3
12/1/2018 0
12/2/2018 281.3
12/3/2018 570.4
12/4/2018 899.9
12/5/2018 180
12/6/2018 0
12/7/2018 0

45
Figure A.1: Additional correlation plots comparing CST to various biosolids
characteristics.
46
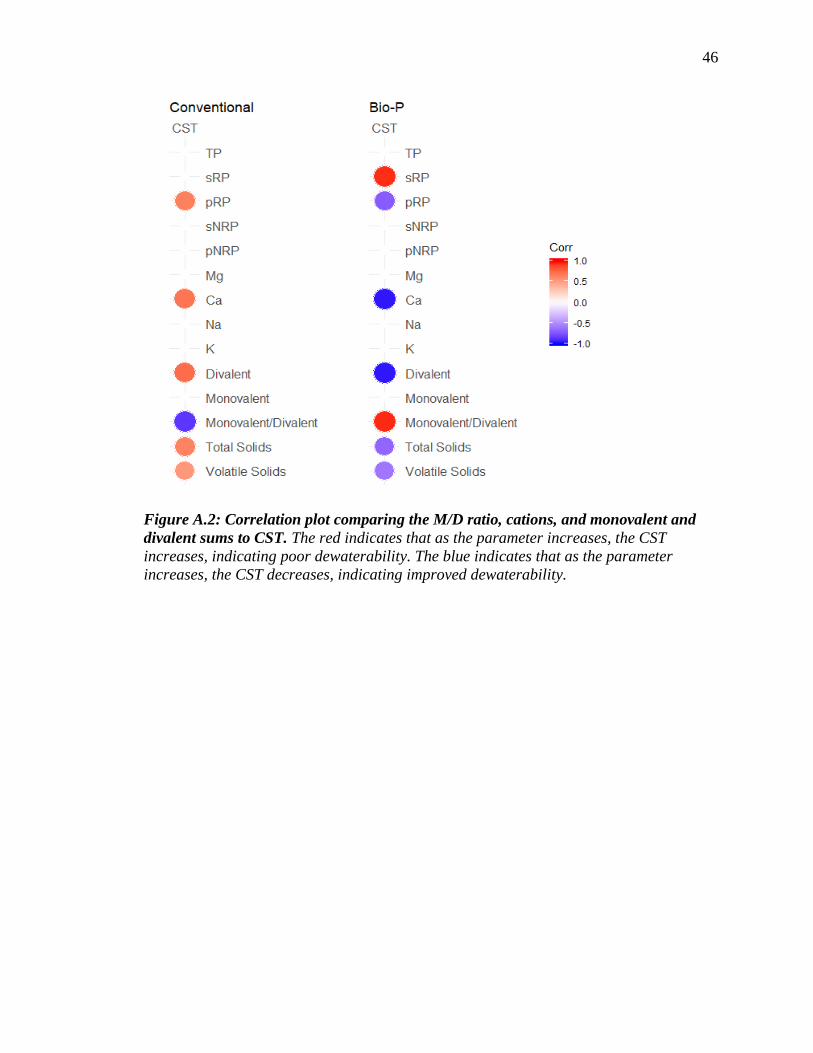
Figure A.2: Correlation plot comparing the M/D ratio, cations, and monovalent and
divalent sums to CST. The red indicates that as the parameter increases, the CST
increases, indicating poor dewaterability. The blue indicates that as the parameter
increases, the CST decreases, indicating improved dewaterability.