the impact of mean climate on enso: simulation and … · 3 the motivation of this study 1. major...
TRANSCRIPT

1
The Impact of Mean Climate onThe Impact of Mean Climate onENSO: Simulation and PredictionENSO: Simulation and Prediction
Xiaohua Xiaohua PanPanBohua Bohua HuangHuang
J. J. ShuklaShuklaGeorge Mason UniversityGeorge Mason University
Center for Ocean-Land-Atmosphere studies(COLA)Center for Ocean-Land-Atmosphere studies(COLA)
NOAA’s 33rd CDPW workshop Oct. 20-24, 2008

2
The Mean Climate in The TropicalThe Mean Climate in The TropicalPacific from ObservationsPacific from Observations
East-West asymmetric structureEast-West asymmetric structure: east-cold tongue: east-cold tongue& west-warm pool; easterly& west-warm pool; easterly
South-North asymmetric structureSouth-North asymmetric structure: south-cold: south-coldtongue & north-warm water; southerly; ITCZtongue & north-warm water; southerly; ITCZ
How important
1. Annual cycle
(Xie 1994)
2. Walker circ.
3. Bjerknes(1969)
(Shading) SST, ( Vector) Wind stress

3
The motivation of this studyThe motivation of this study1.1. Major goalMajor goal: Investigate : Investigate the impact ofthe impact of
mean climate on the simulation andmean climate on the simulation andprediction of ENSOprediction of ENSO by looking into one by looking into oneCGCM (CCSM3, developed by NCAR)CGCM (CCSM3, developed by NCAR)
2.2. Provide some information about theProvide some information about theprediction skill of ENSO with CCSM3prediction skill of ENSO with CCSM3,,which has been considered as one partwhich has been considered as one partof national Multi-model ensemble inof national Multi-model ensemble inoperational forecasts.operational forecasts.
4
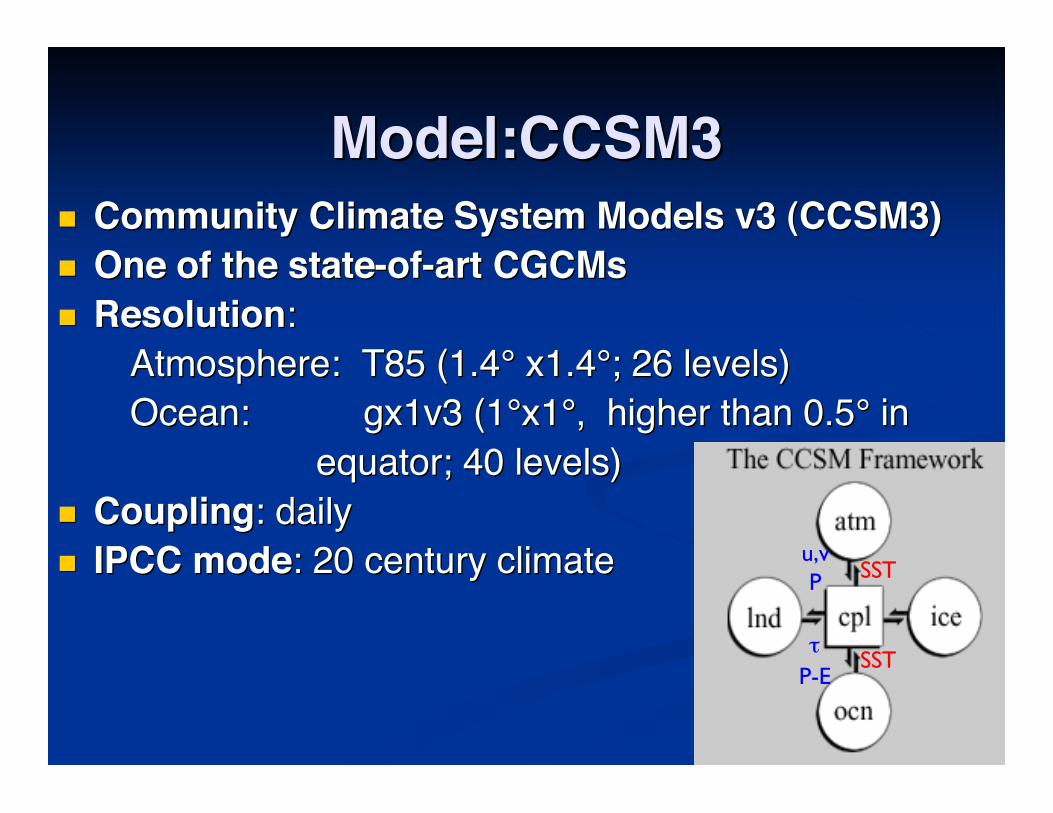
Model:CCSM3Model:CCSM3 Community Climate System Models v3 (CCSM3)Community Climate System Models v3 (CCSM3) One of the state-of-art One of the state-of-art CGCMsCGCMs ResolutionResolution:: Atmosphere: Atmosphere: T85 (1.4T85 (1.4°° x1.4 x1.4°°; 26 levels); 26 levels) Ocean: gx1v3 (1Ocean: gx1v3 (1°°x1x1°°, higher than 0.5, higher than 0.5°° in in equator; 40 levels)equator; 40 levels) CouplingCoupling: daily: daily IPCC modeIPCC mode: 20 century climate: 20 century climate
SST
SSTu,vP
τP-E

5
SST biases of mean climateSST biases of mean climatein CCSM3in CCSM3

6
:SST biases of mean climate in controlR: relaxation coef, adjustable, unit W/(m2K)
• Annual-varying• Purpose
SST
SSTu,vP
τP-E
∆Q
€
ΔQ = −ΔSST *R
Experiment design: Heat flux correction
∆Q, R=10€
ΔSST
55 years
(Refer to Manganello and Huang 2008)

7
Mean climate:Mean climate:SST & wind stressSST & wind stress
control
flx Bias of flx
Bias of control
8
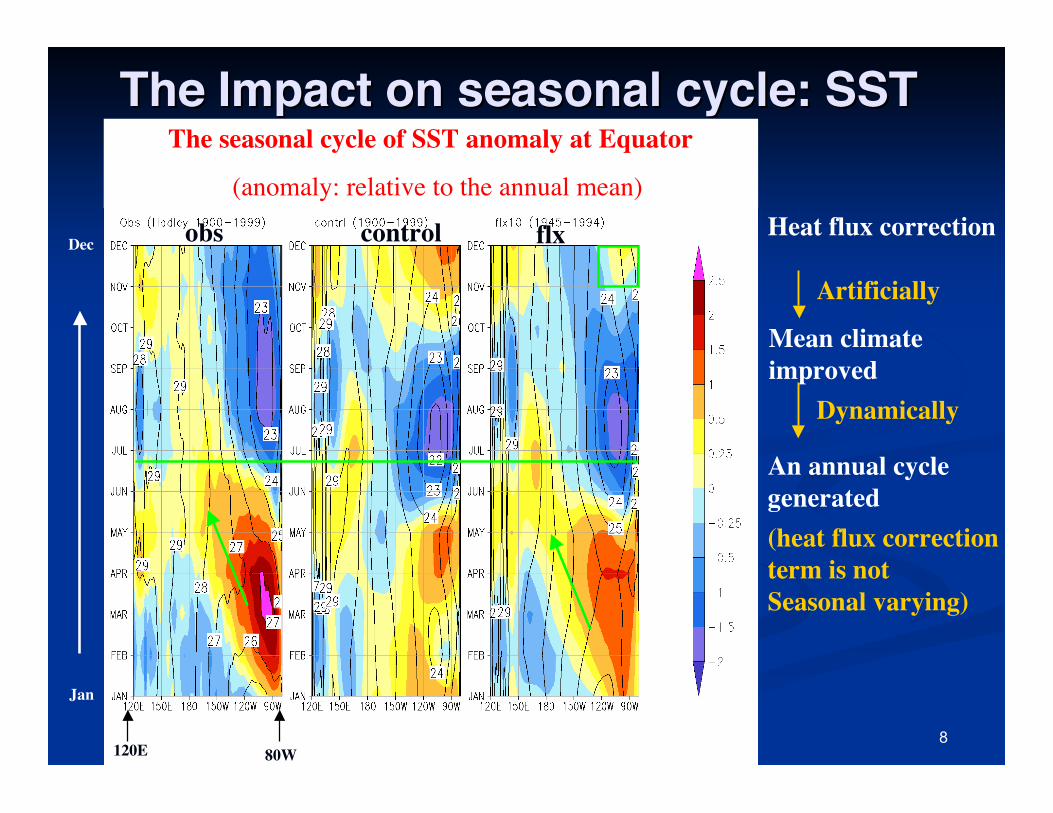
The Impact on seasonal cycle: SSTThe Impact on seasonal cycle: SST
obs control flx Heat flux correction
Mean climateimproved
An annual cycle generated
Artificially
Dynamically
The seasonal cycle of SST anomaly at Equator
(anomaly: relative to the annual mean)
(heat flux correction term is notSeasonal varying)
120E 80W
Jan
Dec

9
How is a persistent southerlyHow is a persistent southerlygenerated?generated?
Constant cooling in the south (by design)
Air mass is denser in south
Southerly blows from south to north Evaporation and upwelling
Sea water in the south cool down
More realistic SST north-south asymmetry

10
The seasonal variation ofthe southerly (TauY) at Eqt
control flxobs

11
Seasonal variation of cold tongue
evaporation
Seasonal variation of southerlyobs control flx
Weak cold tongue
strong cold tongue
SST anomaly
TauY
How is an annual cycle of SSTIs generated? (dynamically)
obs control flx
12
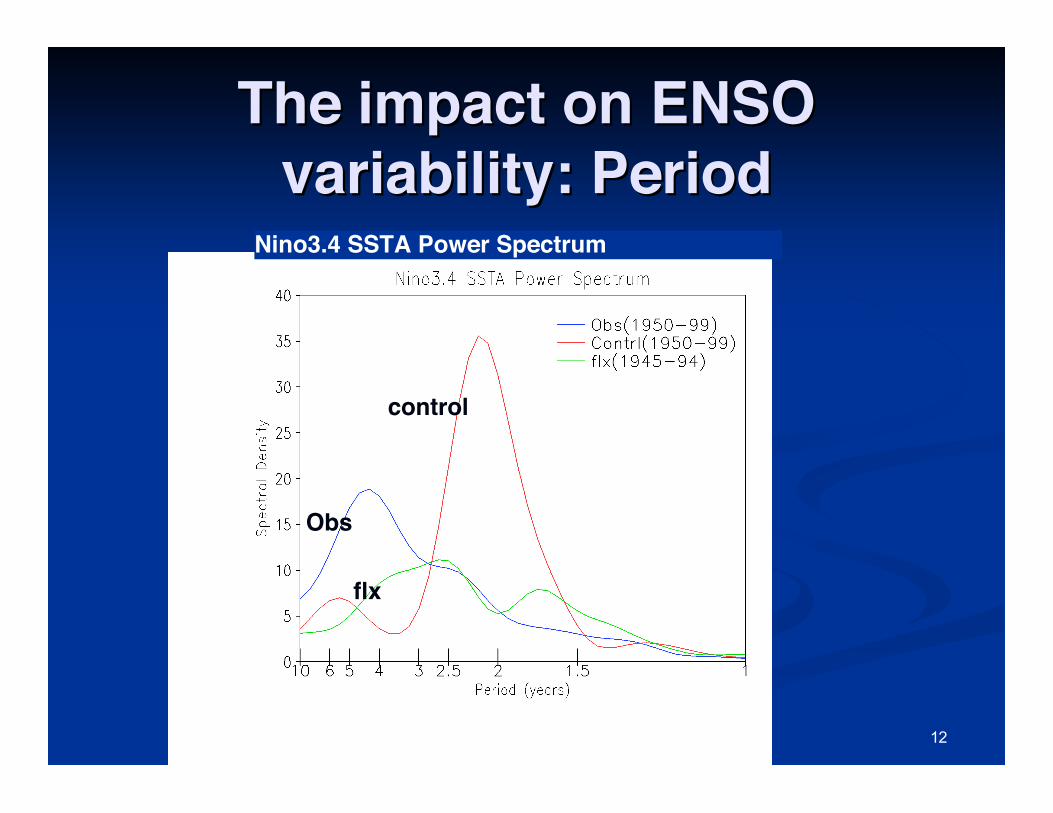
The impact on ENSOThe impact on ENSOvariability: Periodvariability: Period
Nino3.4 SSTA Power Spectrum
Obs
flx
control
13
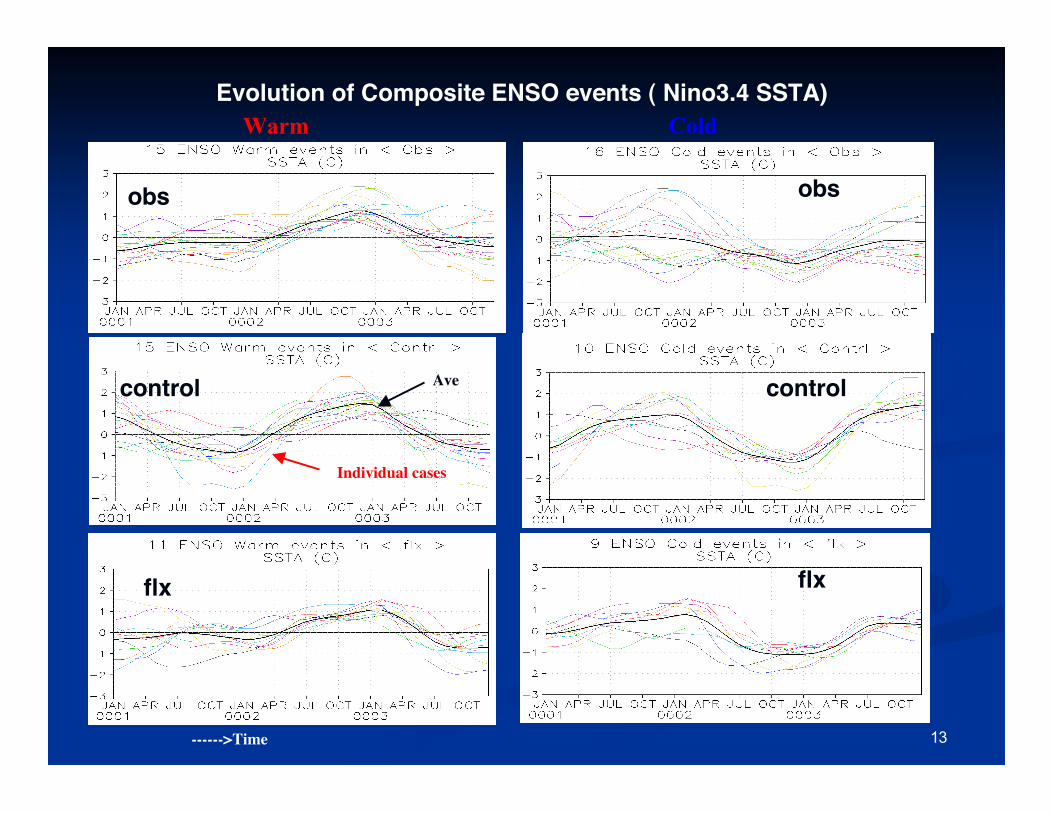
Warm Cold
Individual cases
Ave
Evolution of Composite ENSO events ( Nino3.4 SSTA)
obs
flx
control
obs
flx
control
------>Time
14
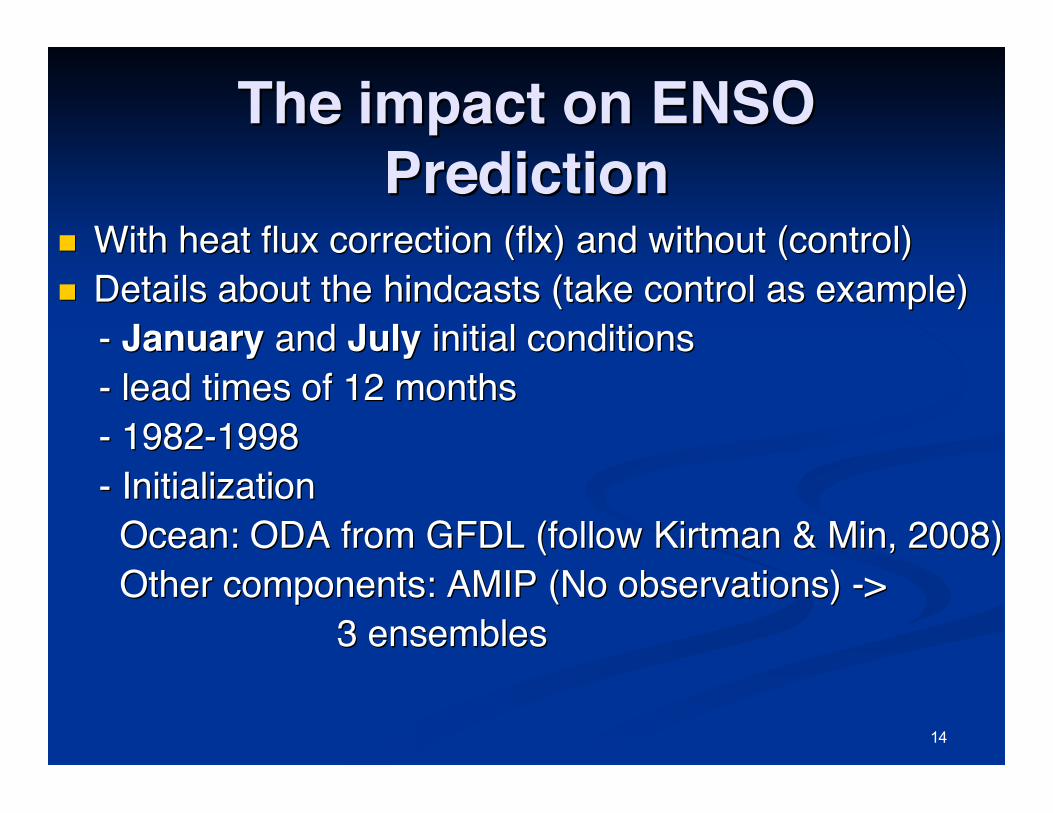
The impact on ENSOThe impact on ENSOPredictionPrediction
With heat flux correction (With heat flux correction (flxflx) and without (control)) and without (control) Details about the Details about the hindcasts hindcasts (take control as example)(take control as example) - - JanuaryJanuary and and JulyJuly initial conditions initial conditions - lead times of 12 months - lead times of 12 months - 1982-1998 - 1982-1998 - Initialization - Initialization Ocean: ODA from GFDL (follow Ocean: ODA from GFDL (follow Kirtman Kirtman & Min, 2008)& Min, 2008) Other components: AMIP (No observations) -> Other components: AMIP (No observations) -> 3 ensembles3 ensembles
15
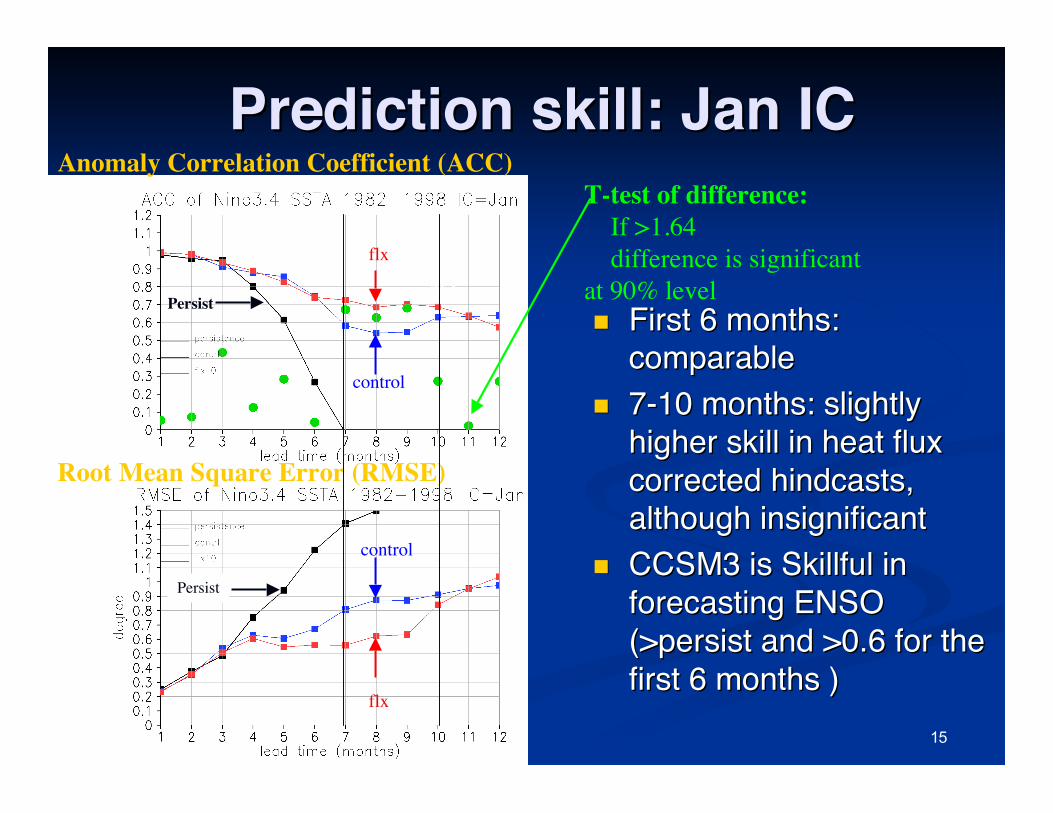
Prediction skill: Jan ICPrediction skill: Jan IC
First 6 months:First 6 months:comparablecomparable
7-10 months: slightly7-10 months: slightlyhigher skill in heat fluxhigher skill in heat fluxcorrected corrected hindcastshindcasts,,although insignificantalthough insignificant
CCSM3 is Skillful inCCSM3 is Skillful inforecasting ENSOforecasting ENSO(>persist and >0.6 for the(>persist and >0.6 for thefirst 6 months )first 6 months )
ACC
RMSE
Anomaly Correlation Coefficient (ACC)
Root Mean Square Error (RMSE)
T-test of difference: If >1.64 difference is significantat 90% level
Persist
control
flx
control
flx
Persist

16
Prediction skill: July ICPrediction skill: July IC
RMSE
First 8 months:First 8 months:comparablecomparable
9-11 months: slightly9-11 months: slightlyhigher skill in heat fluxhigher skill in heat fluxcorrected corrected hindcastshindcasts,,although insignificantalthough insignificant
CCSM3 is Skillful inCCSM3 is Skillful inforecasting ENSOforecasting ENSO(>persist and >0.6 for(>persist and >0.6 forthe first 9 months )the first 9 months )
PersistenceControlflx
ACC
ACC
RMSE
T-test of difference If >1.64 Difference is significant at 90%level
control
flx
Persist

17
SummarySummary1. The mean climate 1. The mean climate is is improvedimproved in the heat flux in the heat flux
corrected simulation with reduced warm biases incorrected simulation with reduced warm biases incoast of Peru and a persistent southerly.coast of Peru and a persistent southerly.
2. An annual cycle of SST2. An annual cycle of SST in the eastern Pacific is in the eastern Pacific isgenerated because of the more realisticgenerated because of the more realisticasymmetry in the mean climate thereasymmetry in the mean climate there
suggest suggest……3. The ENSO3. The ENSO behavior is behavior is sensitivesensitive to the to the
improvement of mean climate (irregular cycle,improvement of mean climate (irregular cycle,longer period);longer period);
4. There is a 4. There is a slightly higher slightly higher prediction skill of ENSOprediction skill of ENSOby improving the mean climate, although itsby improving the mean climate, although itsrobustness needs verification.robustness needs verification.

18
ReferencesReferences Bjerknes, J., 1969: Atmospheric teleconnections from the equatorial Pacific.
Mon. Wea. Rev., 97, 163–172. Kirtman, B. P. and D. Min, 2008: Multi-Model Ensemble Prediction with
CCSM and CFS. Mon. Wea. Rev. (in press). Manganello, Julia V.; Huang, Bohua, 2008: The influence of systematic
errors in the Southeast Pacific on ENSO variability and prediction in acoupled GCM. Climate Dynamics, DOI:10.1007/s00382-008-0407-5.
Xie, S.P., 1994: On the Genesis of the Equatorial Annual Cycle. J. Climate,7, 2008–2013.