the impact of maternal literacy and participation programs ... · the impact of maternal literacy...
TRANSCRIPT
The Impact of Maternal Literacy and ParticipationPrograms: Evidence from a Randomized Evaluation in
India
By Rukmini Banerji, James Berry, and Marc Shotland∗
February 2017
Using a randomized field experiment in India, we evaluate theeffectiveness of adult literacy and parental involvement interven-tions in improving children’s learning. Households were assignedto receive either (1) adult literacy (language and math) classes formothers, (2) training for mothers on how to enhance their chil-dren’s learning at home, or (3) a combination of the two programs.All three interventions had significant but modest impacts on chil-dren’s math scores. The interventions also increased mothers’ testscores in both language and math, as well as a range of other out-comes reflecting greater involvement of mothers in their children’seducation.JEL: C93, D13, I21, O15Keywords: adult education, education inputs, field experiments
Improving the quality of education in the developing world remains a crucialissue for researchers and policymakers alike. In many developing countries, de-spite gains in educational attainment, learning levels are abysmally low, bothwhen compared with developed countries and with national learning standards(Pritchett, 2013). For example, a 2011 survey in India found that less than halfof fifth-grade children could read at a second-grade level (ASER Centre, 2012).
In searching for methods to improve levels of learning in developing countries,much of the policy discussion focuses on investments that can be made to improve
∗ Banerji: Pratham and ASER Centre, [email protected]; Berry: Cornell University,[email protected]; Shotland: Abdul Latif Jameel Poverty Action Lab, [email protected]. We thankAnnie Duflo for collaboration and insights on the study design and implementation. We also thankDavid Evans, Eric Edmonds, Marcel Fafchamps, Karthik Muralidharan, Hugo Reis, and seminar partici-pants at the Berlin Social Science Center, Cornell University, Duke University, the NBER Education andChildren’s Meeting, the Northeast Universities Development Consortium Conference, UC Santa Cruz,the University of Buffalo, and the World Bank for useful comments and suggestions. We are incredi-bly grateful to Vipin Awatramani, Jessica Chan, Diva Dhar, Nandini Gupta, Ravi Gupta, Rachna NagChowdhuri, and Nikhil Wilmink for superb work coordinating the field activities in Rajasthan and Bihar.Kevin Kho, Laurel Wheeler, and Raymond Lee provided excellent research assistance. This research wasfunded by the International Initiative for Impact Evaluation. The project was reviewed and approved bythe Massachusetts Institute of Technology Committee on the Use of Humans as Experimental Subjects,protocol #1102004358. We acknowledge that Rukmini Banerji is the CEO of Pratham, which representsa potential conflict of interest. She was involved in the design of the program and the evaluation, theimplementation of the program, and the final paper review, but not with the data collection and theanalysis of the data. All errors are our own.
schools, such as improving school infrastructure, providing additional learning ma-terials, changing pedagogy, or improving teacher selection or incentives. Indeed,there is a growing evidence base of such cost-effective in-school interventions thatcan improve learning outcomes in developing countries (Kremer et al., 2013).
Beyond investments that governments can make in schools, evidence suggeststhat parents, and in particular mothers, also play an important role in children’slearning—through activities at home as well as through decisions that interactwith the formal schooling system. The literature on intergenerational transmis-sion of human capital shows that more educated (or, in some cases, more literate)mothers make decisions that improve their children’s learning (Andrabi, Das,and Kwajha, 2012; Behrman, Foster, and Rosensweig, 1999; Guryan, Hurst, andKearney, 2008). The direct policy implications from this research imply thatinvesting in the education of today’s children, particularly girls, should have pos-itive spillovers on their children in the future. This literature does not, however,reveal obvious policy solutions for today’s children who live with today’s unedu-cated parents. There are nearly one billion adults worldwide who are currentlyilliterate (UNESCO, 2015).
To address low levels of adult literacy, a number of developing countries havelaunched ambitious adult literacy education campaigns.1 For example, in 2009the government of India launched the Saakshar Bharat adult literacy campaign,with a goal of bringing literacy skills to 70 million adults and reducing the gendergap in literacy. In South Africa, the Kha Re Gude Mass Literacy Programme waslaunched in 2008, aiming to reach 4.7 million adults by 2012. These campaignsoften focus on women in order to address gender inequality in literacy and topromote women’s empowerment (UNESCO, 2015).
Although the primary motivation of initiatives like these has been to improvethe livelihoods of adult beneficiaries, also listed among the instrumental benefitsare improvements in the education of children (Abadzi, 2003; UNESCO, 2005b).Specifically, many of the intermediate outcomes through which parents’ educa-tional attainment leads to children’s learning could also be activated by thesetypes of programs. For example, such programs could provide parents with theskills to facilitate children’s learning at home and foster an interest in children’seducation. This could lead to increased participation in learning at home, moreeffective participation, increased availability of educational assets at home, orgreater interest in formal schooling. By targeting women, the programs couldalso influence child education by increasing decision making power of mothers inthe household, under the assumption that child education is a higher priority formothers than for fathers.
However, while adult literacy education may provide parents with the skillsand interest to participate more in their children’s education, for those who werenever formally educated, these programs may not be sufficient to provide them
1With respect to adult literacy programs, “literacy” typically encompasses reading, writing, and basicmathematics. See UNESCO (2005a) for a discussion of the definition of literacy.
2

with knowledge of how specifically they can participate. If a key constraint to fa-cilitating children’s learning at home is parents’ lack of understanding of how theycan participate, parental “participation training” that provides direct instructionon how they can be involved may prove more effective. For example, parental par-ticipation programs could train parents to monitor their children’s completion ofhomework, or to understand the symbols teachers use to grade homework. Adultliteracy and participation programs may also be complementary if parents needskills and the experience of learning, along with instruction on participation, inorder to support their children’s learning.
Although adult literacy and participation programs could serve as importanttools to improve children’s education outcomes in developing countries, there arereal challenges that may limit their effectiveness. Adults in developing countrieshave many competing demands on their time, and without immediate monetarybenefits, these programs may not be seen as valuable relative to work, home pro-duction, or leisure activities (Wagner, 2000; Abadzi, 2003). Even when adultsare motivated to participate regularly, part-time programs may not be extensiveenough for formerly-illiterate parents to develop the skills necessary to supporttheir children’s learning. Whether these programs are effective in improving chil-dren’s education outcomes is thus an empirical question.
To address this question, we conducted a randomized evaluation of three inter-ventions in rural India designed to improve maternal literacy—defined to includereading, writing, and basic mathematics—and mothers’ involvement in children’seducation. Villages were randomly assigned to one of four groups. In the firstgroup, mothers in the village were offered the Maternal Literacy (ML) program,consisting of daily language and math classes. In the second, mothers were giventhe Child Home Activities and Materials Packet (CHAMP) program: materials,activities, and training were provided each week to promote enhanced involve-ment in their children’s education at home. In the third, mothers were offeredboth the literacy and home-learning programs (ML-CHAMP). The fourth groupserved as a control with no intervention. The evaluation was carried out in 480villages in the states of Bihar and Rajasthan.
We find that the programs had small positive impacts on children’s learninglevels: the ML, CHAMP, and ML-CHAMP interventions resulted in statistically-significant increases in children’s math scores by 0.035, 0.032, and 0.056 standarddeviations, respectively. The only significant impacts on language scores camefrom the combined ML-CHAMP intervention.
We also provide evidence that the programs improved mothers’ learning out-comes and indicators of participation and investments associated with improvedchildren’s learning. The three interventions increased mothers’ overall test scoresby 0.096, 0.043, and 0.12 standard deviations, respectively. All three programshad impacts on mothers’ participation in their children’s education and on avail-ability of education assets in the household, while the ML and ML-CHAMPprograms had impacts on formal school attendance. By contrast, we find no
3

significant impacts on mothers’ time spent directly helping the children withhomework. The programs also had limited impacts on mothers’ involvement inhousehold decision making, as the only statistically significant impact arose fromthe combined ML-CHAMP intervention.
The evidence supports our hypothesis that the home learning environment canbe improved through these programs and provides suggestive evidence that doingso resulted in increased learning of children. However, a key caveat to this inter-pretation is the possibility that the programs affected children directly. Indeed,we observed both attendance of children in ML classes and direct participationof children in CHAMP activities.
While we cannot rule out the possibility of these direct impacts, we presentsuggestive evidence that in the case of ML, the impacts we observe on children’stest scores were largely driven by mothers’ participation in ML classes. We alsoshow that changes in mothers’ learning levels, participation in their children’seducation, presence of educational assets in the home, and children’s school at-tendance account for almost all of the impacts of ML on children’s learning. Inthe case of CHAMP, these intermediate outcomes account for a smaller fractionof the impacts, and therefore direct participation of children could have played agreater role.
From a standpoint of policy, we note that the magnitudes of the effects we findon children’s learning are small, and basic cost-benefit calculations suggest thatother interventions that target children directly are more cost effective. Thus, theinterventions as implemented may not be the most effective policies to improvechildren’s learning. In the case of ML, we observe relatively low participationand argue that evaluation of innovations to increase participation and sustainlearner interest would be a useful area for future research. In addition, whilethe magnitudes of the impacts may not justify the programs on the basis ofchildren’s learning alone, the effects we find on mothers’ learning suggest thatthese programs could be promising tools for policy makers interested in influencingadult literacy as well as children’s learning.
Our study contributes to several strands of literature. First, it is one of onlytwo randomized evaluations of developing-country adult literacy programs thatwe know of and the first to study spillovers on children. Early studies find signif-icant effects of adult literacy programs on learning of adults, but these impactsare identified using ex-post comparisons with non-participants (Carron, 1990; Or-tega and Rodriguez, 2008). Aker et al. (2011) conduct a randomized evaluationof a program that provided cell phones to participants in existing adult educa-tion classes in Niger and find significant impacts of the cell phone program onparticipants’ writing and math scores. However, there is no evaluation of theadult literacy program, per se. Most recently, Aker and Ksoll (2015) conduct anevaluation of an adult literacy program in Niger that included both a standardadult literacy program and adult literacy plus additional monitoring. The re-searchers find impacts of approximately 0.2 standard deviations on reading and
4
math scores of adults, with significantly larger effects when monitoring was in-cluded. Research on the effects of adult literacy programs on children’s outcomesis even more sparse, and existing studies rely on retrospective selection of com-parison groups (Aoki, 2005; Abadzi, 2003).2
Second, our study contributes to the limited literature evaluating parental par-ticipation programs in developing countries, where parents have little or no ex-perience with formal education. Kagitcibasi, Sunar, and Bekman (2001) conducta randomized evaluation of a small-scale program in Turkey that included botha home learning component and training in general parenting skills for mothersof preschool-aged children. The authors find positive impacts on primary schoolenrollment and academic performance in subsequent years. Several recent studiesevaluate programs to encourage parental participation in management of schools,with mixed results on effectiveness (Banerjee et al., 2010; Duflo, Dupas, andKremer, 2015; Gertler, Patrinos, and Rubio-Codina, 2008).3 In developed coun-try contexts, rigorous evidence on the effects of participation programs is alsolimited, and the existing evidence is mixed (Avvisati et al., 2010). A recent large-scale randomized evaluation of a program in a poor school district in France thataimed to enhance parental involvement in the education of adolescent childrenfound significant positive effects on parental involvement and on student behav-ior in school, though there were no detectable effects on test scores (Avvisati etal., 2014).
The remainder of our paper is structured as follows. Section I discusses thecontext and programs. Section II covers the evaluation design and data collec-tion. Section III analyzes program take-up. Section IV describes the results. Weprovide discussion of the results in Section V and conclude in Section VI.
I. Program Description
A. Context
The programs in this study were designed and implemented by Pratham, a non-governmental organization (NGO) specializing in child literacy and numeracy.4
Pratham conducted the interventions in two blocks (district subdivisions) of thePurnia district in Bihar and two blocks of the Ajmer district in Rajasthan. Biharand Rajasthan were selected by Pratham based on the low literacy levels of thetwo states. According to the 2011 Census of India, these states have the lowestfemale literacy rates in India (Government of India, 2011). The interventiondistricts within each state were selected because of existing Pratham programs and
2Although there are numerous evaluations of adult literacy programs in the U.S., much of the researchalso suffers from methodological limitations (Beder, 1999).
3Our study also relates to the small but growing literature evaluating early-childhood stimulationinterventions in developing countries which typically focus on development of children aged 0 to 3 (seeBaker-Henningham and Lopez Boo, 2010 for a review). The interventions we study here differ in thatthey focus on households with school-aged children.
4For more information, see http:\\www.pratham.org.
5
infrastructure in those areas. Within the intervention districts, the study blockswere selected because they did not have any pre-existing Pratham programs.
In online Appendix Table A1 we use data from the 2011 Census of India and2011 Annual Status of Education Report (ASER) surveys to compare the in-tervention states, districts, and blocks with our evaluation data (Government ofIndia, 2011; ASER Centre, 2012). According to the Census, households in Ra-jasthan are more likely to have electricity than those in Bihar (58 percent com-pared with 10 percent) and have higher ownership rates of costly durable goodssuch as televisions, mobile phones, and motorcycles. Literacy rates, children’sschool attendance, and children’s learning levels are broadly similar between thetwo states. Within each state, the intervention districts follow similar patterns tothe state-wide averages, with slightly lower rates of female literacy and children’sschooling outcomes in both the Rajasthan and Bihar intervention districts com-pared with the state-wide averages. Characteristics in the intervention blocks arelargely similar to those of the broader districts.5
As in the census data, households in our sample displayed generally higherasset ownership in Rajasthan than in Bihar and substantially higher likelihoodof having electricity (81 percent compared with 15 percent). Households in oursample have higher levels of asset ownership than those in the blocks as a whole,which could be due to our selection criteria leading to larger households. Wealso observe lower levels of school attendance in our sample than the district-level ASER data indicate. This difference could be due to a difference in surveytiming: the ASER surveys took place in the fall of 2011, while the surveys for thisevaluation took place during the summer vacation period just after the beginningof the school year.
Running the interventions in multiple states in different areas of the countryaids external validity of the evaluation. Although the interventions were identicalin both states, they were implemented by different local teams and supervised byseparate state-level Pratham leadership. And while learning levels in both stateswere similar, the differences in wealth and preexisting activities of the motherspresented distinct implementation challenges in each area.6
B. Intervention Descriptions
Each of the three interventions was implemented between September 2011 andJune 2012. Recruitment of mothers for each program was focused on womenwith children aged 5 to 8. It was hypothesized that the programs would have thegreatest effects on children that were just beginning to develop the most basicreading and math skills. The mothers of these children (referred to as “target
5These comparisons suggest that Pratham may have been targeting districts with worse educationoutcomes within states for its programs in general, but the intervention blocks are largely representativeof these districts.
6In online Appendix A we explore heterogeneity in the program effects on children’s and mothers’learning by state.
6
mothers”) were identified from a census of communities selected to receive theprograms (see Section II).
The Maternal Literacy (ML) intervention consisted of daily literacy classesheld in the villages and was modeled after Pratham’s community-based classesfor children (see Banerjee et al., 2010). Classes were taught by volunteers whowere recruited from within the villages and were given several days of trainingfrom Pratham staff before setting up classes. Classes were to be held for twohours per day, six days per week, at a time and place identified by mothers to bethe most convenient. While ML classes were open to any who wished to attend,Pratham staff and volunteers were given a list of target mothers to recruit into theclasses. Volunteers received several refresher trainings and ongoing supervisionby Pratham staff throughout the intervention.
Within ML classes, volunteers utilized a version of Pratham’s “Read India”methodology to teach basic language and math skills. This approach, previouslyshown effective in teaching children to read (Banerjee et al., 2010), was modi-fied to suit the interests of adults. Because most mothers started with very lowlanguage and math skills, the programs focused on the most basic competencies.Pratham’s prior experience with adult literacy interventions indicated that moth-ers were more interested in learning math, and responding to this demand, theprogram placed more emphasis on basic math skills than on language skills. Mathactivities included counting, number recognition, addition and subtraction, andactivities with currency. The language component provided instruction on letterrecognition, reading basic words, and writing names. Each week, volunteers alsopresented short topical paragraphs to facilitate discussion among mothers. Theparagraphs contained messages about decisions mothers could make for them-selves or their families, particularly in relation to family health, women’s em-ployment, government programs, and to a lesser extent, the value of educatinggirls.7
The direct objective of the ML classes was to increase language and math skillsof mothers. The weekly discussion topics, as well as the opportunity to meet ingroups of women, were designed to promote empowerment, particularly mothers’ability and confidence to make decisions for themselves or for their households.Skills taught in the classes could also increase mothers’ capabilities to make suchdecisions.
Our primary hypothesis was that the ML intervention would improve children’slearning outcomes. This could arise if the skills learned, exposure to the learn-ing process, and opportunity for discussion about education increased mothers’interest and participation in their children’s education. The intervention couldthereby change the type and quality of participation at home, time spent withchildren, education assets at home, aspirations for children, or schooling behavioroutside of the home. We note that while two of the 34 weekly discussion topicsrelated to the benefits of educating girls, there were no specific program com-
7Of 34 topics, two related to girls’ education.
7
ponents providing instruction on participation in children’s learning. Althoughmothers were the sole focus of class activities, children were not prohibited fromattending class and listening passively or following along with their mothers, andcould have thereby directly benefited from attending classes themselves. As weshow in Section III below, some study children attended both with their moth-ers and by themselves. We discuss the potential for direct effects on children inSection V.A.
The Child and Mother Activities Packet (CHAMP) intervention was designedto directly encourage mothers to be engaged with their children’s learning, fo-cusing on activities with 5 to 8-year-old children in the household. Unlike thevolunteers who implemented the ML intervention, CHAMP implementers werepaid Pratham staff who often had prior experience as Pratham volunteers or su-pervisors.8 Pratham decided to use paid implementers primarily because eachimplementer was responsible for conducting CHAMP in specific households infive separate villages, and Pratham believed that unpaid volunteers would not bewilling to take on these responsibilities. These implementers were given aboutone week of training by senior Pratham staff and met together several times permonth to review upcoming activities.9
Once per week during the intervention period, the CHAMP implementer was tovisit each target mother and give her a worksheet to help her child complete andinstruction on how to be involved in her child’s learning.10 Each worksheet con-tained several written language or math activities that the mother was instructedto help the child complete in the following week. The activities focused on first-grade language and math skills. For example, some worksheets instructed thechild to write the letters of the alphabet or a sequence of numbers. In about halfof the sessions, the mother received direct instruction on encouraging the childto do schoolwork at home, reviewing the child’s school notebooks, and discussingprogress with the child’s school teacher. Some visits also included instruction onactivities that the mother could do with her child such as sharing stories, tellingtime, or supervising simple writing exercises. Each weekly visit lasted approxi-mately 10 to 20 minutes. When the mother was not available, the CHAMP sessionwas conducted with another adult member of the household when possible.
The primary objective of CHAMP was to improve children’s learning by in-volving the mother in the process. Mothers were shown how to participate intheir children’s learning and were encouraged to spend more time on educationalactivities with their children. Beyond increasing participation of the mother, the
8Hiring staff with prior Pratham experience was not strictly necessary for the program, but Pratham’spractices for recruiting paid staff for new projects often consist of promoting successful volunteers orreallocating existing staff to from previous projects.
9The staff who implemented CHAMP were also responsible for supervising volunteers in ML. Thiswas primarily for logistical reasons, as the evaluation required multiple interventions to be conducted inthe same areas. However, because the ML and CHAMP interventions were distinct, we do not view themultiple roles of these staff as important to our results.
10When the mother had more than one child aged 5 to 8, she was given multiple worksheets andinstructed to do the activities with each child in this age group.
8
program’s encouragement of home learning could also result in an increase ineducation assets available at home. Finally, the experience of participating inchildren’s learning could foster a broader interest in child education, resulting inincreased aspirations for children and increased school attendance.
In addition to its effects on children, CHAMP could also improve the learningand empowerment of mothers. Although the intervention did not directly pro-vide math or language instruction to mothers, increased exposure to children’seducation and interactions with CHAMP implementers could result in increasedlearning of mothers. Empowerment of mothers could also increase as a result ofthe program, through increases in learning, or through the experience of partici-pating in their children’s education.
As with ML, there was a possibility of direct effects of CHAMP on childrenbeyond the involvement of the mother. CHAMP sessions were typically heldat the mothers’ homes, and children could be present during these sessions. Inaddition, the worksheets provided at each session could have been completedwithout the involvement of the mother. We present evidence on children’s directparticipation in CHAMP in Section III below.
The combined intervention (ML-CHAMP) included both the ML and CHAMPprograms. The combined intervention was not integrated—ML and CHAMP weresimply conducted in the same villages with the same target group of mothers.As in the separate interventions, ML classes were conducted by volunteers, andCHAMP visits were conducted by separate Pratham staff. The ML-CHAMPintervention was designed to test whether both mothers’ exposure to learning fromML and instruction on how to facilitate learning at home from CHAMP wouldbe necessary for mothers to engage with their children and improve children’slearning. It also allows us to test whether one program “crowded out” another, inwhich case the impacts would not increase when both programs were implementedtogether.
Although the programs were scheduled to be held from September 2011 throughJune 2012, the agricultural cycle led to lapses in implementation during thisperiod. Programs were run between September 2011 and February 2012, uponwhich time the harvest season began in both states. In Bihar, both ML andCHAMP continued with lower intensity in March and April, upon which timethey stopped running. In Rajasthan, programs were halted in March and Apriland began again in May and June.
II. Research Design
A. Treatment Assignment
In each state, 240 hamlets (village subdivisions) were selected for the random-ization. Hamlets were selected based on a target number of households (theapproximate size that could support one maternal literacy class) and geographic
9

distance from other target locations to limit spillovers. In Rajasthan, where vil-lages are geographically distinct, one hamlet per village was randomly selectedamong those determined to be large enough to support a maternal literacy class.In Bihar, where hamlets may be close to one another (whether in the same vil-lage or in different villages), hamlets of the target size were included if they weresufficiently far from other included hamlets.11 For ease of exposition, we refer tothe randomization unit as a “village” throughout.
In each state, the 240 study villages were randomly assigned in equal propor-tions to the control group or to one of the three treatment groups. Randomizationwas stratified geographically to allow Pratham to organize its training and moni-toring structure based on a known number of program villages in a fixed area. The240 villages in each state were first divided into geographically proximate “sets”of 20 villages. Each set was then split into two “phases” consisting of 10 villageseach. These phases determined the order of the rollout of the programs. Withineach set of 20 villages, the Pratham team first initiated the interventions in Phase1 villages and began in Phase 2 villages approximately three weeks later.12 Theseset-by-phase groups of 10 villages formed the strata for the randomization.13 On-line Appendix Figure A1 provides a graphic representation of the stratificationprocedure.
B. Data collection
Within each village in the sample, a census was first conducted to determinea list of target mothers. Twenty-two mothers of children aged 5 to 8 were thenrandomly selected to be targeted. If there were fewer than 22 such mothers inthe village, all mothers were targeted. There were a total of 8,888 target mothersin the study, with an average of 18.5 mothers per village.
Baseline data were collected from households of target mothers at the onsetof the interventions in summer 2011, and endline data were collected after ap-proximately one year, in summer 2012. The primary evaluation data consisted ofstandardized tests of mothers and children, as well as household surveys admin-istered to mothers.
The standardized tests, designed to evaluate a basic set of Hindi language andmath skills, were developed by the ASER Centre, Pratham’s research arm. Thesetests were expanded versions of the ASER Centre’s standard assessment tool usedeach year in its national assessments of children’s learning (ASER Centre, 2012).At baseline, the tests were administered to target mothers, children aged 5 to 8in their households, other children in grades 1 to 4 outside of that age range, and
11In online Appendix B we provide more detail on how hamlets were selected in each state.12Apart from the small difference in implementation timing, Phase 1 villages were identical to Phase
2 villages in program administration and content.13Because there were four interventions to be assigned within a stratum of 10 villages, each stratum
contained two “remainder” villages. These remainders were balanced within the larger set of 20 villages,such that each intervention was implemented in exactly five villages per set.
10
children aged 4 and below who were going to be enrolled in school in the nextyear. The endline testing included all mothers and children tested at baseline,in addition to the remaining children who were aged 3 or 4 at baseline. Themothers’ test contained the same questions as the children’s test, but includedseveral additional word problems and other questions testing practical literacy andnumeracy skills. Minor changes were made to the testing instruments betweenbaseline and endline. At baseline a shorter test, designed to quickly assess basicreading and math knowledge, was also administered to other household members.
The household surveys were administered to target mothers. These surveyswere designed to measure the mothers’ involvement in household decisions, moth-ers’ interest and participation in their children’s education, and children’s school-ing status. Mothers’ interest and participation were measured through moduleson participation in learning at home, time use of the mother and child, and pres-ence of educational materials in the household. A number of questions referredto a single child aged 5 to 8 in the household. If the household had more thanone child in that age range, one was randomly selected to keep the length of thesurvey manageable.14 The surveys also measured schooling status of all childrenin the household.15 While most questions appeared in both survey rounds, someadditions were made to the endline survey based on observations made duringimplementation.16
Column 1 of Table 1 contains descriptive statistics from the baseline surveys andtests in the control group. Mothers in our sample had low levels of education andsimilarly low levels of literacy and numeracy. The average years of education inthe control group was 0.76, with a median of zero. Baseline test scores for motherswere relatively low: the tests focused primarily on first-grade competencies, yetthe average test score in the control group was 30 percent in the language sectionand 22 percent in the math section.
Columns 2, 3, and 4 of Table 1 present differences in means of the baselinevariables between each treatment group and the control group. Two of the 21variables are jointly significant at the 10 percent level between the three treatmentgroups and the control group, and one more is significant at the 5 percent level.Out of 63 individual comparisons between treatment and control groups, four aresignificant at the 10 percent level, and six more are significant at the 5 percentlevel—slightly more than what would be expected by pure chance, particularly inthe comparisons between the ML-CHAMP and control groups. However, many of
14The questions that focused on a single child included the questions on mothers’ and children’s timeuse, as well as several questions in the sections on participation in children’s education and children’sschooling behavior. We do not find evidence that the focus of the surveys on a single child had impactson that child’s test scores. See online Appendix C for details.
15In the baseline survey schooling status was measured for children aged 5 to 8. The age range wasexpanded to 3 to 14 in the endline survey.
16We also administered short questionnaires to fathers at baseline and endline. These questionnairescontained questions on participation in children’s learning, empowerment of mothers, and support foradult literacy programs. At endline only 57 percent of fathers were reached, and we therefore do not usethese surveys in the main analysis.
11
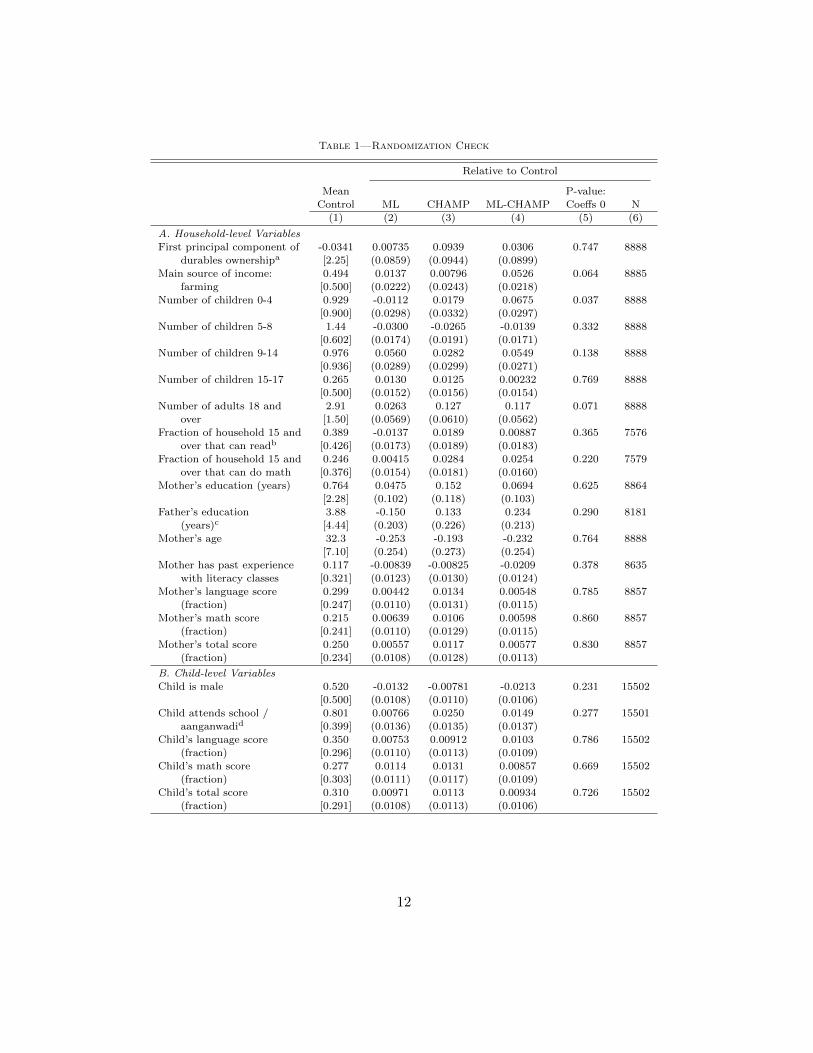
Table 1—Randomization Check
Relative to Control
Mean P-value:
Control ML CHAMP ML-CHAMP Coeffs 0 N(1) (2) (3) (4) (5) (6)
A. Household-level Variables
First principal component of -0.0341 0.00735 0.0939 0.0306 0.747 8888
durables ownershipa [2.25] (0.0859) (0.0944) (0.0899)Main source of income: 0.494 0.0137 0.00796 0.0526 0.064 8885
farming [0.500] (0.0222) (0.0243) (0.0218)
Number of children 0-4 0.929 -0.0112 0.0179 0.0675 0.037 8888[0.900] (0.0298) (0.0332) (0.0297)
Number of children 5-8 1.44 -0.0300 -0.0265 -0.0139 0.332 8888
[0.602] (0.0174) (0.0191) (0.0171)Number of children 9-14 0.976 0.0560 0.0282 0.0549 0.138 8888
[0.936] (0.0289) (0.0299) (0.0271)Number of children 15-17 0.265 0.0130 0.0125 0.00232 0.769 8888
[0.500] (0.0152) (0.0156) (0.0154)
Number of adults 18 and 2.91 0.0263 0.127 0.117 0.071 8888over [1.50] (0.0569) (0.0610) (0.0562)
Fraction of household 15 and 0.389 -0.0137 0.0189 0.00887 0.365 7576
over that can readb [0.426] (0.0173) (0.0189) (0.0183)Fraction of household 15 and 0.246 0.00415 0.0284 0.0254 0.220 7579
over that can do math [0.376] (0.0154) (0.0181) (0.0160)
Mother’s education (years) 0.764 0.0475 0.152 0.0694 0.625 8864[2.28] (0.102) (0.118) (0.103)
Father’s education 3.88 -0.150 0.133 0.234 0.290 8181
(years)c [4.44] (0.203) (0.226) (0.213)Mother’s age 32.3 -0.253 -0.193 -0.232 0.764 8888
[7.10] (0.254) (0.273) (0.254)
Mother has past experience 0.117 -0.00839 -0.00825 -0.0209 0.378 8635with literacy classes [0.321] (0.0123) (0.0130) (0.0124)
Mother’s language score 0.299 0.00442 0.0134 0.00548 0.785 8857(fraction) [0.247] (0.0110) (0.0131) (0.0115)
Mother’s math score 0.215 0.00639 0.0106 0.00598 0.860 8857
(fraction) [0.241] (0.0110) (0.0129) (0.0115)Mother’s total score 0.250 0.00557 0.0117 0.00577 0.830 8857
(fraction) [0.234] (0.0108) (0.0128) (0.0113)
B. Child-level Variables
Child is male 0.520 -0.0132 -0.00781 -0.0213 0.231 15502
[0.500] (0.0108) (0.0110) (0.0106)Child attends school / 0.801 0.00766 0.0250 0.0149 0.277 15501
aanganwadid [0.399] (0.0136) (0.0135) (0.0137)Child’s language score 0.350 0.00753 0.00912 0.0103 0.786 15502
(fraction) [0.296] (0.0110) (0.0113) (0.0109)
Child’s math score 0.277 0.0114 0.0131 0.00857 0.669 15502(fraction) [0.303] (0.0111) (0.0117) (0.0109)
Child’s total score 0.310 0.00971 0.0113 0.00934 0.726 15502
(fraction) [0.291] (0.0108) (0.0113) (0.0106)
12
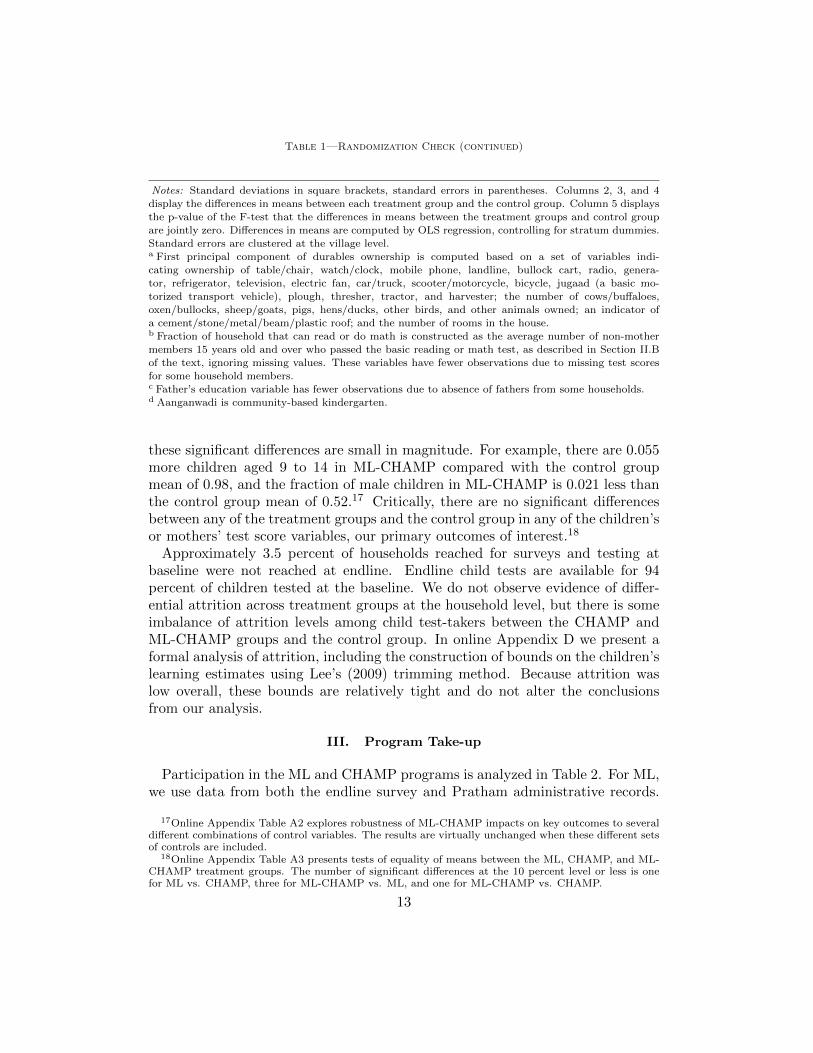
Table 1—Randomization Check (continued)
Notes: Standard deviations in square brackets, standard errors in parentheses. Columns 2, 3, and 4display the differences in means between each treatment group and the control group. Column 5 displays
the p-value of the F-test that the differences in means between the treatment groups and control group
are jointly zero. Differences in means are computed by OLS regression, controlling for stratum dummies.Standard errors are clustered at the village level.a First principal component of durables ownership is computed based on a set of variables indi-
cating ownership of table/chair, watch/clock, mobile phone, landline, bullock cart, radio, genera-tor, refrigerator, television, electric fan, car/truck, scooter/motorcycle, bicycle, jugaad (a basic mo-
torized transport vehicle), plough, thresher, tractor, and harvester; the number of cows/buffaloes,
oxen/bullocks, sheep/goats, pigs, hens/ducks, other birds, and other animals owned; an indicator ofa cement/stone/metal/beam/plastic roof; and the number of rooms in the house.b Fraction of household that can read or do math is constructed as the average number of non-mother
members 15 years old and over who passed the basic reading or math test, as described in Section II.Bof the text, ignoring missing values. These variables have fewer observations due to missing test scores
for some household members.c Father’s education variable has fewer observations due to absence of fathers from some households.d Aanganwadi is community-based kindergarten.
these significant differences are small in magnitude. For example, there are 0.055more children aged 9 to 14 in ML-CHAMP compared with the control groupmean of 0.98, and the fraction of male children in ML-CHAMP is 0.021 less thanthe control group mean of 0.52.17 Critically, there are no significant differencesbetween any of the treatment groups and the control group in any of the children’sor mothers’ test score variables, our primary outcomes of interest.18
Approximately 3.5 percent of households reached for surveys and testing atbaseline were not reached at endline. Endline child tests are available for 94percent of children tested at the baseline. We do not observe evidence of differ-ential attrition across treatment groups at the household level, but there is someimbalance of attrition levels among child test-takers between the CHAMP andML-CHAMP groups and the control group. In online Appendix D we present aformal analysis of attrition, including the construction of bounds on the children’slearning estimates using Lee’s (2009) trimming method. Because attrition waslow overall, these bounds are relatively tight and do not alter the conclusionsfrom our analysis.
III. Program Take-up
Participation in the ML and CHAMP programs is analyzed in Table 2. For ML,we use data from both the endline survey and Pratham administrative records.
17Online Appendix Table A2 explores robustness of ML-CHAMP impacts on key outcomes to severaldifferent combinations of control variables. The results are virtually unchanged when these different setsof controls are included.
18Online Appendix Table A3 presents tests of equality of means between the ML, CHAMP, and ML-CHAMP treatment groups. The number of significant differences at the 10 percent level or less is onefor ML vs. CHAMP, three for ML-CHAMP vs. ML, and one for ML-CHAMP vs. CHAMP.
13
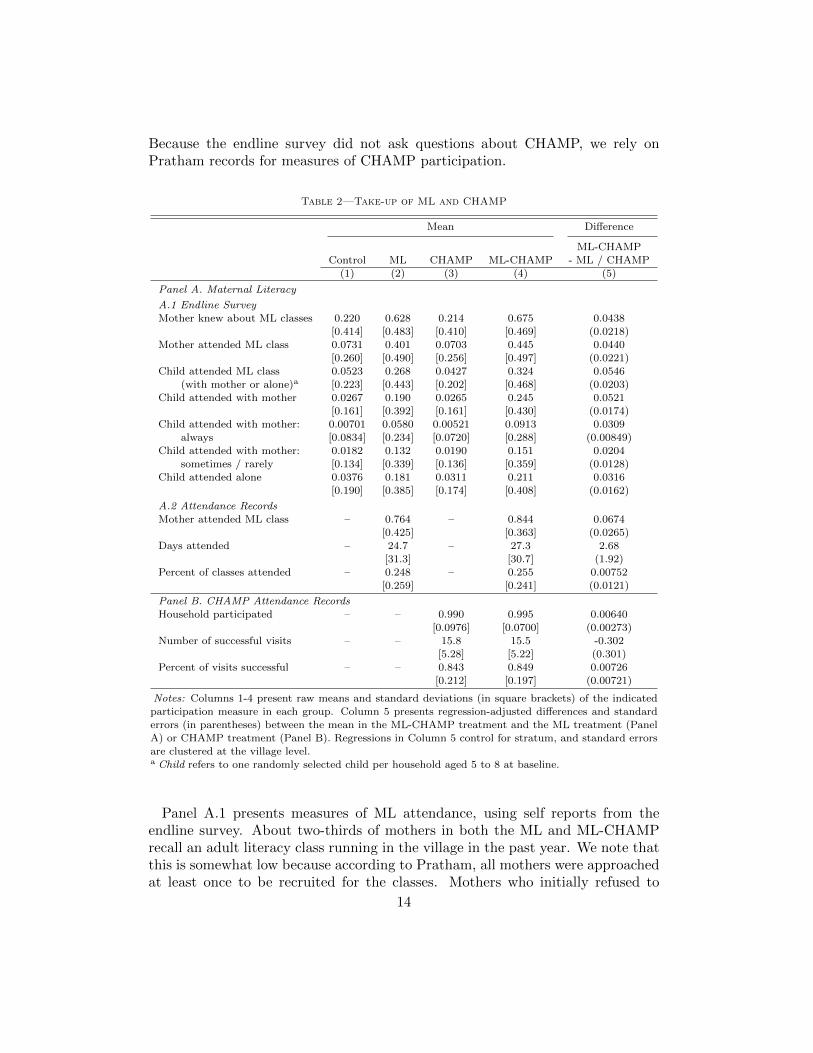
Because the endline survey did not ask questions about CHAMP, we rely onPratham records for measures of CHAMP participation.
Table 2—Take-up of ML and CHAMP
Mean Difference
ML-CHAMP
Control ML CHAMP ML-CHAMP - ML / CHAMP(1) (2) (3) (4) (5)
Panel A. Maternal Literacy
A.1 Endline Survey
Mother knew about ML classes 0.220 0.628 0.214 0.675 0.0438[0.414] [0.483] [0.410] [0.469] (0.0218)
Mother attended ML class 0.0731 0.401 0.0703 0.445 0.0440
[0.260] [0.490] [0.256] [0.497] (0.0221)Child attended ML class 0.0523 0.268 0.0427 0.324 0.0546
(with mother or alone)a [0.223] [0.443] [0.202] [0.468] (0.0203)
Child attended with mother 0.0267 0.190 0.0265 0.245 0.0521[0.161] [0.392] [0.161] [0.430] (0.0174)
Child attended with mother: 0.00701 0.0580 0.00521 0.0913 0.0309
always [0.0834] [0.234] [0.0720] [0.288] (0.00849)Child attended with mother: 0.0182 0.132 0.0190 0.151 0.0204
sometimes / rarely [0.134] [0.339] [0.136] [0.359] (0.0128)Child attended alone 0.0376 0.181 0.0311 0.211 0.0316
[0.190] [0.385] [0.174] [0.408] (0.0162)
A.2 Attendance RecordsMother attended ML class – 0.764 – 0.844 0.0674
[0.425] [0.363] (0.0265)Days attended – 24.7 – 27.3 2.68
[31.3] [30.7] (1.92)
Percent of classes attended – 0.248 – 0.255 0.00752[0.259] [0.241] (0.0121)
Panel B. CHAMP Attendance RecordsHousehold participated – – 0.990 0.995 0.00640
[0.0976] [0.0700] (0.00273)
Number of successful visits – – 15.8 15.5 -0.302[5.28] [5.22] (0.301)
Percent of visits successful – – 0.843 0.849 0.00726
[0.212] [0.197] (0.00721)
Notes: Columns 1-4 present raw means and standard deviations (in square brackets) of the indicatedparticipation measure in each group. Column 5 presents regression-adjusted differences and standard
errors (in parentheses) between the mean in the ML-CHAMP treatment and the ML treatment (PanelA) or CHAMP treatment (Panel B). Regressions in Column 5 control for stratum, and standard errors
are clustered at the village level.a Child refers to one randomly selected child per household aged 5 to 8 at baseline.
Panel A.1 presents measures of ML attendance, using self reports from theendline survey. About two-thirds of mothers in both the ML and ML-CHAMPrecall an adult literacy class running in the village in the past year. We note thatthis is somewhat low because according to Pratham, all mothers were approachedat least once to be recruited for the classes. Mothers who initially refused to
14
attend or attended only at the beginning may not have recalled these classes,particularly in villages with low attendance among other mothers.19
Self-reported take-up of ML classes is also relatively low: 40 percent of mothersin ML and 45 percent of mothers in ML-CHAMP reported having attended MLclasses in the past year.20,21 Children attended the classes as well. The endlinesurvey asked mothers whether and how often the selected child had attendedwith the mother and whether the child ever attended alone. Nineteen percentof selected children in ML villages and 25 percent of selected children in ML-CHAMP villages were reported to have attended with the mother. Of those,about one third always attended when the mother attended. In addition, about20 percent of children in ML and ML-CHAMP villages attended alone at leastonce.
Panel A.2 reports ML attendance collected by Pratham volunteers. These datashow take-up rates of 76 percent in ML and 84 percent in ML-CHAMP, substan-tially higher rates than those self-reported by the mothers. There are two po-tential reasons for this discrepancy. First, because the administrative data werecollected by Pratham volunteers and were not verified, they may overstate actualattendance. Second, self-reported attendance may be subject to recall errors. Toavoid prompting, enumerators in the endline survey were not told the treatmentstatus of a given village and therefore did not probe for recall of ML attendance inthe treatment villages.22 Thus, the survey and administrative data likely provideupper and lower bounds on take-up. To avoid these discrepancies, future researchexamining these types of programs would benefit from measures of attendanceobserved directly by the research team. In spite of these differences, however, thecorrelates of take-up are similar across self-reported and administrative measures(see online Appendix F).
Although the administrative data do show a relatively high percentage of moth-ers attending at least one class, the number of classes attended was low. The
19Indeed, among mothers who did not attend, mothers’ knowledge of the classes is strongly related toaverage take-up in the village: 10 percentage points higher take-up in the village is associated with 2.7percentage points higher likelihood of a non-attending mother knowing about the adult literacy classes(p-value < 0.01, not shown).
20The surveys collected self-reports on any participation but not the intensity of participation becauseit was determined to be logistically infeasible to obtain accurate recall of the number of classes the motherattended over an entire year. It could also lead to surveyors learning the treatment status of the village,which could lead to differential surveyor prompting by treatment status.
21We note that 7 percent of mothers in the CHAMP and control groups reported attending classes.We find no evidence of spillovers across program hamlets: there is no relationship between attendance inthe CHAMP and control group hamlets and presence of ML or ML-CHAMP hamlets in the larger village(see online Appendix E). The likely reasons for non-compliance are a combination of misunderstandingof the survey question and the government’s Saakshar Bharat adult literacy mobilization that occurredin Bihar during the spring of 2012. While virtually no Saakshar Bharat classes were actually held afterthe initial mobilization, initial promotion of the program occurred in many villages across the study area,and our respondents who participated in this mobilization may have considered this as class attendance.
22There is some evidence supporting recall errors. Among those recorded in the administrative dataas having attended, recorded attendance is 69 percent higher (41.2 days vs 24.3) for those who alsoreported attending in the endline survey. Within this group, the number of months since the last recordedattendance is also significantly related to a mother not reporting attending in the survey (results notshown).
15
average targeted mother in ML and ML-CHAMP attended 25 and 27 classes overthe course of the year, respectively. Attendance was also sporadic throughout theyear: among those who took up the classes, attendance between September 2011and February 2012 averaged between 3 and 5 days per month. As noted above,classes were held less consistently from March through the end of the program inJune due to the onset of the harvest.
Taken together, these measures indicate relatively low participation in MLclasses. According to Pratham staff, much of the low take-up was driven bymothers’ interest and availability, although availability of volunteers did impactwhether classes were held. While classes were scheduled to be held six daysper week (about 24 days per month), the administrative data indicate that 12.5classes were held on average per month in ML and ML-CHAMP between Septem-ber 2011 and February 2012. Some of the “missing classes” were likely holidays:the peak festival period in India falls between October and December. However,many could be the result of a lack of volunteer availability or effort (which coulditself be an endogenous response to low interest of mothers). Nonetheless, whenclasses were held, the average selected mother only attended about 25 percent ofthe time, indicating that the low participation was primarily due to choices ofmothers.
As shown in Table 2, there is slightly higher likelihood of attendance in theML-CHAMP group compared with ML: self-reported take-up was 4.4 percentagepoints higher, and take-up in the administrative data was 6.7 percentage pointshigher (both significant at the 5 percent level).23 However, we note that themagnitudes of the differences are relatively small, representing 11 and 9 percenthigher attendance in ML-CHAMP for the self-reported and administrative data,respectively. In addition, the administrative data do not indicate a significantdifference in the number of classes attended between the two groups.
CHAMP was a door-to-door intervention where Pratham staff conducted weeklyvisits with each mother at home. If the mother was not at home, then theCHAMP session was to be conducted with another adult in the household. PanelB of Table 2 presents take-up of CHAMP according to Pratham administrativedata. Ninety-nine percent of target households were visited at least once duringthe intervention period. Households were successfully visited about 16 times onaverage. As with ML classes, the majority of CHAMP visits were held betweenSeptember 2011 and February 2012, with fewer visits taking place between Marchand the end of the program in June.
During the second half of the CHAMP program, attendance data in both Ra-jasthan and Bihar included information on the mother’s and child’s participationin CHAMP activities. Within this subsample, mothers were present during 81
23When we split the sample by state, only Rajasthan exhibits significantly higher take-up in ML-CHAMP (results not shown). We speculate that this could be driven in part by the lower overallparticipation of mothers in ML classes in Rajasthan, as described below. Mothers in Rajasthan couldhave been closer to the margin of participating and were therefore more responsive to the additionalcontact with Pratham staff.
16
percent of successful CHAMP visits. In about half of cases, implementers alsorecorded children’s presence during CHAMP sessions and self-reports of who inthe household helped the child with the previous week’s worksheet. These datashow that a target-aged child was present during 58 percent of CHAMP visits.The mother helped the child with the CHAMP worksheet 53 percent of the time.In 19 percent of cases another household member helped with the worksheet,while the child completed the worksheet alone 28 percent of the time.
In online Appendix F we present a detailed analysis of the correlates of mothers’participation in ML and CHAMP. For the ML intervention, several relationshipssuggest factors that could explain the low take-up discussed above. First, take-up is positively associated with slightly higher baseline test scores of mothersand a small amount of formal education. This highlights a potential challenge intargeting of adult literacy programs: even though they may be meant to reachadults with no education, a small amount of education may signal both experiencewith classroom learning and an interest in learning more. Second, experience withliteracy classes in the past and experience with meeting in groups (as measuredthrough self-help group membership)24 are also important determinants of thetake-up decision. Thus, some mothers may not be comfortable in the grouplearning environments typical in many adult literacy programs. Third, we observehigher self-reported take-up in Bihar, where Pratham staff reported that motherswere more available to attend than in Rajasthan. This result is echoed by ourqualitative interviews, which highlighted a lack of free time as a key constraintto attendance.25
Almost all households participated in CHAMP, and hence there is little varia-tion in the extensive margin of participation. Examining the intensity of partici-pation, a higher fraction of children in school and higher baseline child test scoresare strong determinants of the percentage of sessions attended. This could reflecta complementarity between the CHAMP material and the school curriculum. Incontrast with the determinants of ML participation, intensity of participationin CHAMP has a small negative relationship with mothers’ education and nosignificant relationship with mothers’ test scores.
IV. Results
Before the endline data were examined, a pre-analysis plan (PAP) was uploadedto the American Economic Association’s Randomized-Controlled-Trial Registrywebsite.26 The PAP includes the weights used in aggregating test scores, theestimating equation for test scores, and the list of intermediate outcomes to be
24A self-help group is a group of villagers that pools savings and provides loans to members of thegroup.
25Time spent in household and market work was 43 percent higher Rajasthan than in Bihar. Wenote, however, that conditional on state, we do not find a significant relationship between time spent onhousehold and market work and participation. On the other hand, availability may also be driven by theopportunity cost of that time, or the value of leisure.
26https://www.socialscienceregistry.org/trials/65
17
examined. The analysis presented in this paper follows the PAP as closely aspossible. In the few cases where we deviate from the PAP, we discuss the choicesand implications below.
A. Estimating Equation
Throughout the analysis we utilize the following estimating equation:
(1) Y1iv = β0 + β1MLv + β2CHAMPv + β3MLCHAMPv + β4Y0iv + δGv + πHiv + εiv
In this equation, Y1iv is the outcome for individual i in village v. MLv,CHAMPv, and MLCHAMPv are dummy variables indicating the treatmentstatus of the village. Y0iv is the baseline value of the outcome of interest (whenmeasured). Gv is a dummy for stratum, as described in Section II.A, while Hiv
represents a vector of household-level characteristics. εiv is the individual errorterm, clustered by village, the level of randomization. Equation (1) is estimatedusing ordinary least squares.
For all impact results using child-level data, we use all variables listed in in Table1 as controls. When the mother is the unit of observation, we use all household-level variables in Table 1, Panel A, and household-level averages of the child-levelvariables in Panel B. This includes two variables that were not originally listed inthe PAP: child gender and child schooling status. We include these because wefind some imbalance in these variables across treatment groups, as shown in Table1, and because child schooling status is a key outcome of interest. Excluding thesevariables from the set of controls does not substantively affect any of the mainresults presented below (not shown).
We present our results in three parts. First, we present effects on children’stest scores. Second, we examine mothers’ learning and involvement in householddecisions. Finally, we estimate program impacts on mothers’ participation in theirchildren’s education, presence of education assets in the home, and children’sschooling behavior.
B. Children’s Test Scores
Table 3 presents the effects of the treatment groups on children’s language,math, and total (math plus language) test scores. We estimate Equation (1),controlling for baseline math and language test scores and the full set of variablespresented in Table 1. For each of the three test score categories, scores arenormalized based on the control group mean and standard deviation in eachround of testing. As specified in the PAP, all children tested at the endline areincluded in the estimation, including the younger children not tested at baseline.We code missing control variables as zero and include dummy variables to indicatemissing values.
18
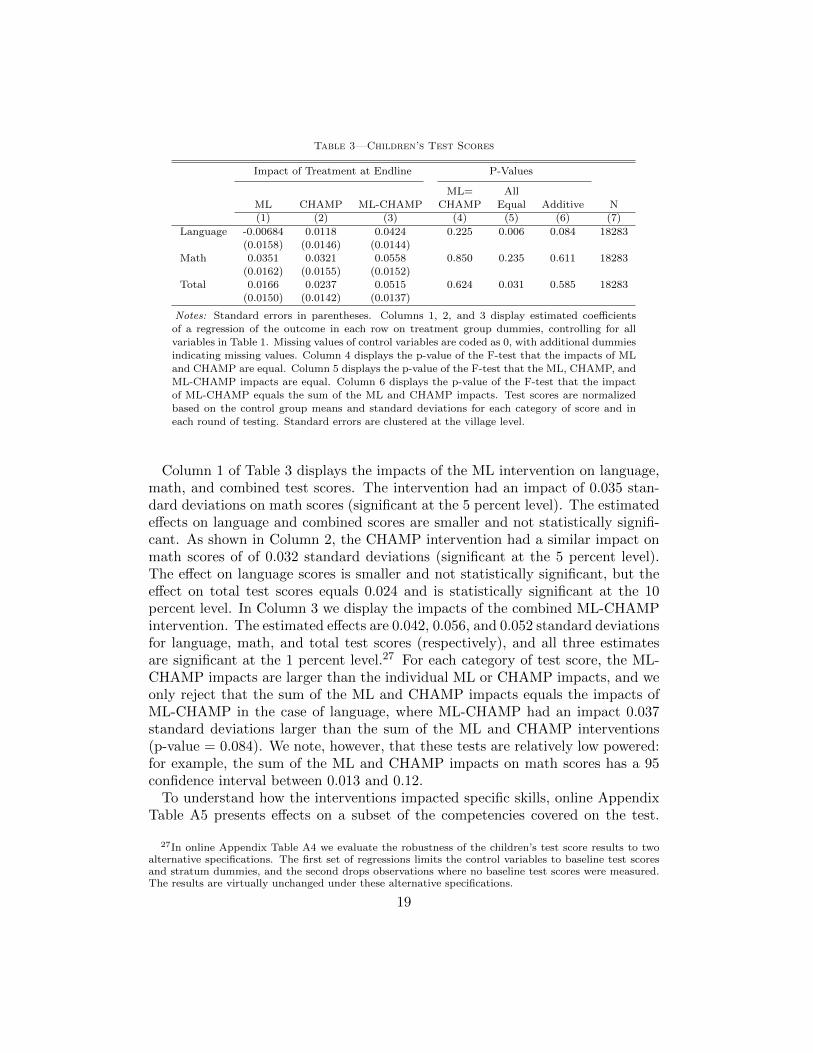
Table 3—Children’s Test Scores
Impact of Treatment at Endline P-Values
ML= AllML CHAMP ML-CHAMP CHAMP Equal Additive N
(1) (2) (3) (4) (5) (6) (7)
Language -0.00684 0.0118 0.0424 0.225 0.006 0.084 18283
(0.0158) (0.0146) (0.0144)Math 0.0351 0.0321 0.0558 0.850 0.235 0.611 18283
(0.0162) (0.0155) (0.0152)
Total 0.0166 0.0237 0.0515 0.624 0.031 0.585 18283(0.0150) (0.0142) (0.0137)
Notes: Standard errors in parentheses. Columns 1, 2, and 3 display estimated coefficients
of a regression of the outcome in each row on treatment group dummies, controlling for all
variables in Table 1. Missing values of control variables are coded as 0, with additional dummiesindicating missing values. Column 4 displays the p-value of the F-test that the impacts of ML
and CHAMP are equal. Column 5 displays the p-value of the F-test that the ML, CHAMP, and
ML-CHAMP impacts are equal. Column 6 displays the p-value of the F-test that the impactof ML-CHAMP equals the sum of the ML and CHAMP impacts. Test scores are normalized
based on the control group means and standard deviations for each category of score and ineach round of testing. Standard errors are clustered at the village level.
Column 1 of Table 3 displays the impacts of the ML intervention on language,math, and combined test scores. The intervention had an impact of 0.035 stan-dard deviations on math scores (significant at the 5 percent level). The estimatedeffects on language and combined scores are smaller and not statistically signifi-cant. As shown in Column 2, the CHAMP intervention had a similar impact onmath scores of of 0.032 standard deviations (significant at the 5 percent level).The effect on language scores is smaller and not statistically significant, but theeffect on total test scores equals 0.024 and is statistically significant at the 10percent level. In Column 3 we display the impacts of the combined ML-CHAMPintervention. The estimated effects are 0.042, 0.056, and 0.052 standard deviationsfor language, math, and total test scores (respectively), and all three estimatesare significant at the 1 percent level.27 For each category of test score, the ML-CHAMP impacts are larger than the individual ML or CHAMP impacts, and weonly reject that the sum of the ML and CHAMP impacts equals the impacts ofML-CHAMP in the case of language, where ML-CHAMP had an impact 0.037standard deviations larger than the sum of the ML and CHAMP interventions(p-value = 0.084). We note, however, that these tests are relatively low powered:for example, the sum of the ML and CHAMP impacts on math scores has a 95confidence interval between 0.013 and 0.12.
To understand how the interventions impacted specific skills, online AppendixTable A5 presents effects on a subset of the competencies covered on the test.
27In online Appendix Table A4 we evaluate the robustness of the children’s test score results to twoalternative specifications. The first set of regressions limits the control variables to baseline test scoresand stratum dummies, and the second drops observations where no baseline test scores were measured.The results are virtually unchanged under these alternative specifications.
19
With few exceptions, these competencies correspond to those tested in the ASERnational assessments of reading and language (ASER Centre, 2012).28 We focuson math, where the main results show significant impacts of all three interventions.Among the individual math skills, the ML intervention had similar impacts acrossthe range of competencies, with the largest impacts on two-digit addition. TheCHAMP and ML-CHAMP interventions had the largest impacts on one-digitnumber recognition.
C. Mothers’ Test Scores and Empowerment
Table 4 presents the effect of the interventions on mothers’ normalized math,language, and total test scores. We again estimate Equation (1), controlling forbaseline language and math scores as well as the control variables listed in Table1.
All three programs had statistically significant impacts on mothers’ language,math, and total test scores. The ML program improved mothers’ test scores by0.066 standard deviations in language, 0.12 standard deviations in math, and0.096 standard deviations overall. All three estimates are significant at the 1percent level. As shown in Column 2, The CHAMP program improved mothers’test scores by 0.023 standard deviations in language (significant at the 10 percentlevel), 0.059 standard deviations in math (significant at the 1 percent level), and0.043 standard deviations overall (significant at the 1 percent level). As shownin Column 3, the ML-CHAMP intervention had impacts of 0.088, 0.15, and 0.12standard deviations on language, math, and total test scores, respectively (eachsignificant at the 1 percent level).29 As with the results for children, the impactsof the combined intervention on mothers’ test scores are larger than those of eitherindividual intervention. Indeed, we cannot reject that the effects are additive forany of the three test score categories. In addition, these tests are comparativelywell-powered: for example, the 95 percent confidence interval on the sum of theML and CHAMP math impacts is between 0.12 and 0.23 standard deviations,well above the impact of either individual intervention and relatively close to thepoint estimate of the ML-CHAMP impact.
In online Appendix Table A6 we examine the effects on a subset of competencieson the test, similar to the exercise for children in online Appendix Table A5. Inlanguage, ML and ML-CHAMP had the largest impact on letter recognition, themost basic skill tested. CHAMP, by contrast, had impacts of similar magnitudeacross a broader range of competencies, although these impacts are considerablysmaller than the ML and ML-CHAMP impacts on letter recognition. In math,all three interventions had the largest impacts on one-digit number recognition.
28The primary difference between the competencies examined and those on the ASER test is that weinclude two-digit addition, while the ASER test includes division.
29Online Appendix Table A4 examines robustness of these results to exclusion of household-levelcontrol variables. As in the case of the results on children, running the impact regression controlling onlyfor baseline test scores leaves the results virtually unchanged.
20
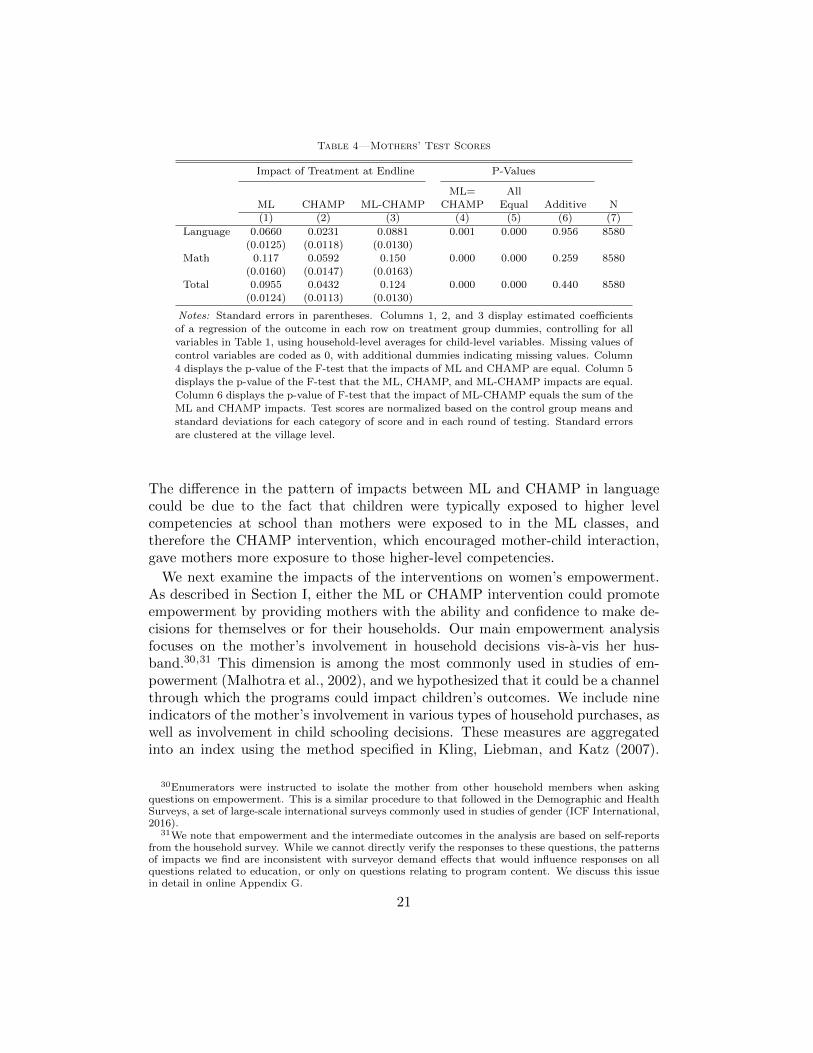
Table 4—Mothers’ Test Scores
Impact of Treatment at Endline P-Values
ML= AllML CHAMP ML-CHAMP CHAMP Equal Additive N
(1) (2) (3) (4) (5) (6) (7)
Language 0.0660 0.0231 0.0881 0.001 0.000 0.956 8580
(0.0125) (0.0118) (0.0130)Math 0.117 0.0592 0.150 0.000 0.000 0.259 8580
(0.0160) (0.0147) (0.0163)
Total 0.0955 0.0432 0.124 0.000 0.000 0.440 8580(0.0124) (0.0113) (0.0130)
Notes: Standard errors in parentheses. Columns 1, 2, and 3 display estimated coefficients
of a regression of the outcome in each row on treatment group dummies, controlling for all
variables in Table 1, using household-level averages for child-level variables. Missing values ofcontrol variables are coded as 0, with additional dummies indicating missing values. Column
4 displays the p-value of the F-test that the impacts of ML and CHAMP are equal. Column 5
displays the p-value of the F-test that the ML, CHAMP, and ML-CHAMP impacts are equal.Column 6 displays the p-value of F-test that the impact of ML-CHAMP equals the sum of the
ML and CHAMP impacts. Test scores are normalized based on the control group means andstandard deviations for each category of score and in each round of testing. Standard errors
are clustered at the village level.
The difference in the pattern of impacts between ML and CHAMP in languagecould be due to the fact that children were typically exposed to higher levelcompetencies at school than mothers were exposed to in the ML classes, andtherefore the CHAMP intervention, which encouraged mother-child interaction,gave mothers more exposure to those higher-level competencies.
We next examine the impacts of the interventions on women’s empowerment.As described in Section I, either the ML or CHAMP intervention could promoteempowerment by providing mothers with the ability and confidence to make de-cisions for themselves or for their households. Our main empowerment analysisfocuses on the mother’s involvement in household decisions vis-a-vis her hus-band.30,31 This dimension is among the most commonly used in studies of em-powerment (Malhotra et al., 2002), and we hypothesized that it could be a channelthrough which the programs could impact children’s outcomes. We include nineindicators of the mother’s involvement in various types of household purchases, aswell as involvement in child schooling decisions. These measures are aggregatedinto an index using the method specified in Kling, Liebman, and Katz (2007).
30Enumerators were instructed to isolate the mother from other household members when askingquestions on empowerment. This is a similar procedure to that followed in the Demographic and HealthSurveys, a set of large-scale international surveys commonly used in studies of gender (ICF International,2016).
31We note that empowerment and the intermediate outcomes in the analysis are based on self-reportsfrom the household survey. While we cannot directly verify the responses to these questions, the patternsof impacts we find are inconsistent with surveyor demand effects that would influence responses on allquestions related to education, or only on questions relating to program content. We discuss this issuein detail in online Appendix G.
21
To construct the index, we compute the normalized value of each variable basedon the control group mean and standard deviation at endline. We then take theaverage of the non-missing normalized variables and re-normalize the resultingindex based on the control group mean and standard deviation. The final indexhas a mean of zero and standard deviation of one in the control group.32
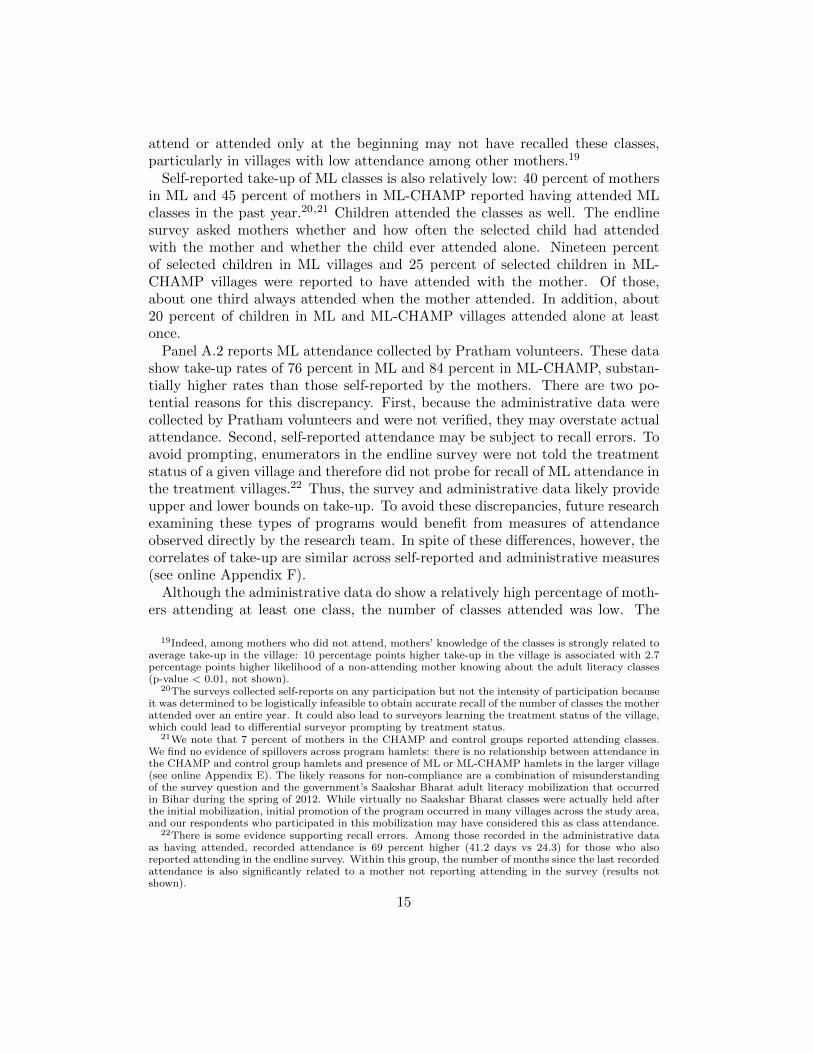
Table 5 displays the impact estimates of the interventions on the index and thecomponent variables. Among the three treatment groups, only ML-CHAMP hada significant impact on the full set of measures, with a point estimate of 0.091standard deviations (significant at the 1 percent level). The estimates for both MLand CHAMP are positive, smaller in magnitude and not statistically significant.33
One interpretation of the pattern of estimates is that ML and CHAMP indeedhad small impacts on mothers’ involvement in household decisions, as the sum ofthe point estimates of the individual interventions is almost exactly equal to thepoint estimate of the combined intervention.34 However, this is speculative as wecannot reject that the impact of either individual program is zero.
Thus, while women’s empowerment has been a policy outcome of interest foradult literacy programs in particular, we find limited evidence for impacts on ourmeasure of involvement in household decisions. This case is similar to that ofgroup-based microcredit: while these programs have been credited with increas-ing women’s empowerment, recent rigorous evaluations have found either smallpositive results on similar measures of involvement in household decisions (An-gelucci et al., 2015) or no evidence for impacts (Banerjee et al., 2015; Crepon etal., 2015; Tarozzi et al., 2015).
D. Mothers’ Participation, Home Inputs, and Child Schooling
As described in Section I, we hypothesized that the programs would impactmothers’ interest and involvement in their children’s education. In this sectionwe present results on mothers’ perceptions of their role in child education, theirparticipation in child education, mothers’ and children’s time use, education assetsin the home, and children’s school participation.
We measured mothers’ perception of their role in childhood education by asking
32The variables representing mother involvement in household decisions are a subset of variablesoriginally listed in the PAP. We have narrowed the original list of 26 variables in the PAP to reflectthose most frequently used in the literature. We analyze the full set of variables from the PAP inonline Appendix H. The additional variables include mothers’ mobility, capabilities to perform markettransactions, beliefs and attitudes about female education, and happiness. When all 26 variables areincluded in an aggregate empowerment index, we find impacts of ML of 0.071 standard deviations(significant at the 5 percent level) and impacts of 0.14 standard deviations (significant at the 1 percentlevel).
33The results are qualitatively similar if the components of the index are restricted to the 5 variablesnot related to children’s schooling decisions (not shown).
34Results from the endline father questionnaire suggest that these impacts arose without increasesin intrahousehold conflict. Eighty-nine percent of fathers indicated that they supported adult liter-acy classes for their wives, with significantly higher proportions of support in each of the interventiongroups compared with the control group (not shown). We note, however, that the response rate of thisquestionnaire was only 57 percent.
22
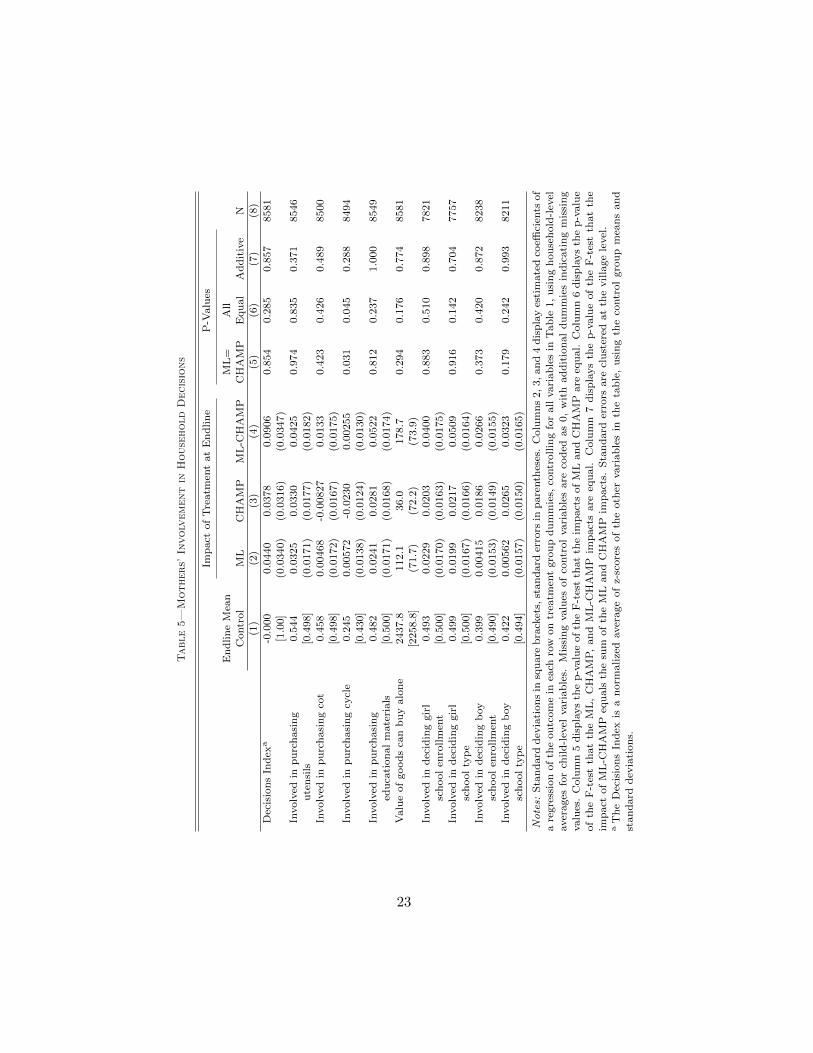
Table5—
Mothers’
Involv
ementin
House
hold
Decisions
Imp
act
of
Tre
atm
ent
at
En
dlin
eP
-Valu
es
En
dlin
eM
ean
ML
=A
llC
ontr
ol
ML
CH
AM
PM
L-C
HA
MP
CH
AM
PE
qu
al
Ad
dit
ive
N(1
)(2
)(3
)(4
)(5
)(6
)(7
)(8
)
Dec
isio
ns
Ind
exa
-0.0
00
0.0
440
0.0
378
0.0
906
0.8
54
0.2
85
0.8
57
8581
[1.0
0]
(0.0
340)
(0.0
316)
(0.0
347)
Involv
edin
pu
rch
asi
ng
0.5
44
0.0
325
0.0
330
0.0
425
0.9
74
0.8
35
0.3
71
8546
ute
nsi
ls[0
.498]
(0.0
171)
(0.0
177)
(0.0
182)
Involv
edin
pu
rch
asi
ng
cot
0.4
58
0.0
0468
-0.0
0827
0.0
133
0.4
23
0.4
26
0.4
89
8500
[0.4
98]
(0.0
172)
(0.0
167)
(0.0
175)
Involv
edin
pu
rch
asi
ng
cycl
e0.2
45
0.0
0572
-0.0
230
0.0
0255
0.0
31
0.0
45
0.2
88
8494
[0.4
30]
(0.0
138)
(0.0
124)
(0.0
130)
Involv
edin
pu
rch
asi
ng
0.4
82
0.0
241
0.0
281
0.0
522
0.8
12
0.2
37
1.0
00
8549
edu
cati
on
al
mate
rials
[0.5
00]
(0.0
171)
(0.0
168)
(0.0
174)
Valu
eof
good
sca
nb
uy
alo
ne
2437.8
112.1
36.0
178.7
0.2
94
0.1
76
0.7
74
8581
[2258.8
](7
1.7
)(7
2.2
)(7
3.9
)In
volv
edin
dec
idin
ggir
l0.4
93
0.0
229
0.0
203
0.0
400
0.8
83
0.5
10
0.8
98
7821
sch
ool
enro
llm
ent
[0.5
00]
(0.0
170)
(0.0
163)
(0.0
175)
Involv
edin
dec
idin
ggir
l0.4
99
0.0
199
0.0
217
0.0
509
0.9
16
0.1
42
0.7
04
7757
sch
ool
typ
e[0
.500]
(0.0
167)
(0.0
166)
(0.0
164)
Involv
edin
dec
idin
gb
oy
0.3
99
0.0
0415
0.0
186
0.0
266
0.3
73
0.4
20
0.8
72
8238
sch
ool
enro
llm
ent
[0.4
90]
(0.0
153)
(0.0
149)
(0.0
155)
Involv
edin
dec
idin
gb
oy
0.4
22
0.0
0562
0.0
265
0.0
323
0.1
79
0.2
42
0.9
93
8211
sch
ool
typ
e[0
.494]
(0.0
157)
(0.0
150)
(0.0
165)
Notes:
Sta
nd
ard
dev
iati
on
sin
squ
are
bra
cket
s,st
and
ard
erro
rsin
pare
nth
eses
.C
olu
mn
s2,3,an
d4
dis
pla
yes
tim
ate
dco
effici
ents
of
are
gre
ssio
nof
the
ou
tcom
ein
each
row
on
trea
tmen
tgro
up
du
mm
ies,
contr
ollin
gfo
rall
vari
ab
les
inT
ab
le1,
usi
ng
hou
seh
old
-lev
elaver
ages
for
child
-lev
elvari
ab
les.
Mis
sing
valu
esof
contr
ol
vari
ab
les
are
cod
edas
0,
wit
had
dit
ion
al
du
mm
ies
ind
icati
ng
mis
sin
gvalu
es.
Colu
mn
5d
isp
lays
the
p-v
alu
eof
the
F-t
est
that
the
imp
act
sof
ML
an
dC
HA
MP
are
equ
al.
Colu
mn
6d
isp
lays
the
p-v
alu
e
of
the
F-t
est
that
the
ML
,C
HA
MP
,an
dM
L-C
HA
MP
imp
act
sare
equ
al.
Colu
mn
7d
isp
lays
the
p-v
alu
eof
the
F-t
est
that
the
imp
act
of
ML
-CH
AM
Peq
uals
the
sum
of
the
ML
an
dC
HA
MP
imp
act
s.S
tan
dard
erro
rsare
clu
ster
edat
the
villa
ge
level
.a
Th
eD
ecis
ion
sIn
dex
isa
norm
alize
daver
age
of
z-sc
ore
sof
the
oth
ervari
ab
les
inth
eta
ble
,u
sin
gth
eco
ntr
ol
gro
up
mea
ns
an
d
stan
dard
dev
iati
on
s.
23
whether they believe they should be responsible for child education at all (relativeto fathers), and what activities they could do to assist their children. A detailedanalysis is presented in online Appendix I. While most mothers believed theyhave a role to play in child education, mothers in the ML, CHAMP, and ML-CHAMP villages were 4.1, 3.0, and 4.0 percentage points more likely to reportbeing responsible for child education, respectively (each significant at 5 percent orless). We also asked an open-ended question on what the mothers could do to helpchildren in their studies, and we counted the total number of responses.35 Relativeto a control group mean of 1.9 activities, mothers in ML and ML-CHAMP listed0.069 and 0.094 more activities (significant at the 10 and 5 levels, respectively).
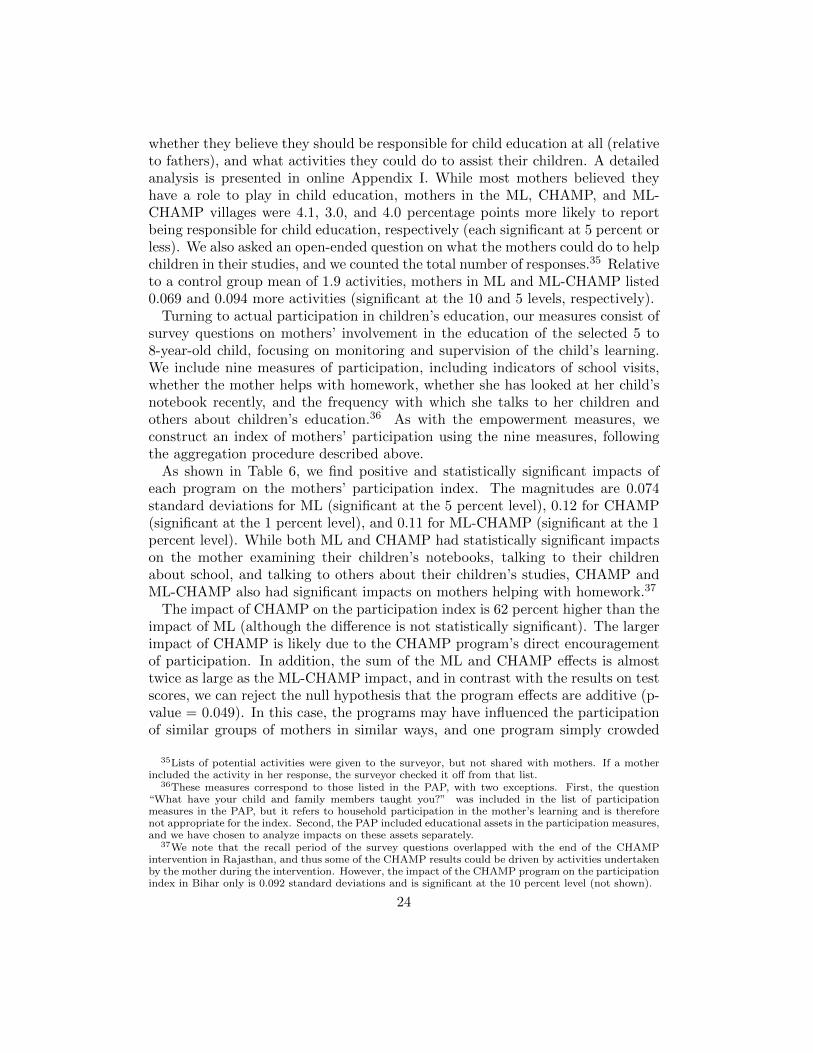
Turning to actual participation in children’s education, our measures consist ofsurvey questions on mothers’ involvement in the education of the selected 5 to8-year-old child, focusing on monitoring and supervision of the child’s learning.We include nine measures of participation, including indicators of school visits,whether the mother helps with homework, whether she has looked at her child’snotebook recently, and the frequency with which she talks to her children andothers about children’s education.36 As with the empowerment measures, weconstruct an index of mothers’ participation using the nine measures, followingthe aggregation procedure described above.
As shown in Table 6, we find positive and statistically significant impacts ofeach program on the mothers’ participation index. The magnitudes are 0.074standard deviations for ML (significant at the 5 percent level), 0.12 for CHAMP(significant at the 1 percent level), and 0.11 for ML-CHAMP (significant at the 1percent level). While both ML and CHAMP had statistically significant impactson the mother examining their children’s notebooks, talking to their childrenabout school, and talking to others about their children’s studies, CHAMP andML-CHAMP also had significant impacts on mothers helping with homework.37
The impact of CHAMP on the participation index is 62 percent higher than theimpact of ML (although the difference is not statistically significant). The largerimpact of CHAMP is likely due to the CHAMP program’s direct encouragementof participation. In addition, the sum of the ML and CHAMP effects is almosttwice as large as the ML-CHAMP impact, and in contrast with the results on testscores, we can reject the null hypothesis that the program effects are additive (p-value = 0.049). In this case, the programs may have influenced the participationof similar groups of mothers in similar ways, and one program simply crowded
35Lists of potential activities were given to the surveyor, but not shared with mothers. If a motherincluded the activity in her response, the surveyor checked it off from that list.
36These measures correspond to those listed in the PAP, with two exceptions. First, the question“What have your child and family members taught you?” was included in the list of participationmeasures in the PAP, but it refers to household participation in the mother’s learning and is thereforenot appropriate for the index. Second, the PAP included educational assets in the participation measures,and we have chosen to analyze impacts on these assets separately.
37We note that the recall period of the survey questions overlapped with the end of the CHAMPintervention in Rajasthan, and thus some of the CHAMP results could be driven by activities undertakenby the mother during the intervention. However, the impact of the CHAMP program on the participationindex in Bihar only is 0.092 standard deviations and is significant at the 10 percent level (not shown).
24
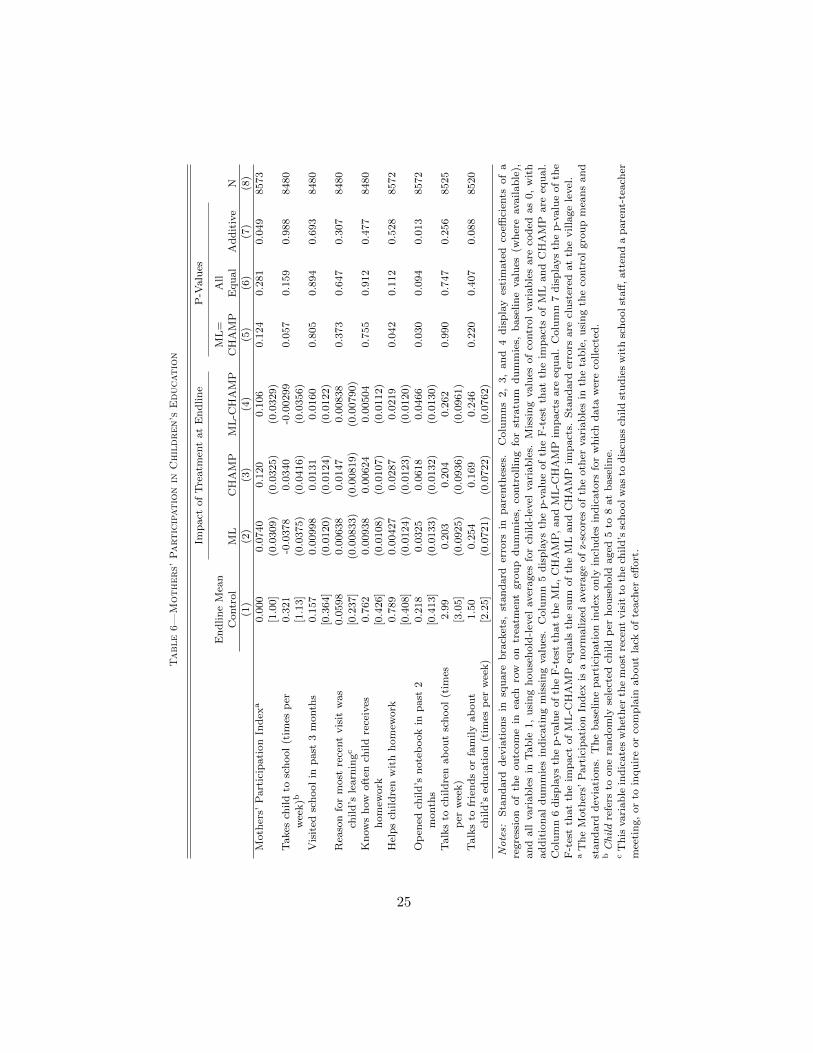
Table6—
Mothers’
Participationin
Children’s
Education
Imp
act
of
Tre
atm
ent
at
En
dli
ne
P-V
alu
es
En
dlin
eM
ean
ML
=A
llC
ontr
ol
ML
CH
AM
PM
L-C
HA
MP
CH
AM
PE
qual
Ad
dit
ive
N(1
)(2
)(3
)(4
)(5
)(6
)(7
)(8
)
Moth
ers’
Part
icip
ati
on
Ind
exa
0.0
00
0.0
740
0.1
20
0.1
06
0.1
24
0.2
81
0.0
49
8573
[1.0
0]
(0.0
309)
(0.0
325)
(0.0
329)
Takes
child
tosc
hool
(tim
esp
er0.3
21
-0.0
378
0.0
340
-0.0
0299
0.0
57
0.1
59
0.9
88
8480
wee
k)b
[1.1
3]
(0.0
375)
(0.0
416)
(0.0
356)
Vis
ited
sch
ool
inp
ast
3m
onth
s0.1
57
0.0
0998
0.0
131
0.0
160
0.8
05
0.8
94
0.6
93
8480
[0.3
64]
(0.0
120)
(0.0
124)
(0.0
122)
Rea
son
for
most
rece
nt
vis
itw
as
0.0
598
0.0
0638
0.0
147
0.0
0838
0.3
73
0.6
47
0.3
07
8480
child
’sle
arn
ingc
[0.2
37]
(0.0
0833)
(0.0
0819)
(0.0
0790)
Kn
ow
sh
ow
oft
ench
ild
rece
ives
0.7
62
0.0
0938
0.0
0624
0.0
0504
0.7
55
0.9
12
0.4
77
8480
hom
ework
[0.4
26]
(0.0
108)
(0.0
107)
(0.0
112)
Hel
ps
child
ren
wit
hh
om
ework
0.7
89
0.0
0427
0.0
287
0.0
219
0.0
42
0.1
12
0.5
28
8572
[0.4
08]
(0.0
124)
(0.0
123)
(0.0
120)
Op
ened
child
’sn
ote
book
inp
ast
20.2
18
0.0
325
0.0
618
0.0
466
0.0
30
0.0
94
0.0
13
8572
month
s[0
.413]
(0.0
133)
(0.0
132)
(0.0
130)
Talk
sto
child
ren
ab
ou
tsc
hool
(tim
es2.9
90.2
03
0.2
04
0.2
62
0.9
90
0.7
47
0.2
56
8525
per
wee
k)
[3.0
5]
(0.0
925)
(0.0
936)
(0.0
961)
Talk
sto
frie
nd
sor
fam
ily
ab
ou
t1.5
00.2
54
0.1
69
0.2
46
0.2
20
0.4
07
0.0
88
8520
child
’sed
uca
tion
(tim
esp
erw
eek)
[2.2
5]
(0.0
721)
(0.0
722)
(0.0
762)
Notes:
Sta
nd
ard
dev
iati
on
sin
square
bra
cket
s,st
an
dard
erro
rsin
pare
nth
eses
.C
olu
mn
s2,
3,
an
d4
dis
pla
yes
tim
ate
dco
effici
ents
of
a
regre
ssio
nof
the
ou
tcom
ein
each
row
on
trea
tmen
tgro
up
du
mm
ies,
contr
ollin
gfo
rst
ratu
md
um
mie
s,b
ase
lin
evalu
es(w
her
eavailab
le),
an
dall
vari
ab
les
inT
ab
le1,
usi
ng
hou
seh
old
-lev
elaver
ages
for
child
-lev
elvari
ab
les.
Mis
sin
gvalu
esof
contr
ol
vari
ab
les
are
cod
edas
0,
wit
h
ad
dit
ion
al
du
mm
ies
ind
icati
ng
mis
sin
gvalu
es.
Colu
mn
5d
isp
lays
the
p-v
alu
eof
the
F-t
est
that
the
imp
act
sof
ML
an
dC
HA
MP
are
equ
al.
Colu
mn
6d
isp
lays
the
p-v
alu
eof
the
F-t
est
that
the
ML
,C
HA
MP
,an
dM
L-C
HA
MP
imp
act
sare
equ
al.
Colu
mn
7d
isp
lays
the
p-v
alu
eof
the
F-t
est
that
the
imp
act
of
ML
-CH
AM
Peq
uals
the
sum
of
the
ML
an
dC
HA
MP
imp
act
s.S
tan
dard
erro
rsare
clu
ster
edat
the
villa
ge
level
.a
Th
eM
oth
ers’
Part
icip
ati
on
Ind
exis
an
orm
alize
daver
age
of
z-sc
ore
sof
the
oth
ervari
ab
les
inth
eta
ble
,u
sin
gth
eco
ntr
ol
gro
up
mea
ns
an
d
stan
dard
dev
iati
on
s.T
he
base
lin
ep
art
icip
ati
on
ind
exon
lyin
clu
des
ind
icato
rsfo
rw
hic
hd
ata
wer
eco
llec
ted
.bChild
refe
rsto
on
era
nd
om
lyse
lect
edch
ild
per
hou
seh
old
aged
5to
8at
base
lin
e.c
Th
isvari
ab
lein
dic
ate
sw
het
her
the
most
rece
nt
vis
itto
the
child
’ssc
hoolw
as
tod
iscu
ssch
ild
stu
die
sw
ith
sch
oolst
aff
,att
end
ap
are
nt-
teach
erm
eeti
ng,
or
toin
quir
eor
com
pla
inab
ou
tla
ckof
teach
ereff
ort
.
25
out the other when they were combined.
We next turn to the effects of the programs on mother’s and children’s timeuse. To the extent that the interventions encouraged participation in children’slearning at home, we hypothesized that they would increase mothers’ time spentdirectly helping children learn and child time spent learning at home. However,we find limited evidence of these effects. Panel A of Table 7 presents impact esti-mates of the programs on mothers’ weekly time spent with children and workinginside and outside of the household.38 Across all measures, we see little evidencethat the programs impacted time use. Time spent helping children with home-work increased by about 0.1 hours for each of the three interventions, but theseestimates are not statistically significant. Panel B of Table 7 presents the esti-mated impacts of the programs on weekly time use of the randomly-selected 5 to8-year-old child in the household. As with the results for mothers, we find fewsignificant impacts across the range of measures. There is suggestive evidencethat the CHAMP program resulted in modest increases in time spent on home-work: the impact was 0.15 hours per week for CHAMP and 0.20 hours per weekfor ML-CHAMP, but neither is statistically significant at conventional levels.39
Table 8 presents estimated treatment effects on the presence of education assetsin the home, as reported by the mother.40 These assets include pencils, schoolbooks, other books, newspapers and magazines, and slates. The first row ofTable 8 displays the impacts on an index of the five types of assets, where theindex is constructed in the manner described above. The ML, CHAMP, and ML-CHAMP interventions had significant impacts on the index, with magnitudes of0.057, 0.081, and 0.090 standard deviations. Among the individual asset types,the CHAMP intervention had statistically significant effects on the presence ofpencils and newspapers/magazines, while ML-CHAMP significantly increased thepresence of school books, other books, and slates. For the ML intervention, theonly statistically significant effect is on the presence of school books.
We note that although neither intervention provided any of these materials forhome use, the ML program did provide small workbooks to mothers. Becausethe presence of the education assets was self reported we cannot rule out thepossibility that some mothers confused these workbooks for school books. When
38The measures presented here are a subset of those listed in the PAP. Online Appendix Tables A7and A8 present impacts on all of the time use variables listed in the PAP for mothers and children,respectively.
39The time-use results also provide suggestive evidence that ML and ML-CHAMP increased workhours by both the mother and child. ML-CHAMP increased paid, agricultural and livestock work ofthe mother by 1.6 hours per week (significant at the 10 percent level), and effect of ML is 1.2 hours perweek, falling just short of statistical significance at conventional levels. ML-CHAMP also increased thechild’s time spent working in a household business by 0.30 hours (significant at the 5 percent level). Wespeculate that the skills taught and positive messages about employment in the maternal literacy classescould have given mothers more confidence and skills to work independently and to manage the child’stime working. Child labor could also have increased as a result of the increase in child skills. However,given the lack of statistical significance of many of these estimates and the large number of coefficientsestimated on time use, these results may also be due to chance.
40When the mother was unsure that a particular item fell into one of the categories, the surveyorverified it visually.
26
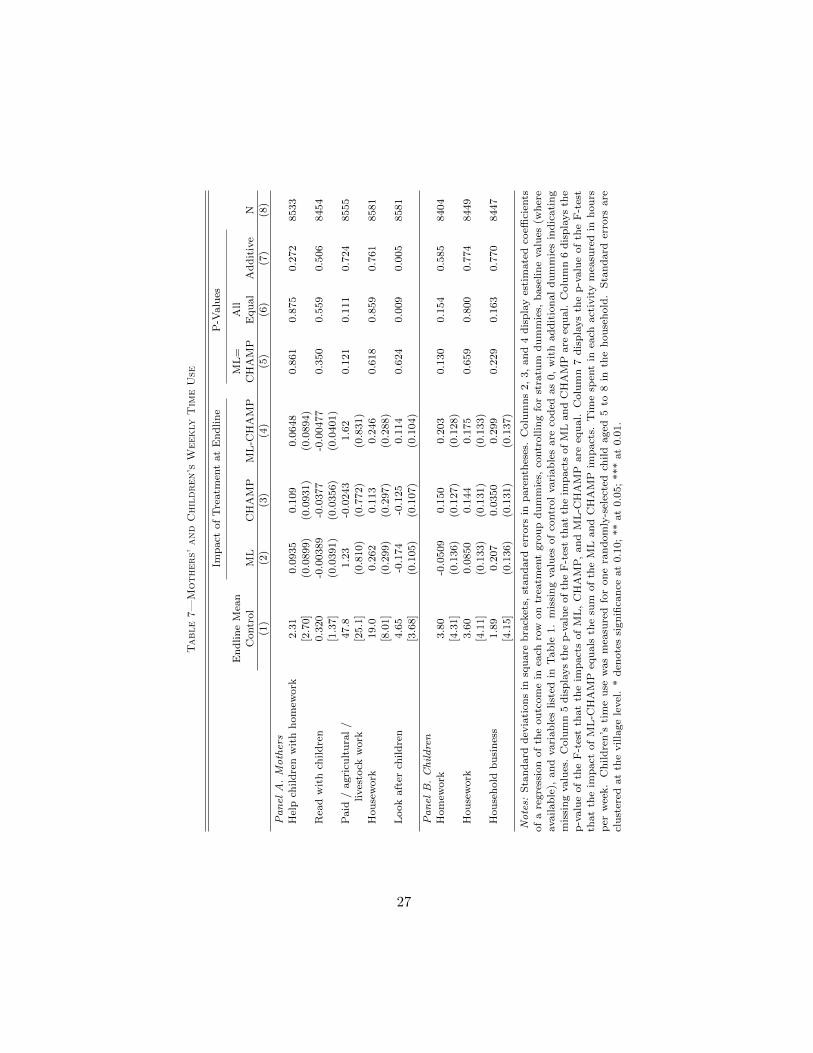
Table7—
Mothers’
and
Children’s
Weekly
Tim
eUse
Imp
act
of
Tre
atm
ent
at
End
lin
eP
-Valu
es
En
dlin
eM
ean
ML
=A
llC
ontr
ol
ML
CH
AM
PM
L-C
HA
MP
CH
AM
PE
qu
al
Ad
dit
ive
N(1
)(2
)(3
)(4
)(5
)(6
)(7
)(8
)
Panel
A.Mothers
Hel
pch
ild
ren
wit
hh
om
ework
2.3
10.0
935
0.1
09
0.0
648
0.8
61
0.8
75
0.2
72
8533
[2.7
0]
(0.0
899)
(0.0
931)
(0.0
894)
Rea
dw
ith
child
ren
0.3
20
-0.0
0389
-0.0
377
-0.0
0477
0.3
50
0.5
59
0.5
06
8454
[1.3
7]
(0.0
391)
(0.0
356)
(0.0
401)
Paid
/agri
cult
ura
l/
47.8
1.2
3-0
.0243
1.6
20.1
21
0.1
11
0.7
24
8555
lives
tock
work
[25.1
](0
.810)
(0.7
72)
(0.8
31)
Hou
sew
ork
19.0
0.2
62
0.1
13
0.2
46
0.6
18
0.8
59
0.7
61
8581
[8.0
1]
(0.2
99)
(0.2
97)
(0.2
88)
Look
aft
erch
ild
ren
4.6
5-0
.174
-0.1
25
0.1
14
0.6
24
0.0
09
0.0
05
8581
[3.6
8]
(0.1
05)
(0.1
07)
(0.1
04)
Panel
B.Children
Hom
ework
3.8
0-0
.0509
0.1
50
0.2
03
0.1
30
0.1
54
0.5
85
8404
[4.3
1]
(0.1
36)
(0.1
27)
(0.1
28)
Hou
sew
ork
3.6
00.0
850
0.1
44
0.1
75
0.6
59
0.8
00
0.7
74
8449
[4.1
1]
(0.1
33)
(0.1
31)
(0.1
33)
Hou
seh
old
bu
sin
ess
1.8
90.2
07
0.0
350
0.2
99
0.2
29
0.1
63
0.7
70
8447
[4.1
5]
(0.1
36)
(0.1
31)
(0.1
37)
Notes:
Sta
nd
ard
dev
iati
on
sin
squ
are
bra
cket
s,st
an
dard
erro
rsin
pare
nth
eses
.C
olu
mn
s2,
3,
an
d4
dis
pla
yes
tim
ate
dco
effici
ents
of
are
gre
ssio
nof
the
ou
tcom
ein
each
row
on
trea
tmen
tgro
up
du
mm
ies,
contr
ollin
gfo
rst
ratu
md
um
mie
s,b
ase
lin
evalu
es(w
her
eavailab
le),
an
dvari
ab
les
list
edin
Tab
le1.
mis
sin
gvalu
esof
contr
ol
vari
ab
les
are
cod
edas
0,
wit
had
dit
ion
al
du
mm
ies
ind
icati
ng
mis
sin
gvalu
es.
Colu
mn
5d
isp
lays
the
p-v
alu
eof
the
F-t
est
that
the
imp
act
sof
ML
an
dC
HA
MP
are
equ
al.
Colu
mn
6d
isp
lays
the
p-v
alu
eof
the
F-t
est
that
the
imp
act
sof
ML
,C
HA
MP
,an
dM
L-C
HA
MP
are
equ
al.
Colu
mn
7d
isp
lays
the
p-v
alu
eof
the
F-t
est
that
the
imp
act
of
ML
-CH
AM
Peq
uals
the
sum
of
the
ML
an
dC
HA
MP
imp
act
s.T
ime
spen
tin
each
act
ivit
ym
easu
red
inh
ou
rs
per
wee
k.
Ch
ild
ren
’sti
me
use
was
mea
sure
dfo
ron
era
nd
om
ly-s
elec
ted
child
aged
5to
8in
the
hou
seh
old
.S
tan
dard
erro
rsare
clu
ster
edat
the
vil
lage
level
.*
den
ote
ssi
gn
ifica
nce
at
0.1
0;
**
at
0.0
5;
***
at
0.0
1.
27
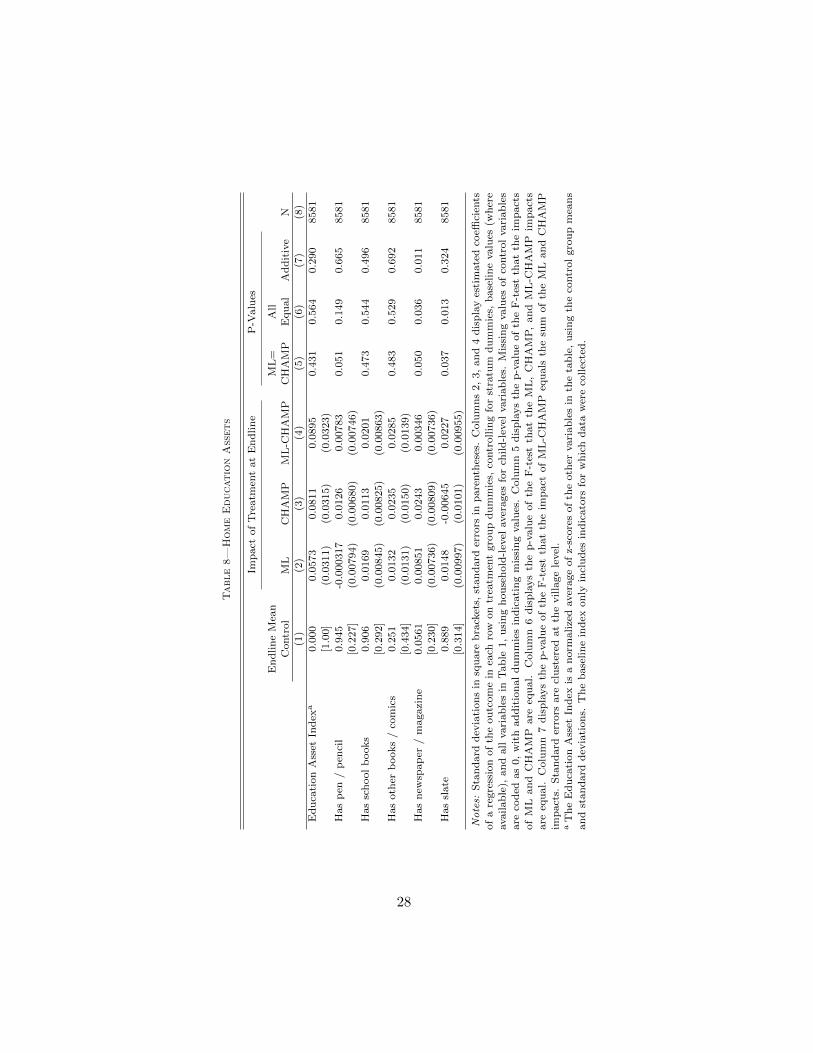
Table8—
HomeEducationAssets
Imp
act
of
Tre
atm
ent
at
En
dli
ne
P-V
alu
es
En
dlin
eM
ean
ML
=A
llC
ontr
ol
ML
CH
AM
PM
L-C
HA
MP
CH
AM
PE
qu
al
Ad
dit
ive
N(1
)(2
)(3
)(4
)(5
)(6
)(7
)(8
)
Ed
uca
tion
Ass
etIn
dex
a0.0
00
0.0
573
0.0
811
0.0
895
0.4
31
0.5
64
0.2
90
8581
[1.0
0]
(0.0
311)
(0.0
315)
(0.0
323)
Has
pen
/p
enci
l0.9
45
-0.0
00317
0.0
126
0.0
0783
0.0
51
0.1
49
0.6
65
8581
[0.2
27]
(0.0
0794)
(0.0
0680)
(0.0
0746)
Has
sch
ool
books
0.9
06
0.0
169
0.0
113
0.0
201
0.4
73
0.5
44
0.4
96
8581
[0.2
92]
(0.0
0845)
(0.0
0825)
(0.0
0863)
Has
oth
erb
ooks
/co
mic
s0.2
51
0.0
132
0.0
235
0.0
285
0.4
83
0.5
29
0.6
92
8581
[0.4
34]
(0.0
131)
(0.0
150)
(0.0
139)
Has
new
spap
er/
magazi
ne
0.0
561
0.0
0851
0.0
243
0.0
0346
0.0
50
0.0
36
0.0
11
8581
[0.2
30]
(0.0
0736)
(0.0
0809)
(0.0
0736)
Has
slate
0.8
89
0.0
148
-0.0
0645
0.0
227
0.0
37
0.0
13
0.3
24
8581
[0.3
14]
(0.0
0997)
(0.0
101)
(0.0
0955)
Notes:
Sta
nd
ard
dev
iati
on
sin
squ
are
bra
cket
s,st
an
dard
erro
rsin
pare
nth
eses
.C
olu
mn
s2,
3,
an
d4
dis
pla
yes
tim
ate
dco
effici
ents
of
are
gre
ssio
nof
the
ou
tcom
ein
each
row
on
trea
tmen
tgro
up
du
mm
ies,
contr
ollin
gfo
rst
ratu
md
um
mie
s,b
ase
lin
evalu
es(w
her
eavailab
le),
an
dall
vari
ab
les
inT
ab
le1,
usi
ng
hou
seh
old
-lev
elaver
ages
for
child
-lev
elvari
ab
les.
Mis
sin
gvalu
esof
contr
ol
vari
ab
les
are
cod
edas
0,
wit
had
dit
ion
al
du
mm
ies
ind
icati
ng
mis
sin
gvalu
es.
Colu
mn
5d
isp
lays
the
p-v
alu
eof
the
F-t
est
that
the
imp
act
s
of
ML
an
dC
HA
MP
are
equ
al.
Colu
mn
6d
isp
lays
the
p-v
alu
eof
the
F-t
est
that
the
ML
,C
HA
MP
,an
dM
L-C
HA
MP
imp
act
sare
equ
al.
Colu
mn
7d
isp
lays
the
p-v
alu
eof
the
F-t
est
that
the
imp
act
of
ML
-CH
AM
Peq
uals
the
sum
of
the
ML
an
dC
HA
MP
imp
act
s.S
tan
dard
erro
rsare
clu
ster
edat
the
villa
ge
level
.a
Th
eE
du
cati
on
Ass
etIn
dex
isa
norm
alize
daver
age
of
z-sc
ore
sof
the
oth
ervari
ab
les
inth
eta
ble
,u
sin
gth
eco
ntr
ol
gro
up
mea
ns
an
dst
an
dard
dev
iati
on
s.T
he
base
lin
ein
dex
on
lyin
clu
des
ind
icato
rsfo
rw
hic
hd
ata
wer
eco
llec
ted
.
28
school books are excluded from the index, the impact of ML falls to 0.046 andis no longer statistically significant (p-value = 0.14). CHAMP provided motherswith individual worksheets, which are not easily confused with the asset items.CHAMP also did not directly encourage purchase of any of these items.
Finally, Table 9 presents the impacts of the programs on school participation.Panel A presents impacts on school enrollment and attendance for the sample ofchildren tested at endline.41 ML-CHAMP increased current or planned enroll-ment in the upcoming school year by 1.3 percentage points (significant at the 5percent level) and attendance in school or aanganwadi (community-based kinder-garten) by 2.0 percentage points (significant at the 10 percent level).42 We alsofind impacts of about 2 percentage points of ML and ML-CHAMP on current at-tendance in formal school (significant at the 5 and 10 percent levels, respectively).Because the impacts on formal school attendance are larger than the impacts onschool or aanganwadi attendance, ML and ML-CHAMP may have encouragedmothers to shift their children from aanganwadi to first grade at earlier ages.Indeed, as shown in Panel B, the impacts on formal school attendance are nearlydouble for ML and ML-CHAMP when the sample is restricted to children aroundthe age of initial enrollment in school (ages 4 to 6 at baseline). By contrast, wefind little evidence for impacts on private school attendance, school days missed,or monthly tuition expenditures. These results are supported by our qualitativeinterviews, in which many parents claimed that the most they could do within theformal schooling system was send their children to school and cited poor qualityof government schools and poor access to private schools as barriers they couldnot overcome.
V. Discussion
A. Children’s Attendance in Maternal Literacy Classes
As discussed in Section I, the theory of change of the ML intervention was thatmothers’ attendance in the classes would lead to changes in mothers’ decisionsand behaviors, ultimately leading to improved children’s learning. However, as wedocument in Section III, children attended the ML classes in addition to mothers.In this section we present suggestive evidence that attendance of mothers mayhave served as a more important mediator of impacts compared with children’sattendance. We focus on impacts on math scores, where we find statisticallysignificant impacts of the ML intervention.43
41Panel A of Table 9 differs from the PAP in two ways. First, in order to more closely follow thetest score results we have restricted our sample to children tested at endline (the majority of whom wereaged 3 to 8 at baseline), while the PAP measured school participation for all children aged 3 to 14. Wefind no evidence for school participation on this broader group (results not shown). Second, we includeparticipation in formal school (excluding kindergarten), which was not included in the PAP.
42School attendance and aanganwadi attendance were measured through the questions “Does the childgo to school or aanganwadi?” and “What grade does the child attend?”
43As shown in section III, some children also participated directly in CHAMP. Because we have limiteddata on the extent and nature of this direct participation, however, we focus the analysis on children’s
29
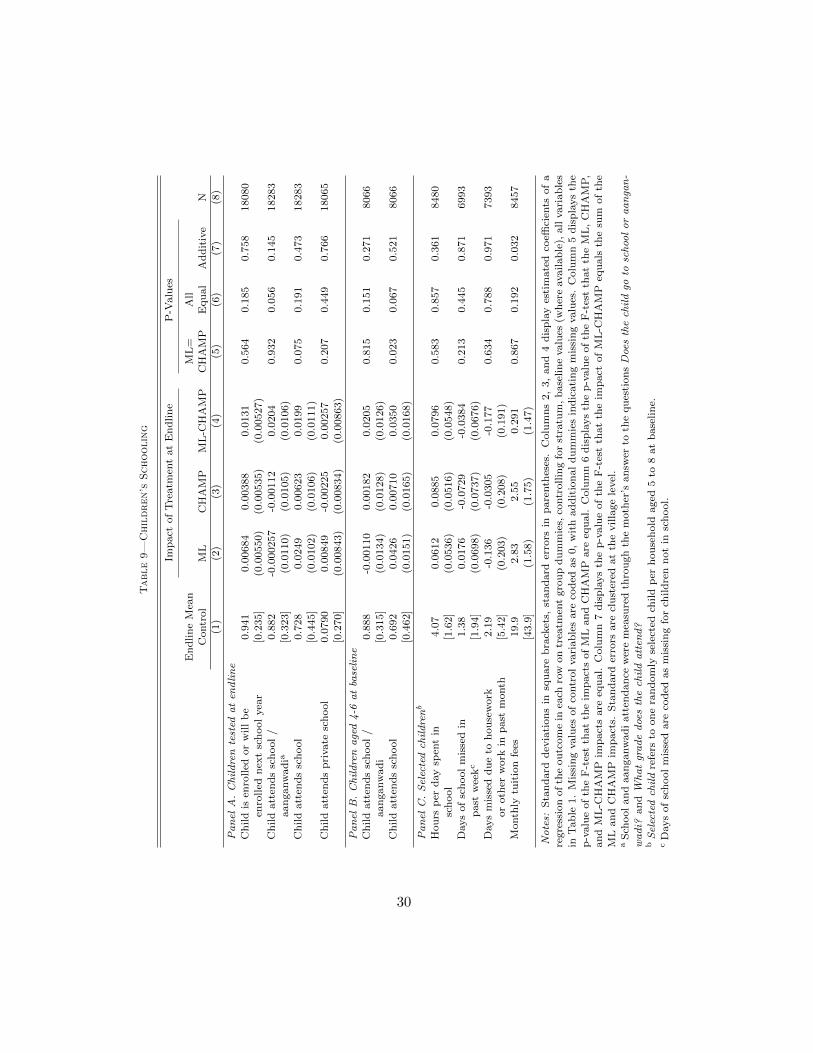
Table9—
Children’s
Schooling
Imp
act
of
Tre
atm
ent
at
En
dli
ne
P-V
alu
es
En
dlin
eM
ean
ML
=A
llC
ontr
ol
ML
CH
AM
PM
L-C
HA
MP
CH
AM
PE
qu
al
Ad
dit
ive
N(1
)(2
)(3
)(4
)(5
)(6
)(7
)(8
)
Panel
A.Childrentested
aten
dline
Ch
ild
isen
rolled
or
will
be
0.9
41
0.0
0684
0.0
0388
0.0
131
0.5
64
0.1
85
0.7
58
18080
enro
lled
nex
tsc
hool
yea
r[0
.235]
(0.0
0550)
(0.0
0535)
(0.0
0527)
Ch
ild
att
end
ssc
hool
/0.8
82
-0.0
00257
-0.0
0112
0.0
204
0.9
32
0.0
56
0.1
45
18283
aan
ganw
ad
ia[0
.323]
(0.0
110)
(0.0
105)
(0.0
106)
Ch
ild
att
end
ssc
hool
0.7
28
0.0
249
0.0
0623
0.0
199
0.0
75
0.1
91
0.4
73
18283
[0.4
45]
(0.0
102)
(0.0
106)
(0.0
111)
Ch
ild
att
end
sp
rivate
sch
ool
0.0
790
0.0
0849
-0.0
0225
0.0
0257
0.2
07
0.4
49
0.7
66
18065
[0.2
70]
(0.0
0843)
(0.0
0834)
(0.0
0863)
Panel
B.Childrenaged4-6
atbaseline
Ch
ild
att
end
ssc
hool
/0.8
88
-0.0
0110
0.0
0182
0.0
205
0.8
15
0.1
51
0.2
71
8066
aan
ganw
ad
i[0
.315]
(0.0
134)
(0.0
128)
(0.0
126)
Ch
ild
att
end
ssc
hool
0.6
92
0.0
426
0.0
0710
0.0
350
0.0
23
0.0
67
0.5
21
8066
[0.4
62]
(0.0
151)
(0.0
165)
(0.0
168)
Panel
C.Selectedch
ildrenb
Hou
rsp
erd
ay
spen
tin
4.0
70.0
612
0.0
885
0.0
796
0.5
83
0.8
57
0.3
61
8480
sch
ool
[1.6
2]
(0.0
536)
(0.0
516)
(0.0
548)
Days
of
sch
ool
mis
sed
in1.3
80.0
176
-0.0
729
-0.0
384
0.2
13
0.4
45
0.8
71
6993
past
wee
kc
[1.9
4]
(0.0
698)
(0.0
737)
(0.0
676)
Days
mis
sed
du
eto
hou
sew
ork
2.1
9-0
.136
-0.0
305
-0.1
77
0.6
34
0.7
88
0.9
71
7393
or
oth
erw
ork
inp
ast
month
[5.4
2]
(0.2
03)
(0.2
08)
(0.1
91)
Month
lytu
itio
nfe
es19.9
2.8
32.5
50.2
91
0.8
67
0.1
92
0.0
32
8457
[43.9
](1
.58)
(1.7
5)
(1.4
7)
Notes:
Sta
nd
ard
dev
iati
on
sin
squ
are
bra
cket
s,st
an
dard
erro
rsin
pare
nth
eses
.C
olu
mn
s2,
3,
an
d4
dis
pla
yes
tim
ate
dco
effici
ents
of
are
gre
ssio
nof
the
ou
tcom
ein
each
row
on
trea
tmen
tgro
up
du
mm
ies,
contr
oll
ing
for
stra
tum
,b
ase
lin
evalu
es(w
her
eavailab
le),
all
vari
ab
les
inT
ab
le1.
Mis
sin
gvalu
esof
contr
ol
vari
ab
les
are
cod
edas
0,
wit
had
dit
ion
al
du
mm
ies
ind
icati
ng
mis
sin
gvalu
es.
Colu
mn
5d
isp
lays
the
p-v
alu
eof
the
F-t
est
that
the
imp
act
sof
ML
an
dC
HA
MP
are
equ
al.
Colu
mn
6d
isp
lays
the
p-v
alu
eof
the
F-t
est
that
the
ML
,C
HA
MP
,an
dM
L-C
HA
MP
imp
act
sare
equ
al.
Colu
mn
7d
isp
lays
the
p-v
alu
eof
the
F-t
est
that
the
imp
act
of
ML
-CH
AM
Peq
uals
the
sum
of
the
ML
an
dC
HA
MP
imp
act
s.S
tan
dard
erro
rsare
clu
ster
edat
the
villa
ge
level
.a
Sch
ool
an
daan
ganw
ad
iatt
end
an
cew
ere
mea
sure
dth
rou
gh
the
moth
er’s
an
swer
toth
equ
esti
onsDoesthech
ildgo
toschoo
loraanga
n-
wadi?
an
dW
hatgradedoesthech
ildatten
d?
bSelectedch
ild
refe
rsto
on
era
nd
om
lyse
lect
edch
ild
per
hou
seh
old
aged
5to
8at
base
lin
e.c
Days
of
sch
ool
mis
sed
are
cod
edas
mis
sin
gfo
rch
ild
ren
not
insc
hool.
30
We first analyze the potential impacts of mothers’ and children’s attendance byexploiting the design of the experiment. As described in Section II, the treatmentassignment was stratified geographically for ease of implementation. Sets of 20geographically proximate villages were selected, and these sets were randomly splitinto two phases of 10 villages each to determine the order of program rollout. Therandomization was stratified by these 48 set-by-phase groups of 10 villages. Wethus have 48 “separate” randomized experiments within the larger experiment of480 villages. In addition to geographic differences and slight differences in thetiming of program initiation, each Pratham supervisor was assigned to a set of20 villages, potentially giving rise to implementation differences across strata.These implementation differences—such as in the timing of classes and in the ofrecruitment of mothers—could give rise to different patterns of take-up of mothersand children in each strata. To the extent that these take-up patterns influencedprogram impacts, we can examine the relationship between mothers’ or children’stake-up in each stratum and the learning impacts on children.
For each stratum, we estimate 48 separate ML treatment effects on mothers’ at-tendance, children’s attendance, and children’s test scores using the specificationin Equation (1).44 For a consistent measures of attendance for both mothers andchildren across treatment and control groups, we rely on self-reported attendancefrom the endline survey. We then correlate the treatment effects on children’smath scores with the effects on mother’s or children’s attendance. The resultsare plotted in online Appendix Figure A2. There is a clear positive relationshipbetween the stratum-wise ML treatment effects on children’s math scores andmothers’ attendance (ρ = 0.31, p-value = 0.03), but not children’s attendance(ρ = −0.084, p-value = 0.57). These relationships are, of course, correlations,but they do suggest that attendance of mothers, rather than attendance of chil-dren, is most closely related to the impacts on children’s test scores.
We next analyze the potential effect of attendance by including attendance ofmothers and children as regressors in the main children’s learning specificationfrom Section IV.B. Inclusion of endogenous intermediate outcome variables inan impact estimation can provide suggestive evidence for the influence of thesevariables as mediators of impacts (Baron and Kinney, 1986). When the interme-diate outcome variable is included, a decrease in the coefficient of the treatmentvariable and a positive coefficient on the intermediate variable suggests that thisvariable is a mediator of the treatment effect. However, this rests on several strongassumptions (Green et al., 2010; Imai et al., 2011). In particular, the analysisassumes that the intermediate variable is uncorrelated with other factors thatinfluence the final outcome variable. If, for example, the intermediate variable ispositively correlated with these unobserved factors, then the variable may appearto be a mediator due to omitted variable bias. Alternatively, if the intermediatevariable is measured with error, then the analysis will tend to underestimate the
attendance in ML classes.44This is implemented by interacting the treatment groups with dummies for the 48 strata.
31
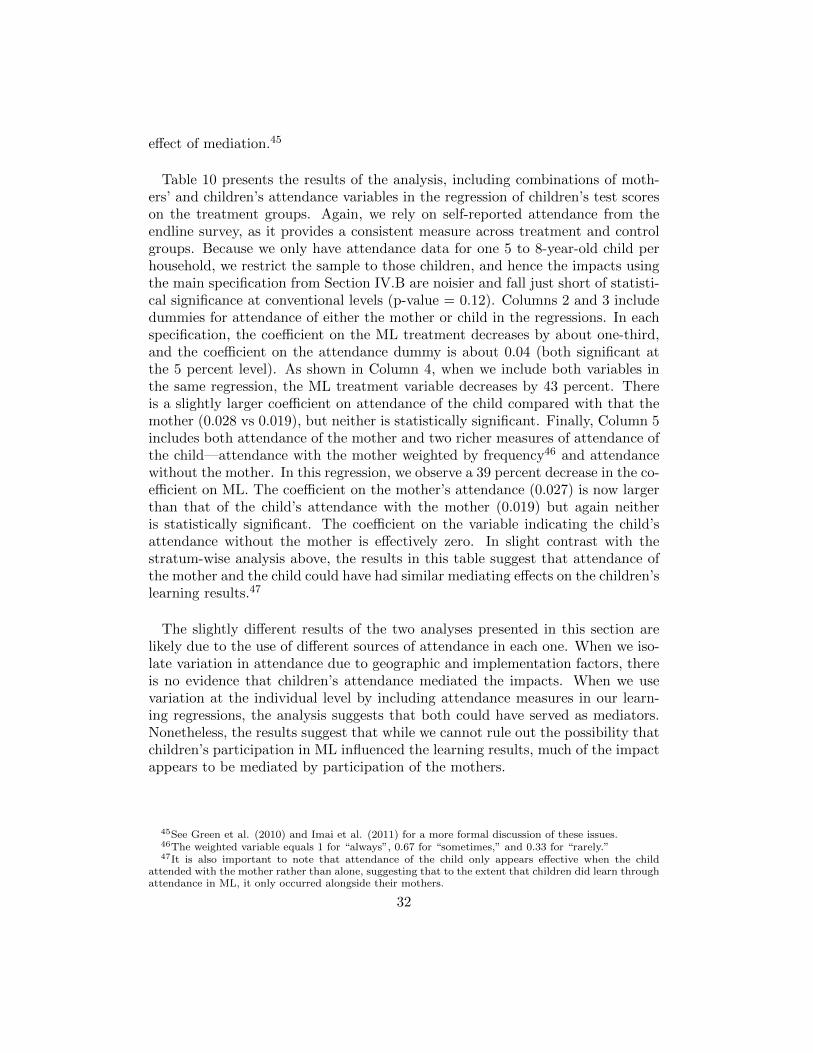
effect of mediation.45
Table 10 presents the results of the analysis, including combinations of moth-ers’ and children’s attendance variables in the regression of children’s test scoreson the treatment groups. Again, we rely on self-reported attendance from theendline survey, as it provides a consistent measure across treatment and controlgroups. Because we only have attendance data for one 5 to 8-year-old child perhousehold, we restrict the sample to those children, and hence the impacts usingthe main specification from Section IV.B are noisier and fall just short of statisti-cal significance at conventional levels (p-value = 0.12). Columns 2 and 3 includedummies for attendance of either the mother or child in the regressions. In eachspecification, the coefficient on the ML treatment decreases by about one-third,and the coefficient on the attendance dummy is about 0.04 (both significant atthe 5 percent level). As shown in Column 4, when we include both variables inthe same regression, the ML treatment variable decreases by 43 percent. Thereis a slightly larger coefficient on attendance of the child compared with that themother (0.028 vs 0.019), but neither is statistically significant. Finally, Column 5includes both attendance of the mother and two richer measures of attendance ofthe child—attendance with the mother weighted by frequency46 and attendancewithout the mother. In this regression, we observe a 39 percent decrease in the co-efficient on ML. The coefficient on the mother’s attendance (0.027) is now largerthan that of the child’s attendance with the mother (0.019) but again neitheris statistically significant. The coefficient on the variable indicating the child’sattendance without the mother is effectively zero. In slight contrast with thestratum-wise analysis above, the results in this table suggest that attendance ofthe mother and the child could have had similar mediating effects on the children’slearning results.47
The slightly different results of the two analyses presented in this section arelikely due to the use of different sources of attendance in each one. When we iso-late variation in attendance due to geographic and implementation factors, thereis no evidence that children’s attendance mediated the impacts. When we usevariation at the individual level by including attendance measures in our learn-ing regressions, the analysis suggests that both could have served as mediators.Nonetheless, the results suggest that while we cannot rule out the possibility thatchildren’s participation in ML influenced the learning results, much of the impactappears to be mediated by participation of the mothers.
45See Green et al. (2010) and Imai et al. (2011) for a more formal discussion of these issues.46The weighted variable equals 1 for “always”, 0.67 for “sometimes,” and 0.33 for “rarely.”47It is also important to note that attendance of the child only appears effective when the child
attended with the mother rather than alone, suggesting that to the extent that children did learn throughattendance in ML, it only occurred alongside their mothers.
32
Table 10—Children’s Math Impacts: Controlling for ML Attendance
Dependent Variable: Child’s Math Score
Included Attendance Variable(s)
Mother MotherAttended Attended
Mother Child and Child and ChildMain Attended Attended Attended Attended
(1) (2) (3) (4) (5)
ML 0.0337 0.0213 0.0227 0.0191 0.0206
(0.0214) (0.0219) (0.0217) (0.0219) (0.0219)CHAMP 0.0500 0.0492 0.0493 0.0492 0.0489
(0.0207) (0.0207) (0.0207) (0.0207) (0.0207)
ML-CHAMP 0.0546 0.0404 0.0417 0.0380 0.0395(0.0197) (0.0209) (0.0202) (0.0209) (0.0209)
Mother attended 0.0354 0.0192 0.0272
(0.0162) (0.0191) (0.0195)Child attended 0.0406 0.0284
(0.0171) (0.0200)
Child attended with mother 0.0194(weighted)a (0.0324)
Child attended alone -0.00439
(0.0223)
R-Squared 0.709 0.709 0.709 0.709 0.709N 8367 8311 8262 8262 8241
Notes: This table presents regressions using the specification from Table 3, including self-
reported measures of mother’s and child’s attendance measured in the endline survey as regres-
sors. The sample consists of one randomly selected child aged 5 to 8 in the household.a Child’s attendance with mother is weighted by frequency of attendance: Always = 1, Some-
times = 0.67, and Rarely = 0.33.
B. Mediation of Impacts Through Intermediate Outcomes
The ML, CHAMP, and combined ML-CHAMP programs influenced a numberof intermediate outcomes that could have led to the observed impacts on children’slearning. In the case of ML, we observe significant impacts on mothers’ averagelearning levels, increased participation in their children’s education as measuredthrough our participation index, but not an increase in time spent directly helpingtheir children with homework. We also find impacts on education assets availablein the home and on attendance in formal schooling. CHAMP had smaller impactson mothers’ learning, but larger impacts on mothers’ participation and educationassets.
In Table 11 we present suggestive evidence of the importance of these inter-mediate outcomes by including these measures as regressors in the estimation ofimpacts on children’s test scores, as was done in the previous section with mea-sures of attendance. As before, we focus on math outcomes, where we observedsignificant impacts from all three interventions. We also restrict our sample tothe one selected 5 to 8-year-old child per household to parallel the analysis in theprevious section, and because some of the survey questions in the participation
33
index focused on those children.
As in Table 10, each column of Table 11 includes a separate variable or vari-ables representing the intermediate outcomes, with the first column displayingthe results using the specification from Section IV.B for reference. In all cases,we include baseline values of the intermediate outcomes as controls, and thus thedisplayed coefficients on the endline variables can be interpreted as their influ-ence relative to baseline. Column 2 includes endline mothers’ math and languagescores. Inclusion of these variables decreases coefficient on the ML treatmentdummy by 43 percent and the impact of CHAMP by 12 percent. One standarddeviation higher math (language) score of the mother is associated with a higherchild’s test score of 0.073 (0.053) standard deviations (both significant at the 1percent level). As shown in Column 3, inclusion of the participation index reducesthe coefficient on the ML treatment by 13 percent and the CHAMP coefficient by11 percent. We observe similar reductions in the coefficients when the educationasset index is included. When we include formal school attendance, the coeffi-cient on ML drops 34 percent, and the coefficient on CHAMP drops 3 percent.As shown in Column 6, when all intermediate variables are included in the regres-sion, the coefficient on ML decreases 82 percent, and the coefficient on CHAMPdecreases 22 percent. In this regression, the mothers’ test score variables, theasset index, and the school attendance variables have about the same magnitudeas in the individual regressions and remain statistically significant, while the co-efficient on the participation index becomes closer to zero and is not statisticallysignificant. Finally, in Column 7 we include attendance of the mother and childin the ML classes to the specification in Column 6. Inclusion of these variableshas virtually no influence on the coefficients on the other intermediate outcomes.
Although we emphasize that this analysis rests on strong assumptions and mustbe taken as suggestive, the patterns from the analysis highlights several poten-tial pathways for impact. First, our index of mothers’ participation in children’slearning appears to be a modest mediator of the learning impacts, while mothers’learning appears much stronger, both in the regressions where each measure isincluded individually and in the regressions where all mediators are included to-gether. This could suggest that mothers’ learning could be influencing the qualityof interactions beyond what is measured in the participation index, which pri-marily measures the different types of involvement of the mother. Alternatively,it could suggest that the participation index is measured with error, in that itdoes not fully reflect all of the potential activities the mother could do with herchild. Second, the analysis suggests that formal school attendance is a strongmediator of impacts for the ML intervention. This implies that ML could haveincreased interest in formal schooling, and mothers responded by ensuring atten-dance in school—a margin they considered particularly feasible, according to ourqualitative interviews. Third, when all intermediate outcomes are included to-gether, they account for almost all of the ML impact, but only about a quarter ofCHAMP impact. This could imply more potential for direct impacts of CHAMP
34
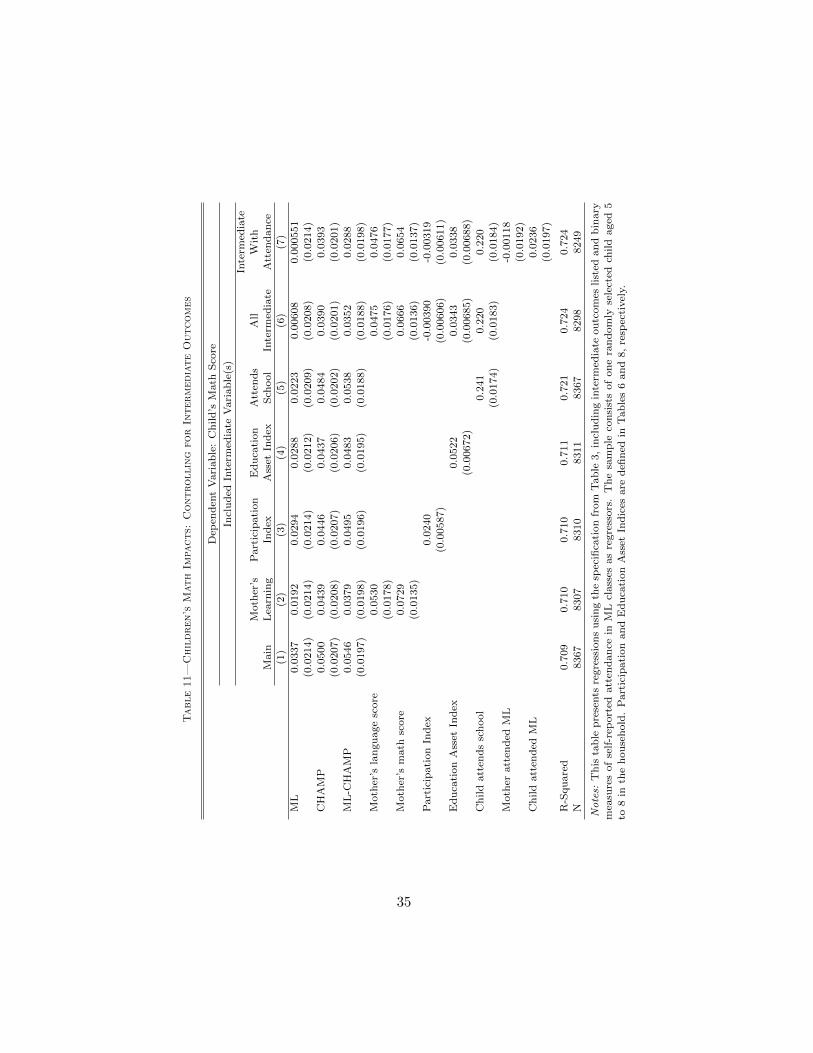
Table11—
Children’s
MathIm
pacts:
Controlling
forIn
termediateOutcomes
Dep
end
ent
Vari
ab
le:
Ch
ild
’sM
ath
Sco
re
Incl
ud
edIn
term
edia
teV
ari
ab
le(s
)In
term
edia
teM
oth
er’s
Part
icip
ati
on
Ed
uca
tion
Att
end
sA
llW
ith
Main
Lea
rnin
gIn
dex
Ass
etIn
dex
Sch
ool
Inte
rmed
iate
Att
end
an
ce(1
)(2
)(3
)(4
)(5
)(6
)(7
)
ML
0.0
337
0.0
192
0.0
294
0.0
288
0.0
223
0.0
0608
0.0
00551
(0.0
214)
(0.0
214)
(0.0
214)
(0.0
212)
(0.0
209)
(0.0
208)
(0.0
214)
CH
AM
P0.0
500
0.0
439
0.0
446
0.0
437
0.0
484
0.0
390
0.0
393
(0.0
207)
(0.0
208)
(0.0
207)
(0.0
206)
(0.0
202)
(0.0
201)
(0.0
201)
ML
-CH
AM
P0.0
546
0.0
379
0.0
495
0.0
483
0.0
538
0.0
352
0.0
288
(0.0
197)
(0.0
198)
(0.0
196)
(0.0
195)
(0.0
188)
(0.0
188)
(0.0
198)
Moth
er’s
lan
gu
age
score
0.0
530
0.0
475
0.0
476
(0.0
178)
(0.0
176)
(0.0
177)
Moth
er’s
math
score
0.0
729
0.0
666
0.0
654
(0.0
135)
(0.0
136)
(0.0
137)
Part
icip
ati
on
Ind
ex0.0
240
-0.0
0390
-0.0
0319
(0.0
0587)
(0.0
0606)
(0.0
0611)
Ed
uca
tion
Ass
etIn
dex
0.0
522
0.0
343
0.0
338
(0.0
0672)
(0.0
0685)
(0.0
0688)
Ch
ild
att
end
ssc
hool
0.2
41
0.2
20
0.2
20
(0.0
174)
(0.0
183)
(0.0
184)
Moth
eratt
end
edM
L-0
.00118
(0.0
192)
Ch
ild
att
end
edM
L0.0
236
(0.0
197)
R-S
qu
are
d0.7
09
0.7
10
0.7
10
0.7
11
0.7
21
0.7
24
0.7
24
N8367
8307
8310
8311
8367
8298
8249
Notes:
Th
ista
ble
pre
sents
regre
ssio
ns
usi
ng
the
spec
ifica
tion
from
Tab
le3,
incl
ud
ing
inte
rmed
iate
ou
tcom
eslist
edan
db
inary
mea
sure
sof
self
-rep
ort
edatt
end
an
cein
ML
class
esas
regre
ssors
.T
he
sam
ple
con
sist
sof
on
era
nd
om
lyse
lect
edch
ild
aged
5
to8
inth
eh
ou
seh
old
.P
art
icip
ati
on
an
dE
du
cati
on
Ass
etIn
dic
esare
defi
ned
inT
ab
les
6an
d8,
resp
ecti
vel
y.
35
on the child beyond the involvement of the mother, but it is also possible that ourmeasures are simply not picking up the precise changes in the home environmentthat led to increased children’s learning.
In addition, the specification of Column 7 shows that the influence of theseintermediate outcomes is not confounded by children’s attendance in ML, as thecoefficients do not change when the attendance of the child is included in the re-gression. This provides further evidence to the finding of the previous section thatthe children’s learning results in ML were largely driven by mothers’ attendance.Nonetheless, we emphasize these analyses presented should be viewed as sugges-tive, and research designs explicitly testing the influence of specific intermediateoutcomes as well as mothers’ and children’s attendance in these programs wouldbe a fruitful area for future work.
C. Cost Effectiveness
This section presents a discussion of cost effectiveness of the three interventionsin improving children’s and mothers’ test scores. As with most cost-effectivenesscomparisons across studies, we note that differences in target population, compe-tencies tested, testing instruments, local prices, and methods of calculating costsmay limit comparability. Our cost-benefit calculation follows the methodology inKremer, et. al (2013).
Details of the cost-benefit calculation are provided in online Appendix Ta-ble A9. While both interventions included a similar amount of Pratham stafftime—either supervising the volunteers and classes in ML or running the ses-sions in CHAMP—the cost of the ML intervention also included the opportunitycosts of volunteer time. This difference leads to much higher cost per beneficiaryhousehold in ML ($34 compared with $17 per household in CHAMP).
For children, each $100 spent on ML, CHAMP, and ML-CHAMP resulted inimprovements in math scores of 0.22, 0.40, and 0.24 standard deviations, respec-tively. The greater cost-effectiveness of CHAMP is driven by the lower costsof the intervention, as both ML and CHAMP had similar treatment effects onchildren. For mothers, each $100 spent on the ML, CHAMP, and ML-CHAMPinterventions resulted in improvements in mothers’ total test scores of 0.28, 0.26,and 0.24 standard deviations, respectively. The similarity in cost effectivenessbetween the ML and CHAMP interventions is due to the fact that while ML wasabout twice as expensive, the effects of ML on mothers were twice as large as theeffects of CHAMP.
Because there are no other cost-benefit calculations of program effects on adultlearning that we know of, we focus our comparison with the literature on learningimpacts on children. Our impact estimates, ranging from 0.03 to 0.06 standarddeviations, fall below the range of statistically-significant estimates in the Kre-mer et al. (2013) study. This latter set of estimates ranges from 0.13 standarddeviations to 0.59 standard deviations. Out of the 15 studies in Kremer et al.
36
(2013) that found statistically significant impacts, 14 are also more cost effectivethan the interventions studied here.
Even though the interventions studied here may be less cost effective than othersin improving child test scores, our study examines and finds impacts on a broad setof outcomes, including mothers’ learning—a key policy objective of adult literacyprograms. However, given the lack of data for other adult literacy programs, weare unable to perform comparisons along these additional dimensions. Our studyshould serve as a starting point for future work to expand the evidence base sothat more explicit cost-effectiveness comparisons can be made in the future.
VI. Conclusion
In developing countries, adult literacy programs have been credited with im-proving children’s education outcomes by encouraging parental investments ineducation and an improved home learning environment. Programs that encour-age parental involvement have also been cited as a means of improving children’seducation through similar channels. In spite of the potential of these programs toachieve these objectives, there has been little rigorous evidence on whether theyare actually effective.
Our paper evaluates the impacts of three variants of these programs, each tar-geting mothers in rural India: an adult literacy program, a participation program,and a combination of the two. We show that each of these three programs hadmodest impacts on children’s learning levels, particularly math scores.
The programs also influenced several intermediate outcomes related to decisionsof mothers and the home learning environment that could in turn have affectedchildren’s learning: all three had impacts on mothers’ learning levels, interest inparticipation in child education, reported levels of participation, and the presenceof educational materials at home. By contrast, we find no significant impacts ontime spent directly helping children with homework. This suggests that childoutcomes could have been influenced by the quality of time spent, or frequencyor type of interactions, even if there was no increase in time spent helping withhomework. We also find that the maternal literacy and combined programs in-creased children’s attendance in formal schooling.
A more direct mechanism could be that children learned by participating di-rectly in the programs, independent of how the mother was affected. Indeed,children did attend ML classes and were often present during CHAMP sessions.If children’s participation was found to be the sole mechanism through whichchildren learned, it would call in to question a key assumption in the programs’theory of change—that the decisions of mothers and the home environment wereintegral inputs into their children’s learning. Based on the wishes of the partnerNGO, it was not feasible to prevent children from attending ML classes or toprevent direct involvement of children in CHAMP. Our experimental design thusdoes not allow us to rule out the influence of direct participation of children onthe impacts on children’s test scores.
37

However, in the case of ML classes, we provide suggestive evidence that at-tendance of children was likely not the primary mechanism for the children’slearning impacts. We also show that for the ML intervention, improvements inmothers’ learning levels, participation in their children’s education, presence of ed-ucational materials at home, and children’s school attendance can almost entirelyaccount for the impacts we observe on children’s learning. Of these, improve-ment in mothers’ learning itself appears to be the largest mediator of impacts.For the CHAMP intervention, the analysis shows that the intermediate outcomeswere smaller mediators of children’s learning, suggesting a greater role of directchildren’s participation or household involvement that was not measured in oursurveys.
We conclude that although we cannot fully isolate the specific channels throughwhich the programs influenced children’s learning, the evidence is generally con-sistent with our hypothesis that the programs would influence children’s learn-ing through changes in mothers’ decisions and the home learning environment—mechanisms previously identified in studies of the intergenerational transmissionof human capital. However, we note that while we are able to show that similarmechanisms can be activated by adult literacy and participation programs, wecannot speak directly to the precise mechanisms at play in the broader literature.
Because of the relatively low magnitude of the impacts on children’s learning,the interventions we study are not cost effective relative to interventions that havebeen studied elsewhere. The low effect sizes were likely a result of low take-up.Most mothers reported never attending the classes, and those who did, attendedinfrequently. Our experience with low attendance of mothers echoes prior workhighlighting learner interest as a key impediment to the success of adult literacyinterventions in developing countries (Wagner, 2000; Abadzi, 2003).
The pattern of impacts across the three interventions suggests scope for largerimpacts with more intensive interventions. In our key results on children’s andmothers’ test scores, the point estimates for ML-CHAMP are approximately equalto the sum of the ML and CHAMP impacts. Based on these results, we speculatethat innovations to the ML model that better sustain learner interest could havelarger impacts than what we have found here. Evaluation of such strategies wouldbe an important area for future research. We also note that this paper does notfully analyze the opportunity costs of these programs, or whether they are optimalfrom the perspective of every household. This paper can serve as a starting pointfor future work examining the welfare implications of these programs.
REFERENCES
Abadzi, Helen. 2003. “Adult Literacy: A Review of Implementation Experi-ence.” The World Bank Operations Evaluation Department.
Aker, Jenny C., and Christopher Ksoll. 2015. “Call Me Educated: Evi-dence from a Mobile Monitoring Experiment in Niger.” Working Paper, TuftsUniversity.
38
Aker, Jenny C., Christopher Ksoll, and Travis J. Lybbert. 2012. “CanMobile Phones Improve Learning? Evidence from a Field Experiment in Niger.”American Economic Journal: Applied Economics, 4(4): 94–120.
Andrabi, Tahir, Jishnu Das, and Asim Ijaz Khwaja. 2012. “What Didyou Do All Day? Maternal Education and Child Outcomes.” Journal of HumanResources, 47(4): 873–912.
Angelucci, Manuela, Dean Karlan, and Jonathan Zinman. 2015. “Micro-credit Impacts: Evidence from a Randomized Microcredit Program PlacementExperiment by Compartamos Banco.” American Economic Journal: AppliedEconomics, 7(1): 151–182.
Aoki, Aya. 2005. “Assessing learning achievements and development impact:Ghana’s national functional literacy program.” Australian Journal of AdultLearning, 45(1): 63–81.
ASER Centre. 2012. “Annual Status of Education Report 2011.” Accessed Au-gust 17, 2016.
Avvisati, Francesco, Bruno Besbas, and Nina Guyon. 2010. “ParentalInvolvement in School: A Literature Review.” Economeie De L’Education,120(5): 759–778.
Avvisati, Francesco, Marc Gurgand, Nina Guyon, and Eric Maurin.2014. “Getting Parents Involved: A Field Experiment in Deprived Schools.”The Review of Economic Studies, 81(1): 57–83.
Baker-Henningham, Helen, and Florencia Lopez Boo. 2010. “Early Child-hood Stimulation Interventions in Developing Countries: A Comprehensive Lit-erature Review.” IZA Discussion Paper No. 5282.
Banerjee, Abhijit, Esther Duflo, Rachel Glennerster, and Cynthia Kin-nan. 2015. “The Miracle of Microfinance? Evidence from a Randomized Evalu-ation.” American Economic Journal: Applied Economics, 7(1): 22–53.
Banerjee, Abhijit V., Rukmini Banerji, Esther Duflo, Rachel Glenner-ster, and Stuti Khemani. 2010. “Pitfalls of Participatory Programs: Evidencefrom a Randomized Evaluation in Education in India.” American EconomicJournal: Economic Policy, 2(1): 1–30.
Baron, Reuben M., and David A. Kinney. 1986. “The Moderator-MediatorVariable Distinction in Social Psychological Research: Conceptual, Strategic,and Statistical Considerations.” Journal of Personality and Social Psychology,51(6): 1173–1182.
Beder, Hal. 1999. “The outcomes and impacts of adult literacy education in theUnited States.” National Center for the Study of Adult Learning and LiteracyReport 6.
Behrman, Jere, Andrew Foster, Mark Rosenzweig, and PremVashishtha. 1999. “Women’s Schooling, Home Teaching, and EconomicGrowth.” The Journal of Political Economy, 107(4): 682–714.
39

Carron, G. 1990. “The Functioning and Effects of the Kenya Literacy Program.”African Studies Review, 33(3): 97–120.
Crepon, Bruno, Florencia Devoto, Esther Duflo, and WIlliam Pariente.2015. “Estimating the Impact of Microcredit on Those who take it up: Evidencefrom a randomized experiment in Morocco.” 1(7): 123–150.
Duflo, Esther, Pascaline Dupas, and Michael Kremer. 2015. “School gov-ernance, teacher incentives and pupil-teacher ratios: Experimental Evidencefrom Kenyan Primary schools.” Journal of Public Economics, 123: 92–110.
Gertler, Paul, Harry Anthony Patrinos, and Rubio-Codina. 2008. “Em-powering Parents to Improve Education: Evidence from Rural Mexico.” WorldBank Policy Research Working Paper No. 3935.
Government of India. 2011. “Census of India 2011: Population EnumerationData.” Accessed July 5, 2016.
Green, Donald P., Shang E. Ha, and John G. Bullock. 2010. “Enoughalready about ”black box” experiments: Studying meidation is more difficultthan most scholars suppose.” Annals of the American Academic of Political andSocial Science, 628: 200–208.
Guryan, Jonathan, Erik Hurst, and Melissa Kearney. 2008. “ParentalEducation and Parental Time with Children.” Journal of Economic Perspectives,22(3): 23–46.
ICF International. 2016. “The DHS Program - Protecting the Privacy of DHSSurvey Respondents.” Accessed June 20, 2016.
Imai, Kosuke, Luke Keele, Dustin Tingley, and Teppei Yamamoto.2011. “Unpacking the black box of causality: Learning about causal mecha-nisms from experimental and observational studies.” American Political ScienceReview, 105(4): 765–789.
Kagitcibaci, Cigdem, Diane Sunar, and Sevda Bekman. 2001. “Long-termeffects of early intervention: Turkish low-income mothers and children.” AppliedDevelopmental Psychology, 22(4): 333–361.
Kling, Jeffrey R., Jeffrey B. Liebman, and Lawrence F. Katz. 2007.“Experimental Analysis of Neighborhood Effects.” Econometrica, 75(1): 83–119.
Kremer, Michael, Conner Brannen, and Rachel Glennerster. 2013.“The Challenge of Education and Learning in the Developing World.” Science,340: 297–300.
Lee, David S. 2009. “Training, Wages, and Sample Selection: Estimating SharpBounds on Treatment Effects.” Review of Economic Studies, 76(3): 1071–1102.
Ortega, Daniel, and Francisco Rodriguez. 2008. “Freed from Illiteracy? ACloser Look at Venezuela’s Mision Robinson Literacy Campaign.” EconomicDevelopment and Cultural Change, 57(1): 1–30.
Pritchett, Lant. 2013. The Rebirth of Education: Schooling Ain’t Learning.Center for Global Development.
40
Tarozzi, Alessandro, Jaikishan Desai, and Kristin Johnson. 2015. “TheImpacts of Microcredit: Evidence from Ethiopia.” American Economic Journal:Applied Economics, 7(1): 54–89.
UNESCO. 2005a. Aspects of Literacy Assessment: Topics and Issues from theUNESCO Expert Meeting.
UNESCO. 2005b. Education for All Global Monitoring Report 2006: Literacyfor Life.
UNESCO. 2015. Education for All Global Monitoring Report 2015: Educationfor All 2000-2015: Achievements and Challenges.
Wagner, Daniel A. 2000. “EFA 2000 Thematic Study on Literacy and AdultEducation.” International Literacy Institute.
41