the impact of income diversification on bank performance
TRANSCRIPT

i
THE IMPACT OF INCOME DIVERSIFICATION ON BANK
PERFORMANCE:
A CASE STUDY OF ZENITH BANK, CAL BANK AND UNIBANK
by
JACOB AMEDIKU
(PG4085810)
A Thesis submitted to the Institute of Distance Learning, Kwame
Nkrumah University of Science and Technology in partial fulfillment of
the requirements for the degree of
COMMONWEALTH EXECUTIVE MASTERS OF BUSINESS
ADMINISTRATION
SEPTEMBER 2012

ii
DECLARATION
I hereby declare that this submission is my own work towards the Executive Masters
of Business Administration and that, to the best of my knowledge, it contains no
material previously published by another person nor material which has been accepted
for the award of any other degree of the University, except where due
acknowledgement has been made in the text.
JACOB AMEDIKU (PG4085810) ……………… ………………..
Student Name & ID Signature Date
Certified by:
MR. AMETEFEE NORMANYO …………………… ……………….
Supervisor Name Signature Date
Certified by:
Prof. I. K. Dontwi …………………… ……………..
Dean, IDL Signature Date

iii
ABSTRACT
The general objective of this study is to investigate the impact of income source
diversification on bank performance. Pooled data of Three Universal banks was
employed in this study using a linear regression analysis. The study revealed that bank
income sources are diversified significantly in the Ghanaian banking industry and that
both interest and non-interest activities significantly impacts positively on bank
performance while bank growth in the number of branches significantly impacts
negatively on bank performance. This lead to the acceptance of both H1 which
hypothesized that commercial banks in Ghana are diversified in source of income and
H2 which postulates that income source diversification improves financial
performance of commercial banks.

iv
DEDICATION
This thesis is dedicated to my family and friends.

v
ACKNOWLEDGEMENT
I wish to express my sincere gratitude to the Almighty God for seeing me through this
programme successfully.
My special thanks go to my supervisor Mr. Ametefee Normanyo for supervising this
thesis and offering directions, suggestions and encouragement during the entire
duration of the work.
I am also grateful to the facilitators of Kwame Nkrumah University of Science and
Technology, Institute of Distance Learning – Ho center for the knowledge imparted
into me and for making the learning process a pleasant one.
I acknowledge here, the contribution of my class mates, friends, colleagues at work
and family. The following people deserve special mention for the role they played for
the success of my studies; Mr. Samuel Akpaglo, Mr. Patrick Sekyi and Mr. Richard
Sefe.

vi
TABLE OF CONTENT
TITLE PAGE………….………………………………………………………………………. i
DECLARATION ....................................................................................................................... ii
ABSTRACT .............................................................................................................................. iii
DEDICATION .......................................................................................................................... iv
ACKNOWLEDGEMENT ......................................................................................................... v
TABLE OF CONTENT ............................................................................................................ vi
LIST OF TABLES .................................................................................................................. viii
LIST OF FIGURES .................................................................................................................. ix
CHAPTER ONE ............................................................................................................. 1
GENERAL INTRODUCTION ....................................................................................... 1
1.1 INTRODUCTION ......................................................................................................... 1
1.2 BACKGROUND OF THE STUDY .............................................................................. 1
1.3 PROBLEM STATEMENT ............................................................................................ 4
1.4 OBJECTIVES OF THE STUDY ................................................................................... 5
1.5 RESEARCH HYPOTHESES ........................................................................................ 6
1.6 RESEARCH METHODOLOGY ................................................................................... 6
1.7 JUSTIFICATION FOR THE STUDY ........................................................................... 7
1.8 LIMITATIONS OF THE STUDY ................................................................................. 7
1.9 ORGANIZATION OF THE STUDY ............................................................................ 8
CHAPTER TWO ............................................................................................................ 9
LITERATURE REVIEW ............................................................................................... 9
2.1 INTRODUCTION ......................................................................................................... 9
2.2 THE CONCEPT OF INCOME DIVERSIFICATION .................................................. 9
2.3 THEORETICAL BACKGROUND ............................................................................. 13
2.4 FACTORS INFLUENCING BANKS‟ CHANGING INCOME AND PROFIT
STRUCTURE .............................................................................................................. 19
2.5 DETERMINANTS OF BANK PERFORMANCE ...................................................... 20
CHAPTER THREE ...................................................................................................... 24
METHODOLOGY ....................................................................................................... 24
3.1 INTRODUCTION ....................................................................................................... 24
3.2 RESEARCH DESIGN ................................................................................................. 24
3.3 DATA AND DATA SOURCES .................................................................................. 25

vii
3.4 MEASURES OF DIFFERENT INCOME SOURCES, DIVERSIFICATION AND
PERFORMANCE. ....................................................................................................... 26
3.5 THE EMPIRICAL MODEL ........................................................................................ 27
3.5.1 PERFORMANCE AND NON-INTEREST INCOME ............................................ 27
3.5.2 FEE INCOME AND INTEREST MARGINS ......................................................... 28
3.6 BACKGROUND OF UNIBANK GHANA LIMITED .............................................. 30
3.7 BACKGROUND OF CAL BANK .............................................................................. 31
3.8 BACKGROUND OF ZENITH BANK........................................................................ 33
CHAPTER FOUR ........................................................................................................ 35
DATA PRESENTATION AND ANALYSIS OF RESULTS ......................................... 35
4.1 INTRODUCTION ....................................................................................................... 35
4.2 TREND ANALYSIS OF VARIABLES ...................................................................... 35
FIGURE 1: SHARE OF FEE INCOME .................................................................................. 36
FUGURE 2: RETURN ON ASSET ........................................................................................ 37
FIGURE 3: RETURN ON EQUITY ....................................................................................... 38
FIGURE 4: NET INTEREST MARGIN ................................................................................. 39
FIGURE 5: NON-PERFORMING LOANS ............................................................................ 40
4.3 REGRESSION ANALYSIS ........................................................................................ 40
Table 1: Descriptive statistics .................................................................................................. 41
4.4 CORRELATION AMONG INDEPENDENT VARIABLES ..................................... 42
4.5 THE IMPACT OF SHARE OF FEE INCOME ON BANK PERFORMANCE .......... 44
4.6 THE IMPACT OF FEE INCOME ON INTEREST MARGINS ................................. 52
CHAPTER FIVE .......................................................................................................... 55
SUMMARY OF FINDINGS, CONCLUSION AND RECOMMENDATIONS ............. 55
5.1 SUMMARY OF MAJOR FINDINGS ......................................................................... 55
5.2 CONCLUSION ............................................................................................................ 58
5.3 RECOMMENDATIONS ............................................................................................. 58
REFERENCES ........................................................................................................................ 59
APPENDIX 1 ........................................................................................................................... 61

viii
LIST OF TABLES
Table 1: Descriptive statistics .................................................................................................. 41
Table 2: Correlations Matrix ................................................................................................ 41
Table 3: Summary of Explanatory Power of Model 1 ....................................................... 41
Table 4: ANOVAa of Estimated Model 1 ........................................................................... 41
Table 5: Coefficientsaof estimated variables....................................................................... 41
Table 6: Correlations Matrix of Impact of Fee Income on Interest Margin ................... 52
Table 7: Summary of Explanatory Power of Model 2 ....................................................... 52
Table 8: ANOVAa of Model 2 .............................................................................................. 52
Table 9: Coefficientsa of Model ............................................................................................ 53

ix
LIST OF FIGURES
FIGURE 1: SHARE OF FEE INCOME .................................................................................. 36
FUGURE 2: RETURN ON ASSET ........................................................................................ 37
FIGURE 3: RETURN ON EQUITY ....................................................................................... 38
FIGURE 4: NET INTEREST MARGIN ................................................................................. 39
FIGURE 5: NON-PERFORMING LOANS ............................................................................ 40

1
CHAPTER ONE
GENERAL INTRODUCTION
1.1 INTRODUCTION
This chapter provides a general introduction to the topic under consideration. The first
section looks at the background of the study. This is immediately followed by statement
of problem, objectives of the study, research hypothesis, justification for the study,
methodology employed, the scope and limitations of the study and finally, the
organization of the study.
1.2 BACKGROUND OF THE STUDY
Banks, the world over, are transcending their normal business operations and diversifying
their activities in response to economic and financial sector reforms. The Ghanaian
banking industry too has been seen steadily shifting away from traditional sources of
revenue like loan-making etc, towards nontraditional activities that generate fee income,
service charges, trading revenue and other types of non-interest income.
In recent years, deregulation and technological innovation has permitted almost all
financial institutions to capture an increasing share of their income stream from non-
interest sources. According to DeYoung and Rice (2004), US commercial banks, for
example, generated 42% of operating income from non-interest sources in 2004
compared to 32% in 1990 and 20% in 1980. While part of the increase in non-interest
income is due to diversification into lines of business such as investment banking,
venture capital and insurance underwriting, growth in fee-paying and commission-paying

2
services linked to traditional retail banking services has also been significant. However,
the shift towards non-interest income has not improved the risk-adjusted returns of banks
in recent years (Hirtle and Stiroh, 2007). Clark et al. (2007) detect a recent shift in the
strategic behaviour of banks in developed economies and demonstrated that a return to
retail has occurred because retail business offers relatively stable returns that can help
offset volatility in non-retail business.
The main motive for diversification is to minimize risk of loss. In general, banks consider
costs and benefits of the different alternatives available when making investment
decisions. Much analysis has been performed that indicates that portfolio asset allocation
is by far the most important decision banks make, because these assets may account for
up to 90% of bank earnings.
If commercial banks choose to invest in loans and advances, they risk default associated
with these investments. Such investments potentially have negative consequences for
bank earnings because some of the loans and advances to customers may end up as bad or
doubtful debts. This risk may or may not be covered by collateral securities or high
interest rates. If the risk is covered by high lending rates, these compensate for the high
risks and the costs incurred in valuing collateral securities, negotiation and debt servicing.
A bank may also face the risk of illiquidity if it issues large volumes of loans and
advances without attention to the ease of „shiftability‟ of other asset holdings in its
portfolio. This is because repayment terms and periods for bank loans and advances to
customers are defined by fixed contracts that differ from customer to customer, meaning
that banks cannot recall the cash in debt at will, at their convenience or when there is

3
need for liquidity. This situation can lead to a run on the bank if customers suspect that it
does not have sufficient resources to meet their cash needs. A bank with cash holdings
lower than the amounts required for its demand deposits may close down if all of a
sudden it is invaded by customers making large withdrawals. Such a run on a bank arises
out of customers‟ loss of confidence in the bank, a situation that adversely affects its
deposits and profitability.
Commercial banks may choose to invest in treasury bills as their portfolio using their
excess liquidity, to capitalize largely on prevailing high interest rates on the bills, which
are also free from risk of default. The risk associated with treasury bills is tied to their
fixed-interest nature, meaning that once a bank has invested in them it cannot transfer
them to benefit from rising interest rates until they mature. For this reason, commercial
banks respond according to their expectations on interest rates. If they anticipate a rise in
interest rates on a particular earning asset in the near future, they hold on to their cash and
invest it at the time when interest rates have reached their expected maximum. If they
anticipate a fall in Treasury bill interest rates they tend to invest immediately to avoid
incurring losses when interest rates fall. This policy has been shown to contribute
positively to attainment of commercial banks‟ objective of profit maximization.
If commercial banks choose to keep all their holdings as cash, it means that they have
chosen not to engage in any investment transaction. This cash does not earn interest or
bear the risk of default although it risks losing value if the „evils‟ of inflation set in.
Moreover, cash holdings reflect some stability of the bank. Customers will be confident
that if they deposit their money it will be available when they need it.

4
In practice, commercial banks do not put all their cash in one earning asset. They rank
their alternatives in order of desirability and put their money in all the worthwhile
investments. In doing this, commercial banks tend to achieve their objective of making
profit from their investments. The portfolio theory of investment seems appropriate to
counter the problem of investment risk that banks face.
1.3 PROBLEM STATEMENT
For banks elsewhere, several researchers have explored relationships between non-
interest income and business strategies, market conditions, technological change and risk-
adjusted financial performance (Gallo et al., 1996; DeYoung and Rice, 2004; Stiroh,
2004; Calmes and Liu, 2005; Landskroner et al., 2005; Acharya et al., 2006; Stiroh, 2006;
Stiroh and Rumble, 2006; Carbo-Valverde and Fernandez, 2007; Laeven and Levine,
2007; Lepetit et al., 2007; Mercieca et al., 2007; Hirtle and Stiroh, 2007). Similar
attention has not, however, been given to the banks in developing countries and Ghana in
particular. In part this is because as financial institutions organized to meet the needs of
their customers and shareholders, banks in developing countries have not had the same
diversification opportunities as banks in developed economies. Nevertheless, since 2000
there has been a steady increase in the share of non-interest income in operating income
for the Ghanaian banking sector as a whole.
The increasing presence of non-interest income at commercial banks has been widely
documented and discussed in the industry press and regulatory publications (for example,
Feldman and Schmidt 1999), but only a few academic studies have investigated the
impact of increased non-interest income on the financial performance of commercial

5
banks. While it is well known that large banks and banks with specialized strategies rely
more heavily on non-interest income than do small banks with traditional business
strategies, there is little systematic understanding of why non-interest income varies
across banks and how non-interest income is associated with bank financial performance.
Research findings from developed (USA and Europe) markets on impact of income
source diversification on banks financial performance differs greatly. It worsens risk-
return trade-off in USA while it increases risk-return trade-off in Europeans banks. Stiroh
(2004), De Young and Rice (2004), Stiroh and Rumble (2006) indicate a worse risk-
return trade-off for USA commercial banks venturing into income source diversification.
Chiarozza et al. (2008), Baele et al.(2007), and Staikouras and Wood (2003) show that
income source diversification increases risk-return trade-off for European banks. Further,
Shawn, (2002) financial sectors in most developing countries are characterized by
fragility, volatile interest rates, high-risk investment and inefficiencies in the
intermediation process. The industry further differs in; ownership structure, financial
liberalization level and accounting treatment of various sources of income.
1.4 OBJECTIVES OF THE STUDY
Following from the problem statement, this study seeks;
To analyze the trend of income source component and profits.
To determine the impact of income source diversification on financial
performance of commercial banks in Ghana.
To analyze the relationship between the various income sources and bank
performance.

6
1.5 RESEARCH HYPOTHESES
The study was guided by the following two directional hypotheses:
H1: Commercial banks in Ghana are diversified in source of income.
H11: Commercial banks in Ghana are not diversified in source of income
and
H2: Income source diversification improves financial performance of commercial
banks.
H22: Income source diversification does not improve financial performance of
commercial banks.
1.6 RESEARCH METHODOLOGY
The main data source for the analysis comes from the published financial documents of
the studied banks and the report on trends and progress in banking sector in Ghana.
According to Saunders et al, (2008) studies that establish causal relationships between
variables may be termed explanatory studies. The emphasis here is on studying a
situation or problem in order to explain the relationships between variables. Hence the
study opted for explanatory research since the study intended to examine relationships
among variables specifically on income sources and firm‟s performance.

7
1.7 JUSTIFICATION FOR THE STUDY
The research investigates the effects of income diversification on the performance of
selected commercial banks in Ghana. This study has important implications for both
financial theory and practice.
From academic point of view, this study will present additional evidence concerning the
search for performance drivers of financial institutions. In practice, it will help to
document the performance of banks that use certain level income diversification as
compared to non-users. What is more, future researchers interested in income
diversification and firm‟s performance could use this work as a springboard for their
studies. Moreover, the study will not only inform banks‟ decisions in order to remain
competitive but also that of regulators on the appropriate level of income diversification
that banks are to maintain.
1.8 LIMITATIONS OF THE STUDY
Time limits had to be adhered to and deadlines had to be met. Certain information could
not be obtained from the studied banks and the researcher had to do without some
information, as such the research cannot go on ad infinitum. The validity of the research
would however not be affected. The case study nature of the research can limit its
generalization ability. However, the findings can be generalized to only the studied
banks. Generally, only current references were used unless the work was considered a
relevant „classic‟ in its area. In an attempt to overcome some literature constraints, the
internet and risk management journals would be used as research sources. The above

8
mentioned limitations would however, not influence the validity of the study, nor would
it negatively impact on the practical applications suggested in the study.
1.9 ORGANIZATION OF THE STUDY
The study is organized in five chapters as follows. Chapter one provides general
background to the study. It also provides the statement of the problem in terms of
research hypothesis. Again, it sets out the objectives of the study and provides the
justification of the study. Chapter two reviews pertinent literature on the study from both
theoretical and empirical issues reviewed in the literature and then attempt to link it to the
current study. Chapter three discusses the methodological issues of the study, while
chapter four discusses the analysis of the empirical results and the final chapter, chapter
five, summarizes the main findings of the study and provides suggestions and policy
recommendations.

9
CHAPTER TWO
LITERATURE REVIEW
2.1 INTRODUCTION
This chapter begins with the concept of income diversification and provides a theoretical
background to the study. The factors influencing banks‟ changing income and profit
structure was established followed by determinants of bank performance.
2.2 THE CONCEPT OF INCOME DIVERSIFICATION
Financial institutions in recent years have increasingly been generating income from “off-
balance sheet” business and fee income. Albertazzi and Gambacorta (2006) as cited by
Uzhegova (2010) noted that the decline in interest margins, has forced banks to explore
alternative sources of revenues, leading to diversification into trading activities, other
services and non-traditional financial operations. The concept of revenue diversifications
follows the concept of portfolio theory which states that individuals can reduce firm-
specific risk by diversifying their portfolios. However there is a long history of debates
about the benefits and costs of diversification in banking literature. The proponents of
activity diversification or product mix argue that diversification provides a stable and less
volatile income, economies of scope and scale, and the ability to leverage managerial
efficiency across products (Choi and Kotrozo, 2006). Chiorazzoet al (2008) noted that as
a result of activity diversification, the economies of scale and scope caused through the
joint production of financial activities leads to increase in the efficiency of banking
organizations. They further argued that product mix reduces total risks because income

10
from non-interest activities is not correlated or at least perfectly correlated with income
from fee based activities and as such diversification should stabilize operating income
and give rise to a more stable stream of profits (Uzhegova, 2010).
The opposite argument to activity diversification is that it leads to increased agency costs,
increased organizational complexity, and the potential for riskier behavior by bank
managers. Kotrozo and Choi (2006) mentioned that activity diversification results in
more complex organizations which “makes it more difficult for top management to
monitor the behavior of the other divisions/branches. They further argued that the
benefits of economies of scale/scope exist only to a point. The costs associated with a
firm's increased complexity may overshadow the benefits of diversification. As such, the
benefits of diversification and performance would resemble an inverted-U in which there
would be an optimal level of diversification beyond which benefits would begin to
decline and may ultimately become negative.
Using annual bank level data of all Philippines commercial banks Sufian and Chong
(2008) found a positive relationship between total non-interest income divided by total
assets, a proxy for income diversification and bank profitability. Uzhegova (2010) using a
HH index of interest income, commissions, fee income, trading income, non-interest
income and other operating income found empirical support of the idea that banks
involved in diversification activities expect some benefits. While Kotrozo and Choi 2006,
using a similar index found that activity diversification tends to reduce performance
compared to banks more focused in their activities.

11
The main motive for diversification is to minimize risk of loss. In general, banks consider
costs and benefits of the different alternatives available when making investment
decisions. Much analysis has been performed that indicates that portfolio asset allocation
is by far the most important decision banks make, because these assets may account for
up to 90% of bank earnings (Nafula, 2003).
If commercial banks choose to invest in loans and advances, they risk default associated
with these investments. Such investments potentially have negative consequences for
bank earnings because some of the loans and advances to customers may end up as bad or
doubtful debts. This risk may or may not be covered by collateral securities or high
interestrates. If the risk is covered by high lending rates, these compensate for the high
risks and the costs incurred in valuing collateral securities, negotiation and debt servicing
(Uzhegova, 2010).
A bank may also face the risk of illiquidity if it issues large volumes of loans and
advances without attention to the ease of „shiftability‟ of other asset holdings in its
portfolio. This is because repayment terms and periods for bank loans and advances to
customers are defined by fixed contracts that differ from customer to customer, meaning
that banks cannot recall the cash in debt at will, at their convenience or when there is
need for liquidity. This situation can lead to a run on the bank if customers suspect that it
does not have sufficient resources to meet their cash needs. A bank with cash holdings
lower than the amounts required for its demand deposits may close down if all of a
sudden it is invaded by customers making large withdrawals. Such a run on a bank arises
out of customers‟ loss of confidence in the bank; a situation that adversely affects its
deposits and profitability (Kotrozo and Choi, 2006).

12
Commercial banks may choose to invest in treasury bills as their portfolio using their
excess liquidity, to capitalize largely on prevailing high interest rates on the bills, which
are also free from risk of default. The risk associated with treasury bills is tied to their
fixed-interest nature, meaning that once a bank has invested in them it cannot transfer
them to benefit from rising interest rates until they mature. For this reason, commercial
banks respond according to their expectations on interest rates. If they anticipate a rise in
interest rates on a particular earning asset in the near future, they hold on to their cash and
invest it at the time when interest rates have reached their expected maximum (Nafula,
2003).
If they anticipate a fall in Treasury bill interest rates they tend to invest immediately to
avoid incurring losses when interest rates fall. This policy has been shown to contribute
positively to attainment of commercial banks‟ objective of profit maximization.
If commercial banks choose to keep all their holdings as cash, it means that they have
chosen not to engage in any investment transaction. This cash does not earn interest or
bear the risk of default although it risks losing value if the „evils‟ of inflation set in.
Moreover, cash holdings reflect some stability of the bank. Customers will be confident
that if they deposit their money it will be available when they need it.
In practice, commercial banks do not put all their cash in one earning asset. They rank
their alternatives in order of desirability and put their money in all the worthwhile
investments. In doing this, commercial banks tend to achieve their objective of making
profit from their investments. The portfolio theory of investment seems appropriate to
counter the problem of investment risk that banks face.

13
2.3 THEORETICAL BACKGROUND
Theory provides conflicting predictions about the impact of greater diversification of
activities on the performance of financial intermediaries. Existing theories of financial
intermediation imply increasing returns to scale linked to diversification. As suggested by
the work of Diamond (1991), Rajan (1992), Saunders and Walter (1994) and Stein
(2002), banks acquire customer information during the process of making loans that can
facilitate the efficient provision of other financial services, including the underwriting of
securities. Similarly, securities and insurance underwriting, brokerage and mutual fund
services and other activities can produce information that improves loan making. Thus,
banks that engage in a variety of activities could enjoy economies of scope that boost
performance.
There is also a cost linked to intermediary risk and a better diversified intermediary has
less risk and thus lower costs. In models of insurance or liquidity provision (Diamond
and Dybvig, 1983; Chari and Jagannathan, 1988; Jacklin and Bhattarcharya, 1988;
Gorton and Pennacchi, 1990), investors are risk averse and face some risk which the
intermediary can pool and diversify on their behalf. Moreover, diversification makes it
cheaper for financial institutions to achieve credibility in their role as screeners or
monitors of borrowers. As shown by the models of delegated investment monitoring or
evaluation (Campbell and Kracaw, 1980; Diamond, 1984; Ramakrishnan and Thakor,
1984; Boyd and Prescott, 1986), the possibility of bad outcomes allows the intermediary
to hide proceeds or to claim that bad luck rather than lack of effort led to the bad
outcomes; an intermediary with better diversified investments has less chance of very bad

14
outcomes, reducing associated costs. Thus, that it is optimal for a bank to be maximally
diversified across sectors.
Experts of diversification argue also that lenders such as banks and finance companies
are typically highly levered and diversification across sectors reduces their chance of
costly financial distress. Similarly, the conventional view is that greater competition has
increased the need for banks to diversify: lower profits leave less margin for error, so
diversification provides a necessary reduction in risk. Only a simple policy prescription
for regulators is suggested by the traditional theory: the banking sector should be left
relatively unrestricted, which should in turn lead to an equilibrium with a few large, well-
diversified and competitive banks.
The Winton‟s models (1997, 1999) results of the proverbial wisdom of “not putting all
your eggs on one basket” suggest that the opposite can be true. Increased competition
may magnify the “Winner‟s Curse” problem (the adverse selection in the borrowers
pooling) faced on entry into a new sector, making diversification very costly. In
unregulated settings where intermediaries are new or the market is growing rapidly, there
should be substantial entry, with many risky intermediaries coexisting: investors cannot
coordinate their actions and debt overhang makes the cost of capturing market share
through rate competition highest when the potential for diversification is greatest. Over
time, banks will fail and survivors will gain an incumbency advantage simply by
becoming the focus of investor beliefs. Banks facing greater competition may therefore
find it more attractive to specialize. In related work, several models (Dell‟Arricia,
Friedman, and Marquez, 1999; Marquez, 1997; Dell‟Arricia, 1998; Gehrig, 1998) suggest
that regardless of the bank‟s efforts, loans in the new sector are likely to perform worse

15
than loans in the bank‟s home sector. Worse performance for new sector loans also
makes diversification more likely to increase the bank‟s chance of failure and less likely
to improve the bank‟s monitoring incentives; indeed, diversification may even undermine
incentives to monitor home sector loans. Overall, diversification is more likely to be
unattractive.
Considerable literature exists on banks‟ non-traditional activities, it looks at different
financial activities separately and shows that these activities affect differently the level of
risk at an individual bank (e.g. Avery and Berger, 1991; Boot and Thakor, 1991; Hassan,
1992, 1993; Hassan et al. 1994; Hassan and Sackley, 1994). By definition, diversification
involves moving into economic sectors that differ from the bank‟s home base. Effective
loan monitoring requires that the lending institution have a thorough understanding of
these differences, but building such organizational knowledge takes time and effort.
Alternatively, diversification of activities within a single financial conglomerate could
intensify agency problems between corporate insiders and small shareholders (Jensen,
1986; Jensen and Meckling, 1976). Since, it is difficult for outsiders to directly observe
the lending process that a bank is following, with adverse implications on the market
valuation of the conglomerate.
There has been some work on bank specialization and loan performance. A somewhat
closer study is Besanko and Thakor (1993), who model insured banks allocating loans
across two uncorrelated sectors. Diversified banks forfeit gains from risk-shifting but
increase their odds of surviving to collect informational rents on continuing lending
relationships; free entry reduces these rents, discouraging diversification. In addition to

16
the winner‟s curse problem facing new entrants, Boot and Thakor (1998) examine
incentives to specialize in the face of increased competition.
Nonfinancial corporate diversification literature (Denis et al., 1997; Rajan, Servaes and
Zingales, 2000; Maksimovic and Philips, 2002) generally argues that any firm –financial
institution or other– should focus on a single line of business so as to take greatest
advantage of management‟s expertise and reduce agency problems, leaving investors to
diversify on their own (Jensen, 1986; Berger and Ofek, 1996; Servaes, 1996, Denis et al.,
1997). Linked corporate literature regarding the “diversification discount” finds also that
the market value of financial conglomerates that engage in multiple activities are lower
than if those financial conglomerates where broken into financial intermediaries that
specialize in the individual activities. According to Demsetz and Strahan (1997), the
diversification discount may be caused by that too many operating items make the banks
lose their focus on specialized field. Another reason may cause the diversification
discount including the inefficient internal resource allocation (Lamont, 1997; Scharfstein,
1997), the informational asymmetries between head office and divisional managers
(Harris, Kriebel and Raviv, 1992).
But the features that distinguish banks and other lenders from nonfinancial firms are
lenders‟ greater use of debt finance (leverage) and the way in which lenders‟ efforts
affect their return distributions. With high leverage, worst-case outcomes loom large both
in terms of underinvestment problems and in terms of outright failure. Although pure
diversification tends to reduce the frequency of both worst-case and best-case outcomes,
diversification that lessens monitoring effectiveness may increase the frequency and
severity of worst-case outcomes, increasing failure probability and underinvestment

17
problems (Winton, 1999). Furthermore, Winton (1999) consider that “pure”
diversification increases the central tendency of the bank‟s return distribution, which
generally reduces the bank‟s chance of failure. Nevertheless, if its loans have sufficiently
low exposure to sector downturns (“downside”), a specialized bank has a low probability
of failure, so the benefit of diversification is slight. Also, if its loans have sufficiently
high downside, diversification can actually increase the bank‟s chance of failure. Thus,
all else equal, diversification‟s benefits are greatest when the bank‟s loans have moderate
levels of downside risk and when the bank‟s monitoring incentives need strengthening.
Broadly speaking, diversification per se is no guarantee of a reduced risk of failure and/or
an increased return. Contrasting views suggest that neither diversification nor
specialization always dominates; some circumstances and bank specific differences can
favor one strategy or the other. More generally, “diversification discount” models predict
that firms can differ in terms of expansion opportunities capabilities and ability to exploit
market occasions. For example, the Maksimovic and Phillips model (2002) of optimal
resource allocation of firms shows that as a firm‟s returns within an industry diminish,
the firm limits its growth within the industry and moves into other industries. The optimal
number and size of industry segments a firm operates depends on its comparative
advantage across industries, arising from managerial skill in producing within an
industry. Firms that are very productive in a specific industry have higher opportunity
costs of diversifying. Thus, inefficient and efficient firms should optimally invest
differently when industry conditions change.
Similarly, greater size is required for better diversification at the same time large
institutions have substantial scale economies linked to improved diversification (Roger

18
and Sinkey, 1999). Participation in certain non-traditional activities generally requires
employees with special knowledge to work in some of these areas. Moreover, a bank
might need to employ relatively advanced technology for some activities. Larger banks
are better equipped to use new technology and exploit the resulting cost savings and/or
efficiency gains (Hunter and Timme, 1986).
A more diversified bank may have also greater relative need for equity capital, especially
if diversification involves expansion into sectors where the bank is less effective
(Winton, 1995). Banks do use debt for much of their financing, equity capital serves as a
buffer to absorb losses and reduce the probability of financial distress. In addition, by
reducing possible shortfalls on payments to debtholders, equity capital reduces the bank‟s
incentive to engage in risk-shifting by not monitoring. Also, high bank profits can be seen
as to reduce the likelihood of costly bank runs and bank default resulting from bank
involvement into new activities.
In another way, Barth et al. (2004) arguments‟ for restricting activities suggest that it
improves the banking system by avoiding banks from the problems like conflicts of
interest, complexity, moral hazard and monitoring difficulties. As banks expand to new
activities, the restrictions may direct banks to less risky and less complicated activities
and thus improve bank diversification performance. However, if this is not the case, the
restrictions may misdirect banks to riskier and more complicated activities and thus
decrease diversification performance.

19
2.4 FACTORS INFLUENCING BANKS’ CHANGING INCOME AND PROFIT
STRUCTURE
Interest margins of commercial banks have constantly been declining since the mid
eighties. This development has been accelerated by globalization but, on the other hand,
globalization also leads to a rapid growth of international trade which in turn provides
opportunities in the fee business (Gischer and Jüttner, 2003). Hence, to compensate for
the adverse development in the interest business banks look for other income sources
(Koetter et al., 2004). For some banks it has opened up new markets, particularly in
trading, asset management and investment banking activities (Davis and Tuori, 2000).
The introduction of new regulatory requirements (Basel I and Basel II) also impairs
banks‟ non-interest income activities. Since regulatory requirements have affected
compliance and the cost of capital, banks have to look more closely at different assets on
their books and price them accordingly. In this context it is often argued that the increase
in off-balance sheet activities, which can be observed in some European countries,
largely results from lower capital requirements for off-balance sheet items and not from
on-balance sheet activities.
Moreover, lower risk-weights for inter-bank loans lead to an increase in this balance
sheet position. Since inter-bank loans have lower interest margins than loans to non-
financial clients, non-interest income declined (Davis and Tuori, 2000). In addition,
expanding consumer needs caused the creation of new types of bank activities.

20
In response to demographic changes, growing wealth on the part of individuals and the
expected loss in the pension system, a larger proportion of the population engages in
portfolio investments. Furthermore, there has been a change in technology (e.g.
automated teller machines and internet banking are now more common than years ago)
which also affects banks‟ cost structure (Hawtrey, 2003).
Finally, the costs of collecting and processing information have decreased. This has, for
example, lead to more efficient “production” of financial information and better
techniques for evaluating and pricing risk. Some banks have even specialized in the
monitoring of credit exposures (as agents rather than principals), e.g. in the context of
loan securitization which increases the share of non-interest income. Innovation in
financial products has facilitated a rearrangement of the income structure and the balance
sheet of banks. In general, the possibility of removing risk from capital has caused an
increase in off-balance sheet activities, as some banks have been encouraged to take part
in the process of securitization by undertaking investment banking activities (Davis and
Tuori, 2000).
2.5 DETERMINANTS OF BANK PERFORMANCE
Research on the determinants of bank performance has focused on both the returns on
bank assets and equity, and net interest rate margins. It has traditionally explored the
impact on bank performance of bank-specific factors, such as risk, market power and
regulatory costs.
More recently, research has focused on the impact of macroeconomic factors on bank
performance. Using accounting decompositions, as well as panel regressions, Al-

21
Haschimi (2007) studies the determinants of bank net interest rate margins in 10 Sub-
Saharan African countries. He finds that credit risk and operating inefficiencies (which
signal market power) explain most of the variation in net interest margins across the
region. Macroeconomic risk has only limited effects on net interest margins in the study.
Using bank level data for 80 countries in the 1988–95 periods, Demirgüç-Kunt and
Huizinga (1998) analyze how bank characteristics and the overall banking environment
affect both interest rate margins and bank returns. In considering both measures, this
study provides a decomposition of the income effects of a number of determinants that
affect depositor and borrower behavior, as opposed to that of shareholders. Results
suggest that macroeconomic and regulatory conditions have a pronounced impact on
margins and profitability. Lower market concentration ratios lead to lower margins and
profits, while the effect of foreign ownership varies between industrialized and
developing countries. In particular, foreign banks have higher margins and profits
compared to domestic banks in developing countries, while the opposite holds in
developed countries.
Gelos (2006) studies the determinants of bank interest margins in Latin America using
bank and country level data. He finds that spreads are large because of relatively high
interest rates (which in the study is a proxy for high macroeconomic risk, including from
inflation), less efficient banks and higher reserve requirements. Although Al-Hashimi
(2007) does not test explicitly for market power, the large association he finds between
high operating costs and net interest margins could be evidence of market power.

22
In a study of United States banks for the period 1989–93, Angbazo (1997) finds that net
interest margins reflect primarily credit and macroeconomic risk premia. In addition,
there is evidence that net interest margins are positively related to core capital, non-
interest bearing reserves and management quality, but negatively related to liquidity risk.
Saunders and Schumacher (2000) apply the model of Ho and Saunders (1981) to analyze
the determinants of interest margins in six countries of the European Union and the US
during the period 1988–95. They find that macroeconomic volatility and regulations have
a significant impact on bank interest rate margins. Their results also suggest an important
trade-off between ensuring bank solvency, as defined by high capital to asset ratios and
lowering the cost of financial services to consumers, as measured by low interest rate
margins.
Athanasoglou, et al. (2006) studies the profitability behavior of the south eastern
European banking industry over the period 1998–02. The empirical results suggest that
the enhancement of bank profitability in those countries requires new standards in risk
management and operating efficiency, which, according to the evidence presented in the
paper, crucially affect profits. A key result is that the effect of market concentration is
positive, while the picture regarding macroeconomic variables is mixed.
Athanasoglou, et al. (2006b) apply a dynamic panel data model to study the performance
of Greek banks over the period 1985–2001, and find some profit persistence, a result that
signals that the market structure is not perfectly competitive. The results also show that
the profitability of Greek banks is shaped by bank-specific factors and macroeconomic
control variables, which are not under the direct control of bank management. Industry
structure does not seem to significantly affect profitability.

23
More recently, a number of studies have emphasized the relation between
macroeconomic variables and bank risk. Saunders and Allen (2004) survey the literature
on pro-cyclicality in operational, credit and market risk exposures. Such cyclical effects
mainly result from systematic risk emanating from common macroeconomic influences
or from interdependencies across firms as financial markets and institutions consolidate
internationally. They may ultimately exacerbate business cycle fluctuations due to
adverse effects on bank lending capacity.
Using equity returns data over the period 1973–2003, Allen and Bali (2004) examine the
catastrophic risk of financial institutions. Results suggest evidence of pro-cyclicality in
both catastrophic and operational risk measurements, implying that macroeconomic,
systematic and environmental factors play a considerable role in determining the risk and
returns of financial institutions.

24
CHAPTER THREE
METHODOLOGY
3.1 INTRODUCTION
This chapter outlines the complete process of the research - how this research was carried
out. The starting point is the research design used in this thesis. Then, the chapter proceed
with the data source and description of variables used in this thesis. Finally, the chapter
explained the data analyses and provided an overview of the studied banks.
3.2 RESEARCH DESIGN
The research design permits the study to meet the purpose of the research. It refers to the
overall plan employed by the researcher to obtain answers to the research questions
(Hakim, 2000). The research design may be that of an assessment, evaluation, descriptive
or experimental study. The current study is more of evaluative, descriptive and
experimental studies. According to Robson, (2002) the purpose of evaluation is to make
judgement about the effectiveness, relevance, efficiency or desirability of a product,
process or programme. Based on this premise suggested by Robson, (2002), the study
opted for evaluative studies since it is intended to evaluate the effectiveness of income
diversification on the performance of the studied banks from 2006 to 2010 period. Thus,
by evaluating the effects of income diversification on bank performance will enable the
study find out the overall effects of the various incomes on the studied banks
performance. This will also enable the study to either accept or reject some of the
findings concerning income diversification of the studied banks relative to their
performance.

25
In addition, the study also included descriptive data since it intended to gather
information on the nature and composition of income of the studied banks. Since 2006 to
2010 and provide a better description of its impact on the firm‟s performance and then
suggest possible recommendations.
What is more, the study is experimental in nature since it intended to establish causal
relationship between variables; the effect that a change in one variable will have on the
other and the magnitude of change. Typically, the study intended to find out the effect of
income diversification on the studied bank‟s financial performance using profitability
ratios as the benchmark. In this design, the study manipulates these variables and studies
the effect on other variables.
3.3 DATA AND DATA SOURCES
There are many different ways to collect data (Hakim, 2000). The approach selected
depends on the study objectives, the study design and the availability of time, money and
personnel. An important consideration in deciding on the best way to collect data is
whether the study is intended to produce relatively precise quantitative findings or to
produce qualitative descriptive information. As mentioned earlier, the study is concerned
with evaluative, descriptive and experimental in nature and is mostly concerned with
quantitative measurements. The study made an extensive use of secondary sources of
data. The data was obtained from the Annual Reports of the studied banks and Ghana
Association of Bankers Surveys.

26
3.4 MEASURES OF DIFFERENT INCOME SOURCES, DIVERSIFICATION
AND PERFORMANCE.
In this analysis the study considered the bank‟s total interest earnings (interest income,
II), and total fee earnings (fee income, FI), from which is created a variable SHFEE to
measure the share of fee generating activities:
SHFEE = (FI)/(FI + II)
As a profitability measure, the study considered return on equity (ROE) and total assets
(ROA), which represents the ratio of operating revenues to equity and total assets
respectively.
As risk measure the study employed the standard deviation (δ) of ROE and ROA, which
is calculated over the entire period a bank is in the sample. Following Chiorazzo et al.
(2008), this thesis constructed risk-adjusted returns (RAROE and RAROA) to risk-adjust
profitability:
RAROEi,t = ROEi,t / δ ROEi
RAROAi,t = ROAi,t / δ ROAi
Interest margin (NIM) is calculated as net interest divided by total assets.

27
3.5 THE EMPIRICAL MODEL
3.5.1 PERFORMANCE AND NON-INTEREST INCOME
The study used the following empirical specification to analyze the relationship between
fee income and profitability:
Yt = k + β1SHFEE + β2HHI + β3NPL+ β4SIZE + β5GROWTH + β6LOANS+ β7EQUITY
+ εt ………………………………………………………………………………… (1)
In the regression model k is a constant. The variable Y stands for ROE, ROA, RAROE,
RAROA respectively. The study used the following control variables:
1. HHI is the Herfindahl index for concentration in the banks‟ loan portfolios, i.e. this
index measures diversification in the interest earning business. We differentiate between
nine sectors: (1) Agricultural, Forestry and Fishing, (2) Mining and Quarrying, (3)
Manufacturing, (4) Construction, (5) Electricity, Gas and Water, (6) Commerce and Finance, (7)
Transport, Storage and Communication, (8) Services and (9) Miscellaneous. Loan portfolio
profitability is used to represent the above variables.
2. NPL is the share of non-performing loans relative to customer loans. This ratio
measures risk in the credit portfolio.
3. SIZE is the natural logarithm of banks‟ total assets. This variable is added to capture
bank size. Larger banks have more resources to build up know how and technologies for
high-quality risk-management. Furthermore, a larger size allows the bank to exploit
economies of scale. Small banks, on the other hand, might take advantage of the greater
flexibility (Chiorazzo et al., 2008).
4. GROWTH is the growth rate of banks‟ total deflated assets. On the one hand this
variable reflects a bank‟s growing business opportunities. On the other hand, however, it

28
may also be viewed as a proxy for bank managers‟ preference for risk taking, assuming
that risk-loving managers usually prefer fast growth. In this study the number of branch
networks is used to represent growth.
5. EQUITY is the ratio of equity to total assets and describes the degree of total financial
leverage. This variable also represents a proxy for bank managers‟ risk aversion, since
risk averse bank managers tend to keep more equity than risk loving managers.
6. LOANS is the ratio of loans to total assets and is also a proxy for bank managers‟ risk
aversion, assuming that a high degree of capitalization signals a high risk aversion and
vice versa. See Appendix 1 for panel data.
3.5.2 FEE INCOME AND INTEREST MARGINS
In this section the study examined the link between studied banks‟ interest rate setting
and the shift towards fee generating activities. From the latter, the researcher would
expect opportunities in the interest business, i.e. for the cross-selling of loans. The study
employed a dealership based model of the bank which allows the researcher to derive the
determinants of the interest margin (Ho and Saunders, 1981). In this model, the studied
banks are considered a risk-averse intermediary between lenders and borrowers. In so
doing, the banks are exposed to competitive pressures, as well as interest rate and credit
risk which determine their interest margins. As proposed by Maudos and Fernández de
Guevara (2004) they additionally control for managerial efficiency measured by the cost-
income ratio, assuming that less efficient banks are obliged to charge higher margins. A
bank‟s net interest margin (NIM) is defined by total interest income minus total interest
expenses. The model setup is as follows:

29
NIMt = k + β1 SHFEE + β2BDR + β3EQUITY+ β4CIR + εt ……………………………... (2)
1. BDR is a measure of borrower default risk, which is either presented by theratio of
loan loss provisions relative to customer loans (LLP) or by the share of non-performing
loans relative to customer loans (NPL).
2. EQUITY is the ratio of equity to total assets. This variable has two interpretations;
first, it is a proxy for the degree of banks‟ risk aversion and second, it accounts for the
effect of leverage on risk levels and the required risk premium.
3. CIR is the cost-income ratio, calculated as operating expenses relative to gross income.
The literature provides mixed results on the expected coefficients. On the one hand, a
lowering in the cost structure should decrease interest rate margins.
On the other hand, screening and monitoring of borrowers require higher personnel costs,
which could also result in an increase of CIR and a lowering in default risk premium
charged on loans.
From a theoretical point of view, the average transaction size positively influences the
interest margin. Since this variable cannot be computed from our data, and is also ignored
in most of the other studies (Lepetit et al., 2008), this research also disregarded this
indicator. In an extended version of the model the study interacted credit risk with the
fee-income share. By including this indicator the study test how credit pricing, assuming
given credit risk, varies according to banks‟ share of fee business. This interpretation
only holds provided fees are charged at an identical flat, meaning that the same
conditions apply for any customer, or if fees are not risk dependent.

30
3.6 BACKGROUND OF UNIBANK GHANA LIMITED
uniBank (Ghana) Limited was incorporated as a private company in December 1997 to
operate as a bank. It is a wholly owned Ghanaian bank and authorized to undertake a
broad range of banking business. The bank opened its door to customers in January 2001.
The objective of the bank is to see the growth of small and medium sized enterprises
(SMEs) into giants that can propel the economy to great heights. Financially, in spite of
the challenges that characterize the financial crisis in recent times, uniBank recorded
some appreciable level of performance. Profit before tax increased by 66% from GHS 1.9
million in 2008 to GHS 3.2 million during 2009. This saw Profit after tax surging by 73%
to GHS 2.5 million in 2009 from GHS 1.5 million in 2008. Asset recorded 89% growth
from GHS 116.6 million in 2008 to GHS 220 million in 2009. Similarly, the loans and
advances book grew by 70% from GHS 65.2 million to GHS110.8 million. The bank„s
deposits increased significantly by 106% from GHS 89.9 million in 2008, to GHS 184.8
million as at the end of 2009. This performance was achieved as a result of the aggressive
sales and deposit mobilization drive pursued by the bank. Net Worth of the bank grew
from GHS 17.4 million in 2008 to GHS 20 million at the end of the year 2009. Return on
Equity which stood at 9.57% in 2008 improved significantly to 13.52% in 2009.
Shareholders fund grew from GHS 17.43 million in 2008 to GHS 19.96 in 2009 through
internally generated fund.
The bank has shown remarkable strength in the face of stiff competition and endeared
itself to the hearts of customers. In the short period of Nine (9) years since it started
operations, it has won several awards from Corporate Initiative Ghana (CIG), ranging
from customer care through to product innovation. The bank„s operations are currently

31
centered in Accra, Kumasi and Takoradi where there are concentrations of small and
medium-scale enterprises. The bank is at a very important phase of growth and is
therefore positioning itself to exploit the opportunities and manage the unfolding threats
within the industry. It is for this reason that the choice of the bank as a case for this study
is very important and timely looking at the segment of market they serve.
3.7 BACKGROUND OF CAL BANK
CAL Bank commenced operations in July 1990, and is considered to be one of the most
innovative banks in Ghana. The Bank mobilizes resources in world financial markets and
channels them to the Ghanaian market. In this way, CAL Bank supports the development
of the national economy, focusing particularly on the manufacturing and export sectors.
With its highly skilled professional staff, CAL Bank plays an important role in the
Ghanaian financial sector by providing wholesale banking services to corporate clients
with sound financial bases and competent management. Emphasis is placed on the
economic viability and technical feasibility of each project, as well as the marketability of
the client's products and services.
Having recently acquired a Universal Banking License in 2004, CAL Bank has
significantly developed its retail banking operations with specialized products and
services to cater for the retail market. To complement retail banking and in line with its
expansion programme, CAL Bank has developed a network of over 48 ATM's and 18
branches and is in the process of opening several branches in major cities and business
districts in Ghana.

32
The group reported an annual operating profit before tax of GH¢12.6 million and a profit
after tax of GH¢9.5 million in 2010 compared to GH¢10.5 million and GH¢8.3 million
respectively in the previous year. These represent an increase of 20% and 14%
respectively.
There was an appreciable level of increase in income levels with net interest income
increasing by 64% in 2010 above the previous year‟s amount and net fees and
commission income increasing by 43%, an indicator of the Bank‟s operating efficiencies.
Other income however declined by 26% in 2010 due to a difficult trading environment
during the year. The bank has therefore put in place measures to address these challenges
and expect a turnaround this year.
In spite of the sterling performance, the bank however had to recognize some challenges
and weaknesses in the retail loan portfolio resulting in a significant increase in our
impairment charge. Profitability therefore suffered as the bank took a fairly significant
provision on the retail loan portfolio. The bank is however pursuing these debts and is
hopeful to recover a significant amount of it.
Total assets size of the group increased from GH¢453 million in 2009 to GH¢510 million
in 2010, representing an increase of 12.6%. Growth in total assets resulted from a 56.7%
growth in investment in government securities, a 19.5% increase in loans and advances
and 82.1% increase in property, plant and equipment as a result of revaluation of the
bank‟s landed properties and an increase in the branch network in line with the strategic
plan of the bank.
These were funded by growth in deposits base of 6.8% which increased from GH¢277
million to GH¢296 million at the end of 2010. Borrowings also increased by 18% from

33
GH¢93 million to GH¢109million as a result of assessing additional facilities from
institutional development agencies. Shareholders equity also realized a significant
increase of 34.9% resulting from additional equity injection, revaluation reserves and
profit retention.
3.8 BACKGROUND OF ZENITH BANK
Zenith Bank (Ghana) Limited (“Zenith”), a financial services provider, was incorporated
in April 2005 under the Banking Act 2004 (Act 673) as a private limited company and
commenced universal banking operation in September 2005. It is a subsidiary of Zenith
Bank Plc, one of the largest banks in Nigeria by all measures, with “AAA” ratings, and
the Euromoney Best Bank in Africa for 2007.
Zenith currently operates twenty-four branches and agencies, connected online, real time
and with ATM facilities. It operates with the objective of making banking easier and
better than anything customers have ever experienced. Among its most distinguishing
traits are its cutting edge ICT platform which sets it apart from competitors, its passionate
staff and its devotion to the development of systems and products to satisfy customer
specifications.
The bank in 2010 celebrated the fifth anniversary of our operations in the country to
commemorate the contribution we have made to the dynamism of the Ghanaian banking
industry through improvements in customer service. We have over the years improved
our capacity, size, market share and industry rankings in all parameters. We have built
financial, structural and technological muscle, established our presence in all four corners
of the country and have created a beacon of innovation and service excellence in the

34
Ghanaian banking industry. Zenith continues to play a major role in the transformation of
the banking industry into an intensely competitive, customer oriented, more efficient and
technologically inclined industry. Indeed, before Zenith commenced operations
relationship banking was novel, e-banking was almost restricted to ATMs, banking was
limited to a few hours in the day and weekend banking was almost non-existent.
The bank pioneered several of the innovations currently prevalent in the industry. For
our efforts, the bank was adjudged the Bank of the Year in Ghana as well as the Best
Bank in Financial Performance in the country for the 2008 financial year, in addition to
other awards won over the years at the Corporate Initiative, Ghana Banking Awards,
2009. Zenith is re-defining banking on many other fronts. Through immense investments
we have acquired the ability to stay in the forefront of such fast-growing operations as
internet banking, mobile banking, electronic payments and in recent times, Visa payment
systems, as well as many other key programs that provide customers with greater speed,
accuracy and options. The result, as Zenith builds this technology across the country, will
be a nationwide, well-connected bank developed to the specifications of its customers
and other stakeholders to give them great value. Its highly skilled and dedicated staff
promise and deliver superior banking as well as professional excellence in service
delivery. Zenith's core values are: Belief in God, Integrity and Keeping the Service
Promise

35
CHAPTER FOUR
DATA PRESENTATION AND ANALYSIS OF RESULTS
4.1 INTRODUCTION
In this chapter, the trend of variables and the regression analysis have been presented to
meet the objectives of the research.
4.2 TREND ANALYSIS OF VARIABLES
Figure 1 shows the trend of movement of non-interest income of the studied banks. The
Figure depicts that there have been upward and downward movement in the share of fee
income of the various banks. In 2006 uniBank Ghana recorded a share of fee income of
35.12% and this saw an upsurge to 44.11% in 2007. However, the share of fee income for
uniBank has consistently declined to 32.60% in 2008, 21.74% in 2009 and a further
reduction to 20.97% in the year 2010. Cal Bank on the other hand also registered a
consistent decline in share of fee income from 2006 to 2010 as depicted in Figure 1.
However, Zenith Bank saw an up and down movement in its non-interest income. As
shown in the Figure 1 the percentage of fee income decline from 35.88% in 2006 to
31.22% in 2007 and again declined to 29.28% in 2008 from the previous year. The
downward trend was curtailed in the next year with share of fee income increasing to
36.00% in 2009 but the increase could not be sustained as the indicator saw a decline to
33.38% in 2010.

36
FIGURE 1: SHARE OF FEE INCOME
Source: Authors own compilation from the research.
Another variable of interest is Return on Asset (ROA) represented by Figure 2. All three
banks in the study have seen an upward movement in the Return on Asset from 2006 to
2008. uniBank and Cal Bank later in 2009 registered a decline in their Return on Asset,
with Zenith Bank showing an increase in Return on Asset. While uniBank and Cal Bank
recorded increases in the Return on Asset for 2010 over the previous year, Zenith Bank
recorded a fall in the return on asset.

37
FUGURE 2: RETURN ON ASSET
Source: Authors own compilation from the study
Figure 3 shows movements in the return on equity of the studied banks. uniBank
consistently saw its return on equity increasing from 2006 to 2010. Zenith Bank and Cal
Bank on the other hand have seen increases in the return on equity from 2006 to 2008 and
later declined thereafter both in 2009 and 2010 as depicted in Figure 3.

38
FIGURE 3: RETURN ON EQUITY
Source: Authors own compilation from the study
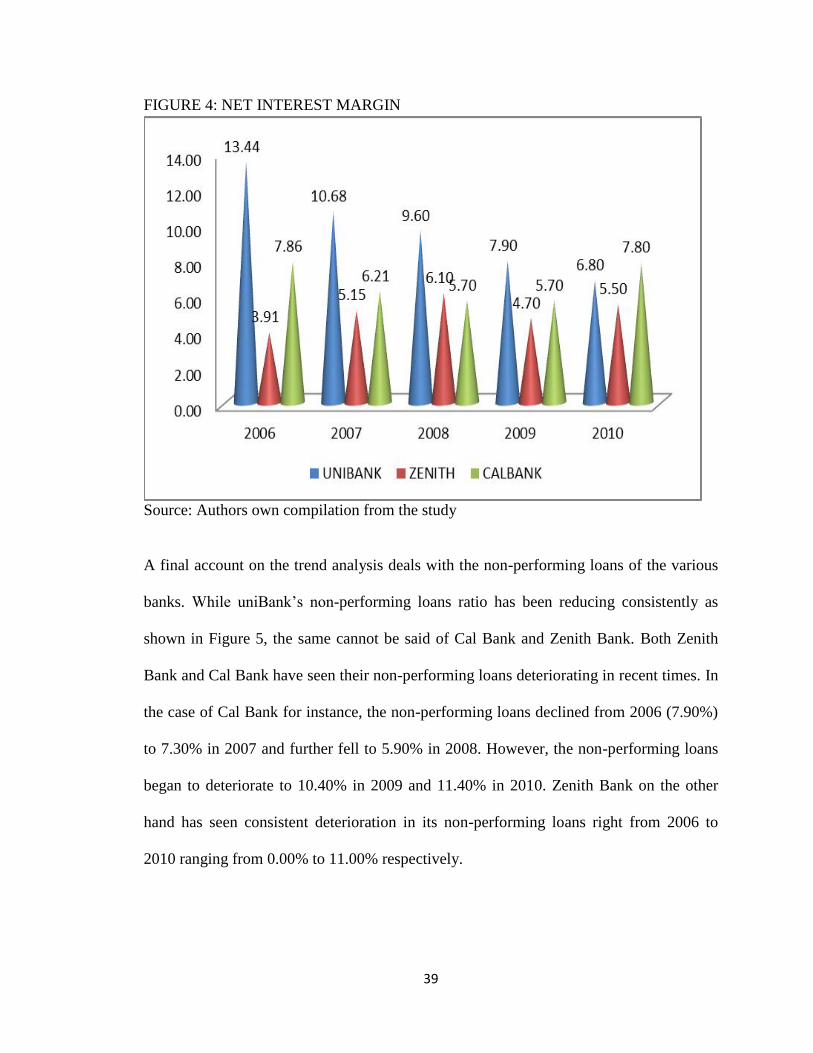
Figure 4 provides the trend of movement of the net interest margin of the studied banks.
While uniBank saw its return on equity rising consistently over the periods of the study,
its net interest margin on the other hand consistently fell over the year. As shown in the
Figure 4, in 2006 net interest margin was 13.44% and fell to 10.68% in 2007, 9.6% in
2008, 7.9% in 2009 and finally 6.8% in 2010. In the case of Cal Bank, net interest margin
fell from 2006 to 2008, maintained the same performance in 2009 as in 2008 and later
surged up in 2010. The net interest margins over the years are 7.86%, 6.21%, 5.7%, 5.7%
and 7.8% from 2006 to 2010. As in the case of Cal Bank, Zenith Bank figures also shows
similar trend as shown in Figure 4.
39
FIGURE 4: NET INTEREST MARGIN
Source: Authors own compilation from the study
A final account on the trend analysis deals with the non-performing loans of the various
banks. While uniBank‟s non-performing loans ratio has been reducing consistently as
shown in Figure 5, the same cannot be said of Cal Bank and Zenith Bank. Both Zenith
Bank and Cal Bank have seen their non-performing loans deteriorating in recent times. In
the case of Cal Bank for instance, the non-performing loans declined from 2006 (7.90%)
to 7.30% in 2007 and further fell to 5.90% in 2008. However, the non-performing loans
began to deteriorate to 10.40% in 2009 and 11.40% in 2010. Zenith Bank on the other
hand has seen consistent deterioration in its non-performing loans right from 2006 to
2010 ranging from 0.00% to 11.00% respectively.

40
FIGURE 5: NON-PERFORMING LOANS
Source: Authors own compilation from the study
4.3 REGRESSION ANALYSIS
The regression analysis starts with the presentation of descriptive statistics. The
descriptive procedure displays univariate summary statistics for several variables in a
single table and calculates standardized values (Z- scores). Variables can be ordered by
the size of their means (in ascending or descending order), alphabetically or by the order
in which you select the variables. It refers the following items, mean, minimum,
maximum, standard deviation, variance, range and standard error of the mean.
From Table 1, the minimum ROA is -7.6% which is attributable to Zenith Bank and the
maximum ROA is 3.31% which again is attributable to Zenith Bank. The mean ROA of
the three banks is 1.4% with a standard error of 0.68391 and a standard deviation of

41
2.64876. The ROE which measures the return on equity has a minimum value of -34.4%
and a maximum value of 24.50% with a mean of 10.51% and standard deviation of 14.18.
The HHI which represents the loan portfolio profitability of the studied banks has a mean
of 15.97%, a standard deviation of about 5.6%. The maximum loan portfolio profitability
is 27.00% and the minimum is 4.59%.
Table 1: Descriptive statistics
Range Minimum Maximum Mean Std.
Deviation
Variance
Statistic Statistic Statistic Statistic Std.
Error
Statistic Statistic
ROA 10.91 -7.60 3.31 1.4000 .68391 2.64876 7.016
ROE 58.90 -34.40 24.50 10.5147 3.66086 14.17844 201.028
HHI 22.41 4.59 27.00 15.9680 1.44470 5.59529 31.307
NPL 14.00 .00 14.00 6.4300 1.10473 4.27859 18.306
RAROA 4.12 -2.87 1.25 .5287 .25826 1.00023 1.000
RAROE 4.16 -2.43 1.73 .7413 .25859 1.00153 1.003
SHFEE 25.71 18.40 44.11 30.5620 1.84089 7.12972 50.833
SIZE 1.01 7.81 8.82 8.4007 .08228 .31867 .102
EQUITY 14.57 4.64 19.21 12.1667 .84419 3.26952 10.690
LOANS 56.12 4.90 61.02 44.7473 3.88120 15.03181 225.955
GROWTH .56 .78 1.34 1.0713 .04337 .16797 .028
CIR .42 .48 .90 .7133 .03941 .15263 .023
NIM 9.53 3.91 13.44 7.1367 .65119 2.52205 6.361
The risk adjusted ROA and ROE namely RAROA and RAROE respectively have also
been presented in Table 1. The minimum RAROA is -2.87% and the maximum RAROA
is 1.25%. The RAROA produced a standard deviation of 1 and a standard error of about
0.26. The share of fee income (SHFEE) recorded a mean of 30.56% with a standard
deviation of about 7.13. The minimum SHFEE is 18.40% and the maximum statistics is
42
44.11%. Details of descriptive statistics for MIN, CIR, GROWTH, LOANS, EQUITY
and SIZE are presented in Table 1.
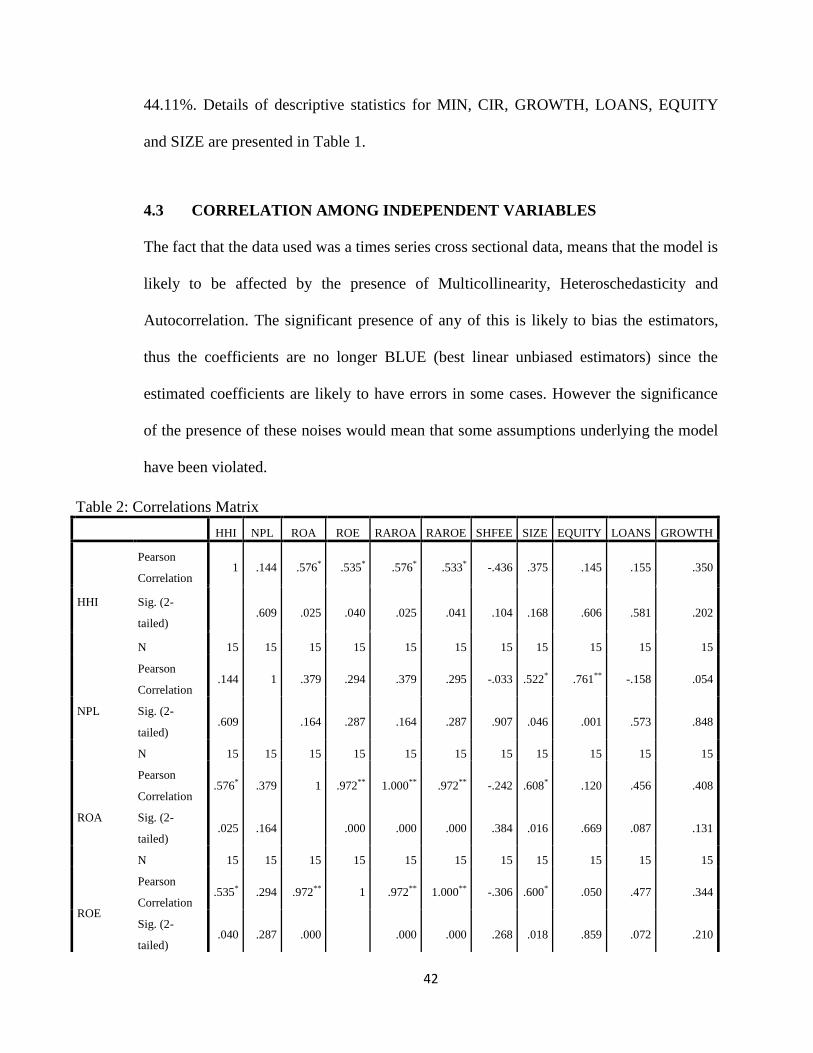
4.3 CORRELATION AMONG INDEPENDENT VARIABLES
The fact that the data used was a times series cross sectional data, means that the model is
likely to be affected by the presence of Multicollinearity, Heteroschedasticity and
Autocorrelation. The significant presence of any of this is likely to bias the estimators,
thus the coefficients are no longer BLUE (best linear unbiased estimators) since the
estimated coefficients are likely to have errors in some cases. However the significance
of the presence of these noises would mean that some assumptions underlying the model
have been violated.
Table 2: Correlations Matrix
HHI NPL ROA ROE RAROA RAROE SHFEE SIZE EQUITY LOANS GROWTH
HHI
Pearson
Correlation 1 .144 .576* .535* .576* .533* -.436 .375 .145 .155 .350
Sig. (2-
tailed)
.609 .025 .040 .025 .041 .104 .168 .606 .581 .202
N 15 15 15 15 15 15 15 15 15 15 15
NPL
Pearson
Correlation .144 1 .379 .294 .379 .295 -.033 .522* .761** -.158 .054
Sig. (2-
tailed) .609
.164 .287 .164 .287 .907 .046 .001 .573 .848
N 15 15 15 15 15 15 15 15 15 15 15
ROA
Pearson
Correlation .576* .379 1 .972** 1.000** .972** -.242 .608* .120 .456 .408
Sig. (2-
tailed) .025 .164
.000 .000 .000 .384 .016 .669 .087 .131
N 15 15 15 15 15 15 15 15 15 15 15
ROE
Pearson
Correlation .535* .294 .972** 1 .972** 1.000** -.306 .600* .050 .477 .344
Sig. (2-
tailed) .040 .287 .000
.000 .000 .268 .018 .859 .072 .210

43
N 15 15 15 15 15 15 15 15 15 15 15
RAROA
Pearson
Correlation .576* .379 1.000** .972** 1 .972** -.243 .609* .120 .456 .409
Sig. (2-
tailed) .025 .164 .000 .000
.000 .384 .016 .669 .088 .130
N 15 15 15 15 15 15 15 15 15 15 15
RAROE
Pearson
Correlation .533* .295 .972** 1.000** .972** 1 -.306 .601* .050 .477 .343
Sig. (2-
tailed) .041 .287 .000 .000 .000
.268 .018 .859 .072 .210
N 15 15 15 15 15 15 15 15 15 15 15
SHFEE
Pearson
Correlation -.436 -.033 -.242 -.306 -.243 -.306 1
-
.525* .094 -.221 -.312
Sig. (2-
tailed) .104 .907 .384 .268 .384 .268
.044 .738 .428 .258
N 15 15 15 15 15 15 15 15 15 15 15
SIZE
Pearson
Correlation .375 .522* .608* .600* .609* .601* -.525* 1 .215 -.099 .567*
Sig. (2-
tailed) .168 .046 .016 .018 .016 .018 .044
.441 .724 .027
N 15 15 15 15 15 15 15 15 15 15 15
EQUITY
Pearson
Correlation .145 .761** .120 .050 .120 .050 .094 .215 1 -.319 -.142
Sig. (2-
tailed) .606 .001 .669 .859 .669 .859 .738 .441
.247 .614
N 15 15 15 15 15 15 15 15 15 15 15
LOANS
Pearson
Correlation .155 -.158 .456 .477 .456 .477 -.221 -.099 -.319 1 .303
Sig. (2-
tailed) .581 .573 .087 .072 .088 .072 .428 .724 .247
.272
N 15 15 15 15 15 15 15 15 15 15 15
GROWTH
Pearson
Correlation .350 .054 .408 .344 .409 .343 -.312 .567* -.142 .303 1
Sig. (2-
tailed) .202 .848 .131 .210 .130 .210 .258 .027 .614 .272
N 15 15 15 15 15 15 15 15 15 15 15
*. Correlation is significant at the 0.05 level (2-tailed).
**. Correlation is significant at the 0.01 level (2-tailed).

44
The correlation matrix in Table 2 above exhibits the extent to which the independent
variables relate to each other. Indeed, the independent variables are in themselves not
supposed to be dependent on each other or statistically relate to each other. The
correlation between NPL and SIZE and other independent variables being related
significantly to each other means that there is the presence of multicolinearity.
4.4 THE IMPACT OF SHARE OF FEE INCOME ON BANK PERFORMANCE
Table 3: Summary of Explanatory Power of Model 1
Model R R Square Adjusted R Square Std. Error of the
Estimate
1 .956a .915 .829 1.09527
a. Predictors: (Constant), EQUITY, SHFEE, GROWTH, LOANS, HHI, NPL, SIZE
Table 3 presents the explanatory power of the estimated model. As seen in the table, the
independent variables are able to explain variations in the dependent variable up to 91.5%
as indicated by the R-square. This means that there are other independent variables that
may determine variations in the dependent variable. The adjusted R-square is produced as
82.9%. The implication of the high explanatory power is that the independent variables
put together are able to influence the behavior of the dependent variable ROA to a very
high extent. The extent of explanation that the individual variables can give about the
performance of the banks is strengthened by the ANOVA table below. As found in Table
4, the regression sum of square is about 89.83 with a mean square of 12.83 and
significant at 1% level of significance. Thus all the independent variables put together are
significantly able to explain changes in the behaviour of the ROA at 1% significant level.

45
The residual sum of squares which represent the unexplained behaviour of the dependent
variable is about 8.4 with a mean square of 1.2. Comparing the regression sum of squares
and the residual sum of squares, it can be inferred that the model greatly explains
variations in the explanatory variable ROA. In terms of goodness of fit, the F-statistic of
about 10.7 indicates that the data well fits the model. In other word, the high F-statistic
produced means that the data to a very high extent fits the model that has been estimated.
From the ANOVA table, it is clear that the predictor variables significantly explain
changes in the Return on Asset at 1% level of significant as indicated earlier.
Table 4: ANOVAa of Estimated Model 1
Model Sum of
Squares
Df Mean Square F Sig.
1
Regression 89.826 7 12.832 10.697 .003b
Residual 8.397 7 1.200
Total 98.223 14
a. Dependent Variable: ROA
b. Predictors: (Constant), EQUITY, SHFEE, GROWTH, LOANS, HHI, NPL, SIZE
Turning the focus of the study on the influence that the individual independent variables
have on the performance of the banks, the analysis begins with the share of fee income
and its influence on the performance of the banks. It must be recollected that SHFEE
represents the share of non-interest income expressed as a percentage of total income.
The result reveals that non-interest income represented by SHFEE significantly impacts
positively on the performance of the estimated banks. The estimated co-efficient of
SHFEE produced a positive estimate of 0.207 indicating that an increase in the share of
fee income by 1% would result in an increase of 20.7% in the Return on Asset of the
studied banks. Thus an increase in the fee income activities results in an increase in the

46
performance of the studied banks. Juxtaposing this finding with the literature, the study
gives credence to the proponents of activity diversification or product mix who argue that
diversification provides a stable and less volatile income, economies of scope and scale
and the ability to leverage managerial efficiency across products (Choi and Kotrozo,
2006). As noted by Chiorazzoet al (2008), as a result of activity diversification, the
economies of scale and scope caused through the joint production of financial activities
leads to increase in the efficiency of banking organizations further strengthening the
argument that product mix reduces total risks because income from non-interest activities
is not correlated or at least perfectly correlated with income from fee based activities and
as such diversification should stabilize operating income and give rise to a more stable
stream of profits (Uzhegova, 2010).
The result of this study however contradicts the opposite argument to income activity
diversification which argues that income diversification leads to increased agency costs,
increased organizational complexity and the potential for riskier behavior by bank
managers. One of such opposing arguments by Kotrozo and Choi (2006) mentioned that
activity diversification results in more complex organizations which “makes it more
difficult for top management to monitor the behavior of the other divisions/branches.
They further argued that the benefits of economies of scale/scope exist only to a point
stating that the costs associated with a firm‟s increased complexity may overshadow the
benefits of diversification.
A further support to income diversification cited from Sufian and Chong (2008) who by
using annual bank level data of all Philippines commercial banks found a positive
relationship between total non-interest income divided by total assets, a proxy for income

47
diversification and bank profitability. Uzhegova (2010) using a HH index of interest
income, commissions, fee income, trading income, non-interest income and other
operating income found empirical support of the idea that banks involved in
diversification activities expect some benefits. While Kotrozo and Choi 2006, using a
similar index found that activity diversification tends to reduce performance compared to
banks more focused in their activities.
HHI is the Herfindahl index for concentration in the banks‟ loan portfolios, i.e. this index
measures diversification in the interest earning business. The study differentiates between
nine sectors: (1) Agricultural, Forestry and Fishing, (2) Mining and Quarrying, (3)
Manufacturing, (4) Construction, (5) Electricity, Gas and Water, (6) Commerce and Finance, (7)
Transport, Storage and Communication, (8) Services and (9) Miscellaneous and represented the
index with Loan portfolio profitability. This analysis indicates the impact that the loan portfolio
profitability has on the performance of the banks. In other words, the HHI index explains how
interest income from loans has on the performance of the banks. As shown in Table 5, the interest
income also significantly impacts positively on bank performance. The estimated coefficient is
0.212 indicating that an increase in loan portfolio profitability or interest bearing activities results
in an increase in the performance of the bank. Specifically an increase in loan portfolio
profitability by 1% would result in 21.2% increase in the Return on Asset of the banks.
Connecting the impact of the loan portfolio profitability/interest bearing activities on bank
performance with the existing literature, Barth et al. (2004) arguments‟ for restricting
activities suggest that it improves the banking system by avoiding banks from the
problems like conflicts of interest, complexity, moral hazard and monitoring difficulties
is affirmed by this study. As banks expand their interest bearing activities to new sectors,
the restrictions may direct banks to less risky and less complicated activities and thus

48
improve bank loan portfolio diversification performance resulting in increase in the
performance of the banks. However, if this is not the case, the restrictions may misdirect
banks to riskier and more complicated activities and thus decrease diversification
performance.
NPL is the ratio of nonperforming loans to total assets and it measures changes in the
bank‟s actual default risk. The NPL as an ex post measure of loan portfolio quality, as
this may contain information on risk differences by banks not captured by traditional
measures of risk, i.e. risk-weighted assets to total assets ratio. From the study, NPL is
expectedly negatively related to bank profitability and hence performance. The estimated
coefficient is of -0.089% indicates that a 1% increase in non-performing loans results in
about 0.09% reduction in bank performance. From the literature, the accumulation of
Non-performing Loans (NPLs) is generally attributable to a number of factors, including
economic down turns and macroeconomic volatility, terms of trade deterioration, high
interest rates, excessive reliance on overly high-priced inter-bank borrowings, insider
lending and moral hazard (Goldstoin and Turner (1996). The negative impact of NPL on
the performance of the banks might be due to Kassim‟s (2002) suggested causes of Non-
performing Loans (NPLs) such as poor management, lack of sound credit policy,
inadequate credit analysis, errors in documentation and undue emphasis on profitability at
the expense of loan quality. The others he mentioned are fraudulent practices, political
instability/economic depression, abnormal competition, policy and regulatory
inconsistencies, weak real sector and political and social influence on bank operators.

49
Bank size is generally used to capture potential economies or diseconomies of scale in the
banking sector. This variable controls for cost differences and product and risk
diversification according to the size of the financial institution. The first factor could lead
to a positive relationship between size and bank profitability if there are significant
economies of scale (Akhaveinet al, 1997; Bourke, 1989; Molyneux and Thornton, 1992;
Bikker and Hu, 2002; Goddard et al., 2004). This assertion is backed by the findings of
this study. Bank size is positively related to bank performance. This positive relationship
means that the studied banks are currently enjoying economies of scale. This finding also
supported the works of other researchers who conclude that marginal cost savings can be
achieved by increasing the size of the banking firm, especially as markets develop (Boyd
and Runkle, 1993; Miller and Noulas, 1997; Athanasoglouet al., 2008). Eichengreen and
Gibson (2001) suggest that the effect of a growing bank's size on its profitability may be
positive up to a certain limit which confirms the case of the banks in this study. It must be
noted that beyond some point, the impact of bank size could be negative due to
bureaucratic and other factors. Hence, the size-profitability relationship may be expected
to be non-linear as portrayed in the literature (Sufian and Chong, 2008).
This finding however, contradicts studies from Sufian and Chong (2008) for banks in the
Philippines, which shows that impact of bank size, was negatively related to the
profitability of Philippines banks, indicating a negative relationship between bank
profitability and bank size. The negative coefficient according to them indicates that
larger (smaller) banks tend to earn lower (higher) profits. To them, this provides support
to the earlier studies finding economies of scale and scope for smaller banks or

50
diseconomies of scale for larger banks. The authors observed that, Hauner (2005) offers
two potential explanations regarding how size could have a positive impact on bank
performance. First, if this link relates to market power, large banks should pay less for
their inputs. Second, there may be increasing returns to scale through the prioritization of
fixed costs (e.g. research or risk management) over a higher volume of services or
through efficiency gains from a specialized workforce (Sufian and Chong, 2008). The
later argument may apply to the current study.
The study finds a significant positive relationship between bank size and bank
performance. The coefficient of SIZE in the study is about 9.16 and a t-value of 4.645
with a significance level of less than 1%.
Closely related to the bank size is the number of branches (GROWTH) established by the
studied banks. GROWTH is the growth rate of banks‟ total deflated assets. On the one
hand this variable reflects a bank‟s growing business opportunities. On the other hand,
however, it may also be viewed as a proxy for bank managers‟ preference for risk taking,
assuming that risk-loving managers usually prefer fast growth. In this study the number
of branch networks is used to represent growth. This study reveals that GROWTH is
negatively related to bank performance. The estimated coefficient is -6.434 indicating
that unguided increase in the number of branches or pursuance of growth in branch
networks would result in the slowdown in the performance of the bank. The study
showed that bank growth in the number of branches significantly impacts negatively on
bank performance.

51
Focusing on the impact of loans on bank performance, the study revealed that loans are
positively related to bank performance. LOANS in this study represent the ratio of loans
and advances to total assets and is also a proxy for bank managers‟ risk aversion,
assuming that a high degree of capitalization signals a high risk aversion and vice versa.
The regression results of the ratio of total loans to total assets, shows a positive
relationship between credit risk and bank performance. It must be emphasized that
LOANS measures the overall credit risk exposure of the bank in its intermediation
activities. Thus, LOANS may be considered as an ex ante measure of credit risk and the
higher the proportion of lending over total assets, the higher the credit risk of bank
managers. The positive coefficient of LOANS is indicative that a higher return is
expected the higher credit risk the bank assumes. A 1% increase in LOANS increases
ROA by 13%. This result strengthens the risk adverse nature of banks. Again, the
positive relationship between ROA and LOANS is an indication that the bank‟s credit
risk attitude remains the same across the credit cycle; thus the bank‟s performance
increases as a compensation for the higher credit risk (Krakah and Ameyaw, 2010).
LOANS are significant in explaining variations in bank performance at 1% level of
confidence.
Finally the study looks at the effects of equity on bank performance. From Table 5,
equity is positively but insignificantly related to bank performance. This means that the
more managers are risk averse and therefore keep more and more equity fund, the more
the banks performance growths.

52
Table 5: Coefficientsaof estimated variables
Model Unstandardized
Coefficients
Standardized
Coefficients
T Sig.
B Std. Error Beta
1
(Constant) -84.113 16.689 -5.040 .001
SHFEE .207 .058 .558 3.546 .009
HHI .212 .063 .447 3.379 .012
NPL -.089 .145 -.143 -.613 .559
SIZE 9.159 1.972 1.102 4.645 .002
GROWTH -6.434 2.631 -.408 -2.446 .044
LOANS .130 .025 .738 5.116 .001
EQUITY .042 .162 .052 .258 .804
a. Dependent Variable: ROA
4.5 THE IMPACT OF FEE INCOME ON INTEREST MARGINS
The next line of analysis takes a look at the impact of fee incomes on interest margin. The
correlation matrix for this model is presented in Table 6. Model 2 presented an R-square
of 56.9% and adjusted R-square of 39.5%. This demonstrates that the explanatory power
of the independent variables in model 2, are moderately able to explain variation in the
interest margin. From Table 9, it can be seen that fee income has positive impact on the
interest margin of the estimated banks. The coefficient of SHFEE in Table 9 produced a
value of 0.069 indicating that fee income activities could complement the performance of
interest income activities. However, the share of fee income is insignificant in explaining
the variation the interest margin. Details of results of model 2 are presented in Tables 6,
7, 8 and 9.

53
Table 6: Correlations Matrix of Impact of Fee Income on Interest Margin
NPL SHFEE EQUITY CIR NIM
NPL
Pearson Correlation 1 -.033 .761**
-.458 .432
Sig. (2-tailed) .907 .001 .086 .108
N 15 15 15 15 15
SHFEE
Pearson Correlation -.033 1 .094 -.106 .185
Sig. (2-tailed) .907 .738 .708 .509
N 15 15 15 15 15
EQUITY
Pearson Correlation .761**
.094 1 -.258 .618*
Sig. (2-tailed) .001 .738 .354 .014
N 15 15 15 15 15
CIR
Pearson Correlation -.458 -.106 -.258 1 .202
Sig. (2-tailed) .086 .708 .354 .469
N 15 15 15 15 15
NIM
Pearson Correlation .432 .185 .618* .202 1
Sig. (2-tailed) .108 .509 .014 .469
N 15 15 15 15 15
**. Correlation is significant at the 0.01 level (2-tailed).
*. Correlation is significant at the 0.05 level (2-tailed).
Table 7: Summary of Explanatory Power of Model 2
Model R R Square Adjusted R Square Std. Error of the
Estimate
2 .755a .569 .397 1.95818
a. Predictors: (Constant), CIR, SHFEE, EQUITY, NPL
Table 8: ANOVAa of Model 2
Model Sum of
Squares
Df Mean Square F Sig.
Regression 50.705 4 12.676 3.306 .057b
Residual 38.345 10 3.834
Total 89.050 14
a. Dependent Variable: NIM
b. Predictors: (Constant), CIR, SHFEE, EQUITY, NPL

54
Table 9: Coefficientsa of Model 2
Model Unstandardized
Coefficients
Standardized
Coefficients
t Sig.
B Std. Error Beta
2
(Constant) -6.499 4.402 -1.476 .171
SHFEE .069 .076 .194 .904 .387
NPL .150 .212 .254 .705 .497
EQUITY .408 .255 .529 1.600 .141
CIR 7.863 3.964 .476 1.984 .075
a. Dependent Variable: NIM

55
CHAPTER FIVE
SUMMARY OF FINDINGS, CONCLUSION AND RECOMMENDATIONS
5.1 SUMMARY OF MAJOR FINDINGS
The study finds that there have been upward and downward movement in the share of fee
income of the various banks. In 2006 uniBank Ghana recorded a share of fee income of
35.12% and this saw an upsurge to 44.11% in 2007. However, the share of fee income for
uniBank has consistently declined to 32.60% in 2008, 21.74% in 2009 and a further
reduction to 20.97% in the year 2010. Cal Bank on the other hand also registered a
consistent decline in share of fee income from 2006 to 2010 as depicted in Figure 1.
However, Zenith Bank saw an up and down movement in its non-interest income. As
shown in Figure 1, the percentage of fee income declined from 35.88% in 2006 to
31.22% in 2007 and again declined to 29.28% in 2008 from the previous year. The
downward trend was curtailed in the next year with share of fee income increasing to
36.00% in 2009 but the increase could not be sustained as the indicator saw a decline to
33.38% in 2010.
In terms of bank performance, all three banks in the study have seen an upward
movement in the return on asset from 2006 to 2008. uniBank and Cal Bank later in 2009
registered a decline in their Return on Asset, with Zenith Bank showing an increase in
Return on Asset. While uniBank and Cal Bank recorded increases in the Return on Asset
for 2010 over the previous year, Zenith Bank recorded a fall in the return on asset.

56
The study showed that non-interest income represented by SHFEE significantly impacts
positively on the performance of the estimated banks. The estimated co-efficient of
SHFEE produced a positive estimate of 0.207 indicating that an increase in the share of
fee income by 1% would result in an increase of 20.7% in the Return on Asset of the
bank. Thus an increase in the fee income activities results in an increase in the
performance of the studied banks. Juxtaposing this finding with the literature, the study
gives credence to the proponents of activity diversification or product mix who argue that
diversification provides a stable and less volatile income, economies of scope and scale,
and the ability to leverage managerial efficiency across products (Choi and Kotrozo,
2006). As noted by Chiorazzoet al (2008), as a result of activity diversification, the
economies of scale and scope caused through the joint production of financial activities
leads to increase in the efficiency of banking organizations further strengthening the
argument that product mix reduces total risks because income from non-interest activities
is not correlated or at least perfectly correlated with income from fee based activities and
as such diversification should stabilize operating income and give rise to a more stable
stream of profits (Uzhegova, 2010).
The interest income also significantly impacts positively on bank performance. The
estimated coefficient is 0.212 indicating that an increase in loan portfolio profitability or
interest bearing activities results in an increase in the performance of the bank.
Specifically an increase in loan portfolio profitability by 1% would result in 21.2%
increase in the return on asset of the banks.
Connecting the impact of the loan portfolio profitability/interest bearing activities on
bank performance with the existing literature, Barth et al. (2004) arguments‟ for

57
restricting activities suggest that it improves the banking system by avoiding banks from
problems like conflicts of interest, complexity, moral hazard and monitoring difficulties
is affirmed by this study. As banks expand their interest bearing activities to new sectors,
the restrictions may direct banks to less risky and less complicated activities and thus
improve bank loan portfolio diversification performance resulting in increase in the
performance of the banks. However, if this is not the case, the restrictions may misdirect
banks to riskier and more complicated activities and thus decrease diversification
performance.
In this study the number of branch networks is used to represent growth. This study
reveals that GROWTH is negatively related to bank performance. The estimated
coefficient is -6.434 indicating that unguided increase in the number of branches or
pursuance of growth in branch networks would result in the slowdown in the
performance of the bank. The study showed that bank growth in the number of branches
significantly impacts negatively on bank performance.
Fee income has positive impact on the interest margin of the estimated banks. The
coefficient of SHFEE in Table 9 produced a value of 0.069 indicating that fee income
activities could complement the performance of interest income activities. However, the
share of fee income is insignificant in explaining the variation in interest margin.

58
5.3 CONCLUSION
Bank income sources are diversified significantly in the Ghanaian banking industry. The
study concludes that both interest and non-interest activities significantly impacts
positively on bank performance while bank growth in the number of branches
significantly impacts negatively on bank performance. This lead to the acceptance of both
H1which hypothesized that commercial banks in Ghana are diversified in source of
income and H2 which postulates that income source diversification improves financial
performance of commercial banks.
5.4 RECOMMENDATIONS
To improve bank performance banks should deepen efforts to consolidate the
gains in both interest and non-interest income activities.
Branch network expansion activities should be carried out only after a careful cost
benefit analysis has been made.
A robust credit risk management policies should be developed and carefully
implemented to reduce non-performing loans that have negative impact on bank
performance thereby promoting loan portfolio profitability and hence improve
bank performance.

59
REFERENCES
Acharya, V.V., Hasan, I., Saunders, A., (2006), “Should banks be diversified? Evidence
from individ-ual bank loan portfolio”, Journal of Business 79, 1355-1412.
Baele, Lievan, Olivier de Jonghe, and Rudi Vander Vennet, (2007), “Does the Stock
Market Value Bank Diversification?”Journal of Banking and Finance, July, 31 (7), pp
1999-2023.
Calmes, C.P.A., Liu, Y., (2005), “Financial structure change and banking income: A
Canada–US comparison” Bank of Canada Working Paper 030-2005.
Carbo-Valverde, S., Fernandez, F.R., (2007), “The determinants of bank margins in
European banking”, Journal of Banking and Finance 31, 2043–2063
Chiorazzo, V., C. Milani, and F. Salvini (2008), “Income Diversification and Bank
Performance: Evidence from Italian Banks”, Journal of Financial Services Research 33,
pp 181–203.
Clark, T., Dick, A., Hirtle, B., Stiroh, K., Williams, R., (2007), “The role of banking in
the US banking industry: risk, return and industry structure”, Federal Reserve Bank of
New York, Economic Policy Review 13, 39–56.
DeYoung, R. and T. Rice (2004), “Non-interest Income and Financial Performance at
U.S. Commercial Banks”, The Financial Review, Vol. 39, No.1 pp. 456-478.
Feldman, R., and Schmidt, J. (1999), “Non-interest income: A potential for profits, risk
reduction and some exaggerated claims”, Fedgazette, 20-21.
Gallo, J.,Apildado, V., Kolari, J., (1996)“Commercial bank mutual fund
activities”,Journal of Banking and Finance 20, 1775–1791.
Hirtle, B.J., Stiroh, K.J., (2007), “The return to retail and the performance of US Banks”,
Journal of Banking and Finance 31, 1101–1133
Laeven, L., Levine, R. (2007), “Is there a diversification discount in financial
conglomerates?” Journal of Financial Economics 85, 331-367.
Landskroner, Y., Ruthenberg, D., Zaken, D., (2005), “Diversification and performance in
banking: The Israeli case”, Journal of Financial Services Research 27, 27–49.
Lepetit, L., Nys, E., Rous, P., Tarazi, A., (2007), “Bank income structure and risk: An
empirical analysis of European banks”, Journal of Banking and Finance, in press,
doi:10.1016/j.jbankfin.2007.12.002.

60
Mercieca, S., Schaeck, K., Wolfe, S. (2007), "Small European Banks: Benefits From
Diversification?" Journal of Banking and Finance 31, pp 1975-1998.
Shawn, T. (2002), “Firm Diversification and Asymmetric Information: Evidence from
Analysts' Forecast and Earnings Announcements,” Journal of Financial Economics 64,
pp 373-396.
Staikaouras, C. and Wood, G. (2003), “Non-interest Income and Total Income Stability”
Manuscript
Stiroh, K. J. (2004), “Diversification and Banking: Is Non-interest Income the Answer?”
Journal of Money, Credit, and Banking 36, 5, pp 853–882.
Stiroh, K.J., (2006),“A portfolio view of banking with interest and non-interest
assets”,Journal of Money, Credit and Banking 38, 1352–1361
Stiroh, K.J., and Rumble, A. (2006) "The dark side of diversification: The case of USA
financial Holding companies." Journal of Banking and Finance 30(8): 2131-2432.

61
APPENDIX 1
NAME OF BANK YEAR
FEE
INCOME
INTEREST
INCOME LPP NPL ASSET
NO. OF
BRANCHES
ZENITH 2006 1300400 2323700 4.59 0 64735400 8
ZENITH 2007 6599358 12944175 9.41 1 156248325 10
ZENITH 2008 14750371 35622501 19.6 0.9 387955070 16
ZENITH 2009 37230007 66198004 19.9 9 554662147 22
ZENITH 2010 29964000 59790000 12.4 11 654041000 22
UNIBANK 2006 17918931 33096216 18.07 14 371579362 6
UNIBANK 2007 3696186 4683226 14.61 7 69239698 11
UNIBANK 2008 8661007 17903984 21.5 4 116636839 12
UNIBANK 2009 9414128 33892289 27 4 219979940 13
UNIBANK 2010 12916595 48667332 18.7 2.65 393493496 14
CALBANK 2006 8632000 16267000 9.98 7.9 157066000 7
CALBANK 2007 11075000 24401000 15.06 7.3 233064000 8
CALBANK 2008 16490000 38059000 14 5.9 335649000 11
CALBANK 2009 17134000 64215000 20 10.4 450470000 13
CALBANK 2010 15702000 69635000 14.7 11.4 499751000 17
NAME OF BANK YEAR NOMINAL LOANS SHAREHOLDERS FUND ROA ROE RAROA RAROE
ZENITH 2006 14124900 7174700 -7.6 -34.4 -2.87 -2.43
ZENITH 2007 67348632 7245061 0.1 1 0.04 0.07
ZENITH 2008 139822691 39044613 3.25 24.5 1.23 1.73
ZENITH 2009 200554498 72723378 3.31 16.9 1.25 1.19
ZENITH 2010 291079000 86591000 2.51 12.59 0.95 0.89
UNIBANK 2006 18203276.4 71394992 0.74 4.28 0.28 0.3
UNIBANK 2007 42247597 8578673 0.96 5.42 0.36 0.38
UNIBANK 2008 66327664 17431724 2.01 9.57 0.76 0.67
UNIBANK 2009 111607616 19958808 1.89 13.52 0.71 0.95
UNIBANK 2010 221526578 40356817 2.23 15.74 0.84 1.11
CALBANK 2006 85680000 21287000 3 21.2 1.13 1.5
CALBANK 2007 114918000 28941000 2.2 16.7 0.83 1.18
CALBANK 2008 190938000 35408000 2.7 24.5 1.02 1.73
CALBANK 2009 214715000 57014000 1.8 14.2 0.68 1
CALBANK 2010 256634000 76519000 1.9 12 0.72 0.85

62
NAME OF BANK YEAR SHFEE SIZE EQUITY LOANS GROWTH CIR NIM
ZENITH 2006 35.88 7.81 11.08 21.82 0.9 0.9 3.91
ZENITH 2007 33.77 8.19 4.64 43.1 1 0.9 5.15
ZENITH 2008 29.28 8.59 10.06 36.04 1.2 0.6 6.1
ZENITH 2009 36 8.74 13.11 36.16 1.34 0.5 4.7
ZENITH 2010 33.38 8.82 13.24 44.5 1.34 0.6 5.5
UNIBANK 2006 35.12 8.57 19.21 4.9 0.78 0.72 13.44
UNIBANK 2007 44.11 7.84 12.39 61.02 1.04 0.8 10.68
UNIBANK 2008 32.6 8.07 14.95 56.87 1.08 0.9 9.6
UNIBANK 2009 21.74 8.34 9.07 50.74 1.11 0.9 7.9
UNIBANK 2010 20.97 8.59 10.26 56.3 1.15 0.8 6.8
CALBANK 2006 34.67 8.2 13.55 54.55 0.85 0.48 7.86
CALBANK 2007 31.22 8.37 12.42 49.31 0.9 0.6 6.21
CALBANK 2008 30.23 8.53 10.55 56.89 1.04 0.6 5.7
CALBANK 2009 21.06 8.65 12.66 47.66 1.11 0.6 5.7
CALBANK 2010 18.4 8.7 15.31 51.35 1.23 0.8 7.8