the impact of arctic climate changes on weather and
TRANSCRIPT

The impact of Arctic climate changes on weather and climate in mid-latitudes –
The role of tropo-stratospheric couplingDörthe Handorf1
Joint work with: Ralf Jaiser1, Annette Rinke1, Klaus Dethloff1,Judah Cohen2, Tetsu Nakamura3, Jinro Ukita4, Koji Yamazaki3
1Alfred Wegener Institute, Helmholtz Center for Polar and Marine Research, Research Department Potsdam
2Atmospheric and Environmental Research, Inc., Lexington, Massachusetts, USA3Hokkaido University, Sapporo, Japan
4Niigata University, Niigata, Japan
GOTHAM Summer School, Potsdam, 19th September 2017Arctic Sea Ice © AWI/Mario Hoppmann CC-BY 4.0

Planetary-scale atmospheric circulation
Observed Arctic-midlatitude linkages
Mechanisms of linkages
Representation in climate models
Arctic climate changeImpacts on weather and climate in mid-latitudes
Arctic climate change

Die Arktis im globalen Klimasystem
OOOOzone AerosolsClouds
CH4
Sea Ice
Tracers
Momentum
Heat
Humidity CO2
Ocean currents
H
T
The Arctic within the global climate system
Global Feedbacks
Regional Feedbacks
Figure according to Dethloff 2013
Arctic Sea-ice changes withpreceding, simultaneous or
subsequent changesof the atmospheric
circulation
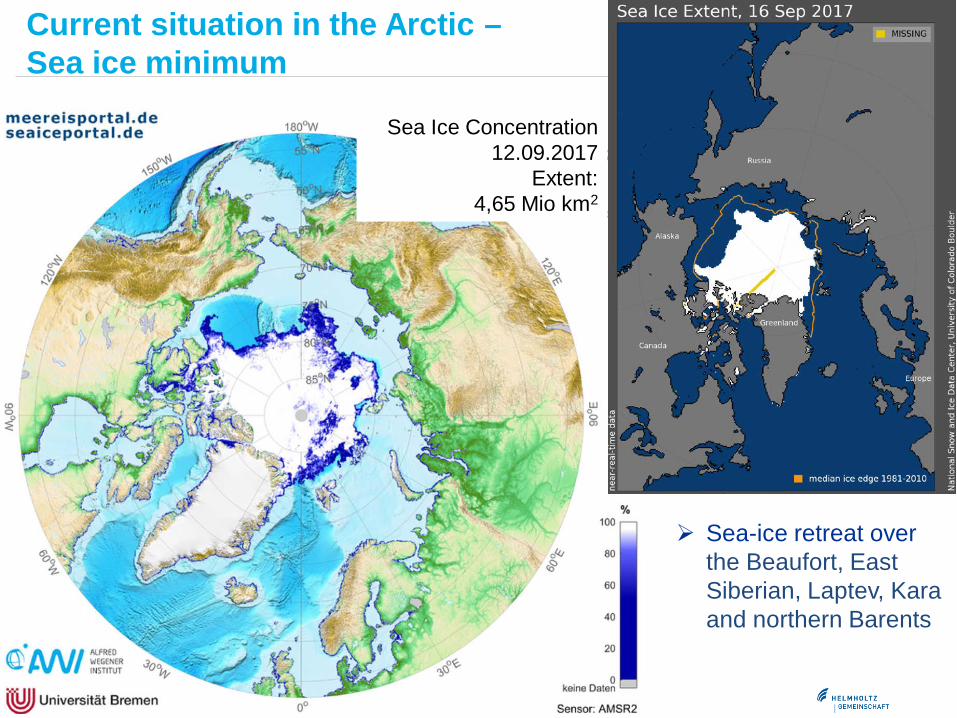
Current situation in the Arctic –Sea ice minimum
Sea-ice retreat overthe Beaufort, East Siberian, Laptev, Kara and northern Barents
Sea Ice Concentration12.09.2017
Extent:4,65 Mio km2

Current situation in the Arctic –Sea ice minimum
Sea ice extent
Arctic sea ice extentSeptember minimum

Retreat of Arctic Sea IceExtent in September,
1979-2017
Arctic Amplification andRetreat of Arctic Sea Ice
Arctic AmplificationAnomalies of Surface Air
Temperature 2007-2016 fromMean over 1951-1980
Goddard Institute for Space Studies, 2014http://data.giss.nasa.gov/gistemp/
[K]
http://www.meereisportal.de

Arctic Amplification
http://data.giss.nasa.gov/cgi-bin/cdrar/do_LTmaoE.cgi
Recent warming is global with strong Arctic amplification
Arctic warming in 1930s
Amplification is greatest in autumn and winter Amplification is greatest near the surface
Screen et al., GRL, 2012
Surface Air Temperature (NASA GISS) Annual zonal mean anomalies 1880-2016
relative to 1951-1980
Vertical & seasonal structure of Arctic-mean temperature trends
ERA-I reanalyses 1979–2008

Arctic amplification –Possible Feedback ExplanationsIce/Snow Albedo-Temperature Feedback No direct influence in the Arctic winterWater Vapour Feedback No winter trend in precipitable waterCloud Feedback Open questionDynamical Feedback Changes in meridional energy transport
Thinning Sea Ice Feedback Enhanced heat flux from ocean through sea ice
Lapse-rate feedbackStronger warming at the surface than in the middle and upper troposphere Positive lapse rate feedback in the Arctic
Amplification is greatest in autumn/ winter near surface
Pithan & Mauritsen, JC, 2013

Scientific TopicAtmospheric circulation in the mid-latitudes –Jet streams-Planetary Waves-Circulation patterns
MERRA data, Jan. 2012, NASA
Polar jet stream at ca. 10 km heightTwo states of atmospheric circulation
Meandering jet streamLarge-amplitude planetary waves
Zonal jet streamSmall-amplitude planetary waves

Scientific TopicAtmospheric circulation in the mid-latitudes –Jet streams-Planetary Waves-Circulation patterns
Corresponding patterns of sea-level pressure anomalies (deviation from mean pressure distribution)
ME
RR
A data, Jan. 2012, N
AS
A
Two states of atmospheric circulation over the North Atlantic-European sector
Meandering jet streamLarge-
amplitude planetary
waves
North-Atlantic Oscillation in
negative phase(NAO-)
Zonal jet streamSmall-
amplitude planetary
waves
North-Atlantic Oscillation in
positive phase(NAO+)

Scientific TopicAtmospheric circulation in the mid-latitudes –Jet streams-Planetary Waves-Circulation patterns
ME
RR
A data, Jan. 2012, N
AS
A
Two states of atmospheric circulation over the North Atlantic-European sector
Meandering jet streamLarge-
amplitude planetary
waves
North-Atlantic Oscillation in
negative phase(NAO-)
Zonal jet streamSmall-
amplitude planetary
waves
North-Atlantic Oscillation in
positive phase(NAO+)
Can Arctic changes contribute to changes in the frequency of occurrence of circulation states (NAO-phases)??

Wilhelm Brennecke (1875–1924), Oceanographer, 2nd German Antarctic Expedition 1911/12
Wilhelm Meinardus (1867–1954), Geographer, Nestor of German Polar Research
Analysis of observational data Brennecke (1904), Meinardus (1906)
local synoptic situation ↔ Position of ice edge
Arctic Sea Ice and atmosphericCirculation changes – Some History
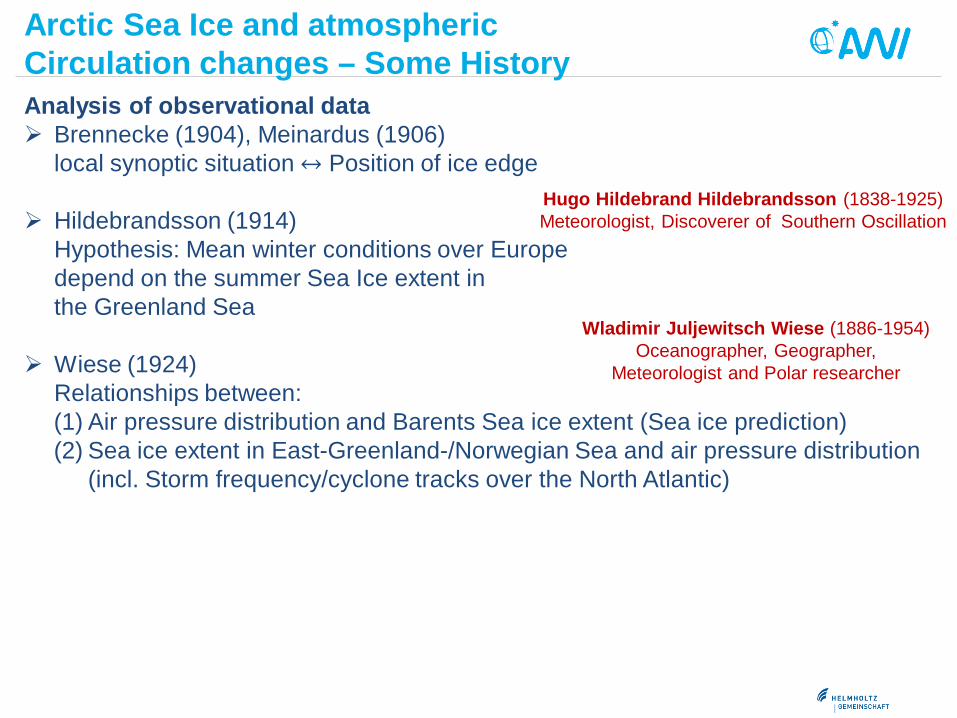
Analysis of observational data Brennecke (1904), Meinardus (1906)
local synoptic situation ↔ Position of ice edge
Hildebrandsson (1914)Hypothesis: Mean winter conditions over Europe depend on the summer Sea Ice extent in the Greenland Sea
Wiese (1924)Relationships between:(1) Air pressure distribution and Barents Sea ice extent (Sea ice prediction)(2) Sea ice extent in East-Greenland-/Norwegian Sea and air pressure distribution
(incl. Storm frequency/cyclone tracks over the North Atlantic)
Arctic Sea Ice and atmosphericCirculation changes – Some History
Hugo Hildebrand Hildebrandsson (1838-1925) Meteorologist, Discoverer of Southern Oscillation
Wladimir Juljewitsch Wiese (1886-1954)Oceanographer, Geographer,
Meteorologist and Polar researcher

Analysis of observational data
Wiese (1924)Relationships between:
(2) Sea ice extent in East-Greenland-/Norwegian Sea and air pressure distribution(incl. Storm frequency/cyclone tracks over the North Atlantic)
Arctic Sea Ice and atmosphericCirculation changes – Some History
Mean cyclone tracks in autumn forHeavy ice conditions in Greenland Sea in April to JulyLight ice conditions in Greenland Sea in April to July
Analysis of observational data Brennecke (1904), Meinardus (1906)
local synoptic situation ↔ Position of ice edge
Hildebrandsson (1914)Hypothesis: Mean winter conditions over Europe depend on the summer Sea Ice extent in the Greenland See
Wiese (1924)Relationships between:(1) Air pressure distribution and Barents Sea ice extent (Sea ice prediction)(2) Sea ice extent in East-Greenland-/Norwegian Sea and air pressure distribution
(incl. Storm frequency/cyclone tracks over the North Atlantic)
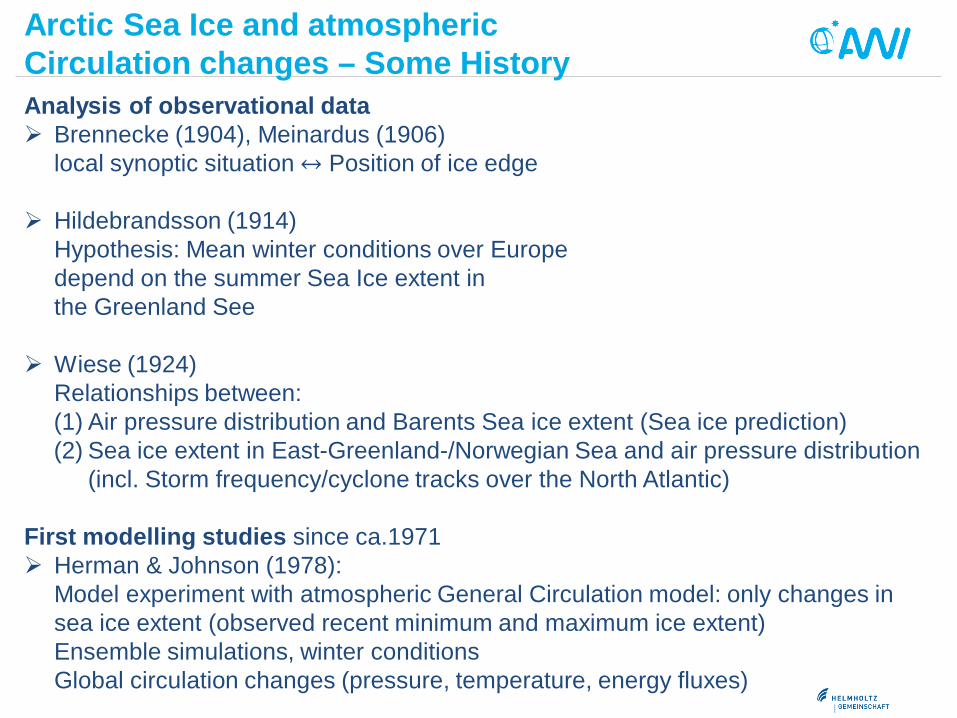
First modelling studies since ca.1971 Herman & Johnson (1978):
Model experiment with atmospheric General Circulation model: only changes in sea ice extent (observed recent minimum and maximum ice extent)Ensemble simulations, winter conditionsGlobal circulation changes (pressure, temperature, energy fluxes)
Arctic Sea Ice and atmosphericCirculation changes – Some History

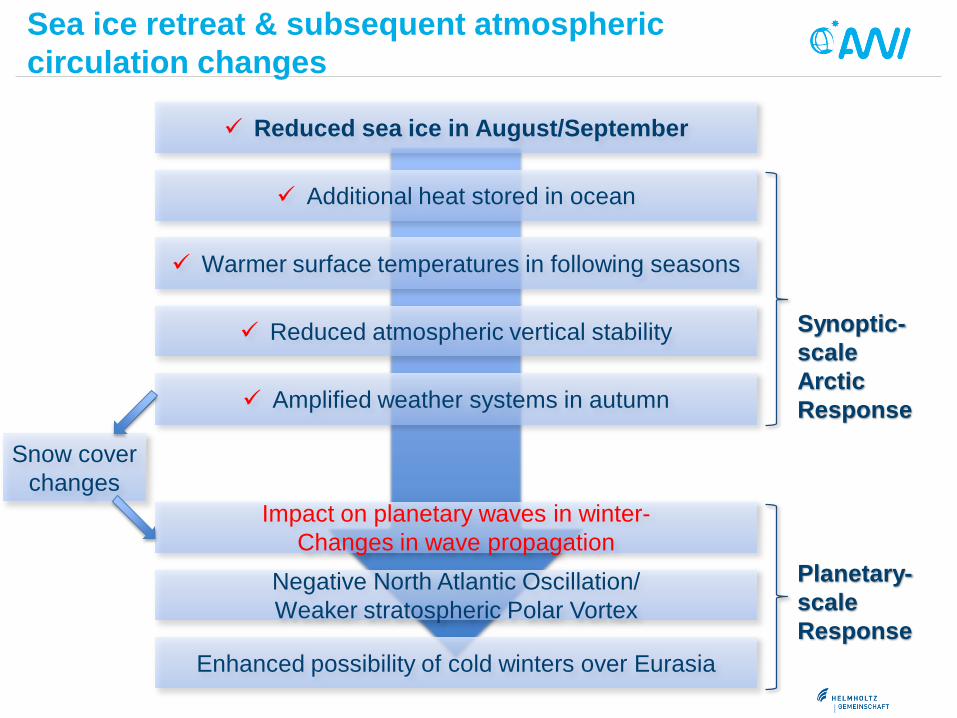
Reduced sea ice in August/September
Additional heat stored in ocean
Warmer surface temperatures in following seasons
Reduced atmospheric vertical stability
Amplified weather systems in autumn
Impact on planetary waves in late autumn & winter-Changes in wave propagation
Weaker stratospheric Polar Vortex/Negative North Atlantic Oscillation
Enhanced possibility of cold winters over Eurasia
Synoptic-scaleArctic Response
Planetary-scaleResponse
Sea ice retreat & subsequent atmosphericcirculation changes
Snow cover changes
A possible dynamical pathway for Arctic-midlatitude linkages?
0
2
4
6
8
10
1975 1983 1991 1999 2007 2015
Ice
exte
nt in
106 k
m2
HIGH ice
LOW ice
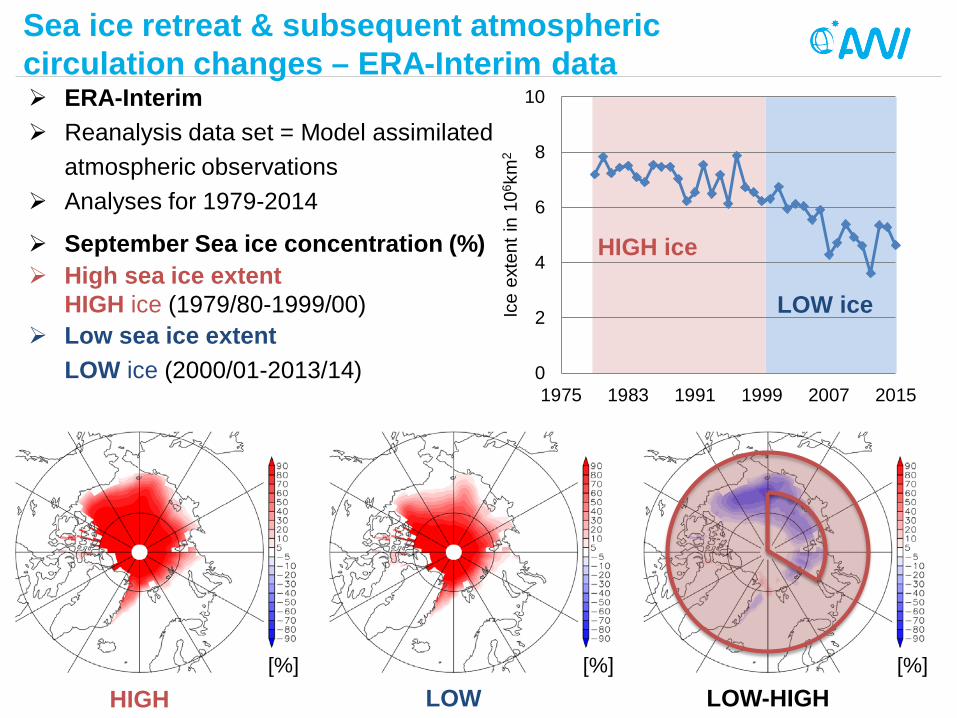
ERA-Interim Reanalysis data set = Model assimilated
atmospheric observations Analyses for 1979-2014
September Sea ice concentration (%) High sea ice extent
HIGH ice (1979/80-1999/00) Low sea ice extent
LOW ice (2000/01-2013/14)
HIGH LOW LOW-HIGH[%] [%][%]
Sea ice retreat & subsequent atmosphericcirculation changes – ERA-Interim data

Temperaturehigher tempera-tures in lowertroposphere
Vertical stabilityLower stability in lower/middle troposphere
Eady Growth RateIncreased baroclinicity inmiddle troposphereIntensification ofcyclolysis
Baroclinic response over the Arctic in autumnlow minus high ice conditions in ERA-Interim,
Area-averaged mean over the Sibirian Arctic Ocean
[d-1][K] [10-3K/m]
100
200
500
850
100
200
500
850
100
200
500
850
Sea ice retreat & subsequent atmosphericcirculation changes – ERA-Interim data

[d-1][K] [10-3K/m]
100
200
500
850
100
200
500
850
100
200
500
850
Number of cyclonesover the Arctic
Sea ice retreat & subsequent atmosphericcirculation changes – ERA-Interim data
Baroclinic response over the Arctic in autumnlow minus high ice conditions in ERA-Interim,
Area-averaged mean over the Sibirian Arctic Ocean
Eady Growth RateIncreased baroclinicity inmiddle troposphereIntensification ofcyclolysis
Reduced sea ice in August/September
Additional heat stored in ocean
Warmer surface temperatures in following seasons
Reduced atmospheric vertical stability
Amplified weather systems in autumn
Impact on planetary waves in winter-Changes in wave propagation
Negative North Atlantic Oscillation/Weaker stratospheric Polar Vortex
Enhanced possibility of cold winters over Eurasia
Synoptic-scaleArctic Response
Planetary-scaleResponse
Snow cover changes
Sea ice retreat & subsequent atmospheric circulation changes

Temperature [K] average 65°N-85°Nfor low minus high ice conditions in ERA-Interim
Polar cap temperature change – ERA-Interim dataP
ress
ure
in h
Pa
[K]
[K] [K]
High ice 1979/80-1999/00 Low ice 2000/01-2013/14
Higher tropospheric temperatures all over the year Global warming impact Arctic amplification impact
Strong significant warming of polar stratosphere in late winter Polar vortex breakdown?
Climatologies of polar cap temperature
Pre
ssur
e in
hP
a

[K]
Polar cap temperature change – ERA-Interim dataTemperature [K] average 65°N-85°Nfor low minus high ice conditions in ERA-Interim
Pre
ssur
e in
hP
a
Higher tropospheric temperatures all over the year Global warming impact Arctic amplification impact
Strong significant warming of polar stratosphere in late winter Polar vortex breakdown? Yes, strato. westerly winds massively reduced

uEfvDt
uD⋅∇=− *
Localized Eliassen-Palm flux (EP flux, Trenberth 1986)• Interaction between waves and mean flow• Description of coupling between troposphere and stratosphere through waves
( )
−−=
STvfvuuvEu
''''2'2' ,,
21
Troposphere-Stratosphere coupling through planetary waves
EP flux divergence
3D EP flux vector
• Divergence of EP flux vector describes the zonal wind forcing by transient eddies• Vector describes the direction of wave propagation• Magnitude of EP flux vector is a qualitative measure of transient eddy activity• Scale seperation between synoptic and planetary scales
Planetary scale vertical component of EP flux vectorHow strong do planetary waves propagate vertically (into the stratosphere)?
We actually use:

Vertical component of Eliassen-Palm flux vector [m2/s2] average 65°N-85°Nfor low minus high ice conditions in ERA-Interim
Polar cap vertical wave propagation change –ERA-Interim data
Enhanced upward propagation of planetary waves in autumn and early winter Disturbing the polar vortex, leading to a vortex breakdown
Vertical wave propagation is reduced in February due to the vortex breakdown Without westerly winds vertical wave propagation is not allowed
Pre
ssur
e in
hP
a
[m2/s2]
Climatologies of polar cap vertical component EP flux vector
[m2/s2] [m2/s2]
High ice 1979/80-1999/00 Low ice 2000/01-2013/14
Pre
ssur
e in
hP
a

Enhanced upward propagation of planetary waves in autumn and early winter Disturbing the polar vortex, leading to a vortex breakdown
Vertical wave propagation is reduced in February due to the vortex breakdown Without westerly winds vertical wave propagation is not allowed
Pre
ssur
e in
hP
a
[m2/s2]
Reduced upward
propagation
Enhanced upward
propagation
Vertical component of Eliassen-Palm flux vector [m2/s2] average 65°N-85°Nfor low minus high ice conditions in ERA-Interim
Polar cap vertical wave propagation change –ERA-Interim data

Reduced sea ice in August/September
Additional heat stored in ocean
Warmer surface temperatures in following seasons
Reduced atmospheric vertical stability
Amplified weather systems in autumn
Impact on planetary waves in winter-Changes in wave propagation
Negative North Atlantic Oscillation/Weaker stratospheric Polar Vortex
Enhanced possibility of cold winters over Eurasia
Synoptic-scaleArctic Response
Planetary-scaleResponse
Snow cover changes
Sea ice retreat & subsequent atmosphericcirculation changes – ERA-Interim data

Planetary-scale response in FebruaryCoupled Patterns 1979-2015
Statistical relation between sea iceretreat and changes of atmosphericcirculation patterns
Changes of centersof action, similaritywith pattern of NAOin negative phase
[%]
[hPa]
Sea level pressureFollowing February (ERA-Interim)
Pattern of NAO-
Sea ice concentrationSeptember (HadISST Data)
Sea ice retreat & subsequent atmosphericcirculation changes – ERA-Interim data

WinterGPH 50hPa
63% expl. Covariance
FebruarySea level pressure
36% explained Covariance
Atm
osph
eric
circ
ulat
ion
Sea
ice
conc
entra
tion September September Planetary-scale response in Feb.Coupled Patterns 1979-2015
Statistical relation betweensea ice retreat and changes ofatmospheric circulation patterns
Changes of centers of action, similarity with pattern of NAOin negative phase
Associated changes in stratosphereWeaker stratospheric Polar Vortex
Jaiser et al. 2012, 2013, 2016 Handorf et al. 2015
Sea ice retreat & subsequent atmosphericcirculation changes – ERA-Interim data

NAO+ SCAN/SIB Blocking ATL-
Cluster analysis of daily SLP fieldsERA-Interim 1979-2015, DJFM
Crasemann et al., (2017) Polar science
SLP anomalies of the five preferred large-scale patterns
Sea ice retreat & subsequent atmosphericcirculation changes – ERA-Interim data
NAO- DIPOLE
Preferred large-scale patterns (circulation regimes) over North-Atlantic-Eurasian region

Relative frequency of occurrence for high ice conditions (blue bars) &for low ice conditions (red bars)
December and JanuaryMore frequent occurrence of SCAN/SIB Blocking
February and MarchMore frequent occurrence of NAO-
Crasemann et al., (2017) Polar Science
Sea ice retreat & subsequent atmosphericcirculation changes – ERA-Interim data
Frequency of occurrence of preferred large-scale patterns over North-Atlantic-Eurasian region
Patterns with significant more frequent occurrence for
low ice conditions

December and JanuaryMore frequent occurrence of SCAN/SIB Blocking
February and MarchMore frequent occurrence of NAO-
Crasemann et al., (2017) Polar science
Sea ice retreat & subsequent atmosphericcirculation changes – ERA-Interim data
Frequency of occurrence of preferred large-scale patterns over North-Atlantic-Eurasian region
Patterns with significant more frequent occurrence for
low ice conditions
Associated patterns of anomalies of 2m-
temperature
December
February

WinterGPH 50hPa
63% expl. Covariance
FebruarySea level pressure
36% explained Covariance
Atm
osph
eric
circ
ulat
ion
Sea
ice
conc
entra
tion September September Planetary-scale response in Feb.Coupled Patterns 1979-2015
Statistical relation betweensea ice retreat and changes ofatmospheric circulation patterns
Changes of centers of action, similarity with pattern of NAOin negative phase
Observed changes in troposphere and stratosphere
Jaiser et al. 2012, 2013, 2016 Handorf et al. 2015
Challenge: Representation in models?
Sea ice retreat & subsequent atmosphericcirculation changes – ERA-Interim data

Model: AFES (Atmospheric general circulation model For Earth Simulator) 2 model simulations, with 60 perpendicular years each
CNTL: High ice conditions as observed from 1979 to 1983 NICE: Low ice conditions as observed from 2005 to 2009 Only sea ice is different between both runs
Improved representation of heat fluxes through sea ice Nakamura et al. (2015, JGR); Jaiser et al. (2016)
Representation of sea ice impactsin climate models
Maps of sea ice concentration in fall (SON) for low minus high ice conditions
AFESNICE-CNTL
[%] [%]
ERA-InterimLOW-HIGH

Polar cap mean 65°N-85°N of vertical EP flux component [m2/s2] on planetary scalesfor low minus high ice conditions
AFE
S N
ICE
-CN
TLE
RA
-Inte
rim L
OW
-HIG
H
Similar upward/downward anomalies in Winter
Reduced vertical flux in February is highly significant in both datasets
Consistency of datasets indicates clear impact of sea ice changes
ERA-Interim is more disturbed in early winter
Impact of additional processes
Pre
ssur
ein
hP
a
[m2/s2]
[m2/s2]
Pre
ssur
ein
hP
a
Polar cap vertical wave propagation change –Climate model & ERA-Interim data

Very good agreement between model and reanalysis in winter (and autumn)
ERA-Interim shows a general global warming signal
AFES surface warming related to sea ice alone
Atmospheric models with well implemented sea ice forcing are able to reproduce the observednegative NAO Signal in (late) winter and the relateddynamical processes
[K]
[K]
Polar cap mean 65°N-85°N of Temperature [K] for low minus high ice conditions
MO
DE
L A
FES
NIC
E-C
NTL
ER
A-In
terim
LO
W-H
IGH
Pre
ssur
ein
hP
aP
ress
ure
in h
Pa
Polar cap temperature change –Climate model & ERA-Interim data

Relative frequency of occurrence for high ice conditions (blue bars) &for low ice conditions (red bars)
December and JanuaryMore frequent occurrence of SCAN/SIB Blocking
February and MarchMore frequent occurrence of NAO-
Crasemann et al., (2017) Polar science
Sea ice retreat & changes in atmospheric circulationregimes – Climate model & ERA-Interim data
Preferred large-scale patterns over North-Atlantic-Eurasian regionPatterns with significant more
frequent occurrence for low ice conditions
ERA
-Inte
rimM
odel
AFE
S December and JanuaryMore frequent occurrence of SCAN/SIB Blocking
February and MarchMore frequent occurrence of NAO-

Dynamical linkages betweenthe Arctic and the mid-latitudes
Polar Vortex
Changes in Weather andClimate of the mid-latitudes
Sea Ice Loss In summer and early fall in late fall and winter
Snow Cover
Global Climate Change
ArcticAmplification
NaturalClimate Variability
Changes in Synoptic cyclones Jets Planetary waves
Vertical wave flux
Downward propagation
Synoptic-planetary interactionsDiabatic wave forcing
Decreased temp. gradient

OutlookSea ice change is a fundamental driver of atmospheric circulation anomalies
Atmospheric models with well implemented sea ice forcing and more realistic surface fluxes are able to reproduce the observed negative (N)AO Signal in (late) winter and the related dynamical processes
Sea ice forcing changes the occurrence of preferred circulation states of the chaotic atmosphere
Dependence of the signal on the regional pattern of sea ice changes has to beanalysed
Changes in other forcing factors have to be studied, e.g. Changes in snow cover or sea surface temperatures Changes in natural varibility patterns (e.g. ENSO)
Detailed studies of linkages and underlying mechanisms in other seasons are still to be done

OutlookConclusions for the modelling of the impact of Arctic climate changes on theweather and climate in mid-latitudes
Fundamental dynamic processes in the atmosphere have to be well represented, in particular wave forcing and wave propagation
Adequate implementation of surface forcing is essential important for coupled atmosphere-ocean-sea-ice models
Potential for improved predictions on seasonal to decadal time scales andsubsequent climate impact studies

Thank you for your kind attention!

ReferencesCohen, J. J. A. Screen, J. C. Furtado, M. Barlow, D. Whittleston, D. Coumou, J. Francis, K. Dethloff, D. Entekhabi, J. Overland, J. Jones, (2014), Recent Arctic amplification and extreme mid-latitude weather. Nature Geoscience, 7, 627–637, doi:10.1038/ngeo2234Handorf, D., R. Jaiser, K. Dethloff, A. Rinke, and J. Cohen (2015), Impacts of Arctic sea ice and continental snow cover changes on atmospheric winter teleconnections. Geophys. Res. Lett., doi:10.1002/2015GL063203Jaiser, R., K. Dethloff, D. Handorf, A. Rinke, and J. Cohen (2012), Planetary- and synoptic-scale feedbacks between tropospheric and sea ice cover changes in the Arctic, Tellus, Ser. A, 64, 11595, doi:10.3402/tellusa.v64i0.11595.Jaiser, R., K. Dethloff, and D. Handorf (2013), Stratospheric response to Arctic sea ice retreat and associated planetary wave propagation changes, Tellus, Ser. A, 65, 19375, doi:10.3402/tellusa.v65i0.19375.Jaiser, R., T. Nakamura, D. Handorf, K. Dethloff, J. Ukita, K. Yamazaki (2016), Atmospheric winter response to Arctic sea ice changes in reanalysis data and model simulations. JGR.Nakamura, T., K. Yamazaki, K. Iwamoto, M. Honda, Y. Miyoshi, Y. Ogawa, J. Ukita (2015), A negative phase shift of the winter AO/NAO due to the recent Arctic sea-ice reduction in late autumn. J. Geophys. Res. Atmos., 120, 3209–3227, doi: 10.1002/2014JD022848.Brennecke, W. (1904), Beziehungen zwischen der Luftdruckverteilung und den Eisverhältnissen in des Ostgrönländischen Meeres. Ann. Hydrogr. Mar. Meteor., 32(II), 49-62.Meinardus, W. (1906), Periodische Schwankungen der Eistrift bei Island. Ann Hydrogr. Mar. Meteor., 34, 148-162, 227-239, 278-285.Hildebrandsson, H.H. (1914), Quelques recherches sur les centres d‘action de l‘atmosphere. Kungl. Svenska vetenskapsakademiens handlingar, 51, 3-16.Wiese, W. (1924), Polareis und atmosphärische Schwankungen. Geograf. Ann., 6, 273-299.Herman, G.F. and W.T. Johnson (1978), The Sensitivity of the General Circulation to Arctic Sea Ice Boundaries: A Numerical Experiment. Mon. Weath. Rev., 106, 1649-1664.