the impact of accounting complexity on financial …€¦ · the impact of accounting complexity...
TRANSCRIPT

The Impact of Accounting Regulation Complexity on Financial Reporting Lead-Time
Hannu Ojala
Aalto University School of Economics
P.O. Box 21210
FI-00076 Aalto
Finland
Mari Paananen1
Brunel Business School
Brunel University
Uxbridge UB8 3PH
United Kingdom
Annelies Renders
Department of Accounting and Information Management
Maastricht University
P.O. Box 616
6200 MD Maastricht
The Netherlands
1 Corresponding author

1
The Impact of Accounting Complexity on Financial Reporting Lead-Time
Abstract:
We examine the lead-time of financial reporting in the U.S. between 2000 and 2009.
We use propensity-score matching to control for firm-specific characteristics while
estimating the effects of accounting complexity. We find that most of the complexity
measures are causing a delay in the release of financial reporting. We do not find
support that regulatory changes with respect to measurement and disclosure of
financial holdings cause a delay. However we find that each of the regulatory changes
since 2001 up until 2009 have increased the delay between the fiscal year end and the
earnings announcement date. In addition, the accumulation of exposure to the
regulatory changes, except for one related to measurement and disclosure of financial
holdings, monotonically increases the delay.
Keyword: lead-time, accounting regulation change, accounting complexity, relevance,
propensity-score matching, attribute-based matching

2
1. INTRODUCTION
We examine the lead-time of financial reporting in the U.S. over the period
2000 to 2009. In particular, we investigate whether the ongoing increasing trend in
financial reporting lead-time is a reflection of a gradual increase in accounting
regulation complexity or is due to firm-specific characteristics. To do so we use a
propensity-score matching model to control for firm-specific characteristics when
examining the effects of accounting regulation complexity.
Relevance is a key characteristic for the usefulness of financial reporting and in
order to be relevant information needs to be timely. Prior research up to the mid-
1970s suggests a decreasing trend in the lead-time between the fiscal year end and the
announcement of annual earnings (Givoly and Palmon 1982). However, there are
recent signs that this decreasing trend is broken and that the lead-time of financial
reporting is now increasing (Krishnan and Yang 2009). This development continued up
to 2006 in spite of the Securities and Exchange Commission’s (SEC) new filing
requirement which reduced the deadline for filing annual reports from 90 to 60 days
over a three-year period beginning 2003 (Krishnan and yang 2009).2 One explanation
brought forward for the increase in the lead-time between fiscal year end and annual
earnings announcements is the enactment of Section 404 of the Sarbanes-Oxley Act of
2002 which went into effect in 2004 (Krishnan and Yang 2009). However, voices are
now raised arguing that the steady increase in sheer volume of standards, regulations,
and interpretations has caused accounting standards to become a source of
complexity themselves (Palmrose 2009).
2 Acceleration of Periodic Report Filing Dates and Disclosure Concerning Website Access to Reports.
Release No. 33-8128. Washington, D.C.: SEC.
3
This study contributes to prior research by investigating whether the lead-time
of financial reporting has indeed increased since the early 2000s and whether this
trend is driven by an increase in accounting regulation complexity. We also contribute
to the literature by using a propensity-score model to reduce the effects of potential
misspecification caused by assumptions about the functional form of the relationship
between test and control variables and the outcome. Finally, we add to the literature
by extending the time period to investigate whether the change from a trend to an
increasing trend is still prevailing (Givoly and Palmon 1982; Krishnan and Yang 2009).
We identify five accounting changes that have increased the complexity, that
are related to standards and rules introduced between 2001 and 2008 and that may
have caused a delay in earnings announcements. These accounting changes are as
follows. First, the Statement of Financial Accounting Standards (SFAS) 133: Accounting
for Derivative Instruments and Hedging Activities, promulgating that all derivatives
(either assets or liabilities) are recognized at fair value and SFAS 138: Accounting for
Certain Derivative Instruments and Certain Hedging Activities, which regulates the
netting of foreign currency cash flow hedges, went into effect in June 2000. We
capture the effects of these changes by deeming firms that report hedging gains
and/or losses in comprehensive income as being exposed to these standards. Second,
we also consider the release of SFAS 141: Business Combinations and SFAS 142:
Goodwill and Other Intangible Assets in 2001 as an increase in accounting complexity.
We capture these effects by distinguishing between firms with and without significant
goodwill balances. Third, the SEC rules related to extended disclosure requirements in
the Management’s Discussion and Analysis section in the annual Form 10-K on off-

4
balance sheet arrangements and contracts was enacted in 2003. We capture this effect
based on whether firms report unconsolidated subsidiaries or not. Fourth, SFAS 123R:
Accounting for Stock-Based Compensation which went into effect in 2005 and
mandates income statement recognition of share-based payments to employees is a
further addition to accounting complexity. We capture this complexity by
distinguishing between firms reporting stock option compensation expenses or not.
Finally, SFAS 157: Fair Value Measurements introduced the requirement to disclose fair
value holdings by category (Level 1 – mark-to-market price, Level 2 – mark-to-model
price, and Level 3 – estimations of future cash flows) and reconcile movements in and
out of Level 3. In addition, SFAS 159: The Fair Value Option for Financial Assets and
Financial Liabilities providing companies with an option to value financial assets and
financial liabilities even if it is not required under SFAS 157, also went into effect in
2007. We capture the exposure to the latter two accounting standards by identifying
whether firms report financial holdings of the categories held for trading and/or
available for sale.
We find that most of the accounting complexity effects we identified cause a
delay in the release of the annual earnings. We do not find support for our prediction
related to the most recent addition to regulatory changes with respect to
measurement and disclosure of financial holdings under SFAS 157 and SFAS 159.
However we find that all the other identified regulatory changes deemed to increase
accounting complexity since 2001 up until 2009 have individually increased the delay
between fiscal year end and the earnings announcement date. In addition to our main
results, we find that the accumulation of exposure to the regulatory changes, except

5
for the one related to measurement and disclosure of financial holdings,
monotonously increase the delay of release of information. We interpret our findings
as an indication that recent accounting standards and regulations aimed at increasing
the relevance of the information may have led to a decrease in financial reporting
relevance by delaying the release of information to investors.
The remainder of the paper is organized as follows. Next section provides a
description of the regulatory background and our hypothesis development. Section 3
discusses the research design to test our hypotheses followed section 4 describing our
sample selection process. Section 5 provides the results and section 6 offers a
conclusion.
2. REGULATORY BACKGROUND
Timeliness denotes the idea of information being available to decision makers
in time to make a difference, i.e., to be relevant [The Conceptual Framework of the
Financial Accounting Standards Board (FASB) 1980]. Among others, two key
characteristics commonly discussed in relation to high-quality accounting information
are relevance and faithful representation (previously referred to as reliability).3,4
There
is an inherent tradeoff between the two concepts in that it for obvious reasons takes
longer to achieve faithful representation at the expense of the degree of relevance.
The time span between the period end and the publication of financial reports
(henceforth referred to as lead-time) has a direct impact on the relevance of the
information. Studies on changes in lead-time of financial reporting over time suggest a
3 The Concept Statement 2 and the Framework (1989) used the term reliability instead of faithful
representation. The reason for the change of word is a wish to substitute the notion of verifiability with
the idea of unbiased representation. 4 Statement of Financial Accounting Concepts No. 8. September 2010.
6
long-term decrease in lead-time up until the mid-1970s but an increase during the
period 2002 to 2006 (Givoly and Palmon 1982; Krishnan and Yang 2009). Moreover,
this increase seems to take place despite the Securities and Exchange Commission’s
(SEC) new filing requirement in 2003 where the number of days allowed decreased
from 90 to 60 days during a three-year period as of 2003.5 Some argue that the recent
increase in lead-time is the result of a trend towards more complex financial reporting
(Krishnan and Yang 2009; Palmrose 2009)
There are a number of regulatory changes that took place during the last
decade and that may explain this increase in financial reporting lead-time. First, the
Statement of Financial Accounting Standards (SFAS) 133: Accounting for Derivative
Instruments and Hedging Activities (SFAS 133) went into effect on June 15, 2000 (the
implementation was postponed from June 15, 1999) and we expect to see the effects
of this standard in financial reports with a fiscal financial year beginning in July 2000
and onwards. This standard promulgates that all derivatives (assets and liabilities) are
recognized at fair value. This standard is so complicated that the FASB decided to
create an implementation group to provide guidance on how to implement the
standard.6 At the same time, an amendment to SFAS 133, namely SFAS 138:
Accounting for Certain Derivative Instruments and Certain Hedging Activities, which
regulates the netting of foreign currency cash flow hedges went into effect. Another
change in accounting policies during the period under examination is related to
accounting for goodwill. SFAS 141: Business Combinations and SFAS 142: Goodwill and
5 Acceleration of Periodic Report Filing Dates and Disclosure Concerning Website Access to Reports.
Release No. 33-8128. Washington, D.C.: SEC. 6 http://www.fasb.org/derivatives/index.shtml

7
Other Intangible Assets went into effect in 2001. This policy change lead to the
abandonment of goodwill amortization and the adoption of an impairment test
approach. The impairment test approach requires that impairment tests must be
conducted at the level of the smallest discernable cash generating unit on a regular
basis as opposed to systematic amortization of goodwill.
Furthermore, in 2003 the SEC issued two new rules related to the disclosure of
off-balance sheet arrangements and contracts in the Management’s Discussion and
Analysis section of the annual Form 10-K 7 and the disclosure on internal control in
Exchange Act Periodic Reports.8 In addition, Section 404 of the Sarbanes-Oxley Act of
2002 was enacted in 2003, requiring disclosures about the status of the internal
control system’s ability to curb reporting errors and/or earnings management
(Krishnan and Yang 2009). SFAS 123R: Accounting for Stock-Based Compensation which
went into effect in 2005, mandating income statement recognition of share-based
payments to employees, is a further addition to accounting complexity. Finally, the
most recent changes that may have made financial reporting more complex are
related to fair value accounting. SFAS 157: Fair Value Measurements introduced a
requirement to disclose fair value holdings by category (Level 1 – mark-to-market
price, Level 2 – mark-to-model price, and Level 3 – estimations of future cash flows)
and reconcile movements in and out of Level 3. SFAS 159: The Fair Value Option for
Financial Assets and Financial Liabilities provided companies with an option to value
financial assets and financial liabilities even if it is not required under SFAS 157. Both
7 SEC Release No. 33-8182 Final Rule: Management’s Discussion and Analysis about Off-Balance Sheet
Arrangements and Aggregate Contractual Obligations. 8 SEC Release No. 33-8238 Final Rule: Management’s Reports on Internal Control over Financial
Reporting and Certification of Disclosure in Exchange Act Periodic Reports.

8
standards went into effect in 2007. Table 1 provides a summary of the regulatory
changes deemed to increase accounting complexity between 2000 and 2009.
<Table 1 about here>
Based on the above, we predict that there is an ongoing increase in the lead-
time of financial reporting due to regulatory requirements and hypothesize:
H1: Recent accounting changes that have increased accounting complexity have also
increased the lead-time of financial reporting over time.
3. RESEARCH DESIGN
We use a one-to-one matched pair design to identify treatment firms (firms
experiencing a specific increase in accounting complexity) and control firms (firms not
exposed to a specific accounting complexity). Our matching algorithm uses all variables
typically related to market demand for information and firm-specific incentives to
release or withhold financial information. By doing so we generate samples where
similar firms, exposed (treatment) and not exposed (control) to the accounting
complexity, are compared. We use a logit model to estimate the probability to be
exposed to each of the previously identified specific accounting changes as an
approach to estimate propensity-scores.
The extant literature identifies two sources affecting the lead-time of financial
reporting, namely the level of market demand (Givoly and Palmon 1982; Chambers

9
and Penman 1984; Diamond 1985; Healy and Palepu 2001; Sengupta 2004; Ball and
Shivakumar 2005) and management incentives related to the timing of publishing
financial information (Atiase et al. 1989; Haw et al. 2000; Owusu-Ansah 2000; Haw et
al. 2003; Leventis and Weetman 2004; Lee et al. 2008). We use a propensity-score
model (Rosenbaum and Rubin 1985) to match firms experiencing similar levels of
market demand for information and having similar firm-specific incentives to examine
whether regulatory complexity increases the lead-time of financial reporting.
3.1. Matching variables
Prior research suggests that changes in lead-time of financial reporting over
time is not only driven by technical aspects related to the production of the
information but also by investors’ demand for more information (Givoly and Palmon
1982; Sengupta 2004; Ball and Shivakumar 2005). Specifically, previous research
indicates that external stakeholders with no access to private information exert
pressure on management to release financial reports as soon as possible (Healy and
Palepu 2001; Ball and Shivakumar 2005; Eierle 2005). Ball and Shivakumar (2005) find
that public companies recognize losses timelier compared to private companies, which
they interpret as a result of different levels of information asymmetry across these
types of companies. Investors are also concerned about receiving (timely) information
from firms they are investing in as prior research shows that shorter lead-times are
negatively associated with market liquidity measures such as trading volume (Sengupta
2004). In addition, improving disclosure practices (in this case timely reporting of
useful information) leads to increased analyst following (Lang and Lundholm 1996;

10
Healy et al. 1999; Bushee and Noe 2000). Prior research also indicates that the demand
for timely information varies across investor groups (Bushee and Noe 2000; Sengupta
2004). Transient investors demand more timely information in order to sustain their
aggressive short-term trading strategies compared to block holders with a long-term
interest who are less sensitive to short-term events (Bushee and Noe 2000; Sengupta
2004). We include the bid-asked spread (SPREAD) as a proxy for market demand for
financial information (Chordia et al. 2001) in the propensity score matching model. We
also control for analyst following using the number of analysts forecasting firms’
annual earnings in the month of December and for whether the firm year end is at the
end of December (Barth et al. 2001; Ettredge et al. 2006).
The second source affecting financial reporting lead-time is economic
incentives to release or hold back information (Sengupta 2004). Management have the
choice to release information in order to supply investors with relevant private
information or to hold it back, either on grounds of wanting to reduce uncertainties in
the information or simply to withhold information from the market to a later point in
time. The extant literature suggests a number of factors that provide managers with
incentives to disclose or withhold information to investors. Examples of such factors
are reputational concerns, litigation risk, and profitability (Verrecchia 1983; Skinner
1994; Sengupta 2004; Beatty and Weber 2006; Kothari et al. 2009). In general,
reputation and litigation concerns accelerate the release of bad news (Skinner 1994;
Kasznik and Lev 1995; Kothari et al. 2009). Prior research indicates that some firms are
more exposed to a higher litigation risk than other (Kaznik and Lev 1995; Sengupta
2004). Specifically, Sengupta (2004) finds that firms in the Drugs, R&D Services,

11
Programming, Computers, and Electronics industries are more sensitive to the threat
of lawsuits. However, financial distress and career concerns may slow down the
release of financial information (Gilson 1989). We therefore include a dummy variable
TECH taking on the value of one if the firm is operating in the Drugs (Sic codes 2833-
2836), R&D services (Sic codes 8731-8734), Programming (Sic codes 7371-7379),
Computers (Sic codes 3570-3577), or Electronics (Sic codes 3600-3674) industries and
zero otherwise. Furthermore, to capture the effect of profitability, we include a
variable LOSS taking on the value one if the company is reporting losses and zero
otherwise (Skinner 1994, 1997; Sengupta 2004). Following extant literature we also
include size SIZE measured as the natural log of sales (Bushee et al. 2003; etc.) and
leverage LEV. The latter variable is used as a control for the level of threat of financial
distress (Kothari et al. 2009).We also control for closely-held shares CLOSE which is
defined as closely-held shares scaled by total outstanding shares. Finally, the variable
ACOV control for number of analysts following the firm. Hence, our logistic regression
model is the following:
Ze
DECILE−
+
=
1
1)(Prob (1)
it
k
itkititit
ititititit
YEARCLOSELEVSIZE
LOSSTECHACOVDECSPREADZ
εαααα
αααααα
+++++
+++++=
∑=
2009
2000
876
543210 where
3.2. Treatment and control firms
12
We then identify a measure for each accounting complexity added by new
regulations. The proxy to identify firms exposed to SFAS 133: Accounting for Derivative
Instruments and Hedging Activities and SFAS 138: Accounting for Certain Derivative
Instruments and Certain Hedging Activities is a dummy variable taking on the value one
if the firm reports hedging gains or losses in comprehensive income and zero
otherwise. In order to capture whether a firm is exposed to the abandonment of
amortization of goodwill under SFAS 141: Business Combinations and SFAS 142:
Goodwill and Other Intangible Assets we create a dummy variable taking on the value
one if a company reports a goodwill balance amounting to at least 20% of total assets
and zero if the goodwill balance amounts to less than 5% of total assets. The third
accounting complexity measure is related to the SEC Release No. 33-8182 Final Rule:
Management’s Discussion and Analysis about Off-Balance Sheet Arrangements and
Aggregate Contractual Obligations (SEC Release No. 33-8182). We use the reporting of
investments in unconsolidated subsidiaries as an indication of off-balance sheet
arrangements. We assume that firms with unconsolidated subsidiaries are more likely
to use Special Purpose Enterprises (SPEs) and the equity method for off-balance sheet
financing activities and therefore we expect the complexity of financial reporting for
this group of companies to increase after the SEC Release No. 33-8182 went into effect
(Bauman 2003; Landsman et al. 2008). The next complexity measure is related to the
SFAS 123R: Accounting for Stock-Based Compensation. We use an indicator of whether
a firm reports stock option compensation expenses or not to capture whether a firm is
exposed to further complexity caused by the revision of SFAS 123. Finally, we examine
the potential increase in accounting complexity related to the implementation of SFAS

13
157: Fair Value Measurements (SFAS 157). We use a dummy variable taking on the
value of one if a firm reports available for sale and/or held for trading holdings to
capture firms likely to be affected by any accounting complexity caused by SFAS 157.
We run propensity-score models developed by Rosenbaum and Rubin (1985)
on ten ordered levels of delays in financial reporting to match characteristics affecting
financial reporting lead-time. That is, we follow Armstrong et al. (2010) and partition
the number of days of delay into ten percentiles in order to relax the assumption that
there is a strict monotonic association between the characteristics and the number of
days of delay. We perform the matching separately at each delay percentile and by
each year represented in the sample. In addition, we do this separately for each
accounting complexity measure and match without replacement firms exposed to each
measure and firms that are not exposed. By doing this, we control to some degree for
potential bias typical for empirical studies where randomization is impossible to carry
out (Lawrence et al. 2011).
Using the samples obtained through the propensity-score matching processes
for each accounting regulatory change measure, we then conduct two types of tests of
the difference in the lead-time between exposed and non-exposed firms. First, we
conduct a pairwise means test before and after the introduction of each accounting
complexity measure. Second, we test whether there is an increase in the delay in
reporting the earnings announcement for each accounting complexity measure
introduced using a model as specified below:

14
�������� =� + ��������� + ������ + ������� + �������
+ ������� + ������� + ������ + ��������
+ ����� �� + �� ���!���� + �"�##$��
+ �%����&���� + �� #���� + ����#���_2003� + +�
(2)
Where SPREAD, DEC, ACOV, TECH, LOSS, SIZE, LEV, and CLOSE are defined as
above. lnDELAY is the natural log of the number of days between the fiscal year-end
date and the date of the earnings announcement. HEDGE is a dummy variable taking
the value one if a firm reports hedging gains or losses in comprehensive income and
zero otherwise. GOOWILL is a dummy variable taking the value one if a firm reports a
goodwill balance greater than 20% of total assets and zero if a firm reports a goodwill
balance less than 5% of total assets. OFFBS is a dummy variable taking the value one if
a firm reports unconsolidated subsidiaries and zero otherwise. STOCKOPT is a dummy
variable taking the value one if a firm reports stock option expenses and zero
otherwise. FAIR is a dummy variable taking the value one if a firm reports available for
sale and/or held for trading financial assets and zero otherwise. We predict an
incremental increase in the delay caused by the accounting changes firms are exposed
to. That is, we predict that all coefficients related to the dummy variables representing
accounting changes to be positive and significant. Finally, we add a variable indicating
whether it is before or after 2003. The reason is that after 2003 two new regulatory
requirements affecting all firms went into effect. First, the Sarbanes-Oxley Act of 2002,
which increased the burden of financial reporting from 2004 and onwards, went into
effect. Second, the SEC’s new filing requirement reducing the number of delays for

15
filing annual reports from 90 to 60 days also went into effect. Since it is impossible to
disentangle these events across treatment and non-treatment groups we only control
for this by including a dummy variable. Since these events are driving the delay in
financial reporting in opposite directions we do predict any direction of the coefficient.
4. SAMPLE SELECTION PROCESS
We extract firm-year data of U.S. listed companies from 1999 to 2009. By
analyzing data over this time period we corroborate our results with those of other
studies finding an increase in lead-time after the introduction of the Sarbanes-Oxley
Act 2002 (Krishnan and Yang 2009) and also extend prior research to 2009. All data
except market data are extracted from Worldscope. The market data used to create
the bid-asked spread variable was extracted from the CRSP database and the data
used to determine analyst following was extracted from I/B/E/S. As shown in Table 2
Panel A, we obtain a sample of 6,612 firms and 50,049 firm-year observations.9 After
excluding observations with missing data we obtain a final sample of 2,703 firms and
26,003 firm-year observations.
Table 2, Panel B offers information about the number of observations in the
treatment and non-treatment groups for each accounting regulation change. We
obtain a sample of 1,640 firm-year observations for the change in derivative
accounting; a sample of 3,081 firm-year observations for the new rules on how to
account for goodwill; 3,011 firm-year observations for the new disclosure rules about
off-balance sheet arrangements; 2,172 firm-year observations for the new rules
9 In order to control for potential outliers, we winsorize all continuous variables on the 1% level.

16
related to share-based compensation; and finally, 1,346 firm-year observations for the
change in fair value accounting.
<TABLE 2 ABOUT HERE>
5. RESULTS
Table 3 provides descriptive statistics of the variables representing
characteristics affecting the lead-time of financial reporting used in the propensity-
score matching model. Overall we find no significant difference across the two groups
after the introduction of each accounting regulatory change. However we do find a
larger increase in the delay after the introduction of accounting for derivatives and
hedges (SFAS 133 ) and the switch to the impairment only approach with respect to
goodwill (SFAS 141 and SFAS 142). We also find a monotonic increase in the delay of
financial reporting for each measure introduced, from 49 days after the introduction of
accounting for derivatives an hedges (SFAS 133 ) to almost 61days after the
introduction of accounting for share-based payments to employees (SFAS 123R). This is
also the case for firms that are not exposed to the new accounting complexity
measures but to a lesser degree. Interestingly though, the delay in financial reporting
follows the same trend with respect to the introduction of fair value levels disclosure
under SFAS 157. The natural log of days of delay is only 44 days compared to almost 61
days of delay after the disclosure requirements related to off balance sheet
arrangement (SEC Release No. 33-8182) which was introduced before the fair value
disclosure requirements. We believe that this is explained by the composition of the
sample drawn to examine the introduction of fair value disclosure. The number of
financial services companies is over-represented in the test of the effect on the delay

17
in financial reporting related to SFAS 157. There also seems to be significant
differences across the treatment and non-treatment groups with respect to the
independent variables in the matching model. In general, the treatment groups, with
the exception of the sample related to the effects of SFAS 157, seem to have a smaller
bid-asked spread, be less leveraged, and have a more widespread ownership structure.
<TABLE 3 ABOUT HERE>
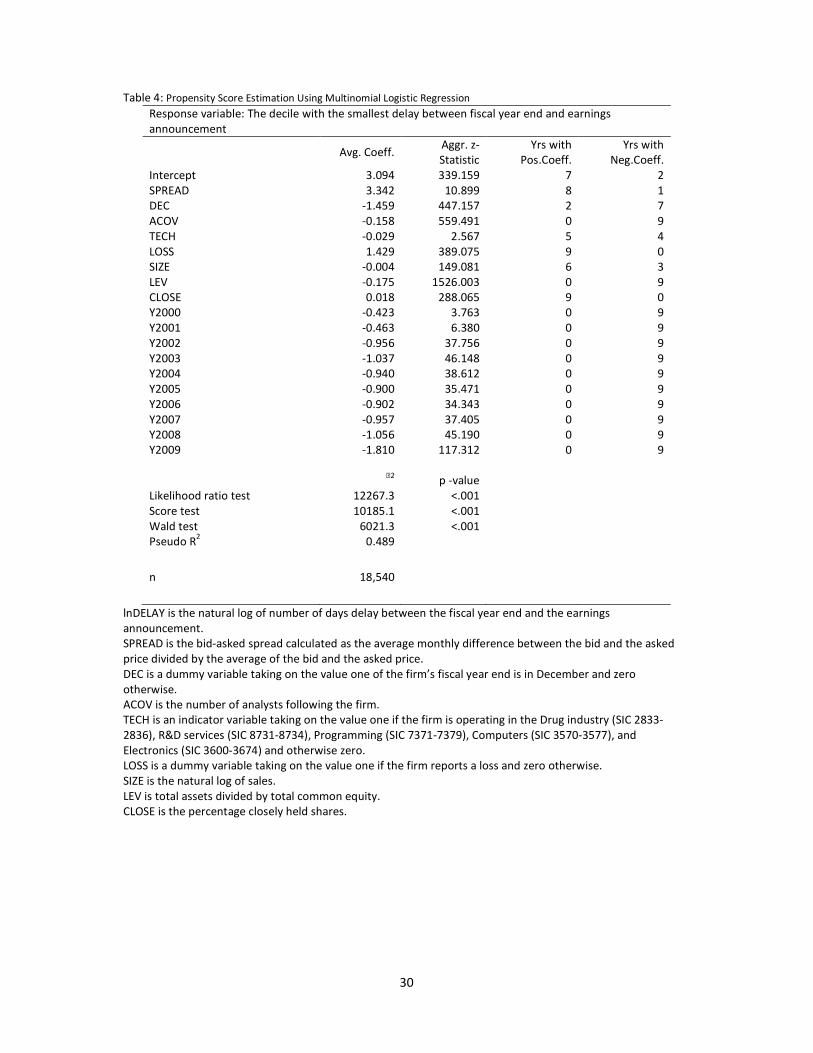
Table 4 presents results from the multinomial logit regressions. We divide lead-
time into deciles where 1 stands for the shortest lead time and 10 stands for longest
lead-time. For each independent variable, Table 4 compares the deciles 2-10 to the
decile with the shortest lead-time. Following Armstrong et al. (2010), we provide
average coefficient estimates and aggregated Z-statistics in Table 4. The first column
reports the average coefficient estimate across decile-specific estimation from the
second through the tenth decile. In Table 4, the second column reports an aggregate Z-
statistic, which is calculated as the sum of the individual decile Z-statistics divided by
the square root of the number of deciles over which equation (1) is estimated. The
final two columns report the number of years for which the year-specific coefficient is
positive and negative, respectively.
Table 4 shows that compared to the first decile, other deciles have a higher
SPREAD (mean coefficient 3.342), less analyst coverage (mean coefficient -0.158), are
less profitable (mean coefficient 1.429), smaller in size (average coefficient -0.004),
less leveraged (mean coefficient -0.175) and have higher percentage of closely-held
shares (mean coefficient 0.018).

18
<TABLE 4 ABOUT HERE>
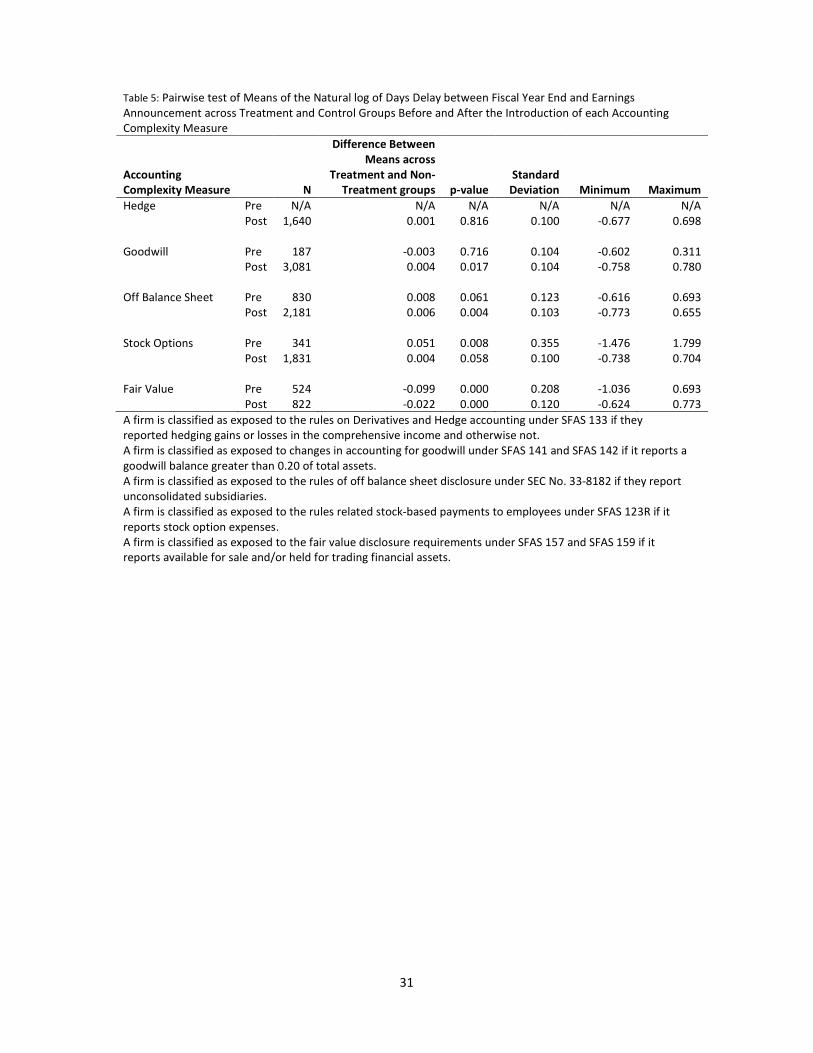
The pairwise comparison of the means of natural log of the lead-time is
presented in Table 5. Consistent with Table 4, we find a significant difference between
the treatment and the control group in the lead-time after the introduction of the
change in accounting for goodwill under SFAS 141 and SFAS 142, the increase in
required disclosure on off balance sheet activities under the SEC Release No. 33-8182,
and the changed accounting rules for stock-based compensation to employees under
SFAS 123R. We also find a longer lead-time for companies exposed to the change in
the standards related to derivatives and hedges (SFAS 133) compared to those that are
not, however, the difference is not significant. Finally, contrary to our prediction, we
find that companies exposed to changes related to SFAS 157 and SFAS 159 exhibit a
significantly shorter lead-time. We believe that this might be driven by the extreme
turmoil on the financial markets at the time these standards went into effect. That is,
investors and financial service firms affected by these standards knew that the value of
financial holdings decreased during this period and there was no reason to hold back
this information. On the contrary, since most firms were in the same situation, there
was an incentive to release the information faster rather than holding it back.
<TABLE 5 ABOUT HERE>
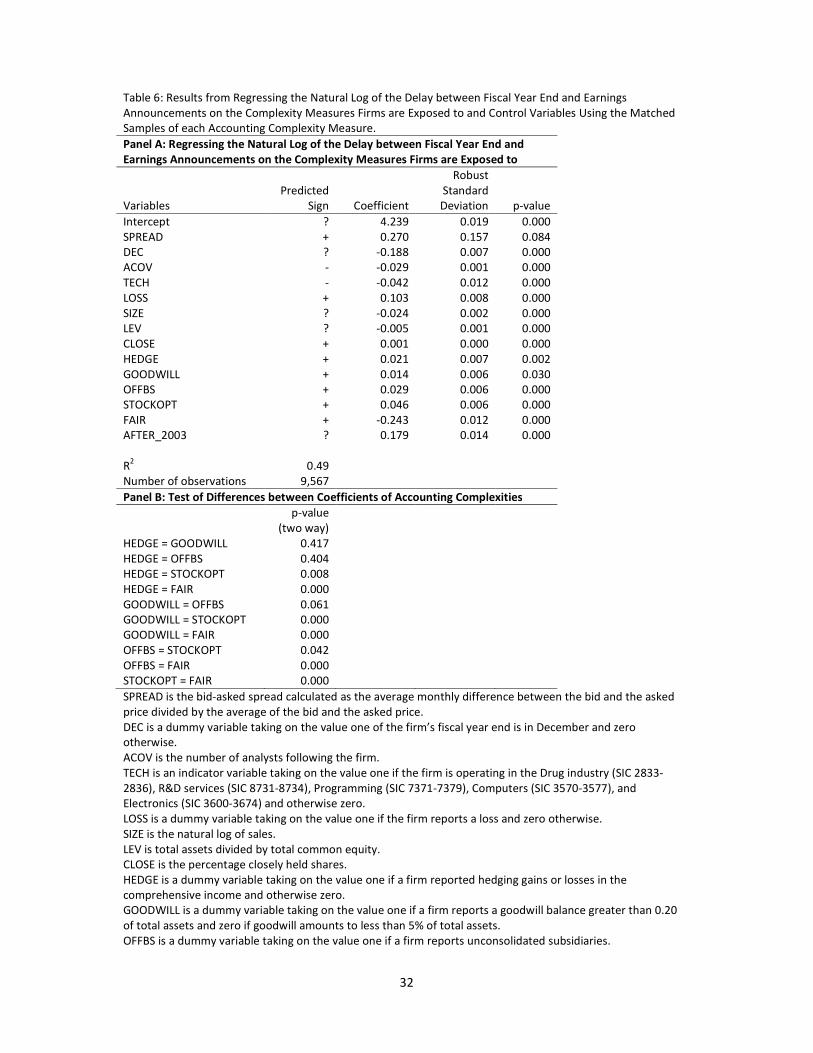
As shown in Table 6 Panel A, we also collapse all treatment and control
observations and regress the lead-time on all identified control variables and the

19
accounting changes.10
We find that all control variables are significant and taking on
the predicted direction. All the accounting changes are positive and significant
supporting our hypothesis that they are causing an increase in the lead-time, except
for the measure capturing the introduction of SFAS 157 and SFAS 159. Contrary to our
prediction, this variable is negative and significant. This concurs with our previous
findings as discussed above. We also find that the variable controlling for two
simultaneous events, AFTER_2003, is positive and significant at the 5% level suggesting
that the Sarbanes-Oxley 2002 Act takes precedence over the effects of the SEC
promulgated reduction in number of days allowed for filing annual reports. Panel B in
Table 6 shows tests of the difference in magnitudes between coefficients of each
accounting change. The coefficient of the variable capturing the introduction of SFAS
157 and SFAS 159 is significantly smaller than the other coefficients. We also find that
of all accounting complexities introduced during the period, the regulation related to
stock options seems to have caused the strongest increase in lead-time.
<TABLE 6 ABOUT HERE>
6. SENSITIVITY ANALYSIS
Using the combined samples drawn from the propensity-score matching
process, we also examine the effect on the lead-time of the accumulated accounting
changes firms are exposed to. We conduct this test by regressing the natural log of the
10
We run the estimation using a random GLS model and a robust regression with qualitatively the same
results.
20
lead-time on dummies representing the number of accounting changes firms are
exposed to.11
However, based on previous results we exclude the variable representing
exposure to SFAS 157 and SFAS 159 from this part of the analysis. As described in Table
7, Panel A, we find qualitatively similar results for all the identified control variables
except for the variable representing the bid-asked spread. The coefficient is still
positive, as predicted; however, it is no longer significant. As shown in Panel A in Table
7, the results suggest a monotonic increase in the lead-time for each additional
accounting change a firm is exposed to. The results of testing the incremental
differences between the different levels of accounting changes shown in Table 7, Panel
B, suggest that there is a significant difference in the lead-time between firms being
exposed to two compared to one additional accounting complexity (one-tailed p-value
0.006). There is a marginally significant increase between firms exposed to two
accounting complexities compared to three (one-tailed p-value 0.088). Overall the
difference between firms being exposed to one accounting complexity compared to
four is significant at the 5% level (one-tailed p-value 0.024).
<TABLE 7 ABOUT HERE>
7. CONCLUSION
We believe that there is reason to assume that the volume and the complexity
of new accounting standards, regulations and interpretations is causing a delay in the
release of financial reporting and thereby negatively impacting the relevance of
11
We run the estimation using a random GLS model and a robust regression with qualitatively the same
results.

21
financial reporting. Despite the fact that we did not find support for our prediction
related to the most recent addition to regulatory changes, namely the measurement
and disclosure of financial holdings under SFAS 157 and SFAS 159, we still find that
each of the regulatory changes between 2001 and 2009 have individually increased the
delay between fiscal year end and the earnings announcement date. We believe that it
is not possible to discern the effects of regulatory changes with respect to the
measurement and disclosure of financial holdings under SFAS 157 and SFAS 159 due to
the economic situation at the time these standards went into effect and we, therefore,
leave that to be examined by future research. In addition to our main results, we also
find that the accumulation of exposure to complex accounting changes causes a
monotonic increase in the lead-time. Our results suggest that the development of
accounting regulations towards a greater relevance by offering more information
indeed causes a decrease in financial reporting relevance by delaying the release of
information to investors.
REFERENCES
Armstrong, C.S., W.R. Guay, and J.P. Weber. (2010). ‘The role of information and financial
reporting in corporate governance and debt contracting.’ Journal of Accounting and
Economics, 50: 179-234.
Armstrong, C.S., A.D. Jagolinzer, and D.F. Larcker. (2010). ‘Chief Executive Officer Equity
Incentives and Accounting Irregularities.’ Journal of Accounting Research, 48: 225-
271.
Atiase, R. K. (1985). ‘Predisclosure Information, Firm Capitalization, and Security Price
Behavior around Earnings Announcements’. Journal of Accounting Research, 23(1):
21-36.
22
Atiase, R. K., Bamber, L. S. and Tse, S. (1989). ‘Timeliness of financial reporting, the firm size
effect, and stock price reactions to annual earnings announcements’. Contemporary
Accounting Research, 5(2): 526-552.
Ball, R. and Kothari, S. P. (1991). ‘Security Returns around Earnings Announcements’. The
Accounting Review, 66(4): 718-738.
Ball, R. and Shivakumar, L. (2005). ‘Earnings quality in UK private firms: comparative loss
recognition timeliness’. Journal of Accounting and Economics, 39: 83-128.
Ball, R. and Shivakumar, L. (2008). ‘How Much New Information Is There in Earnings?’.
Journal of Accounting Research, 46(5): 975-1016.
Barth, M., R. Kasznik, and M.F. McNichols. (2001). ‘Analyst Coverage and Intangible Assets.’
Journal of Accounting Research, 39, 1-34.
Bauman, M.P. (2003). ‘The Impact of Valuation of Off-Balance Sheet Activities Concealed by
Equity Method Accounting.’ Accounting Horizons, 17: 303-314.
Beatty, A. and Weber, J. (2006) ‘Accounting discretion in fair value estimates: An
examination of SFAS 142 goodwill impairments,’ Journal of Accounting Research, 44,
257-288.
Bushee, B.J., D.A. Matsumoto, G.S. Miller. (2003). ‘Open versus closed conference calls: the
determinants of effects of broadening access to disclosure.’ Journal of Accounting
and Economics 34: 149-180.
Bushee, B.J. and C.F. Noe. (2000). ‘Corporate Disclosure Practices, Institutional Investors, and
Stock Return Volatility.’ Journal of Accounting Research, 38(Supplement): 171-202.
Chambers, A. E. and Penman, S. H. (1984). ‘Timeliness of Reporting and the Stock Price
Reaction to Earnings Announcement’. Journal of Accounting Research, 22(1): 21-47.
Chordia, T., R. Roll, and A. Subrahmanyam. (2001). ‘Market Liquidity and Trading Activity.’
The Journal of Finance, LVI(2): 501-530.
Diamond, D. W. (1985). ‘Optimal Release of Information by Firms’. Journal of Finance, XL(4):
1071-1094.
Eierle, B. (2005). ‘Differential Reporting in Germany - A Historical Analysis’. Accounting,
Business & Financial History, 15(3): 279-315.
Eierle, B. and Schultze, W. (2009). ‘The Role of Management as a User of Accounting
Information: Implications for Standard Setting’. SSRN, Working Paper Series.

23
Ettredge, M., Richardson, V. J. and Scholz, S. (2002). ‘Timely Financial Reporting at Corporate
Web Sites?’. Communications of the ACM, 45(6), 67-71.
Ettredge, M. L., Li, C. and Sun, L. (2006). ‘The Impact of SOX Section 404 Internal Control
Quality Assessment on Audit Delay in the SOX Era’. Auditing: a Journal of Practice &
Theory, 25(2): 1-23.
Financial Accounting Standards Board (FASB) (1980). ‘Concepts Statement No. 2: Qualitative
Characteristics of Accounting Information’. (Issue Date 5/80).
Gilson, S. ‘Management Turnover and Financial Distress.’ Journal of Financial Economics 25
(1989): 241–62.
Givoly, D. and Palmon, D. (1982). ‘Timeliness of Annual Earnings Announcements: Some
Empirical Evidence’. The Accounting Review, 57(3): 486-508.
Han, J. C. Y. and Wild J. J. (1997). ‘Timeliness of Reporting and Earnings Information
Transfers’. Journal of Business Finance and Accounting, 24(3-4): 527-540.
Haw, I.-M., Park, K., Qi, D and Wu, W. (2003). ‘Audit qualification and timing of earnings
announcements: Evidence from China’. Auditing: a Journal of Practice & Theory,
22(2): 121-146.
Haw, I.-M., Qi, D. and Wu, W. (2000). ‘Timeliness of Annual Report Releases and Market
Reaction to Earnings Announcements in an Emerging Capital Market: The Case of
China’. Journal of International Financial Management and Accounting, 11(2): 108-
131.
Healy, P. M., A. Hutton, and Palepu, K. G. (1999). ‘Stock Performance and Intermediation
Changes Surrounding Increase in Disclosure.’ Contemporary Accounting Research, 16:
485-520.
Healy, P. M. and Wahlen, J. M. (1998). ‘A Review of the Earnings Management Literature and
Its Implications for Standard Setting’. SSRN, Working Paper Series.
Healy, P. M. and Palepu, K. G. (2001). ‘Information asymmetry, corporate disclosure, and the
capital markets: A review of the empirical disclosure literature’. Journal of Accounting
and Economics, 31(1-3): 405-440.
Kasznik, R. and Lev, B. (1995). ‘To Warn or Not to Warn: Management Disclosures in the Face
of an Earnings Surprise’. The Accounting Review, 70(1): 113-134.
Kothari, S. P., Shu, S. and Wysocki, P. (2009). ‘Do Managers Withhold Bad News?’ Journal of
Accounting Research, 47(1): 241-276.

24
Krishnan, J. and J.S. Yang. (2009). ‘Recent Trends in Audit Report and Earnings
Announcement Lags.’ Accounting Horizons, 23(3): 265-288.
Landsman, W.R., K.V. Peasnell, and C. Shakespeare. (2008). ‘Are Asset Securitizations Sales
or Loans?’ The Accounting Review. 83: 1251-1272.
Lang, M. H. and Lundholm, R. (1993). ‘Cross-sectional determinants of analyst ratings of
corporate disclosures’. Journal of Accounting Research, 31(2): 246-271.
Lang, M. H. and Lundholm, R. (1996). ‘Corporate Disclosure Policy and Analysts.’ The
Accounting Review, 71: 467-492.
Lang, M. H. and Lundholm, R. J. (2000). Voluntary Disclosure and Equity Offerings: Reducing
Information asymmetry or Hyping the Stock?’. Contemporary Accounting Research,
17(4): 623-662.
Lawrence, A., M. Minutti-Meza, and P. Zhang. (2011). ‘Can Big 4 versus Non-Big 4 Differences
in Audit-Quality Proxies Be Attributed to Client Characteristics?’ The Accounting
Review, 86: 259-286.
Lee, H.-Y., Mande, V. and Son, M. (2008). ‘A Comparison of Reporting Lags of Multinational
and Domestic Firms’. Journal of International Management and Accounting, 19(1):
28-56.
Lee, H.-Y. and Son, M. (2009). ‘Earnings Announcement Timing and Earnings Management’.
Applied Financial Economics, 19(4-6): 319-326.
Lev, B. and Zarowin, P. (1999). ‘The Boundaries of Financial Reporting and How to Extent
Them’. Journal of Accounting Research, 37(2): 353-385.
Leventis, S. and Weetman, P. (2004). ‘Timeliness of financial reporting: applicability of
disclosure theories in an emerging capital market’. Accounting and Business
Research, 34(1): 43-56.
Owusu-Ansah, S. (2000). ‘Timeliness of corporate financial reporting in emerging capital
markets: empirical evidence from the Zimbabwe Stock Exchange’. Accounting and
Business Research, 30(3): 241-254.
Owusu-Ansah, S. and Leventis, S. (2006). ‘Timeliness of Corporate Annual Financial Reporting
in Greece’. The European Accounting Review, 15(2): 273-287.
Palmrose, Z-V. (2009). ‘Science, politics, and Accounting: A View from the Potomac.’ The
Accounting Review, 84(2): 281-297.

25
Rosenbaum, P.R. and D.B. Rubin. (1985). ‘Constructing a Control Group Using Multivariate
Matched Sampling Models that Incorporate the Propensity Score.’ American
Statistician 339(1): 33-38.
Schwartz, K. B. and Soo, B. S. (1996). ‘The Association between Auditor Changes and
Reporting Lags’. Contemporary Accounting Research, 13(1): 353-370.
Sengupta, P. (2004). ‘Disclosure Timing: Determinants of quarterly earnings release dates’.
Journal of Accounting and Public Policy, 23: 457-482.
Skinner, D. J. (1994). ‘Why Firms Voluntarily Disclose Bad News?’. Journal of Accounting
Research, 32(1): 38-60.
Skinner, D. J. (1997). ‘Earnings Disclosures and Stockholder Lawsuits’. Journal of Accounting
and Economics, 23(3): 249-283.
Verrecchia, R. (1983). ‘Discretionary disclosure’. Journal of Accounting and Economics, 5:
365-380.
Verrecchia, R. (2001). ‘Essays on Disclosure’. Journal of Accounting and Economics, 32(1-3):
97-180.

26
Table 1: Major Additions to Accounting Complexity between 1999 and 2009
Accounting Standards Implications Effective Date
SFAS 133: Accounting for Derivative
Instruments and Hedging Activities
Promulgates that all derivatives
(either assets or liabilities) are
recognized at fair value
June 15, 2000
SFAS 138: Accounting for Certain Derivative
Instruments and Certain Hedging Activities
Regulates hedge accounting for
foreign currency cash flow hedges.
June 15, 2000
SFAS 141: Business Combinations and SFAS
142: Goodwill and Other Intangible Assets
Promulgated the abandonment of
amortization of goodwill and the
adoption of an impairment test only
approach. This approach requires
impairment tests down to the
smallest discernable cash generating
unit on a regular.
June 30, 2001
SEC Release No. 33-8182 Final Rule:
Management’s Discussion and Analysis
about Off-Balance Sheet Arrangements and
Aggregate Contractual Obligations
Furthermore, in 2003 the SEC issued
two new rules related to further
disclosure requirements in the
Management’s Discussion and
Analysis section in the annual Form
10-K on off-balance sheet
arrangements and contracts
April 7, 2003
The Sarbanes-Oxley Act of 2002 Section 404 Requires disclosures about the status
of the internal control system’s
ability to curb reporting errors
and/or earnings management.
July 30, 2002
SEC Release No. 33-8238 Final Rule:
Management’s Reports on Internal Control
over Financial Reporting and Certification
of Disclosure in Exchange Act Periodic
Reports
Further disclosure on internal control
in Exchange Act Periodic Reports.
August 14, 2003
The SFAS 123R: Accounting for Stock-Based
Compensation
The standard mandates income
statement recognition of share-
based payments to employees.
January 1, 2006
SFAS 157: Fair Value Measurements. Requires disclosure of fair value
holdings by category (Level 1 – mark-
to-market price, Level 2 – mark-to-
model price, and Level 3 –
estimations of future cash flows) and
reconcile movements in and out of
Level 3.
November 15, 2007
SFAS 159: The Fair Value Option for
Financial Assets and Financial Liabilities Provides an option to value financial
assets and financial liabilities even if
it is not required under SFAS 157.
November 15, 2007

27
Table 2: Sample Selection Process
Panel A: Total number of observation
Number of firms
Number of firm-year
observations
Total sample extracted from Worldscope 6,612 50,049
Missing observations -3,909 -24,046
Total 2,703 26,003
Panel B: Number of Observations in the Matched Sample
Before and After Implementation of Complexity
Number of firm-year observations
Before Hedge Accounting N/A
After Hedge Accounting (2002-2009) 1,640
Total N/A
Before Goodwill Accounting Change (1999-2001) 187
After Goodwill Accounting Change (2002-2009) 3,081
Total 3,268
Before Requirements of Increased Disclosure on Off-Balance Sheet Arrangements (2003-2005) 830
After Requirements of Increased Disclosure on Off-Balance Sheet Arrangements (2004-2009) 2,181
Total 3,011
Before Requirements of Recognition of Share-Based Payments to Employees (2003-2005) 341
After Requirements of Recognition of Share-Based Payments to Employees (2006-2009) 1,831
Total 2,172
Before Requirements of Disclosure of by Fair Value Categories of Financial Holdings (2005-2007) 822
After Requirements of Disclosure of by Fair Value Categories of Financial Holdings (2008-2009) 524
Total 1,346

28
Table 3: descriptive statistics of Variables Used in the Propensity Score Matching Estimation by Accounting Complexity Measure
Hedge
Mean
Non-
Hedge
Mean
Diff
Goodwill
Mean
Non-
Goodwill
Mean.
Diff
Off
Balance
Sheet
Non-Off
Balance
Sheet
Diff
Stock
Options
Non-Stock
Options
Diff
Fair Value
Non-Fair
Value
Diff
lnDELAY Pre N/A N/A N/A 3.692 3.695 -0.003 3.740 3.732 0.008 4.040 4.038 0.001 3.277 3.376 -0.099***
Post 3.891 3.890 0.001 3.979 3.974 0.004 3.963 3.957 0.006 4.108 4.104 0.004 3.789 3.811 -0.022
Diff N/A N/A -0.286***
-0.279***
-0.223***
-0.225***
-0.069***
-0.065***
-0.512***
-0.435***
SPREAD Pre N/A N/A N/A 0.025 0.022 0.003 0.009 0.011 -0.003***
0.008 0.008 0.000 0.010 0.002 0.007***
Post 0.003 0.006 -0.002***
0.006 0.008 -0.002***
0.004 0.007 -0.003***
0.009 0.012 -0.003***
0.025 0.006 0.019***
Diff N/A N/A 0.019***
0.014***
0.005***
0.004***
-0.002 -0.004**
-0.016***
-0.004***
DEC Pre N/A N/A N/A 0.989 0.989 0.000 0.810 0.841 -0.031* 0.774 0.672 0.103
*** 0.939 0.955 -0.016
Post 0.753 0.793 -0.040***
0.687 0.741 -0.054***
0.754 0.754 0.000 0.736 0.679 0.056***
0.910 0.868 0.042**
Diff N/A N/A 0.302***
0.248***
0.055***
0.087***
0.039 -0.008 0.029**
0.087***
ACOV Pre N/A N/A N/A 7.412 6.118 1.294**
7.195 6.636 0.559 4.874 4.202 0.672 4.373 11.276 -6.903***
Post 6.231 6.701 -0.470 4.872 4.634 0.239 5.719 5.742 -0.022 3.633 3.053 0.581***
1.998 4.513 -2.515***
Diff N/A N/A 2.539***
1.484***
1.476***
0.894***
1.240***
1.149**
2.375***
6.763***
TECH Pre N/A N/A N/A 0.075 0.032 0.043* 0.010 0.059 -0.049
*** 0.103 0.047 0.056
*** N/A 0.061 N/A
Post 0.034 0.055 -0.022***
0.073 0.040 0.033***
0.012 0.058 -0.046***
0.111 0.037 0.737***
N/A 0.052 N/A
Diff N/A N/A 0.002 -0.008 -0.002 0.001 -0.008 0.010 N/A 0.009
LOSS Pre N/A N/A N/A 0.219 0.214 0.005 0.181 0.173 0.007 0.560 0.252 0.308***
0.029 0.083 -0.054***
Post 0.093 0.160 -0.068***
0.128 0.207 -0.080***
0.156 0.171 -0.015 0.412 0.227 0.185***
0.307 0.162 0.145***
Diff N/A N/A 0.092***
0.007 0.025* 0.002 0.148
*** 0.026 -0.278
*** -0.079
***
SIZE Pre N/A N/A N/A 6.470 5.521 0.949***
6.779 5.887 0.891***
3.850 5.620 -1.771***
4.979 7.321 -2.343***
Post 7.723 6.834 0.889***
6.650 5.848 0.802***
7.013 6.204 0.810***
4.779 6.231 -1.452***
5.127 7.378 -2.251***
Diff N/A N/A -0.180 -0.327* -0.235
*** -0.316
*** -0.929
*** -0.610 -0.148
* -0.056
LEV Pre N/A N/A N/A 2.656 4.518 -1.861***
3.223 4.109 -0.886***
2.116 3.015 -0.899**
11.541 3.187 8.534***
Post 3.770 4.403 -0.633***
2.464 3.906 -1.442***
3.306 3.548 -0.242* 1.951 3.606 -1.656
*** 12.805 3.590 9.215
***
Diff N/A N/A 0.192 0.611 -0.083 0.561***
0.166 -0.591**
-1.234***
-0.402
CLOSE Pre N/A N/A N/A 23.961 23.113 0.848 20.604 24.838 -4.234**
22.772 46.465 -23.693***
17.924 17.551 0.373
Post 16.478 20.125 -3.547***
23.320 23.094 0.226 20.930 22.276 -1.346 24.867 29.793 -4.926***
20.429 17.890 2.539
Diff N/A N/A 0.641 0.019 -0.326 2.561 -2.095 16.672***
-2.505 -0.339

29
A firm is classified as exposed to the rules on Derivatives and Hedge accounting under SFAS 133 if they reported hedging gains or losses in the comprehensive income and
otherwise not.
A firm is classified as exposed to changes in accounting for goodwill under SFAS 141 and SFAS 142 if it reports a goodwill balance greater than 0.2 of total assets.
A firm is classified as exposed to the rules of off balance sheet disclosure under SEC No. 33-8182 if they report unconsolidated subsidiaries.
A firm is classified as exposed to the rules related stock-based payments to employees under SFAS 123R if it reports stock option expenses.
A firm is classified as exposed to the fair value disclosure requirements under SFAS 157 and SFAS 159 if it reports available for sale and/or held for trading financial assets.
lnDELAY is the natural log of number of days delay between the fiscal year end and the earnings announcement.
SPREAD is the bid-asked spread calculated as the average monthly difference between the bid and the asked price divided by the average of the bid and the asked price.
DEC is a dummy variable taking on the value one of the firm’s fiscal year end is in December and zero otherwise.
ACOV is the number of analysts following the firm.
TECH is an indicator variable taking on the value one if the firm is operating in the Drug industry (SIC 2833-2836), R&D services (SIC 8731-8734), Programming (SIC 7371-
7379), Computers (SIC 3570-3577), and Electronics (SIC 3600-3674) and otherwise zero.
LOSS is a dummy variable taking on the value one if the firm reports a loss and zero otherwise.
SIZE is the natural log of sales.
LEV is total assets divided by total common equity.
CLOSE is the percentage closely held shares.
30
Table 4: Propensity Score Estimation Using Multinomial Logistic Regression
Response variable: The decile with the smallest delay between fiscal year end and earnings
announcement
Avg. Coeff. Aggr. z-
Statistic
Yrs with
Pos.Coeff.
Yrs with
Neg.Coeff.
Intercept 3.094 339.159 7 2
SPREAD 3.342 10.899 8 1
DEC -1.459 447.157 2 7
ACOV -0.158 559.491 0 9
TECH -0.029 2.567 5 4
LOSS 1.429 389.075 9 0
SIZE -0.004 149.081 6 3
LEV -0.175 1526.003 0 9
CLOSE 0.018 288.065 9 0
Y2000 -0.423 3.763 0 9
Y2001 -0.463 6.380 0 9
Y2002 -0.956 37.756 0 9
Y2003 -1.037 46.148 0 9
Y2004 -0.940 38.612 0 9
Y2005 -0.900 35.471 0 9
Y2006 -0.902 34.343 0 9
Y2007 -0.957 37.405 0 9
Y2008 -1.056 45.190 0 9
Y2009 -1.810 117.312 0 9
2
p -value
Likelihood ratio test 12267.3 <.001
Score test 10185.1 <.001
Wald test 6021.3 <.001
Pseudo R2
0.489
n 18,540
lnDELAY is the natural log of number of days delay between the fiscal year end and the earnings
announcement.
SPREAD is the bid-asked spread calculated as the average monthly difference between the bid and the asked
price divided by the average of the bid and the asked price.
DEC is a dummy variable taking on the value one of the firm’s fiscal year end is in December and zero
otherwise.
ACOV is the number of analysts following the firm.
TECH is an indicator variable taking on the value one if the firm is operating in the Drug industry (SIC 2833-
2836), R&D services (SIC 8731-8734), Programming (SIC 7371-7379), Computers (SIC 3570-3577), and
Electronics (SIC 3600-3674) and otherwise zero.
LOSS is a dummy variable taking on the value one if the firm reports a loss and zero otherwise.
SIZE is the natural log of sales.
LEV is total assets divided by total common equity.
CLOSE is the percentage closely held shares.
31
Table 5: Pairwise test of Means of the Natural log of Days Delay between Fiscal Year End and Earnings
Announcement across Treatment and Control Groups Before and After the Introduction of each Accounting
Complexity Measure
Accounting
Complexity Measure
N
Difference Between
Means across
Treatment and Non-
Treatment groups
p-value
Standard
Deviation
Minimum
Maximum
Hedge Pre N/A N/A N/A N/A N/A N/A
Post 1,640 0.001 0.816 0.100 -0.677 0.698
Goodwill Pre 187 -0.003 0.716 0.104 -0.602 0.311
Post 3,081 0.004 0.017 0.104 -0.758 0.780
Off Balance Sheet Pre 830 0.008 0.061 0.123 -0.616 0.693
Post 2,181 0.006 0.004 0.103 -0.773 0.655
Stock Options Pre 341 0.051 0.008 0.355 -1.476 1.799
Post 1,831 0.004 0.058 0.100 -0.738 0.704
Fair Value Pre 524 -0.099 0.000 0.208 -1.036 0.693
Post 822 -0.022 0.000 0.120 -0.624 0.773
A firm is classified as exposed to the rules on Derivatives and Hedge accounting under SFAS 133 if they
reported hedging gains or losses in the comprehensive income and otherwise not.
A firm is classified as exposed to changes in accounting for goodwill under SFAS 141 and SFAS 142 if it reports a
goodwill balance greater than 0.20 of total assets.
A firm is classified as exposed to the rules of off balance sheet disclosure under SEC No. 33-8182 if they report
unconsolidated subsidiaries.
A firm is classified as exposed to the rules related stock-based payments to employees under SFAS 123R if it
reports stock option expenses.
A firm is classified as exposed to the fair value disclosure requirements under SFAS 157 and SFAS 159 if it
reports available for sale and/or held for trading financial assets.
32
Table 6: Results from Regressing the Natural Log of the Delay between Fiscal Year End and Earnings
Announcements on the Complexity Measures Firms are Exposed to and Control Variables Using the Matched
Samples of each Accounting Complexity Measure.
Panel A: Regressing the Natural Log of the Delay between Fiscal Year End and
Earnings Announcements on the Complexity Measures Firms are Exposed to
Variables
Predicted
Sign
Coefficient
Robust
Standard
Deviation
p-value
Intercept ? 4.239 0.019 0.000
SPREAD + 0.270 0.157 0.084
DEC ? -0.188 0.007 0.000
ACOV - -0.029 0.001 0.000
TECH - -0.042 0.012 0.000
LOSS + 0.103 0.008 0.000
SIZE ? -0.024 0.002 0.000
LEV ? -0.005 0.001 0.000
CLOSE + 0.001 0.000 0.000
HEDGE + 0.021 0.007 0.002
GOODWILL + 0.014 0.006 0.030
OFFBS + 0.029 0.006 0.000
STOCKOPT + 0.046 0.006 0.000
FAIR + -0.243 0.012 0.000
AFTER_2003 ? 0.179 0.014 0.000
R2 0.49
Number of observations 9,567
Panel B: Test of Differences between Coefficients of Accounting Complexities
p-value
(two way)
HEDGE = GOODWILL 0.417
HEDGE = OFFBS 0.404
HEDGE = STOCKOPT 0.008
HEDGE = FAIR 0.000
GOODWILL = OFFBS 0.061
GOODWILL = STOCKOPT 0.000
GOODWILL = FAIR 0.000
OFFBS = STOCKOPT 0.042
OFFBS = FAIR 0.000
STOCKOPT = FAIR 0.000
SPREAD is the bid-asked spread calculated as the average monthly difference between the bid and the asked
price divided by the average of the bid and the asked price.
DEC is a dummy variable taking on the value one of the firm’s fiscal year end is in December and zero
otherwise.
ACOV is the number of analysts following the firm.
TECH is an indicator variable taking on the value one if the firm is operating in the Drug industry (SIC 2833-
2836), R&D services (SIC 8731-8734), Programming (SIC 7371-7379), Computers (SIC 3570-3577), and
Electronics (SIC 3600-3674) and otherwise zero.
LOSS is a dummy variable taking on the value one if the firm reports a loss and zero otherwise.
SIZE is the natural log of sales.
LEV is total assets divided by total common equity.
CLOSE is the percentage closely held shares.
HEDGE is a dummy variable taking on the value one if a firm reported hedging gains or losses in the
comprehensive income and otherwise zero.
GOODWILL is a dummy variable taking on the value one if a firm reports a goodwill balance greater than 0.20
of total assets and zero if goodwill amounts to less than 5% of total assets.
OFFBS is a dummy variable taking on the value one if a firm reports unconsolidated subsidiaries.

33
STOCKOPT is a dummy variable taking the value one if a firm reports stock option expenses and otherwise zero.
FAIR is a dummy variable taking the value one if a firm reports available for sale and/or held for trading
financial assets and otherwise zero.
AFTER_2003 is a dummy variable taking on the value one if the observation is from after 2003 or later and
otherwise zero.

34
Table 7: Results from Regressing the Natural Log of the Delay between Fiscal Year End and Earnings
Announcements on the Number of Complexity Measures Firms are Exposed to (excluding SFAS 157 Fair Value)
and Control Variables Using the Matched Samples of each Accounting Complexity Measure.
Panel A: from Regressing the Natural Log of the Delay between Fiscal Year End
and Earnings Announcements on the Number of Complexity Measures Firms are
Exposed to
Variables
Predicted
Sign
Coefficient
Robust
Standard
Deviation
p-value
Intercept ? 3.957 0.032 0.000
SPREAD + 0.142 0.163 0.383
DEC ? -0.205 0.007 0.000
ACOV - -0.028 0.001 0.000
TECH - -0.045 0.012 0.000
LOSS + 0.102 0.009 0.000
SIZE ? -0.028 0.002 0.000
LEV ? -0.008 0.001 0.000
CLOSE + 0.001 0.000 0.000
COMPLEX1 + 0.336 0.025 0.000
COMPLEX2 + 0.353 0.026 0.000
COMPLEX3 + 0.365 0.026 0.000
COMPLEX4 + 0.372 0.030 0.000
AFTER_2003 ? 0.182 0.014 0.000
R2 0.47
Number of observations 9,567
Panel B: Test of Differences between Coefficients
p-value
(one way)
COMPLEX1 < COMPLEX2 0.006
COMPLEX2 < COMPLEX3 0.088
COMPLEX3 < COMPLEX4 0.360
COMPLEX1 < COMPLEX4 0.024
SPREAD is the bid-asked spread calculated as the average monthly difference between the bid and the asked
price divided by the average of the bid and the asked price.
DEC is a dummy variable taking on the value one of the firm’s fiscal year end is in December and zero
otherwise.
ACOV is the number of analysts following the firm.
TECH is an indicator variable taking on the value one if the firm is operating in the Drug industry (SIC 2833-
2836), R&D services (SIC 8731-8734), Programming (SIC 7371-7379), Computers (SIC 3570-3577), and
Electronics (SIC 3600-3674) and otherwise zero.
LOSS is a dummy variable taking on the value one if the firm reports a loss and zero otherwise.
SIZE is the natural log of sales.
LEV is total assets divided by total common equity.
CLOSE is the percentage closely held shares.
COMPLEX1 is a dummy variable taking the value one if a firm-year observation is exposed to one accounting
complexity measure and zero otherwise.
COMPLEX2 is a dummy variable taking the value one if a firm-year observation is exposed to two accounting
complexity measures and zero otherwise.
COMPLEX3 is a dummy variable taking the value one if a firm-year observation is exposed to three accounting
complexity measures and zero otherwise.
COMPLEX4 is a dummy variable taking the value one if a firm-year observation is exposed to four accounting
complexity measures and zero otherwise.