accounting complexity and misreporting: manipulation … .pdf · accounting complexity and...
TRANSCRIPT
Accounting Complexity and Misreporting: Manipulation or Mistake?
Kyle PetersonStephen M. Ross School of Business
University of Michigan Phone: (734) 615-9210
Email: [email protected]
Current version: February 2008
Abstract I explore the effect of accounting complexity on misreporting using a setting of revenue restatements. I measure revenue recognition complexity using a factor score based on the number of words and revenue recognition methods from the revenue recognition disclosure in the 10-K just prior to the restatement announcement. Results are consistent with revenue recognition complexity increasing the probability of revenue restatements, after controlling for other determinants of misreporting revenue. These results are significant both statistically and economically and are robust to a number of different specifications. I also test whether misreporting for complex revenue recognition firms is the result of mistakes or manipulation. My tests provide no evidence consistent with complex revenue recognition being associated with manipulating revenue. However, there is evidence that firms that restate revenue and have more complex revenue recognition are less likely to receive an AAER from the SEC and have less negative restatement announcement returns than firms with less complex revenue recognition, suggesting mistakes are more likely for more complex firms.
This paper is based on my dissertation. I appreciate the guidance and advice of my dissertation committee
members: Michelle Hanlon (Chair), Russell Lundholm, Ilia Dichev, and Dana Muir. The helpful comments of K. Ramesh, Jeff Wilks, Cathy Shakespeare, Lian Fen Lee, Chad Larson, Judson Caskey, Peter Demerjian and University of Michigan workshop participants are also gratefully acknowledged. The Paton Fund, the Ross School of Business, and Leabo Fellowship provided financial support.

1. Introduction Regulators’ recent concern about complexity in financial reporting is predicated on the
belief that this complexity is costly to the financial markets. In regards to one particular cost, in
December 2005 both Chairman Cox of the Securities and Exchange Commission (SEC) and
Chairman Herz of the Financial Accounting Standards Board (FASB) suggested complex
accounting and reporting was a major contributor to the increase in financial statement
misreporting (Cox, 2005 and Herz, 2005). I investigate the effect of accounting complexity on
financial statement misreporting, a question largely unexplored in the academic literature. I use
revenue recognition as a setting to investigate this effect for three reasons. First, revenue
recognition is a universal accounting issue that affects many, if not all, firms. In addition, prior
research shows that revenue misreporting is a common type of restatement (Palmrose et al.,
2004; GAO, 2002 and 2006), ensuring I can obtain a sufficiently large sample to test the effects
of complexity on misreporting. Finally, anecdotal evidence suggests that revenue recognition
can be complex for firms (Sondhi and Taub, 2006; Herz, 2007; Turner, 2001).
I define accounting complexity as the amount of uncertainty related to the mapping of
transactions (or potential transactions) and standards into financial statements.1 This definition
incorporates complexity relevant to both preparers and users of financial statements. The
uncertainty could result from unpredictable business environments, imperfect standards, or
imperfect information about transactions. I conjecture that a description of the revenue
recognition process captures aspects of this uncertainty. Therefore, I measure accounting
complexity as it relates to revenue recognition using a factor score based on the number of words
and number of revenue recognition methods from the firm’s revenue recognition disclosure.
1 Prior literature has not developed a formal definition of accounting complexity. While the SEC has been consistent in their discussion of complexity in SEC speeches and testimony, to my knowledge they have yet to formally define the concept.
1
There are two competing (although not exclusive) theories about how accounting
complexity might affect financial misreporting. The ‘mistake theory’, adapted from Dechow and
Dichev (2002), argues that complexity causes managers to make more mistakes or errors in
judgment. When accounting is complex, managers are more likely to err when applying
standards to transactions, increasing the likelihood of misreporting due to mistakes. The
‘manipulation theory’ argues that managers take advantage of complex accounting to manipulate
the financial statements. For example, prior research suggests that investors do not fully
understand information found in pension footnotes, and that managers manage earnings through
complex pension accounting (Picconi, 2004; Bergstresser et al., 2006). Therefore, the
manipulation theory suggests complex accounting provides managers an opportunity to manage
the financial statements more easily.
Applying these theories to revenue, both theories suggest that revenue recognition
complexity likely increases the propensity to misreport revenue. Assuming the probability of
detection is similar across theories, I hypothesize that revenue recognition complexity increases
the likelihood of revenue restatements. I then attempt to distinguish between the mistake theory
and manipulation theory. The distinguishing feature between the two theories hinges on
management’s intent. I attempt to infer intent by testing certain attributes of the misreporting:
(1) whether the misreporting caused the firm to meet a revenue benchmark, (2) whether the
misreporting was an overstatement of revenue, and (3) whether the misreporting included
multiple areas of the financial statements. To further test for intent, I examine the consequences
of restating. Prior research provides evidence that misreporting costs are more severe if
information related to the restatement calls into question the integrity of management (see
Palmrose et al., 2004 and Hribar and Jenkins, 2004). Therefore, conditional on misreporting, the
consequences of restatement should be more severe for intentional manipulation than for
2
unintentional mistakes. An association between revenue recognition complexity and the
consequences of misreporting provides an indication of intentional misreporting for more
complex firms. I examine three consequences associated with the restatement: (1) the likelihood
of an SEC Accounting and Auditing Enforcement Release (AAER), (2) the restatement
announcement returns, and (3) CEO turnover following the restatement.
I test my hypotheses on a sample of 1,188 accounting restatements from 1997-2005
identified by the Government Accountability Office (GAO) in their 2002 and 2006 reports to
Congress on accounting restatements. I compare firms restating revenue to firms that do not
restate revenue, but restate other items. I use these other restatement firms for comparison
principally because it provides an inherent control for determinants of restatement in general. I
estimate a logistic regression model to test whether revenue recognition complexity increases the
likelihood of a revenue restatement compared to other types of restatements, controlling for other
determinants from prior literature. Logistic regression results provide evidence that firms with
complex revenue recognition are more likely to restate revenue. A one standard deviation
increase in revenue recognition complexity centered on the mean increases the probability of
revenue misreporting by 8.8 percent. Relative to other determinants in the model, this marginal
effect suggests complexity is one of the most important determinants of revenue restatements.
I then examine whether complex revenue recognition for firms that misreport revenue is
associated with restatement attributes that suggest manipulation (missing benchmarks,
overstatements, and restating multiple items). Results from these tests do not differentiate
between the mistake and manipulation theories for complex revenue recognition firms.
However, tests that examine the consequences of misreporting provide evidence more consistent
with the mistake theory. Regression results show that, given a revenue restatement, firms with
more complex revenue recognition are less likely to receive an AAER and have less negative
3
restatement announcement returns. However, the results show that revenue recognition
complexity is not associated with CEO turnover, suggesting that boards may not distinguish
between mistakes and manipulation in determining CEO departure when restatements occur. In
sum, my results provide evidence that accounting complexity increases the probability of
restatement in the case of revenue. While there is no evidence consistent with the manipulation
theory, I do provide some evidence consistent with the mistake theory.
In additional analysis, I also perform a number of robustness checks. These include using
alternative measures of revenue recognition complexity, using alternative research designs, and
controlling for changes in the revenue recognition disclosure environment. These additional
tests provide results that are generally consistent with those presented in the main analysis.
This study contributes to the literature in several ways. First, I present evidence that
complex accounting increases the occurrence of misreporting, and most importantly, show that
the magnitude of that effect is significant. Second, prior research (e.g. Bergstresser et al., 2006)
suggests that complexity is typically associated with earnings management or manipulation;
however, I find no evidence of an association between accounting complexity and manipulation
in this setting of revenue recognition. Third, I provide a definition of accounting complexity and
an associated empirical measure that can be applied in future research. These results should be
informative to both the SEC and FASB as they attempt to reduce complexity in financial
reporting, including revising revenue recognition standards in the near future.2 This research
2 Both the SEC and FASB have taken steps to address complexity. On June 27, 2007, the SEC announced the establishment of an advisory committee with a goal of reducing unnecessary complexity in financial reporting and making information more useful and understandable for investors. The FASB is readdressing specific accounting standards that are overly complex and has initiated an effort to develop an integrated codification of all existing accounting literature that would be available electronically. In February, 2007 Congress voted unanimously to require the SEC, PCAOB and FASB to report yearly on their efforts to reduce complexity in financial reporting (H.R. 755).
4
should also be useful to investors, auditors, and firms to better understand the causes and
consequences of revenue restatements.
The rest of the paper is outlined as follows. In the next section, I define accounting
complexity and discuss the effect of complexity on misreporting. Section 3 discusses the
empirical setting and develops my hypotheses. Section 4 discusses the sample, data, and
empirical design. Results are presented in Section 5, with some additional analysis in Section 6.
Section 7 concludes.
2. Accounting Complexity
2.1 Accounting Complexity Defined
To my knowledge, no formal definition of accounting complexity exists in the literature.3
I define accounting complexity as the amount of uncertainty related to the mapping of
transactions or potential transactions and standards into the financial statements.4 This definition
is intended to apply to both preparers and users of financial statements, and views accounting
complexity as a scale or relation. I next discuss a few key points related to this definition to give
some context.
Accounting is the confluence of transactions or potential transactions and standards.
Preparers must take information about the firm’s transactions and guidance from standards and
map the two to determine the appropriate accounting. Users must also understand the mapping
3 Prior research has examined firm or organization complexity (see Bushman et al. 2004), information complexity (see Plumlee, 2003), and information overload (see Schick et al., 1990 for a review), concepts not wholly unrelated to accounting complexity. I also recognize other definitions of accounting complexity likely exist; however, none has been explicitly stated. 4 I believe this definition is in line with Congress’ and the SEC’s recent characterization of complexity, which encompasses both complexity as it relates to disclosure (which affects users) and standards (which affects users and preparers). For example, H.R. 755 enacted by Congress in February 2007, identifies 5 major areas that the SEC, PCAOB, and FASB need to address, encompassing both disclosure and standards issues. These are (1) reassessing complex and outdated accounting standards; (2) improving the understandability, consistency, and overall usability of the existing accounting and auditing literature; (3) developing principles-based accounting standards; (4) encouraging the use and acceptance of interactive data; and (5) promoting disclosures in ‘plain English’.
5
to interpret financial statements correctly. In many cases, this mapping is very straightforward,
leading to a single, generally accepted and understood accounting choice. In other cases, there is
uncertainty in the mapping, which can lead to potentially conflicting or erroneous accounting
choices by preparers. Uncertainty also affects users since they must interpret how the mapping
was performed based on limited disclosures. While some sources of uncertainty can be mutual
for both preparers and users, uncertainty can also differ across preparers and users of financial
statements. In some cases the mapping may be quite clear to preparers and auditors; however,
uncertainty about the same transactions and standards can make accounting “appear” complex to
users.5 Increased transparency or disclosure can alleviate some uncertainty for users in terms of
how the mapping is performed by preparers. However, increased transparency does not remove
uncertainty regarding how the mapping should be performed by preparers.
Uncertainty in applying standards to transactions could come from many sources.6 First,
uncertainty could be the result of business environments that are not perfectly predictable. While
accounting standards could require certainty of outcomes before recognition in the financial
statements, most standards incorporate some aspect of this uncertainty, requiring managers to
make estimates and judgments. Uncertainty could also result from flawed standards or deficient
information about transactions. Unclear or ambiguous wording, inconsistencies across
standards, or detailed rules-based standards can all cause uncertainty related to the standards.7
Uncertainty could also stem from deficient information about transactions or contracts. 5 While preparers and auditors are required to have some level of accounting expertise, there are no such requirements for investors. The FASB’s SFAC 1 paragraph 36 acknowledges that users’ understanding of financial information “may vary greatly”, and that financial reporting should be accessible “to all—nonprofessionals as well as professionals—who are willing to learn to use it properly” (FASB, 1978). 6 I provide a discussion on the potential sources of uncertainty to facilitate understanding, but my tests do not allow me to distinguish between the sources of uncertainty. However, understanding the precise causes of uncertainty may be important to regulators interested in eliminating avoidable sources of uncertainty. 7 There is much discussion in the accounting literature on rules- v. principles-based accounting standards. While the intent of rules-based standards may be to remove uncertainty in the accounting, they can increase accounting complexity for users because of their inability to encompass all potential situations or their ability to obscure the original transaction's purpose beneath layers of rules.
6
Although the firm may have all available information related to contracts and transactions,
uncertainty could still persist for preparers. Uncertainty about contracts and transactions can
increase for firms with numerous, customer-specific contracts or agreements documented by
multiple contracts. Lengthy contracts and technical or legal wording in contracts may also cause
uncertainty. In multi-division firms, uncertainty may increase because detailed information
about contracts and transactions may be decentralized, while accounting expertise may be
centralized.
Uncertainty is the result of, or is amplified by, limits to human cognitive function.
Research shows that individuals have limits to cognitive processing, especially under
uncertainty, which leads to simplification, heuristics, or biases (see Payne, 1976; Iselin, 1988;
Bettman et al., 1990). As argued by Tversky and Kahneman (1974), this simplification can
occasionally lead to errors in estimation or judgment. If uncertainty limits the efficient
processing of information for preparers and/or users, this suggests that complexity can be costly
to financial markets. I discuss one of these costs, misreporting, in the next section.
2.2 Accounting Complexity and Misreporting
I present two theories regarding the causes and consequences of accounting complexity
on misreporting. One theory of accounting complexity suggests that complexity from the
preparer’s perspective causes unavoidable mistakes in financial reporting. This idea is adapted
from Dechow and Dichev (2002), who write that “estimation accuracy [of accruals] depends on
firm characteristics like complexity of transactions and predictability of the firm’s environment.”
Although Dechow and Dichev focus on accruals, the idea applies more generally to all
accounting and reporting. Uncertainty in estimating accruals naturally leads to errors, which
causes revision in future accruals and earnings. More generally, preparer uncertainty in mapping
7
transactions and standards also leads to more errors and misreporting. However, unlike accruals,
if the company makes errors when mapping transactions and standards (misinterpreting GAAP),
the company must restate prior numbers. I term this the mistake theory of complexity.
Another theory of complexity suggests that managers opportunistically manage earnings
when accounting is complex. In contrast to the mistake theory, which suggests that complexity
affects the preparer’s accuracy in financial reporting, the manipulation theory relies on
complexity creating uncertainty for investors (and/or information intermediaries). For example,
focusing on complex pension accounting, Picconi (2004) documents that investors and analysts
do not understand the effect of changes in pension plan parameters on future earnings. He also
shows that managers increase expected rates of return on pension assets to offset the effect of
anticipated bad news in the future. Similarly, Bergstresser, Desai and Rauh (2006) show that
managers increase rates of return assumptions on pension assets when the assumptions have a
greater impact on earnings, or when managers are attempting to acquire other firms or exercise
stock options. The findings on pensions suggest managers opportunistically alter financial
reporting when accounting or reporting is complex. The manipulation theory argues that
complexity increases uncertainty to outsiders, providing managers an opportunity to intentionally
misreport more easily.8
3. Setting and Hypotheses
3.1 Revenue Recognition Setting
I study the effect of accounting complexity on misreporting with respect to revenue
recognition for three reasons. First, revenue recognition is a universal accounting issue;
therefore, my findings will apply to a broad set of firms. Second, revenue misreporting is one of 8 Although this theory suggests managers take advantage of complex accounting by managing the financial statements, complexity is not a necessary condition for manipulation. Many fraudulent practices are implemented using simple accounting settings (e.g., fictitious sales, bill-and-hold transactions, and capitalizing expenses).
8
the most common types of restatement (see Palmrose et al., 2004; GAO, 2002 & 2006). This
ensures that I can obtain a sufficiently large sample of revenue misreporting to test the effects of
complexity on misreporting. Finally, anecdotal evidence suggests that revenue recognition can
be complex for preparers and users of financial statements. I briefly discuss the evidence on the
complexity of revenue recognition next.
Sondhi and Taub (2006) summarize the problems with revenue recognition when they
write: “The lack of comprehensive guidance, in combination with the variety and complexity of
revenue transactions, has resulted in a large number of financial reporting errors in the area of
revenue recognition.” Revenue recognition can be complex because of uncertainty about both
standards and transactions. From 2001-2005, the FASB’s advisory group named revenue
recognition the top issue that should be addressed by the FASB (Schneider, 2005). The FASB
states there are over 200 revenue recognition pronouncements by various standard setting bodies
(Herz, 2007), and much of the authoritative guidance is industry- or transaction-specific. These
issues can lead to inconsistencies across pronouncements or difficulties in applying multiple
standards to a contract. In addition, complicated revenue transactions and contracts can increase
uncertainty. Customer contracts can be lengthy, filled with legal wording, and include multiple
clauses for customer acceptance, return policies, and payment terms. Companies with many
customer-specific contracts can increase uncertainty and side agreements, whether written or
oral, can also alter provisions in contracts leading to increased complexity (see Turner, 2001).
3.2 Measuring Revenue Recognition Complexity
I conjecture that a description of the revenue recognition practices captures uncertainty
about recognizing revenue. Measuring complexity at the firm level is more appropriate than the
standards level because standards apply to firms differently due to differences in transactions.
9
To measure the complexity of revenue recognition at the firm level, I examine the firm’s revenue
recognition disclosures found in the summary of significant accounting policies contained in the
notes to the financial statements.9 I measure revenue recognition complexity using a factor score
(RRC SCORE) based on the number of words (WORDS) and a proxy for the number of methods
(METHODS) obtained from the revenue recognition disclosure.10 In untabulated results,
WORDS and METHODS are highly correlated (0.87), suggesting that these variables capture
similar variation in revenue recognition complexity. I use a factor score mainly for presentation
purposes, but also to reduce noise relative to using each measure separately.11 I discuss other
measures of revenue recognition complexity in Section 6.
I believe the RRC SCORE is a sufficient measure of revenue recognition complexity.
Relative to simple disclosures, longer disclosures and more methods capture the preparer’s need
to incorporate a diverse set of transactions and standards. In addition, longer disclosures are
required for firms to explain more involved practices or methods. These characteristics are
evidence of increased uncertainty. To illustrate this, Appendix 1 includes a few sample revenue
recognition disclosures. For example, A.C. Moore Arts & Crafts recognizes revenue at the point
of retail sale, which is likely an automated process with no uncertainty, suggesting low
complexity. The number of words in their revenue recognition disclosure is 8 and the number of
methods is 1. On the other hand, ARI Networks recognizes revenue for maintenance fees,
9 Prior to SAB 101, firms had a choice to disclose their revenue recognition policy depending on whether they thought it was a significant policy; however, SAB 101, which became effective in 2001, required firms to disclose their revenue recognition policies in the notes to the financial statements. I discuss the effect of this change in disclosure requirements on my results in Section 6. 10 I measure the number of methods (METHODS) the firm employs by counting the number of occurrences of the words “recogn” and “record” found in the disclosure. Counting the occurrences of “recogn” and “record” overestimates the actual number of revenue recognition methods the firm employs. To alleviate concerns of bias in this measure, I physically read the recognition disclosures and counted the number of methods for a sub-sample of firms. The correlation between the two measures is .77, suggesting my proxy for the number of methods is sufficient. 11 I use the principal components method of factor analysis, although results are very similar when I use the common factor method. Only one retained factor is available when using two individual variables and the eigenvalue of my retained factor is 1.7.
10
services, subscriptions, and software. The fees may not be fixed and the customer acceptance
terms can differ across contracts. For ARI, the number of words is 158 and the number of
methods is 7. Thus, relative to A.C Moore, ARI Networks’ revenue recognition is more complex
and the RRC SCORE will capture that increased complexity. As with any measure based on firm
disclosures, there is managerial discretion about how much to disclose with respect to revenue
recognition. However, prior literature (Healy and Palepu, 2001) suggests that the risk of
litigation (Skinner, 1994) and the presence of auditors (Leftwich, 1983) enhances credibility of
reported financial statements and motivates managers to make accurate and timely disclosures.
Therefore, the presence of auditors and risk of litigation should provide limiting boundaries on
the disclosure choice with respect to revenue recognition, mitigating concern about discretion in
the disclosure.
3.3 Research Questions and Hypothesis Development
Both the mistake and manipulation theory of complexity suggest that revenue recognition
complexity increases the likelihood of misreporting revenue. Assuming that the probability of
detecting the misreporting is similar across both theories, this leads me to the following
hypothesis, stated in alternate form:
H1: Managers of firms with more complex revenue recognition are more likely to misreport revenue than managers of firms with less complex revenue recognition.
I test this hypothesis because it is possible that the effect of complexity on revenue misreporting
is quite small or that misreporting is solely driven by managerial incentives and governance, as
hypothesized in prior literature (see Zhang, 2006; Callen et al., 2005). Beyond testing for the
existence of a relation between accounting complexity and revenue misreporting, testing H1
allows me to quantify the economic significance of the effect of complexity on the likelihood of
misstating revenue.
11
I next attempt to distinguish between the two theories of misreporting. The research
question I investigate is: Is misreporting revenue in a complex revenue recognition environment
the result of intentional manipulation or unavoidable mistakes? I do not provide specific
hypotheses regarding this research question, but I develop tests to distinguish between the two
competing theories. The distinguishing feature between manipulation and mistakes is
managerial intent. Although inferring intent is difficult in an empirical setting, I conduct tests on
both the attributes and consequences of misreporting to infer which theory best explains revenue
misreporting. I discuss these tests in the next section after a brief discussion of the sample.
4. Sample Selection and Empirical Design
4.1 Data and Sample Selection
I use a sample of restatement firms collected by the GAO for their reports to Congress in
2002 and 2006 to identify firms that misreported their financial statements.12 Included in the
GAO database is the date of the restatement announcement, type of restatement, including
whether the firm restated revenue, and who identified the misreporting (or source). The GAO
study excludes certain types of restatements that are not due to “irregularities,” including
restatements from mergers and acquisitions, discontinued operations, and stock splits, among
others. In the combined reports, the GAO identified 2,305 firms that restated their financial
statements, covering the years 1997 to 2005. I exclude financial firms (SIC 6000-6999) as their
revenue recognition is substantially different from other firms due to regulatory requirements.
Firms may have multiple restatements over the sample period. For firms that have both a
revenue restatement and a separate non-revenue restatement (meaning multiple restatements,
rather than one restatement with multiple items), I keep the revenue restatement and remove any 12 Restatement data from the GAO reports can be found at http://www.gao.gov/new.items/d03395r.pdf (2002 report) and http://www.gao.gov/special.pubs/gao-06-1079sp/toc.html (2006 report). Judson Caskey provides the data in one MS-Excel file here: http://personal.anderson.ucla.edu/judson.caskey/data.html.
12
non-revenue restatements. In addition, I only include the first restatement for firms that restated
more than once within a one year period.13 I recategorize 18 revenue restatements identified by
the GAO because they are categorized incorrectly. For example, the GAO categorizes
restatements relating to non-operating gains on sale and other non-operating income (such as
interest income) as revenue restatements. I also exclude all revenue restatements in connection
with SAB 101 or any EITF related to revenue issued during the sample period, as I consider
these restatements as mandatory restatements caused by a change in accounting standard.14
Missing variables from 10-K disclosures and COMPUSTAT and CRSP databases reduces the
sample size to 1,188 restatements, 348 of which are revenue restatements. Table 1 contains more
information about the attrition of the restatement sample.
I obtain stock returns from CRSP and analyst forecasts from I/B/E/S. CEO turnover is
obtained from EXECUCOMP where available and hand collected from the proxy filings where
not available. I collect revenue recognition disclosures contained in the firm’s most recent 10-K
prior to the restatement announcement using the Edgar Company Search on the SEC website.15
Some restatements relate to quarterly filings only; however, revenue recognition disclosures are
not found in 10-Q filings, so I also use the most recent 10-K filings for these firms. I use the
13 The GAO sample may have firms with multiple restatements within a one year period for two reasons. First, although extremely rare, the firm may have separately identified multiple misreporting violations during that one-year period. More commonly, the firm has multiple restatements because the GAO incorrectly included separate restatement announcements that are just updates of previously announced restatements. 14 During the sample period, the Emerging Issues Task Force issued EITFs 99-19, 00-10, 00-14, 00-22, 00-25 to clarify revenue recognition issues such as recognizing gross v. net, shipping and handling costs, sales incentives, and other consideration from a vendor to a reseller. 15 I use the fiscal period prior to the restatement announcement to balance the need to have a disclosure that captures investors’ perceptions of revenue recognition at the announcement and to have a disclosure that captures complexity during the misreporting. Almost all restatements include misreporting up to the restatement announcement suggesting that these disclosures capture the complexity during the misreporting.
13
Python programming language to obtain the revenue recognition disclosures where possible,
personally checking for accuracy, and hand collecting the disclosures where Python fails.16
Table 2 displays the frequency of restatements by year for the type of restatement (Panel
A), industry (Panel B), and source of the restatement (Panel C).17 Panel A shows that revenue
restatement firms are 29 percent of the total restatements in the sample and that 2000 and 2003
had especially high proportions of revenue restatements. Although not tabulated, the industry
breakdown is similar to the composition of all firms in Merged CRSP/COMPUSTAT database
over the sample period, except my sample is overweighted in Wholesale/Retail and Technology
and underweighted in Other.18 Panel C presents information about who identified the
misreporting (or source) broken out by the type of restatement. More than half of the
restatements are initiated by the company, although this potentially underestimates the effect of
the auditor on discovering the misreporting since the auditor may identify the restatement but
receive no credit in the restatement announcement.
4.3 Empirical Design
4.3.1 Control Firms
I test H1 by comparing the revenue recognition complexity of firms that restated revenue
to firms that restated something other than revenue. I use non-revenue restatement firms as the
control sample for three reasons. First, using restatement firms as the comparative group
controls for incentives, governance effects, and other determinants of restatements, which are
16 Python is an open-source, dynamic programming language useful for text and html processing. More information on Python can be found at www.python.org. 17 Consistent with Palmrose et al. (2004), industries are defined by the following SIC codes: Mining & construction=0-1999, manufacturing=2000-3999 (except codes assigned to technology), technology=3570-3579 plus 7370-7379, transportation=4000-4799, communications=4800-4899, utilities=4900-4999, wholesale/retail=5000-5999, services=7000-8999 (except codes assigned to technology), and other=9000-9999. 18 The overweighting in Wholesale/Retail is mostly explained by the large amount of lease-related restatements in 2005 for Wholesale/Retail firms.
14
difficult to control for because they are hard to measure (e.g., governance and incentives).
Second, other research design approaches are problematic. Comparing revenue restating firms to
a broad cross section of firms is prohibitive because revenue recognition complexity requires
some hand collection. A matched sample approach is difficult to implement because it is not
clear what attributes or what time period should be matched.19 Third, by employing the same
design as prior research (Zhang, 2006), which has hypothesized that unique incentives cause
managers to manage revenue, I can compare my results with prior literature. One disadvantage
of using other restatement firms for comparison is that results may not accurately reflect the full
effect of complexity on misreporting in a large sample context if other restatement firms are not
representative of the rest of the population of firms. Similarly, by comparing revenue
restatement firms to other restatement firms, I only capture the incremental incentives to
misreport revenue, which likely underestimates the effect of incentives relative to the population.
4.3.2 Revenue Restatement Model
The logistic model to test H1 is presented in equation (1). I organize control variables
into three categories based on prior research and discuss them below.
)OtherGovernanceRelevanceValueComplexity()RestateRevenue( δγβα ∑+∑+∑++= μfP (1)
where: Complexity [RRC SCORE] ∈ Value Relevance [BTM, LOSSPER, SALEFCST, GM, OM, R&D, EARNVOL] ∈ Governance ∈ [PRERETURN, CHSALES, BIGN, LOGMVE, AUDITOR] Other ∈ [AR ACCRUAL, INDUSTRY, YEAR] The proxy for complexity is discussed above. I discuss control variables next. Detailed variable
definitions can also be found in Appendix 2.
19 For example, matching on industry introduces a noisy sort on revenue recognition complexity, potentially controlling for the effect being tested. For the reasons stated above, I do not use a matched-sample design for the main analysis. However, in Section 6 I conduct an alternate test of H1 on a sub-sample of revenue restatements using a matched-sample approach.
15
Value-relevance of revenue
The two principal studies on revenue restatements, Zhang (2006) and Callen et al. (2005),
have shown value relevance to be an important determinant of firms restating revenue. I use
firm characteristics based on this prior research that suggest revenue has high value relevance
and/or earnings has low value relevance. Ertimur et al. (2003) find the market reaction to
revenue surprises to be greater for growth firms than value firms. Also, Ertimur and Stubben
(2005) show that analysts are more likely to issue revenue forecasts for firms with higher growth
prospects. Therefore, the existence of revenue forecasts should also increase the value relevance
of revenue, since it provides the market a benchmark to evaluate revenue. Revenue may also be
more important for firms with high gross margins and operating margins since Plummer and
Mest (2001) find that firms with higher operating margins report higher sales surprises relative to
analyst forecasts. Finally, Zhang (2006) includes R&D expenses based on Kama’s (2004)
evidence that the market reacts more to revenue surprises for firms with higher R&D
expenditures, suggesting firms with higher R&D have revenue that is more value relevant.
Revenue may also be more important for valuation when net income is less value
relevant. Hayn (1995), Collins et al. (1999) and others have shown that the returns-earnings
relationship is weaker for loss firms than profit-making firms. Since loss firms have low value
relevance of earnings, Callen et al. (2005) argue the market will substitute revenue for earnings
in valuation. Zhang (2006) also argues that high earnings volatility is also likely to make
earnings less value relevant, potentially increasing the value relevance of revenue.
In summary, growth prospects, analyst revenue forecasts, high gross and operating
margins, losses, high R&D, and high earnings volatility all increase the value-relevance of
revenue and the probability of revenue misreporting. Therefore, I include proxies in my model
to control for these constructs. I use the book-to-market ratio of the firm at the fiscal year end
16
just prior to the restatement (BTM) as a proxy for growth and an indicator equal to one if the firm
has an analyst revenue forecast any time prior to the restatement announcement and zero
otherwise (SALEFCST). I also include the 5-year average gross margin (GM) and 5-year average
operating margin (OM) of the firm prior to the restatement. Finally, I include the proportion of
loss years to total years the firm has earnings data on COMPUSTAT (LOSSPER), and the 5-year
average R&D expenses scaled by sales (R&D) and earnings volatility (EARNVOL) of the firm
prior to the restatement announcement.20
Governance
Prior research provides some evidence on the effect of auditing and governance on the
occurrence of misreporting the financial statements in general (see Defond and Jiambalvo, 1991
and Palmrose et al., 2004), but provides little insight to whether managers will specifically
misreport revenue. It is more likely that the previously mentioned variables on the value-
relevance of revenue already capture an increasing monitoring effect on revenue reporting by
auditors. In addition, Kinney and McDaniel (1989) find that firms correcting previously reported
quarterly earnings are more likely to have negative stock returns leading up to the correction.
They argue that poor recent performance causes auditors to scrutinize financial statements and
accounting choices. I include the stock returns for the 12-month prior to the restatement
announcement (PRERETURN) to control for this effect. Modifying this same idea specifically
for revenue restatements, recent sales declines may cause auditors to reexamine the revenue
recognition of prior sales, increasing the likelihood of restatement. I control for deteriorating
sales by using the average change in sales for the two years prior to the restatement (CHSALES).
I control for other potential monitoring effects by including the logged market value of equity of 20 Zhang (2006) measures these variables relative to the initial period of misreporting. I measure the variables relative to the restatement announcement because I only have data on the misreporting period for a sub-sample of restatements. However, results are consistent with those presented in the paper when I measure these variables using Zhang’s approach on the sub-sample.
17
the firm at the fiscal year end just prior to restatement (LOGMVE), an indicator equal to one if
the firm is audited by a large accounting firm (BIGN), and an indicator equal to one if the
restatement is attributed to the auditor (AUDITOR). However, I make no predictions regarding
these effects.
Other determinants
Zhang (2006) also argues that large accounts receivable accruals allow managers more
flexibility in managing revenue. Manipulating revenue when A/R accruals are already large
decreases the likelihood of detection compared to small A/R accruals. I include the firm’s 5-year
average A/R Accrual prior to the restatement to control for high A/R accruals (AR ACCRUAL).
Zhang makes a similar argument for unearned revenue accruals, but since data on unearned
revenue accruals is only extensively available starting in 2002, I do not include unearned revenue
accruals in the formal analysis.21 Finally, I include industry and year indicators to control for
industry and year effects that may affect the probability of restatements.
4.3.3 Attributes of Misreporting Tests
I examine three attributes of the revenue misreporting itself to provide some evidence on
the intent of managers. For each misreporting attribute indicator described below, I perform
univariate logistic regressions to test whether revenue recognition complexity (RRC SCORE) is
associated with the particular attribute.
The first attribute I examine is meeting revenue benchmarks, including analyst forecasts
and prior period revenue. Meeting revenue benchmarks can be beneficial to the firm and
provides incentives to manage revenue (see Ertimur et al., 2003; Rees and Sivaramakrishnan,
2007; Stubben, 2006). If the restatement caused the firm to miss a benchmark that the firm
21 As a robustness check, I include in the test an indicator equal to one if the firm has unearned A/R accruals as of 2002 and zero otherwise. The results remain consistent with those presented in the main analysis.
18
previously beat, this suggests the manager chose the recognition of revenue to manipulate
revenue to beat the benchmark. Assuming the first period of misreporting was when the decision
was made to recognize revenue in a particular way and the company maintained that policy in
subsequent periods, the first period of misreporting is the period of interest. For each
restatement I set MISS GROWTH to one if the firm had previously recorded positive sales
growth in the first period of misreporting and the restatement caused the firm to have zero or
negative sales growth for that period, and zero otherwise.22 Similarly, for each restatement I set
MISS FCST to one if the first period of the misreporting had an analyst revenue forecast and (1)
the firm had previously beat the mean analyst revenue forecast for that period, and (2) the
restatement caused the firm to miss the forecast for that period, and zero otherwise.
Second, if managers of firms with complex revenue recognition are manipulating
revenue, there should be a greater likelihood that they overstate revenue compared to firms with
less complex revenue recognition. In the extreme, one might suggest that evidence of mistakes
should only exist if there are an equal number of over- and understatements. However, the
probability of detection is not equal for over- and understatements because auditors and boards
are more concerned with overstatements. In addition, this test attempts to determine if complex
revenue recognition is more associated with unintentional mistakes, not solely driven by
unintentional mistakes. I set an indicator equal to one if the sum of the restated revenue over the
restating periods is less than the sum of the originally reported revenue over the restating period,
and zero otherwise (OVERSTATEMENT).
Finally, the pervasiveness of the restatement may also give indication of intent. If the
company restates another area of the financial statements in addition to revenue, it suggests the
22 Since companies can restate annual results and/or quarterly results, I determine sales growth differently for annual and quarterly periods. For restated annual results, sales growth is calculated as the annual difference in sales. For restated quarterly results, sales growth is calculated as the lagged 4-quarter difference in sales.
19
misreporting is widespread and more likely intentional. In support of this, Palmrose et al. (2004)
find that restatements involving multiple areas of the financial statements have more negative
announcement returns, controlling for the magnitude of the restatement on net income. I set an
indicator equal to one if the firm restated multiple areas of the financial statements, and zero
otherwise (MULTIPLE).
4.3.4 Consequences of Misreporting Tests
In addition to the attributes of misreporting, I examine the negative consequences
associated with the misreporting to partly infer whether stakeholders perceive there to be
managerial intent associated with complexity. As Hribar and Jenkins (2004) argue, firms that
announce restatements experience an increase in cost of capital partially because of uncertainty
regarding managerial integrity. More generally, if managerial intent is important to stakeholders
when they observe misreporting, then the theories suggest the consequences of misreporting will
be more severe if managers are taking advantage of complexity and less severe if the complexity
just results in more errors. I examine three reactions to misreporting that provide evidence of
intent: SEC AAERs, restatement announcement returns, and CEO turnover following the
restatement.23
First, I examine whether an SEC Enforcement Action (AAER) accompanies the revenue
restatement.24 While not all AAERs are accusations of fraud, the issuance of an AAER
23 Using a different approach, Hennes, Leone, and Miller (2007) classify a restatement as intentional if the restatement disclosure discusses an irregularity, a board-initiated independent investigation, or an external regulatory inquiry. However, similar to my approach, they examine whether their classification is valid by examining the classification’s association to announcement returns and class action lawsuits. 24I use the term ‘accompanies’ because the timing of restatements and AAERs can vary across firms. SEC investigations into misreporting, whether formal or informal, typically closely accompany restatement announcements. However, the complete resolution of restatements and AAERs can take years.
20

represents a greater likelihood of intentional actions.25 For example, Karpoff et al. (2007), find
that 622 of the 788 enforcement actions (79 percent) in their sample from 1978-2006 include
charges of fraud. In addition, a 2007 Deloitte study finds that of revenue recognition AAERs,
roughly half of the AAERs are issued for recording fictitious revenue, revenue swaps or round-
tripping, or “bill and hold” transactions, which are all intentional manipulations (Deloitte
Forensic Center, 2007). Data on firms subject to SEC AAERs is a sub-sample of AAERs that
Dechow et al. (2007) use in their study. Using AAERs, Dechow et al. (2007) identify financial
statement variables that predict financial manipulations and develop a Fraud Score based on their
prediction model. Their sample contains AAERs from 1982 through 2004 and identifies if the
AAER relates to revenue or receivables issues. Since my sample of restatements runs through
2005, I determine whether later restatements resulted in AAERs by searching the listings of
AAERs on the SEC website through August 2007.
I use estimates from a logistic regression to test whether revenue recognition complexity
affects the likelihood of receiving an AAER for revenue restatement firms. The dependent
variable is one if the firm has an AAER associated with revenue or receivables within three years
of the restatement announcement and zero otherwise. Equation (2) presents the model with a
discussion of the variables following.
)
()RestateRevAAER(
1810998
7654
321
INDUSTRYBIGNLOGMVECHNICHREVRESTLENFCSTMISSCAR
AUDITORMULTIPLESCORERRCfP
−++++++++
+++=
γγγγγγγγ
γγγα
(2)
Generally, studies on AAERs (Dechow et al., 1996; Beniesh, 1999; Dechow et al., 2007)
have compared AAER firms to either a large sample of public firms or to small matched-
25 Erickson, Hanlon and Maydew (2006) and Feroz et al. (1991) correctly argue that the SEC can issue administrative actions that do not imply charges of fraud or gross negligence. Generally, these administrative actions end with a settlement and an AAER, where the firm admits to no wrong-doing but agrees to avoid future securities violations.
21
samples. These studies examine firm characteristics like governance, incentives, and financial
statement characteristics to predict AAERs. In contrast, this test focuses on the likelihood of an
AAER for a specific type of misreporting event; therefore, restatement characteristics are likely
more important in determining if an AAER will be issued. I conjecture that the SEC is more
likely to issue an AAER if managers had intent to manipulate revenue, if the misstatements are
large, and if the SEC gets greater exposure from issuing the AAER. I include four variables to
identify intent: (1) whether the firm restated more than just revenue (MULTIPLE); (2) whether
the restatement is credited to the firm’s auditor (AUDITOR); (3) the 5-day cumulative
restatement announcement return for the market’s assessment of intent (CAR); and (4) a dummy
equal to one if the restatement caused the firm to miss the sales forecast for the first period of the
restatement and zero otherwise (MISS FCST).26 I include three measures of the magnitude of the
restatement: (1) the number of periods the company is restating in quarters (RESTLEN); (2) the
percentage change in revenue over all periods of the misreporting due to the restatement
(CHREV); and (3) the percentage change in net income over all periods of the misreporting due
to the restatement (CHNI).27 Finally, the SEC may target large firms and firms audited by large
accounting firms because it benefits from enforcement of those firms relative to smaller firms.
To control for these effects, I include in the model both the log of the market value of equity for
the fiscal year end prior to the restatement (LOGMVE) and whether the firm was audited by a
large accounting firm (BIGN).
Recognizing that AAERs probably do not constitute a complete set of intentional
misreporting violations, I examine two other events associated with the restatement,
26 Although the purpose of the test is to infer intent using the association between revenue recognition complexity and AAERs, I control for other obvious indications of intent since the SEC likely uses this other information in conjunction with complexity to determine if the company was intentionally misreporting revenue. 27 The last two measures of magnitude, CHREV and CHNI will not capture restatements that are solely timing issues, since there is no “change” in revenue or net income. However, few restatements can be categorized as solely revenue recognition timing problems because at the time of restatement the timing has not been fully resolved.
22
announcement returns and CEO turnover. If investors are sensitive to management integrity and
are capable (through disclosures or inference) of identifying managerial intent when a
restatement is announced, then examining the effect of complexity on returns provides the
market’s indication of intent. If complex revenue recognition firms have lower (higher) market
returns it would suggest the market interprets revenue restatements for complex firms as more
(less) intentional.
I test whether the market reaction to revenue restatement announcements differs based on
revenue recognition complexity using OLS regression estimates of 5-day cumulative abnormal
returns (CAR) centered on the announcement date regressed on complexity variables and other
control variables. I measure the cumulative abnormal return using market adjusted returns,
where the daily market returns are subtracted from the firm’s raw returns and compounded over
the period. The model is presented in equation (3), followed by a discussion of control variables.
εγγγγγγγγγγα
+++++++++++=
− INDUSTRYBTMPRERETURNLOGMVECHNICHREVAAERAUDITORMULTIPLESCORERRC
18109876
54321CAR (3)
Palmrose et al. (2004) identify a number of restatement and firm characteristics that
affect restatement announcement returns. They show that restatement announcement returns are
negatively associated with restatements involving fraud, affecting multiple accounts, decreasing
net income, and attributed to auditors or management. I control for these findings using
MULTIPLE and AUDITOR as previously defined. In addition, I include an indicator for whether
the restatement is eventually associated with an AAER (AAER) to identify fraud. Since AAERs
are not usually announced concurrently with accounting restatements, I include this variable to
account for information the market infers or receives about fraud or SEC investigations from the
announcement. I control for the magnitude of the restatement by including both CHREV and
CHNI as previously defined. The model includes LOGMVE to control for size since adverse
23
news is likely to be magnified for small firms, which typically have weak information
environments (Collins et al., 1987 and Freeman, 1987). Since announcement returns are
partially due to investors’ revisions of future growth expectations, the returns are likely related to
the book-to-market ratio of the firm just prior to the announcement (BTM) and recent stock
performance (PRERETURN) as previously defined.
Finally, I examine evidence from CEO turnovers to infer intent. If corporate boards are
more likely to dismiss CEOs that manipulate revenue, then an association between revenue
recognition complexity and CEO turnover provides an indication of intent. However, it is
possible that boards do not distinguish between manipulation, an indication of CEO integrity,
and mistakes, an indication of CEO competence, when making turnover decisions. Therefore, I
expect this test to be less powerful than the other consequences tests. Consistent with Desai,
Hogan, and Wilkins (DHW, 2006), I test a logistic regression model where the dependent
variable is one if the CEO resigned or was dismissed from the firm within two years following
the restatement announcement and zero otherwise. The model, presented in Equation (4),
includes a number of control variables that I discuss below.
)
()RestateRevCEOTurn(
19111098
7654
321
INDUSTRYCARROAPOSTRETURNPRERETURNCHNICHREVLOGMVE
MULTIPLEAAERSCORERRCfP
−++++++++
+++=
γγγγγγγγ
γγγα
(4)
Desai, Hogan, and Wilkins (2006) identify a number of variables that are associated with
CEO turnover following restatements, many of which I include as control variables in my model.
I include MULTIPLE and AAER as previously defined as partial controls for managerial
culpability. I control for firm size by including LOGMVE as previously defined. I also include
both CHREV and CHNI to capture the magnitude of the restatement. Prior stock return and
operating performance are directly linked with CEO turnover decisions (see Warner et al., 1988
24
and Engel et al., 2003). Following DHW, I include both the stock returns for the year prior to
(PRERETURN) and the year following (POSTRETURN) the restatement announcement to
control for market-based performance. Consistent with DHW, I also include the return-on-equity
(ROA) for the fiscal year prior to the restatement announcement to control for operating-based
performance. Finally, I include the restatement announcement return (CAR) to capture the
market’s assessment of the restatement. DHW also provide some evidence that CEO age, tenure,
stock ownership and occupying the Chairman position all contribute to the turnover. However,
since over half of my sample firms are not covered by EXECUCOMP, I exclude these variables
from the model. I discuss the effect of this research design choice on my results in the next
section.
5. Results
Table 3 contains summary statistics for revenue restatement firms and non-revenue
restatement firms, with t-tests for the difference in means. The univariate results are consistent
with Hypothesis 1. I present individual statistics for both WORDS and METHODS in this table,
but use only RRC SCORE in the subsequent analysis. On average, revenue restatement firms
have more WORDS (268 vs. 187, t-stat 5.26), METHODS (5.9 vs. 4.0, t-stat 6.82), and higher
RRC SCORE (0.45 vs. -0.18, t-stat 7.92) than non-revenue restatement firms. The differences in
means also show that revenue restatement firms have lower book-to-market (BTM), incur more
losses (LOSSPER), are more likely to have an analyst sales forecast (SALE FCST), and have
larger A/R accruals (AR ACCRUAL) prior to the restatement. Contrary to prediction, revenue
restatement firms have higher increases in revenue for the two years prior to the restatement
(CHSALES) compared to other restatement firms (.212 vs. .175), although the difference is not
25
significant (t-stat 1.18). Finally, revenue restatement firms are younger (AGE) than and the same
size (LOGMVE) as the non-revenue restatement firms.
Table 4 presents correlations for many of the variables listed in Table 3. Note that
RRC SCORE is positively correlated with REVENUE (.219 and .236), consistent with the results
in Table 3, suggesting that revenue recognition complexity is positively associated with revenue
restatements. Revenue recognition complexity is also positively correlated with some of the
variables that suggest revenue is more value relevant (e.g., LOSSPER (.152), SALEFCST (.193),
and AR ACCRUAL (.234)).
Table 5 presents results from the logistic estimation of equation (1). I calculate Z-
statistics using robust standard errors with firm-level clustering to account for multiple
observations for the same firm (93 cases). The first observation from Table 5 is that
RRC SCORE has a positive, statistically significant coefficient (.357, z-stat 4.86) indicating that
revenue recognition complexity increases the likelihood that a firm will restate revenue relative
to other restatement firms. This provides support for H1. In addition, the results indicate that
firms with lower BTM and with an analyst sales forecast (SALESFCST) are more likely to restate
revenue. Multivariate results also suggest that revenue restatement firms are experiencing a
decline in sales (CHSALES) and have poor stock return performance (PRERETURN) prior to the
restatement. Governance characteristics suggest that revenue restatement firms are less likely to
be audited by a large accounting firm, which may suggest a lack of oversight of revenue restating
firms’ auditors (i.e., the non-Big N auditors are less likely to uncover revenue restatement
problems). Finally, revenue restating firms also have much larger A/R accruals prior to the
restatement (5.147, z-stat 3.2).
I examine the economic significance of complexity relative to other determinants of
revenue restatements by computing marginal effects. To allow for comparison across variables,
26
marginal effects are calculated for each continuous variable as the change in the predicted
probability as the variable moves one standard deviation centered at the mean, holding all other
variables constant at their mean values. Marginal effects for indicator variables are similarly
calculated, but with the change in the predicted probability calculated as the indicator moves
from zero to one. A one standard deviation change in RRC SCORE (from -0.65 to 0.65)
increases the probability of revenue restatement by 8.8 percent. The effect of revenue
recognition complexity on the probability of restatement is higher than any other continuous
variable, and roughly equal to or greater than all indicator variables. This provides further
evidence that revenue recognition complexity is an important determinant in firms misreporting
revenue. Generally, the results in Table 5 suggest the effect of revenue recognition complexity
on revenue misreporting is significant, both statistically and economically.
5.1 Attributes of Misreporting Results
The results of the attributes of misreporting tests are found in Table 6. The table presents
univariate logistic regression estimates of each misreporting attribute on RRC SCORE.
Statistical significance is calculated using 2-tailed tests. Although the coefficients on
RRC SCORE are positive for each model, none are statistically significant at conventional levels.
Therefore, these results do not provide convincing evidence that managers of complex revenue
recognition firms make more mistakes or are intentionally manipulating revenue. However, the
lack of results for these tests may indicate weaknesses in my proxies for intentional
manipulation. While these tests appear to be the most apparent attributes related to intentional
manipulation, other more subtle and less observable characteristics could provide indications of
manipulation. I present the consequences of misreporting results next.
27
5.2 Consequences of Misreporting Results
Table 7 contains descriptive statistics for the sample of 348 revenue restatement firms
(Panel A) and consequence variables broken down by high and low revenue recognition
complexity (Panel B). Panel A shows that 20 percent of all revenue restatements result in SEC
AAERs and 31 percent of revenue restatement firms have CEO turnover in the two years
following the restatement. The mean (median) announcement CAR is -10 percent (-5.4 percent),
consistent with the findings in Palmrose et al. (2004). The mean stock return for the year prior to
the restatement is -19.1 percent and the mean return for the year following the restatement is -
21.3 percent. Restatement attributes show the mean number of quarters restated (RESTLEN) is
8.2, with a mean decrease in revenue (CHREV) of 5.7 percent and a mean decrease in earnings
(CHNI) of 13.4 percent. In Panel B, the sample of revenue restatements are divided into high
and low revenue recognition complexity based on RRC SCORE relative to the mean of
RRC SCORE for the sample. The results in Panel B show that high complex revenue recognition
firms are less likely to receive an AAER (0.16 vs. 0.24, t-test -1.82) and have less negative
announcement returns (-0.08 vs. -0.119, t-test 1.78) than low complexity firms. The t-tests show
no significant difference for CEO turnover.
Table 8 contains regression estimates for consequences of misreporting tests. The results
on AAERs show RRC SCORE is negatively associated with AAERs (-0.361, z-stat -2.85),
suggesting restatements involving complex revenue recognition are less likely intentional. The
results also show the SEC targets firms with larger market values. CHREV has a negative
coefficient (-3.65, significant at less than 1%), which is expected if the SEC is more concerned
with revenue overstatements. More surprising is the coefficient on CHNI is 0.178 (significant at
10%). However, this does not indicate that earnings increases are most associated with AAERs,
28
but suggests that, given the change in revenue, an increase in earnings is more associated with
AAERs. Therefore, these coefficients must be interpreted collectively.
The results for announcement returns in Table 8 also show that firms with complex
revenue recognition have less negative announcement returns (0.023, t-stat 2.61). The economic
effect on returns is also significant. Although not tabulated, a one standard deviation increase in
RRC SCORE (1.22) increases announcement returns by 2.8 percent. With an average market
capitalization of $1.9 billion prior to the restatement, the mean change in announcement return
dollars is $52 million. The CAR results in Table 8 also show that understatements of revenue
(CHREV) have higher announcement returns, and firms that eventually receive AAERs have
much lower restatement announcement returns (-12.6 percent). As predicted, the coefficient on
PRERETURN is negative (-0.036, t-stat -3.96), suggesting the market must lower expectations of
future growth to a greater degree for firms with good recent stock performance.
Contrary to the evidence for AAERs and CARs, the results from Table 8 on CEO
turnover do not support the mistake hypothesis. While the coefficient for RRC SCORE is
negative, it is insignificant at conventional levels. This may be resulting from one of two
different effects. First, the model may not be fully specified due to missing data on CEO
characteristics like age, tenure and occupying the Chairman position as mentioned in Section
4.3.4; however, it seems unlikely that these variables are correlated with revenue recognition
complexity, suggesting that the lack of specification may not influence the complexity
coefficient. Second, as expected, it may be that complexity is not associated with CEO turnover
decisions because boards may not distinguish between mistakes and manipulation in determining
CEO departure. The regression results do indicate that CEO turnover is higher if the firm
receives an AAER, has poor operating performance prior to the restatement (ROA) and poor
stock returns following the restatement (POSTRETURN). Overall, the results in Table 8 provide
29
evidence that revenue restatements resulting from complex revenue recognition have less severe
consequences.
6. Additional Analysis
6.1 Other Measures of Revenue Recognition Complexity
To test the robustness of my proxy for revenue recognition complexity, I conduct all the
previous tests using alternative proxies. First, to control for the effect of multi-division firms on
revenue recognition disclosures, I scale RRC SCORE by the number of operating segments
obtained from the COMPUSTAT Segments Database. Firms with missing segment information
are assumed to have a single business line. Results using this scaled complexity score are
consistent with those presented in the main analysis. Also, I conduct the tests using the
individual variables WORDS and METHODS and results are substantively similar. In addition, I
develop a measure to capture the subjectivity of the revenue recognition methods employed by
using key-word searches for the following practices: the percentage of completion method,
providing multiple deliverables, vendor-specific objective evidence, barter or non-monetary
exchange revenue, or fair valuing aspects of the contract. While using this measure provides
support for H1, it is insignificant in any of the tests to determine intent (attributes or
consequences). Finally, I conduct the analysis using a factor score obtained from WORDS,
METHODS, and the subjectivity measure. Again, the results remain substantially unchanged
from those presented in the main analysis.
6.2 Alternative specifications to test H1
6.2.1 Matched sample design
In the main analysis I use a research design to test H1 that compares revenue restatement
firms to other restatement firms. While this research design has many advantages, which I
30
discuss in Section 4.3.1, it may underestimate the effects of incentives and complexity on
misreporting. I conduct an alternative design specification to test H1 using a matched sample
design that allows me capture the full effect of incentives and complexity on misreporting.28
Before obtaining the matched sample for revenue restatements, I reduce the restatement sample
to 124 firms that have data on both COMPUSTAT and EXECUCOMP in order to calculate
necessary control variables using this alternative specification. One of the difficulties in
executing a matched sample design in this setting is identifying what characteristics to match. I
choose to match on fiscal year, assets, and the book-to-market ratio. Because my sample of
revenue restatement firms are generally smaller firms, this helps match firms that are of similar
size and have similar growth prospects. I first identify all firms without any restatement during
the sample period that have both data on COMPUSTAT and EXECUCOMP. Firms with assets
between 70% and 130% of the assets of the sample firm in the same fiscal year are chosen as
potential matches. From this set of firms, I choose the matched firm with the book-to-market
ratio closest to that of the sample firm.
I estimate a logistic regression model for revenue restatements with control variables
obtained from Burns and Kedia (2006). Using a sample of S&P 500 firms, Burns and Kedia
(2006) find evidence that the sensitivity of CEO option portfolios to stock price is higher for
restatement firms than non-restatement firms, suggesting that compensation incentives matter to
misreporting. I include control variables from their study for growth (earnings-to-price ratio),
external financing (equity and debt financing), firms close to violating debt covenants (leverage),
operating accruals, and CEO equity incentives (the pay-for-performance sensitivity of CEO stock
options). Untabulated results from estimating this specification also provide strong evidence that
28 As stated in section 4.3.1, although this alternative research design allows me to capture the full effect of incentives and governance on misreporting, there still may be difficulty correctly identifying or measuring governance and incentives associated with misreporting.
31
revenue recognition complexity increases the probability of revenue restatement, controlling for
other incentives and governance characteristics.
6.2.2 Exclusion of lease-related restatements
In addition to this matched-sample design, I conduct the test for H1 using a more
restrictive sample. Due to the large number of lease-related restatements in 2005 that some may
consider a change in accounting policy, I estimate the logistic regression to test H1 excluding
these restatements. I proxy for these lease restatements by excluding all restatements identified
as “cost or expense” restatements in 2005 (198 cases). Results are consistent with those
presented in the main analysis.
6.3 Regulations affecting revenue recognition disclosure
Effective in 2001, SAB 101 required disclosure of the firm’s revenue recognition policies
and gave more substantive guidance related to the content of those disclosures. Since my proxy
for revenue recognition complexity relies upon these disclosures, a positive association between
complexity and misreporting may be due to a disclosure change and not a change in revenue
recognition complexity. I conduct all the tests splitting the sample into pre- and post-SAB 101
restatements. All results are consistent with the results presented in the paper except results for
RRC SCORE coefficients are insignificant for the AAER and CAR regressions in the pre-SAB
101 period. Results remain consistent in the post-SAB 101 period: higher revenue recognition
complexity is associated with fewer AAERs and less negative CARs. The difference in results
pre- and post-SAB 101 may suggest that lack of guidance in pre-SAB 101 period caused firm
disclosures to be less reliable measures of the firm’s real revenue recognition polices, increasing
noise in the measure of revenue recognition complexity in the pre-period.
32
7. Conclusion
I investigate the effect of accounting complexity on misreporting using a setting of
revenue recognition complexity and revenue restatements. I find that revenue recognition
complexity significantly increases the probability of a revenue restatement relative to other types
of restatements. Because complexity can lead to more mistakes and/or create opportunities for
manipulation, I conduct two sets of tests to determine whether the increase in misreporting from
complexity is likely the result of more mistakes or opportunistic behavior. These tests examine
both the attributes of the misreporting and the consequences of misreporting. Tests on the
attributes of misreporting do not provide clear evidence that managers of complex revenue firms
are more likely to manipulate or make mistakes. However, results are consistent with the
consequences of misreporting being less severe - firms with complex revenue recognition have
less negative announcement returns and are less likely to receive AAERs. Finally, my analysis
shows revenue recognition complexity is not associated with CEO turnover, suggesting that
boards may not distinguish between mistakes and manipulation in determining CEO departure
when restatements occur.
Collectively, the results suggest that in the case of revenue recognition, complexity is a
major factor in the occurrence of misreporting. This provides evidence consistent with
accounting complexity being costly to financial markets, which lends support to regulators’
concerns about accounting complexity. While there appears to be no strong evidence of
manipulation by firms with more complex revenue recognition, accounting complexity appears
to be more associated with mistakes. More research is needed to determine if accounting
complexity increases misreporting in other areas besides revenue and to understand other effects
of accounting complexity besides misreporting.
33
References
Anderson, K. and T. Yohn, 2002. The Effect of 10-K Restatements on Firm Value, Information Asymmetries, and Investors' Reliance on Earnings. Working paper, Georgetown University. Barber, B. and Lyon, J., 1997. Detecting Long-Run Abnormal Stock Returns: The Empirical Power and Specification of Test Statistics. Journal Financial Economics 43, pp. 341-72. Beneish, M., 1999. Incentives and Penalties Related to Earnings Overstatements that Violate GAAP. The Accounting Review 74(4): 425-457. Bergstresser, D., M. Desai, and J. Rauh, 2006. Earnings manipulation, pension assumptions, and managerial investment decisions. Quarterly Journal of Economics 121(1), 157—195. Bettman, J., E. Johnson, and J. Payne, 1990. A componential analysis of cognitive effort in choice. Organizational Behavior and Human Decision Processes 45 (1): 111-140. Burns, N., and Kedia, S., 2006. The impact of performance-based compensation on misreporting. Journal of Financial Economics 79, 35-67. Bushman, R., Q. Chen, E. Engel, and A. Smith. 2004. Financial accounting information, organizational complexity and corporate governance systems. Journal of Accounting and Economics 37 (2): 139–201. Callen, J. L., Livnat J., and Segal D, 2006. Accounting Restatements: Are they always bad news for investors? Journal of Investing, Fall, 2006, pp. 1-12. Callen, J. L., Robb, S., and Segal, D., 2005. Revenue Manipulation and Restatements by Loss Firms. Working paper. Collins, D., Pincus, M. and Xie, H., 1999. Equity valuation and negative earnings: the role of book value of equity. The Accounting Review 74, pp. 29–61. Collins, D., Kothari, S.P., Rayburn, J., 1987. Firm size and the information content of prices with respect to earnings. Journal of Accounting & Economics 9, 111–138. Cox, C. 2005. “Remarks Before the 2005 AICPA National Conference on Current SEC and PCAOB Developments.” Speech given by the SEC Chairman, Washington D.C., Dec 5. http://www.sec.gov/news/speech/spch120505cc.htm. Dechow, P., and Dichev, I., 2002. The quality of accounting and earnings: The role of accrual estimation errors. The Accounting Review 77 (Supplement): 35-59. Dechow, P., Sloan, R., Hutton, A., 1996. Causes and consequences of earnings manipulation: An analysis of firms subject to enforcement actions by the SEC. Contemporary Accounting Research 13, 1–36. Dechow, P., Ge, W., Larson, C., and Sloan, R., 2007. Predicting Material Accounting Misstatements. Working Paper, University of Michigan and University of Washington. DeFond, M. L., and J. Jiambalvo. 1991. Incidence and circumstances of accounting errors. The Accounting Review 66: 643-655.
34
DeFond, M., Jiambalvo, J., 1994. Debt covenant violation and manipulation of accruals. Journal of Accounting and Economics 17, 145–176. Deloitte Forensic Center, 2007. Ten things about financial statement fraud. June 2007. Deloitte. http://www.deloitte.com/dtt/cda/doc/content/us_forensic_tenthings_fraud200607.pdf. Desai, H., Hogan, C., Wilkins, M., 2006. The reputational penalty for aggressive accounting: Earnings restatements and management turnover. The Accounting Review 81.1, 83-112. Engel, E., Hayes, R. and Wang, X. 2003. CEO-turnover and properties of accounting information. Journal of Accounting & Economics 36: 197-226. Erickson, M., Hanlon, M., and Maydew, E., 2006. Is There a Link between Executive Equity Incentives and Accounting Fraud? Journal of Accounting Research, 44(1), pp. 113-43. Ertimur, Y., Livnat, J. and M. Martikainen, 2003. Differential market reactions to revenue and expense surprises, Review of Accounting Studies 8 (2003) (2–3), pp. 185–211. Ertimur, Y., and S. Stubben, 2005. Analysts’ incentives to issue revenue and cash flow forecasts, Working Paper, Stanford University. Financial Accounting Standards Board (FASB). 1978. Statement of Financial Accounting Concepts No. 1: Objectives of Financial Reporting by Business Enterprises. FASB, Stamford, CT. Feroz, E., K. Park, V. Pastena, 1991. The financial and market effects of the SEC’s accounting and auditing enforcement releases. Journal of Accounting Research 29 (Supplement): 107-142. Freeman, R., 1987. The association between accounting earnings and security returns for large and small firms. Journal of Accounting & Economics 9, 195–228. Government Accountability Office (2002). Financial statement restatements, trends, market impacts, regulatory responses, and remaining challenges. GAO-03-138. Government Accountability Office (2006). Financial restatements: Update of public company trends, market impacts, and regulatory enforcement activities. GAO-06-678. Hayn, C. 1995. The information content of losses. Journal of Accounting & Economics, 7:85-107. Healy, P. and Palepu, K., 2001. A review of the empirical disclosure literature. Journal of Accounting & Economics 31, pp. 405–440. Hennes, K., Leone, A. and Miller, B. 2007. “The Importance of Distinguishing Errors from Irregularities in Restatement Research: The Case of Restatements and CEO/CFO Turnover." Working Paper. Herz, R. 2005. “Remarks Before the 2005 AICPA National Conference on Current SEC and PCAOB Developments.” Speech given by the FASB Chairman, Washington D.C., Dec 6. http://www.iasplus.com/usa/0512aicpaherz.pdf. Herz, R. 2007. “Specialized industry accounting and reporting. Too much of a good thing?.” Speech given by the FASB Chairman, 26th Annual SEC and Financial Reporting Institute Conference, May 31.
35
H.R. 755, February 27, 2007. Promoting Transparency in Financial Reporting Act of 2007. U.S. House of Representatives. Hribar, P., & Jenkins, N., 2004. The effect of accounting restatements on earnings revisions and the estimated cost of capital. The Review of Accounting Studies, 9, 337–356 Iselin, E., 1988. The effects of information load and information diversity on decision quality in a structured, decision task. Accounting, Organizations and Society 13 (2): 147-164. Kama, I. 2004. Revenue and earnings as key value drivers in various contexts: Implications for financial management and statement analysis. Working paper: London Business School. Karpoff, J., Lee. D., and Martin, G., 2007. The Consequences to Managers for Financial Misrepresentation. Working Paper. Available at SSRN: http://ssrn.com/abstract=933333. Kinney, W., and L. McDaniel. 1989. Characteristics of firms correcting previously reported quarterly earnings. Journal of Accounting & Economics 11 (February): 71-93. Leftwich, R., 1983. Accounting information in private markets: evidence from private lending agreements. The Accounting Review 58 (1) 23–43. Li, F., 2006. Annual Report Readability, Current Earnings, and Earnings Persistence. Ross School of Business Paper No. 1028, University of Michigan. Palmrose, Z., Scholz, S., 2004. The circumstances and legal consequences of non-GAAP reporting: Evidence from restatements. Contemporary Accounting Research, 21, 139. Palmrose, Z., Richardson, V., Scholz, S., 2004. Determinants of market reactions to restatement announcements. Journal of Accounting & Economics 37, 59–89. Parsons, S., 2001. Qualitative methods for reasoning under uncertainty. The MIT Press. Payne, J., 1976. Task complexity and contingent processing in decision making: An information search and protocol analysis. Organizational Behavior and Human Performance 16 (2): 366-387. Picconi, M., 2004. The perils of pensions: Does pension accounting lead investors and analysts astray? Working Paper, Cornell University. Plumlee, M., 2003. The effect of information complexity on analysts’ use of that information. The Accounting Review 78 1, 275–296. Plummer, E. and D. Mest. 2001. Evidence on the management of earnings components, Journal of Accounting, Auditing and Finance, 16: 301-323. Rees and Sivaramakrishnan, 2007. The Effect of Meeting or Beating Revenue Forecasts on the Association between Quarterly Returns and Earnings Forecast Errors. Contemporary Accounting Research Vol 24.1, 259-290. Richardson, S., Tuna, I., Wu, M., 2003. Predicting earnings management: the case of earnings restatements. Unpublished working paper. University of Michigan.
36

Schick, A., Gorden, L., and Haka, S. 1990. Information overload: A temporal approach. Accounting Organizations and Society 15:199–220. Schneider, C., November 2005. FASB Chips Away at Revenue Recognition, CFO Magazine Skinner, D., 1994. Why firms voluntarily disclose bad news. Journal of Accounting Research 32, 38–61. Sondhi, A. and S. Taub, 2006. Miller Revenue Recognition Guide. CCH Incorporated. Srinivasan, S., 2005. Consequences of financial reporting failure for outside directors: Evidence from accounting restatements and audit committee members. Journal of Accounting Research 43 (2), 291-334. Stubben, S., 2006. Do Firms Use Discretionary Revenues to Meet Earnings and Revenue Targets? Dissertation, Stanford Graduate School of Business. Turner, L. 2001. “The Times, They Are a-Changing.” Speech by SEC Chief Accountant, 33rd Rocky Mountain Securities Conference, Denver, Colorado, May 18. www.sec.gov/news/speech/spch493.htm. Tversky, A. and D. Kahneman, 1974. Judgement under uncertainty: Heuristics and biases. Science 185: 1124-1131. Warner, J., Watts, R. and Wruck, K. 1988. Stock prices and top management changes. Journal of Financial Economics 20: 461-492. Zhang, Y., 2006. An Empirical Analysis of Revenue Manipulation. Working Paper, Columbia University.
37
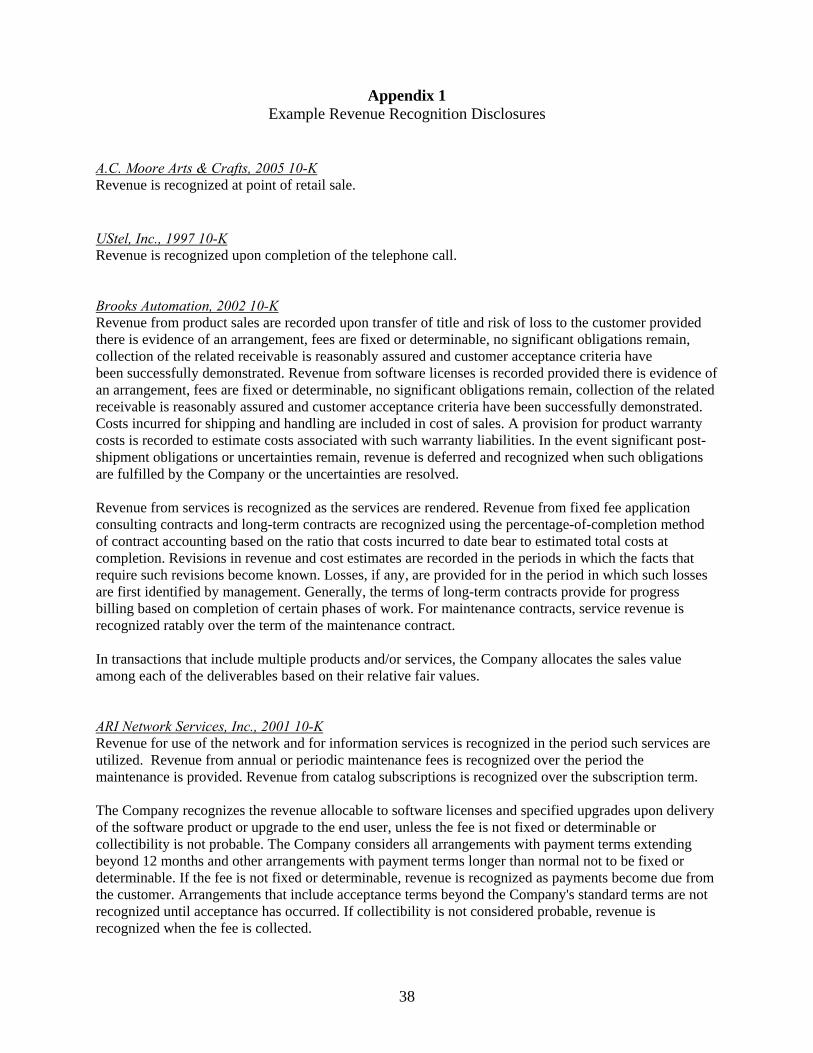
Appendix 1 Example Revenue Recognition Disclosures
A.C. Moore Arts & Crafts, 2005 10-K Revenue is recognized at point of retail sale. UStel, Inc., 1997 10-K Revenue is recognized upon completion of the telephone call. Brooks Automation, 2002 10-K Revenue from product sales are recorded upon transfer of title and risk of loss to the customer provided there is evidence of an arrangement, fees are fixed or determinable, no significant obligations remain, collection of the related receivable is reasonably assured and customer acceptance criteria have been successfully demonstrated. Revenue from software licenses is recorded provided there is evidence of an arrangement, fees are fixed or determinable, no significant obligations remain, collection of the related receivable is reasonably assured and customer acceptance criteria have been successfully demonstrated. Costs incurred for shipping and handling are included in cost of sales. A provision for product warranty costs is recorded to estimate costs associated with such warranty liabilities. In the event significant post-shipment obligations or uncertainties remain, revenue is deferred and recognized when such obligations are fulfilled by the Company or the uncertainties are resolved. Revenue from services is recognized as the services are rendered. Revenue from fixed fee application consulting contracts and long-term contracts are recognized using the percentage-of-completion method of contract accounting based on the ratio that costs incurred to date bear to estimated total costs at completion. Revisions in revenue and cost estimates are recorded in the periods in which the facts that require such revisions become known. Losses, if any, are provided for in the period in which such losses are first identified by management. Generally, the terms of long-term contracts provide for progress billing based on completion of certain phases of work. For maintenance contracts, service revenue is recognized ratably over the term of the maintenance contract. In transactions that include multiple products and/or services, the Company allocates the sales value among each of the deliverables based on their relative fair values. ARI Network Services, Inc., 2001 10-K Revenue for use of the network and for information services is recognized in the period such services are utilized. Revenue from annual or periodic maintenance fees is recognized over the period the maintenance is provided. Revenue from catalog subscriptions is recognized over the subscription term. The Company recognizes the revenue allocable to software licenses and specified upgrades upon delivery of the software product or upgrade to the end user, unless the fee is not fixed or determinable or collectibility is not probable. The Company considers all arrangements with payment terms extending beyond 12 months and other arrangements with payment terms longer than normal not to be fixed or determinable. If the fee is not fixed or determinable, revenue is recognized as payments become due from the customer. Arrangements that include acceptance terms beyond the Company's standard terms are not recognized until acceptance has occurred. If collectibility is not considered probable, revenue is recognized when the fee is collected.
38
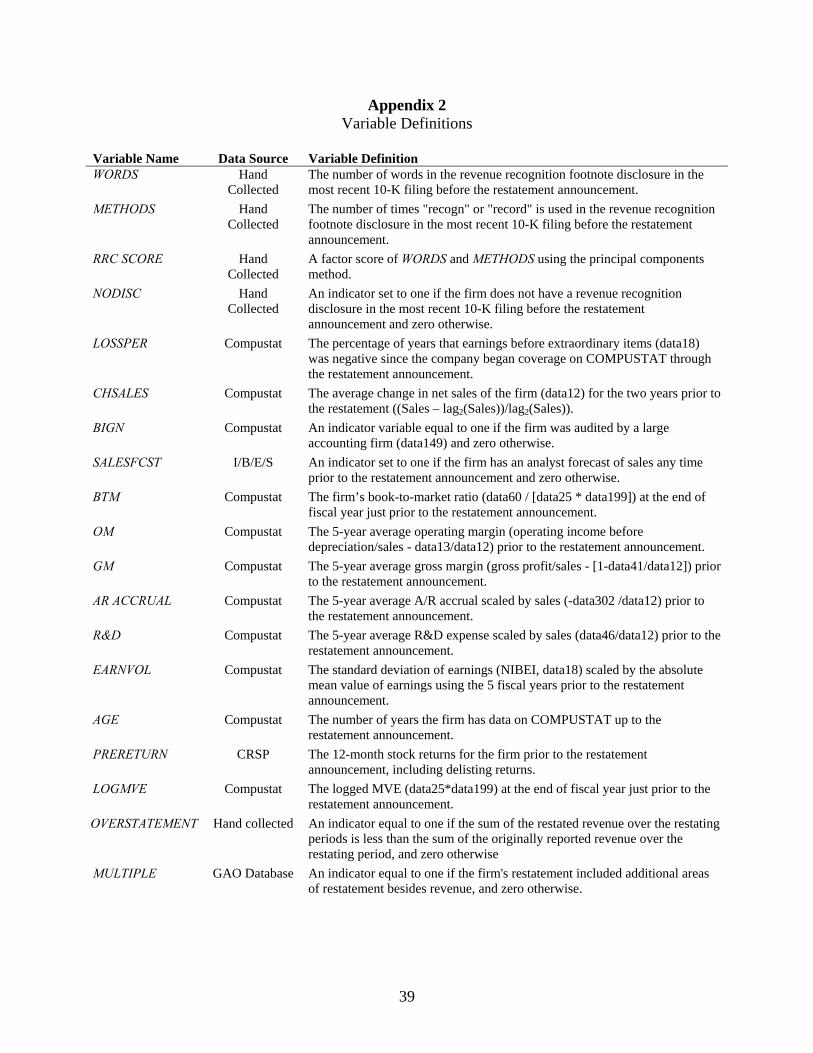
Appendix 2 Variable Definitions
Variable Name Data Source Variable Definition WORDS Hand
Collected The number of words in the revenue recognition footnote disclosure in the most recent 10-K filing before the restatement announcement.
METHODS Hand Collected
The number of times "recogn" or "record" is used in the revenue recognition footnote disclosure in the most recent 10-K filing before the restatement announcement.
RRC SCORE Hand Collected
A factor score of WORDS and METHODS using the principal components method.
NODISC Hand Collected
An indicator set to one if the firm does not have a revenue recognition disclosure in the most recent 10-K filing before the restatement announcement and zero otherwise.
LOSSPER Compustat The percentage of years that earnings before extraordinary items (data18) was negative since the company began coverage on COMPUSTAT through the restatement announcement.
CHSALES Compustat The average change in net sales of the firm (data12) for the two years prior to the restatement ((Sales – lag2(Sales))/lag2(Sales)).
BIGN Compustat An indicator variable equal to one if the firm was audited by a large accounting firm (data149) and zero otherwise.
SALESFCST I/B/E/S An indicator set to one if the firm has an analyst forecast of sales any time prior to the restatement announcement and zero otherwise.
BTM Compustat The firm’s book-to-market ratio (data60 / [data25 * data199]) at the end of fiscal year just prior to the restatement announcement.
OM Compustat The 5-year average operating margin (operating income before depreciation/sales - data13/data12) prior to the restatement announcement.
GM Compustat The 5-year average gross margin (gross profit/sales - [1-data41/data12]) prior to the restatement announcement.
AR ACCRUAL Compustat The 5-year average A/R accrual scaled by sales (-data302 /data12) prior to the restatement announcement.
R&D Compustat The 5-year average R&D expense scaled by sales (data46/data12) prior to the restatement announcement.
EARNVOL Compustat The standard deviation of earnings (NIBEI, data18) scaled by the absolute mean value of earnings using the 5 fiscal years prior to the restatement announcement.
AGE Compustat The number of years the firm has data on COMPUSTAT up to the restatement announcement.
PRERETURN CRSP The 12-month stock returns for the firm prior to the restatement announcement, including delisting returns.
LOGMVE Compustat The logged MVE (data25*data199) at the end of fiscal year just prior to the restatement announcement.
OVERSTATEMENT Hand collected An indicator equal to one if the sum of the restated revenue over the restating periods is less than the sum of the originally reported revenue over the restating period, and zero otherwise
MULTIPLE GAO Database An indicator equal to one if the firm's restatement included additional areas of restatement besides revenue, and zero otherwise.
39

V
40
ariable Name Data Source Variable Definition MISS GROWTH Compustat and
Hand Collected
An indicator equal to one if first restating period had positive sales growth prior to the restatement and zero or negative sales growth after the restatement, and zero otherwise.
MISS FCST I/B/E/S and Hand
Collected
An indicator equal to one if for the first restating period (1) the firm had an analyst revenue forecast, (2) the firm had previously beat the analyst revenue forecast for that period, and (3) the restatement caused the firm to miss for that period, and zero otherwise.
AAER Dechow et al. (2007)
AAER is an indicator set to one if the firm has an SEC AAER related to revenue or receivables within 2 years of the restatement announcement.
CAR CRSP The 5-day cumulative abnormal return centered on the restatement announcement date. Abnormal returns are market adjusted returns and calculated as the raw return for the firm less the market return for each day.
CEO LEFT Execucomp & Hand
Collected
An indicator set to one if the CEO resigns or is terminated within two years of the restatement announcement, but excludes CEO resignation where the former CEO retains a Chair or a Director position.
RESTLEN Hand Collected
The number of quarters the firm restated.
CHREV Hand Collected
The percentage change in revenue over all periods of the restatement due to the restatement.
CHNI Hand Collected
The percentage change in income over all periods of the restatement due to the restatement.
ROA Compustat The return on assets (NIBEI/Assets – data18/data6) for the fiscal year just prior to the restatement announcement
POSTRETURN CRSP The 12-month stock returns for the firm following the restatement announcement, including delisting returns.
SUBJECTIVE Hand Collected
A count variable equal to the number of subjective revenue recognition methods identified in the revenue recognition disclosure. I search for the following key words: “percentage of completion” or “percentage-of-completion”, “multiple deliverables”, “vendor-specific objective evidence” or “VSOE”, “barter” or “non-monetary”, and “fair value” or “fair-value.”
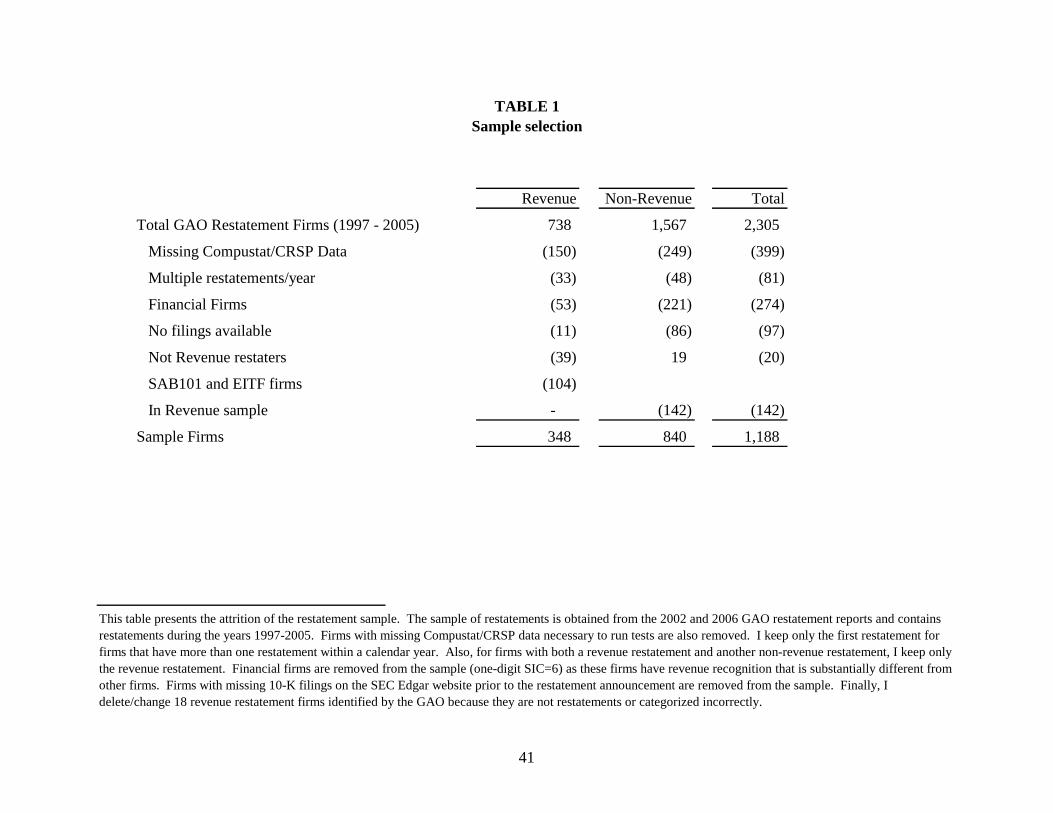
Revenue Non-Revenue Total
Total GAO Restatement Firms (1997 - 2005) 738 1,567 2,305
Missing Compustat/CRSP Data (150) (249) (399)
Multiple restatements/year (33) (48) (81)
Financial Firms (53) (221) (274)
No filings available (11) (86) (97)
Not Revenue restaters (39) 19 (20)
SAB101 and EITF firms (104)
In Revenue sample - (142) (142)
Sample Firms 348 840 1,188
TABLE 1Sample selection
This table presents the attrition of the restatement sample. The sample of restatements is obtained from the 2002 and 2006 GAO restatement reports and contains restatements during the years 1997-2005. Firms with missing Compustat/CRSP data necessary to run tests are also removed. I keep only the first restatement for firms that have more than one restatement within a calendar year. Also, for firms with both a revenue restatement and another non-revenue restatement, I keep only the revenue restatement. Financial firms are removed from the sample (one-digit SIC=6) as these firms have revenue recognition that is substantially different from other firms. Firms with missing 10-K filings on the SEC Edgar website prior to the restatement announcement are removed from the sample. Finally, I delete/change 18 revenue restatement firms identified by the GAO because they are not restatements or categorized incorrectly.
41
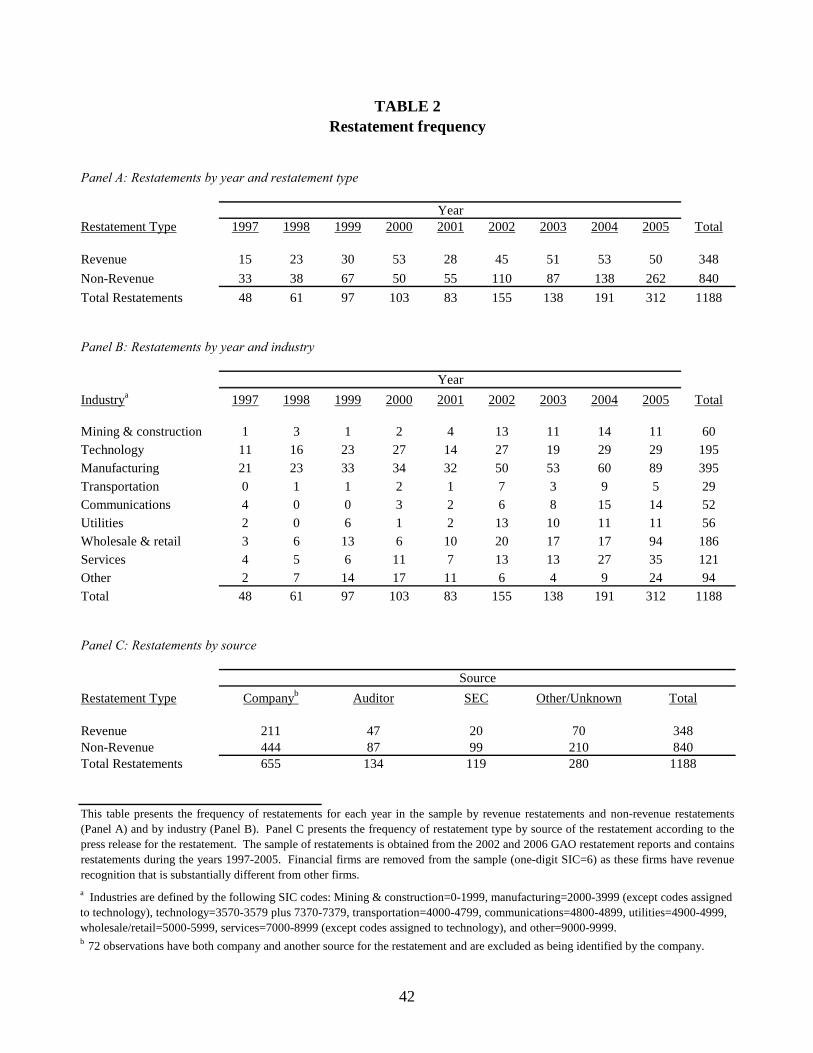
Panel
R
42
A: Restatements by year and restatement type
estatement Type
MiTMTCUtilitiesWSOT
Panel
R
ning & construction 1 3 1 2 4 13 11 14 11 60echnology 11 16 23 27 14 27 19 29 29 195anufacturing 21 23 33 34 32 50 53 60 89 395
ransportation 0 1 1 2 1 7 3 9 5 29ommunications 4 0 0 3 2 6 8 15 14 52
2 0 6 1 2 13 10 11 11 56holesale & retail 3 6 13 6 10 20 17 17 94 186
ervices 4 5 6 11 7 13 13 27 35 121ther 2 7 14 17 11 6 4 9 24 94otal 48 61 97 103 83 155 138 191 312 1188
C: Restatements by source
estatement Type
1997 1998 1999 2000 2001 2002 2003 2004 2005 Total
Revenue 15 23 30 53 28 45 51 53 50 348Non-Revenue 33 38 67 50 55 110 87 138 262 840Total Restatements 48 61 97 103 83 155 138 191 312 1188
Panel
In
B: Restatements by year and industry
dustrya 1997 1998 1999 2000 2001 2002 2003 2004 2005 Total
ReNT
venueon-Revenueotal Restatements
SEC Other/Unknown
TABLE 2
T(Pprrere
Year
Restatement frequency
b
his table presents the frequency of restatements for each year in the sample by revenue restatements and non-revenue restatementsanel A) and by industry (Panel B). Panel C presents the frequency of restatement type by source of the restatement according to theess release for the restatement. The sample of restatements is obtained from the 2002 and 2006 GAO restatement reports and containsstatements during the years 1997-2005. Financial firms are removed from the sample (one-digit SIC=6) as these firms have revenuecognition that is substantially different from other firms.
Year
72 observations have both company and another source for the restatement and are excluded as being identified by the company.
99 210
Total
211 47 20 70 348
Companyb Auditor
134655
Source
ndustries are defined by the following SIC codes: Mining & construction=0-1999, manufacturing=2000-3999 (except codes assigned chnology), technology=3570-3579 plus 7370-7379, transportation=4000-4799, communications=4800-4899, utilities=4900-4999,
holesale/retail=5000-5999, services=7000-8999 (except codes assigned to technology), and other=9000-9999.
8401188280119
444 87
a Ito tew
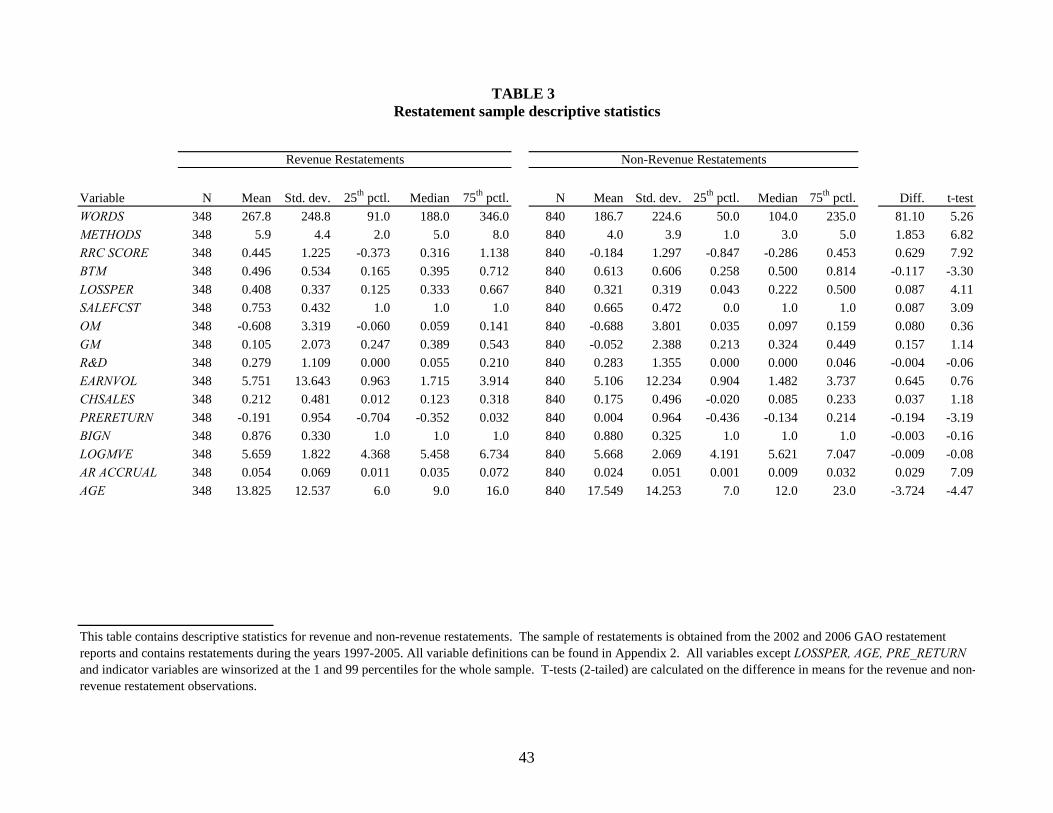
Variable N Mean Std. dev. 25th pctl. Median 75th pctl. N Mean Std. dev. 25th pctl. Median 75th pctl. Diff. t-testWORDS 348 267.8 248.8 91.0 188.0 346.0 840 186.7 224.6 50.0 104.0 235.0 81.10 5.26METHODS 348 5.9 4.4 2.0 5.0 8.0 840 4.0 3.9 1.0 3.0 5.0 1.853 6.82RRC SCORE 348 0.445 1.225 -0.373 0.316 1.138 840 -0.184 1.297 -0.847 -0.286 0.453 0.629 7.92BTM 348 0.496 0.534 0.165 0.395 0.712 840 0.613 0.606 0.258 0.500 0.814 -0.117 -3.30LOSSPER 348 0.408 0.337 0.125 0.333 0.667 840 0.321 0.319 0.043 0.222 0.500 0.087 4.11SALEFCST 348 0.753 0.432 1.0 1.0 1.0 840 0.665 0.472 0.0 1.0 1.0 0.087 3.09OM 348 -0.608 3.319 -0.060 0.059 0.141 840 -0.688 3.801 0.035 0.097 0.159 0.080 0.36GM 348 0.105 2.073 0.247 0.389 0.543 840 -0.052 2.388 0.213 0.324 0.449 0.157 1.14R&D 348 0.279 1.109 0.000 0.055 0.210 840 0.283 1.355 0.000 0.000 0.046 -0.004 -0.06EARNVOL 348 5.751 13.643 0.963 1.715 3.914 840 5.106 12.234 0.904 1.482 3.737 0.645 0.76CHSALES 348 0.212 0.481 0.012 0.123 0.318 840 0.175 0.496 -0.020 0.085 0.233 0.037 1.18PRERETURN 348 -0.191 0.954 -0.704 -0.352 0.032 840 0.004 0.964 -0.436 -0.134 0.214 -0.194 -3.19BIGN 348 0.876 0.330 1.0 1.0 1.0 840 0.880 0.325 1.0 1.0 1.0 -0.003 -0.16LOGMVE 348 5.659 1.822 4.368 5.458 6.734 840 5.668 2.069 4.191 5.621 7.047 -0.009 -0.08AR ACCRUAL 348 0.054 0.069 0.011 0.035 0.072 840 0.024 0.051 0.001 0.009 0.032 0.029 7.09AGE 348 13.825 12.537 6.0 9.0 16.0 840 17.549 14.253 7.0 12.0 23.0 -3.724 -4.47
This table contains descriptive statistics for revenue and non-revenue restatements. The sample of restatements is obtained from the 2002 and 2006 GAO restatement reports and contains restatements during the years 1997-2005. All variable definitions can be found in Appendix 2. All variables except LOSSPER, AGE, PRE_RETURN and indicator variables are winsorized at the 1 and 99 percentiles for the whole sample. T-tests (2-tailed) are calculated on the difference in means for the revenue and non-revenue restatement observations.
TABLE 3
Revenue Restatements Non-Revenue Restatements
Restatement sample descriptive statistics
43
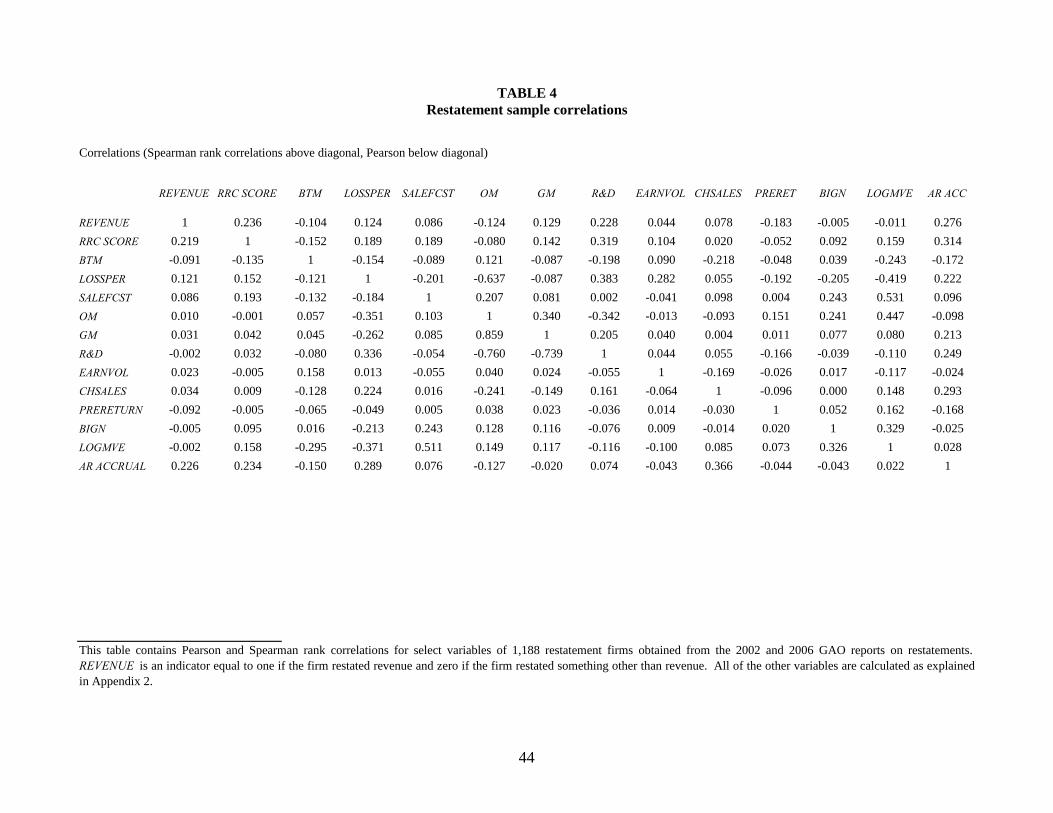
Correlations (Spearman rank correlations above diagonal, Pearson below diagonal)
REVENUE RRC SCORE BTM LOSSPER SALEFCST OM GM R&D EARNVOL CHSALES PRERET BIGN LOGMVE AR ACC
REVENUE 1 0.236 -0.104 0.124 0.086 -0.124 0.129 0.228 0.044 0.078 -0.183 -0.005 -0.011 0.276RRC SCORE 0.219 1 -0.152 0.189 0.189 -0.080 0.142 0.319 0.104 0.020 -0.052 0.092 0.159 0.314BTM -0.091 -0.135 1 -0.154 -0.089 0.121 -0.087 -0.198 0.090 -0.218 -0.048 0.039 -0.243 -0.172LOSSPER 0.121 0.152 -0.121 1 -0.201 -0.637 -0.087 0.383 0.282 0.055 -0.192 -0.205 -0.419 0.222SALEFCST 0.086 0.193 -0.132 -0.184 1 0.207 0.081 0.002 -0.041 0.098 0.004 0.243 0.531 0.096OM 0.010 -0.001 0.057 -0.351 0.103 1 0.340 -0.342 -0.013 -0.093 0.151 0.241 0.447 -0.098GM 0.031 0.042 0.045 -0.262 0.085 0.859 1 0.205 0.040 0.004 0.011 0.077 0.080 0.213R&D -0.002 0.032 -0.080 0.336 -0.054 -0.760 -0.739 1 0.044 0.055 -0.166 -0.039 -0.110 0.249EARNVOL 0.023 -0.005 0.158 0.013 -0.055 0.040 0.024 -0.055 1 -0.169 -0.026 0.017 -0.117 -0.024CHSALES 0.034 0.009 -0.128 0.224 0.016 -0.241 -0.149 0.161 -0.064 1 -0.096 0.000 0.148 0.293PRERETURN -0.092 -0.005 -0.065 -0.049 0.005 0.038 0.023 -0.036 0.014 -0.030 1 0.052 0.162 -0.168BIGN -0.005 0.095 0.016 -0.213 0.243 0.128 0.116 -0.076 0.009 -0.014 0.020 1 0.329 -0.025LOGMVE -0.002 0.158 -0.295 -0.371 0.511 0.149 0.117 -0.116 -0.100 0.085 0.073 0.326 1 0.028AR ACCRUAL 0.226 0.234 -0.150 0.289 0.076 -0.127 -0.020 0.074 -0.043 0.366 -0.044 -0.043 0.022 1
This table contains Pearson and Spearman rank correlations for select variables of 1,188 restatement firms obtained from the 2002 and 2006 GAO reports on restatements.REVENUE is an indicator equal to one if the firm restated revenue and zero if the firm restated something other than revenue. All of the other variables are calculated as explainedin Appendix 2.
TABLE 4Restatement sample correlations
44
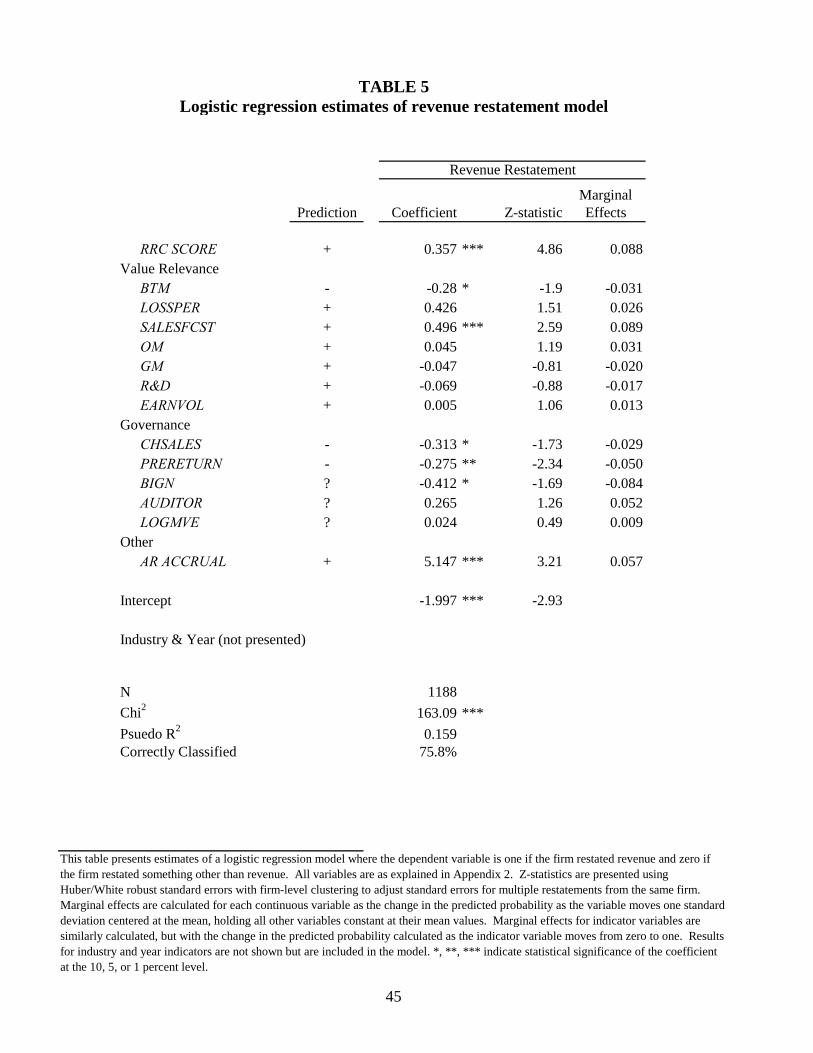
45
OM + 0.045 1.19 0.031GM + -0.047 -0.81 -0.020R&D + -0.069 -0.88 -0.017EARNVOL + 0.005 1.06 0.013
GovernanceCHSALES - -0.313 * -1.73 -0.029PRERETURN - -0.275 ** -2.34 -0.050BIGN ? -0.412 * -1.69 -0.084AUDITOR ? 0.265 1.26 0.052LOGMVE ? 0.024 0.49 0.009
OtherAR ACCRUAL + 5.147 *** 3.21 0.057
Intercept -1.997 *** -2.93
Industry & Year (not presented)
N 1188 Chi2 163.09 ***Psuedo R2 0.159 Correctly Classified 75.8%
ble presents estimates of a logistic regression model where the dependent variable is one if the firm restated revenue and zero if restated something other than revenue. All variables are as explained in Appendix 2. Z-statistics are presented using
r/White robust standard errors with firm-level clustering to adjust standard errors for multiple restatements from the same firm. l effects are calculated for each continuous variable as the change in the predicted probability as the variable moves one standard n centered at the mean, holding all other variables constant at their mean values. Marginal effects for indicator variables are
rly calculated, but with the change in the predicted probability calculated as the indicator variable moves from zero to one. Results dustry and year indicators are not shown but are included in the model. *, **, *** indicate statistical significance of the coefficient 10, 5, or 1 percent level.
MarginalPrediction Coefficient Z-statistic Effects
RRC SCORE + 0.357 *** 4.86 0.088Value Relevance
BTM - -0.28 * -1.9 -0.031LOSSPER + 0.426 1.51 0.026SALESFCST + 0.496 *** 2.59 0.089
Revenue Restatement
This tathe firmHubeMarginadeviatiosimilafor inat the
TABLE 5Logistic regression estimates of revenue restatement model
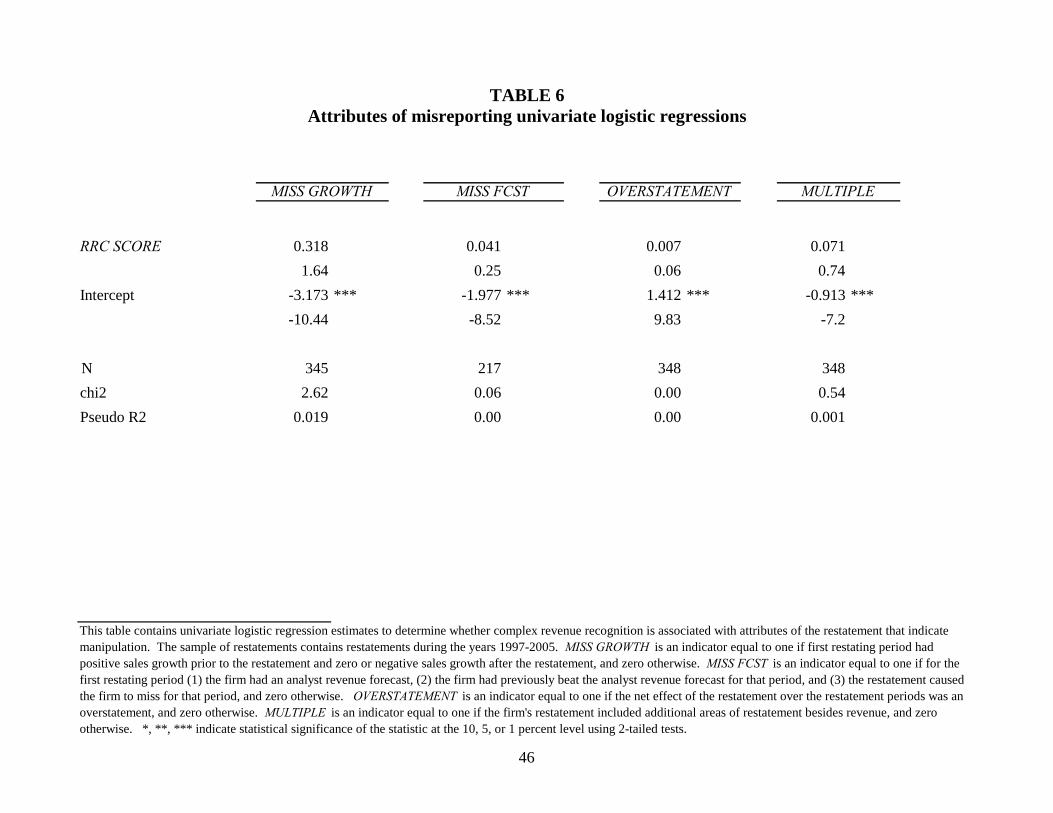
46
RRC SCORE 0.318 0.041 0.007 0.071 1.64 0.25 0.06 0.74 Intercept -3.173 *** -1.977 *** 1.412 *** -0.913 *** -10.44 -8.52 9.83 -7.2
N 345 217 348 348 chi2 2.62 0.06 0.00 0.54 Pseudo R2 0.019 0.00 0.00 0.001
This table contains univariate logistic regression estimates to determine whether complex revenue recognition is associated with attributes of the restatement that indicate manipulation. The sample of restatements contains restatements during the years 1997-2005. MISS GROWTH is an indicator equal to one if first restating period had positive sales growth prior to the restatement and zero or negative sales growth after the restatement, and zero otherwise. MISS FCST is an indicator equal to one if for the first restating period (1) the firm had an analyst revenue forecast, (2) the firm had previously beat the analyst revenue forecast for that period, and (3) the restatement caused the firm to miss for that period, and zero otherwise. OVERSTATEMENT is an indicator equal to one if the net effect of the restatement over the restatement periods was an overstatement, and zero otherwise. MULTIPLE is an indicator equal to one if the firm's restatement included additional areas of restatement besides revenue, and zero otherwise. *, **, *** indicate statistical significance of the statistic at the 10, 5, or 1 percent level using 2-tailed tests.
TABLE 6
MISS GROWTH MISS FCST OVERSTATEMENT MULTIPLE
Attributes of misreporting univariate logistic regressions
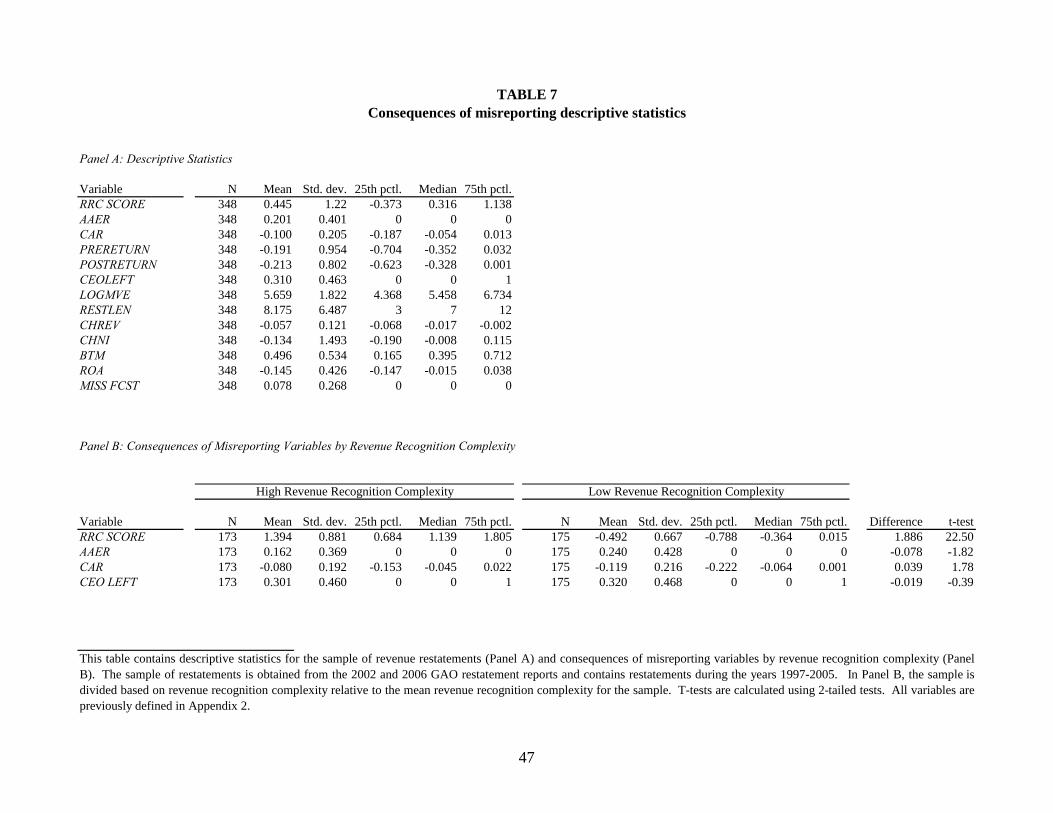
Panel A: Descriptive Statistics
Variable N Mean Std. dev. 25th pctl. Median 75th pctl.RRC SCORE 348 0.445 1.22 -0.373 0.316 1.138AAER 348 0.201 0.401 0 0 0CAR 348 -0.100 0.205 -0.187 -0.054 0.013PRERETURN 348 -0.191 0.954 -0.704 -0.352 0.032POSTRETURN 348 -0.213 0.802 -0.623 -0.328 0.001CEOLEFT 348 0.310 0.463 0 0 1LOGMVE 348 5.659 1.822 4.368 5.458 6.734RESTLEN 348 8.175 6.487 3 7 12CHREV 348 -0.057 0.121 -0.068 -0.017 -0.002CHNI 348 -0.134 1.493 -0.190 -0.008 0.115BTM 348 0.496 0.534 0.165 0.395 0.712ROA 348 -0.145 0.426 -0.147 -0.015 0.038MISS FCST 348 0.078 0.268 0 0 0
Panel B: Consequences of Misreporting Variables by Revenue Recognition Complexity
Variable N Mean Std. dev. 25th pctl. Median 75th pctl. N Mean Std. dev. 25th pctl. Median 75th pctl. Difference t-testRRC SCORE 173 1.394 0.881 0.684 1.139 1.805 175 -0.492 0.667 -0.788 -0.364 0.015 1.886 22.50AAER 173 0.162 0.369 0 0 0 175 0.240 0.428 0 0 0 -0.078 -1.82CAR 173 -0.080 0.192 -0.153 -0.045 0.022 175 -0.119 0.216 -0.222 -0.064 0.001 0.039 1.78CEO LEFT 173 0.301 0.460 0 0 1 175 0.320 0.468 0 0 1 -0.019 -0.39
This table contains descriptive statistics for the sample of revenue restatements (Panel A) and consequences of misreporting variables by revenue recognition complexity (PanelB). The sample of restatements is obtained from the 2002 and 2006 GAO restatement reports and contains restatements during the years 1997-2005. In Panel B, the sample isdivided based on revenue recognition complexity relative to the mean revenue recognition complexity for the sample. T-tests are calculated using 2-tailed tests. All variables arepreviously defined in Appendix 2.
TABLE 7
High Revenue Recognition Complexity Low Revenue Recognition Complexity
Consequences of misreporting descriptive statistics
47
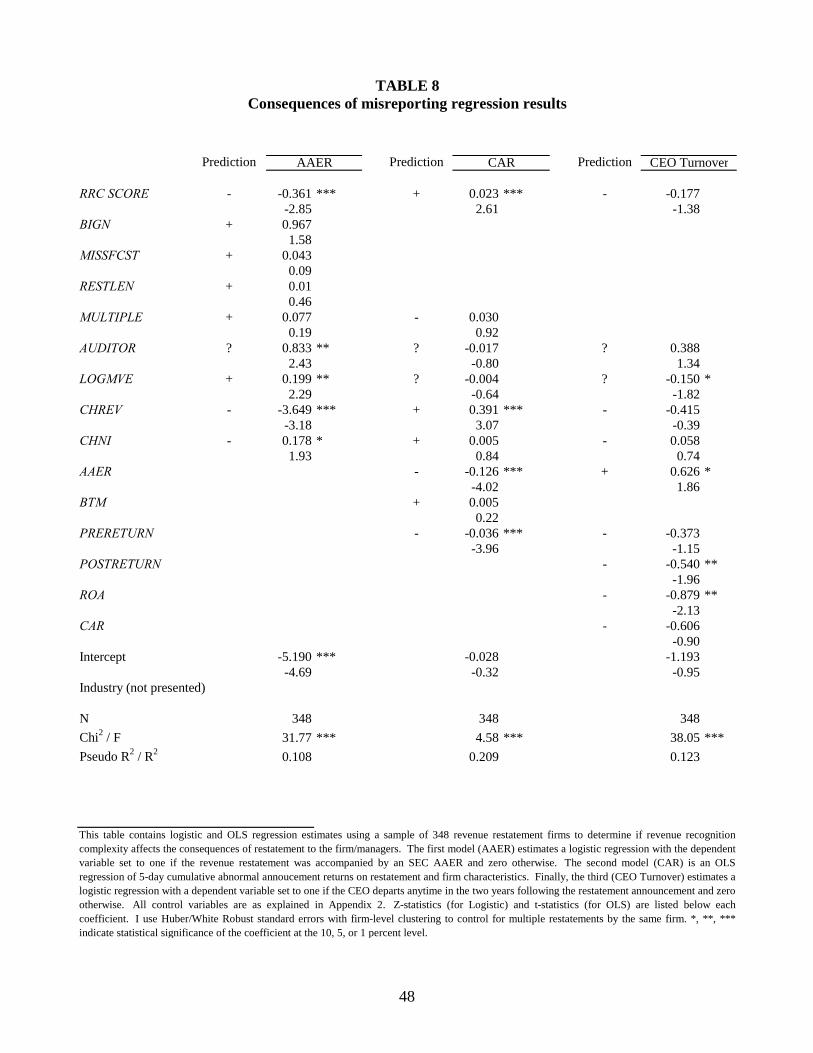
Prediction Prediction Prediction
RRC SCORE - -0.361 *** + 0.023 *** - -0.177 -2.85 2.61 -1.38
BIGN + 0.967 1.58
MISSFCST + 0.043 0.09
RESTLEN + 0.01 0.46
MULTIPLE + 0.077 - 0.030 0.19 0.92
AUDITOR ? 0.833 ** ? -0.017 ? 0.388 2.43 -0.80 1.34
LOGMVE + 0.199 ** ? -0.004 ? -0.150 * 2.29 -0.64 -1.82
CHREV - -3.649 *** + 0.391 *** - -0.415 -3.18 3.07 -0.39
CHNI - 0.178 * + 0.005 - 0.058 1.93 0.84 0.74
AAER - -0.126 *** + 0.626 * -4.02 1.86
BTM + 0.005 0.22
PRERETURN - -0.036 *** - -0.373 -3.96 -1.15
POSTRETURN - -0.540 ** -1.96
ROA - -0.879 ** -2.13
CAR - -0.606 -0.90
Intercept -5.190 *** -0.028 -1.193 -4.69 -0.32 -0.95
Industry (not presented)
N 348 348 348 Chi2 / F 31.77 *** 4.58 *** 38.05 ***Pseudo R2 / R2 0.108 0.209 0.123
TABLE 8
This table contains logistic and OLS regression estimates using a sample of 348 revenue restatement firms to determine if revenue recognitioncomplexity affects the consequences of restatement to the firm/managers. The first model (AAER) estimates a logistic regression with the dependentvariable set to one if the revenue restatement was accompanied by an SEC AAER and zero otherwise. The second model (CAR) is an OLSregression of 5-day cumulative abnormal annoucement returns on restatement and firm characteristics. Finally, the third (CEO Turnover) estimates alogistic regression with a dependent variable set to one if the CEO departs anytime in the two years following the restatement announcement and zerootherwise. All control variables are as explained in Appendix 2. Z-statistics (for Logistic) and t-statistics (for OLS) are listed below eachcoefficient. I use Huber/White Robust standard errors with firm-level clustering to control for multiple restatements by the same firm. *, **, ***indicate statistical significance of the coefficient at the 10, 5, or 1 percent level.
AAER CEO Turnover
Consequences of misreporting regression results
CAR
48