the highways agency roadside air pollution monitoring network report...
TRANSCRIPT
Transport Research Laboratory
The Highways Agency roadside air
pollution monitoring network report -
2010 Volume I
by J Pittman, D Gardiner and E Anderson
CPR1095 (I)
443 (1308) HALC
PROJECT REPORT

Transport Research Laboratory
PROJECT REPORT CPR1095 (I)
The Highways Agency roadside air pollution monitoring network report - 2010 Volume I
by J Pittman, D Gardiner and E Anderson
Prepared for: Project Record: 443 (1038) HALC
Impact of reduced emissions on air quality -
2010
Client: Highways Agency
(Andrew Bean)
Copyright Transport Research Laboratory March 2011
The views expressed are those of the author(s) and not necessarily those of Highways
Agency.
Name Date
Approved
Project
Manager Julia Pittman 03/05/2011
Technical
Referee David Gardiner 03/05/2011
Project Report
TRL CPR1095
Contents Amendment Record
This report has been issued and amended as follows
Version Date Description Editor Technical
Referee
1 18/01/11 Initial draft Trine Velling D Gardiner
2 22/03/11 Revised draft Julia Pittman /
Emma Anderson
D Gardiner
Final 29/03/2011 Revised draft including sponsors comments
Julia Pittman/ Dave Gardiner
D Gardiner

Project Report
TRL CPR1095
Executive summary
This report is the Tenth and final in a series summarising air pollutant concentrations,
meteorological data and traffic flows measured at sites across the Highways Agency long
term roadside monitoring network. The network comprises of four monitoring sites
located on the M4, M25 and M60 motorways and in the Bell Common Tunnel on the M25
motorway. The monitoring at Bell Common Tunnel site was affected by road widening
works which took place between 2008 and 2010. The ongoing roadwork’s restricted the
access to the monitoring site and as a result there were only two months of monitoring
data reported for Bell Common Tunnel. The data collected at Bell Common Tunnel is
included in this report but is not compared to the air quality objectives as a result of the
low data capture rate across the year. Concentrations of carbon monoxide (CO), oxides
of nitrogen (NOX), nitric oxide (NO), nitrogen dioxide (NO2) were measured at all sites.
In addition, concentrations of total hydrocarbons (methane (CH4) and non-methane
hydrocarbons (HC)), ammonia (NH3), particulate matter (PM10 and PM2.5) and ozone (O3)
were measured at the M4, M25 and M60 motorway sites and concentrations of sulphur
dioxide (SO2), hydrogen sulphide (H2S), aromatic hydrocarbons, polycyclic aromatic
hydrocarbons (PAH), aldehydes and metals were measured at the M25 and M60
motorway sites. Meteorological data (including wind speed, wind direction, temperature
and relative humidity) were collected at the M4, M25 and M60 motorway sites and solar
radiation was measured at the M25 site. Traffic flows were recorded at the M25, M4, &
M60 sites. No traffic data was available at the Bell Common site as a result of the
ongoing tunnel refurbishment work. The air pollution monitoring equipment used at each
site is comparable with equipment used in similar monitoring stations within the UK
National Air Quality Monitoring Network.
Table 0-1 provides a summary of statistics generated from data collected during 2010 at
each of the monitoring sites and compares this with objectives set out by the Air Quality
(England) Regulations 2000 (SI 2000 No. 928) and the Air Quality (England)
(Amendment) Regulations 2002 (SI 2002 No. 3043).
During 2010, the M25, M4 and M60 monitoring sites in the Highways Agency network
exceeded the NO2 annual mean objective concentration of 40 g/m3and the running 8-
hour mean objective for O3 was exceeded at the M4 and M60 site. Conversely, there
were no exceedances of the relevant objectives for SO2, PM10, PAH, benzene, CO or lead
at any of the monitoring sites during 2010.
Table 0-1: Annual summary of monitoring data recorded at sites in the
Highways Agency network, 01/01/2010 to 31/12/2010
Pollutant Objective Unit M25 M4 M60 Bell
Common
CO Max. daily running 8-hr
mean of 10 mg/m3 mg/m3 1.8 1.9 1.8 1.8
NO2
Max. of 18 exceedances of 1-hr mean of 200 g/m3
No. of exceedances
17 8 1 553
Annual mean of 40 g/m3 g/m3 61.6 47.9 49.7 187.3
O3 Max. of 10 exceedances of running 8-hr mean of 100
g/m3 g/m3 6 123 46 -
TEOM VCM adjusted
PM10
Max. of 35 exceedances of 24-hr mean of 50 µg/m3
No. of exceedances 11 3 0 -
Project Report
TRL CPR1095
Pollutant Objective Unit M25 M4 M60 Bell
Common
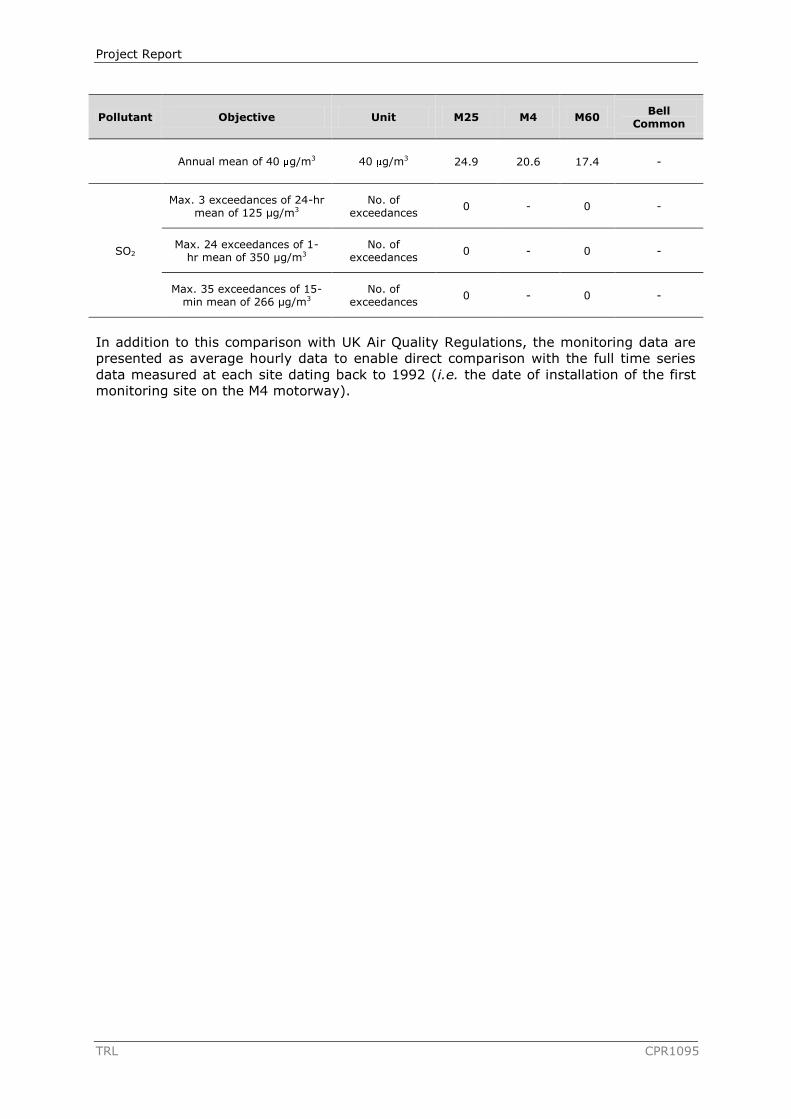
Annual mean of 40 g/m3 40 g/m3 24.9 20.6 17.4 -
SO2
Max. 3 exceedances of 24-hr mean of 125 µg/m3
No. of exceedances
0 - 0 -
Max. 24 exceedances of 1- hr mean of 350 µg/m3
No. of exceedances
0 - 0 -
Max. 35 exceedances of 15-min mean of 266 µg/m3
No. of exceedances
0 - 0 -
In addition to this comparison with UK Air Quality Regulations, the monitoring data are
presented as average hourly data to enable direct comparison with the full time series
data measured at each site dating back to 1992 (i.e. the date of installation of the first
monitoring site on the M4 motorway).

Project Report
TRL i RPN744 (I)
Contents
List of Tables iii
1 Introduction 4
2 Data collection 5
2.1 M4 (Theale 2), Pinglewood 5
2.2 M25, Bell Common Tunnel 6
2.3 M25 (M25B), Staines 6
2.4 M60, Kirkhams 8
2.5 Quality assurance and quality control 10 2.5.1 Site visits 10 2.5.2 Data checking 10 2.5.3 Data calibration and ratification 11 2.5.4 Data analysis 11
3 Compliance with UK Air Quality objectives and permitted exceedances 12
3.1 Nitrogen dioxide 12
3.2 Sulphur dioxide 16
3.3 Ozone 17
3.4 Particulate Matter 19 3.4.1 PM10 19 3.4.2 PM2.5 20
3.5 Aromatic hydrocarbons (BTEX) 21
3.6 Carbon monoxide 21
3.7 Lead 21
3.8 Pollutants not covered by the UK Air Quality Regulations 22 3.8.1 Polycyclic aromatic hydrocarbons 22 3.8.2 Aldehydes 23 3.8.3 Total hydrocarbons 23 3.8.4 Ammonia 24 *Monitoring period 7/09/2010 to 31/12/2010Error! Bookmark not defined. 3.8.5 Heavy metals 25 3.8.6 Hydrogen sulphide 26
3.9 Traffic data 26
4 Summary 28
References 29
Appendix A Figures and locations of monitoring sites 30
Appendix B Calibration and maintenance records 38
Appendix C Meteorological data 41

Project Report
TRL ii RPN744 (I)
Appendix D Air Quality Strategy objectives 42
Appendix E Conversion factors 43

Project Report
TRL iii RPN744 (I)
List of Tables
Table 0-1: Annual summary of monitoring data recorded at sites in the Highways Agency
network, 01/01/2010 to 31/12/2010 .................................................................. v
Table 2-1: Site information: M4 (Theale 2), Pinglewood ............................................. 5
Table 2-2: Site information: M25, Bell Common Tunnel .............................................. 6
Table 2-3: Site information: M25B, Staines .............................................................. 7
Table 2-4: Site information: M60, Kirkhams ............................................................. 9
Table 3-1: Compliance with UK Air Quality objectives, nitrogen dioxide (NO2) ............. 14
Table 3-2: Annual mean nitric oxide (NO) concentration .......................................... 14
Table 3-3: Annual mean total oxides of nitrogen (NOX) concentration ........................ 15
Table3-4: M25 NO2 diffusion tube results ............................................................... 16
Table3-5: M60 NO2 diffusion tube results ............................................................... 16
Table 3-6: Compliance with UK Air Quality objectives, sulphur dioxide (SO2) .............. 17
Table 3-7: Compliance with UK Air Quality objectives, ozone (O3) ............................. 19
Table 3-8: Compliance with UK Air Quality objectives, particulate matter (PM10) ......... 20
Table 3-9: Compliance with Provisional UK Air Quality objectives, particulate matter
(PM2.5) ......................................................................................................... 20
Table 3-10: Compliance with UK Air Quality objectives, benzene ............................... 21
Table 3-11: Compliance with UK Air Quality objectives, carbon monoxide (CO) ........... 21
Table 3-12: Compliance with UK Air Quality objectives, lead ..................................... 22
Table 3-13: Compliance with UK Air Quality provisional objective, benzo[a]pyrene
(B[a]P) ......................................................................................................... 23
Table 3-14: Annual mean concentration, acetaldehyde and formaldehyde .................. 23
Table 3-15: Annual mean concentration, methane (CH4) .......................................... 24
Table 3-16: Annual mean concentration, ammonia (NH3) Error! Bookmark not defined.
Table 3-17: Annual mean concentration, heavy metals ............................................ 26
Table 3-18: Annual mean concentration, hydrogen sulphide (H2S)............................. 26
Table 3-19: Annual average daily and hourly traffic flow .......................................... 27

Project Report
TRL 4 RPN744 (I)
1 Introduction
TRL (Transport Research Laboratory) has operated an air pollution monitoring network
on behalf of the Highways Agency since the early 1990s, with the first site being
installed on the M4 motorway in August 1992. In 2010, there were 4 monitoring sites in
operation:
M4 (Theale 2), Pinglewood;
M25, Bell Common Tunnel;
M25 (M25B), Staines; and
M60, Kirkhams.
These sites were installed in August 1992, January 2007, June 1995 and May 1999
respectively.
This is the tenth, and final report in a series summarising air pollutant concentrations,
meteorological data and traffic flows measured at sites across the Highways Agency
network. Monitoring data collected at previous and current sites in the network and
reports previously published as part of this series are currently available on the TRL
website1, in the future they will be located on the Highways Agency website.
This report has been structured to provide a clear overview of data collected in 2010.
The report has been split into two volumes, this volume I contains:
Section 2: Data collection – this section provides details of the location of each
automatic monitoring site, the period the site has been in operation, the equipment
installed and the method used to collect data at each site.
Section 3: Compliance with UK Air Quality Objective Concentrations and Allowed
Exceedances – this section examines compliance with objectives at each monitoring site
in 2010. Pollutants not covered under the UK Air Quality Regulations are also discussed.
Section 4: Summary – this section provides a summary and draws conclusions from the
reported data.
Volume II of the report presents time series plots for pollutant concentrations recorded
at the four monitoring sites in 2010. It also contains a summary of historical data
including comparison with air quality standards and objectives, hourly data summary
statistics and traffic flows from when each site was installed until 2010.
1 http://www.trl.co.uk/research_development/sustainability/environmental_assessment_/air_quality/air_quality_archive.htm

Project Report
TRL 5 RPN744 (I)
2 Data collection
2.1 M4 (Theale 2), Pinglewood
The first site installed as part of the Highways Agency network was located on the M4
motorway. This site (Theale 1) was installed in August 1992 and was situated at the
edge of the eastbound carriageway of the M4 motorway between junctions 11 and 12.
The Theale 1 site was operational until July 1994, after which the site was relocated to
make way for the construction of the M4 Reading motorway service area.
This second site, Theale 2, was installed in April 1995 and is located at the edge of the
hard shoulder on the eastbound carriageway of the M4 motorway approximately 2 km
east of the Theale 1 site. Monitoring equipment from the Theale 1 site was relocated to
the Theale 2 site and supplemented by two Rupprecht and Patashnick tapered element
oscillating microbalance particulate monitors (TEOM) (model 1400ab). One monitor
configured to measure particulate matter with an aerodynamic diameter of less than 10
microns (PM10), and the second monitor configured to measure particulate matter with
an aerodynamic diameter of less than 2.5 microns (PM2.5). Table 2-1 provides details of
the monitoring system and pollutants measured at the Theale 2 site. Photographs and a
map showing the location of the M4 site are provided in Appendix A.1.
Table 2-1: Site information: M4 (Theale 2), Pinglewood
Site M4, Theale 2, Pinglewood
Location Eastbound carriageway, between junction 11
and 12
Grid reference SU 69945 69435
Road type Rural motorway
Commencement date April 1995
Particulate inlet height above ground level 2.7 m
Particulate inlet height above enclosure roof 0.75 m
Particulate inlet distance from hard shoulder 4.1 m
Gaseous inlet height above ground level 1.5 m
Gaseous inlet distance from hard shoulder 0.5 m
Gaseous manifold flow rate 6.3 m/sec
Gaseous residence time 0.7 sec
Wind vane & anemometer height above ground level
4.25 m
Wind vane & anemometer height above enclosure roof
2.25 m
Relative humidity & temperature sensor height above ground level
2.0 m
Meteorological equipment distance from hard shoulder
6.0 m
Carbon monoxide (CO) Infra red (IR) absorption
Total oxides of nitrogen (NOX), nitrogen dioxide (NO2), nitric oxide (NO)
Chemiluminescence
Ozone (O3) Ultra violet (UV) absorption
Particulate matter (PM10 and PM2.5) Heated gravimetric - TEOM
Ammonia (NH3) Passive diffusion tubes
Meteorological conditions Wind speed, wind direction, temperature,
relative humidity
Traffic flow Automatic Traffic Counter (ATC)
During 2010, the M4 motorway site operated continuously with the following minor
disruptions to data collection:
Power failures to the site between 22/04/2010 to 23/04/2010, 22/05/2010 to
25/05/2010, 01/06/2010 to 02/06/2010, 13/06/2010 to 15/06/2010 and
21/06/2010 to 23/06/2010. Electrical disruptions during road maintenance work
Project Report
TRL 6 RPN744 (I)
being carried out at M4 junction 12 to the east of the monitoring site. The HA
contractor responsible for this location was contacted as soon as the power
failures occurred and were requested to reinstate the power supply. The power
failures were thought to be as a result of the air conditioning units working at
maximum capacity during periods of hot weather causing the fuse to trip out. The
electrical equipment was replaced on the 23rd June.
Records of visits to the M4 monitoring site in 2010, including the reason for each visit
and actions performed during that visit are presented in Appendix B.1.
2.2 M25, Bell Common Tunnel
The monitoring site on the M25 motorway at the Bell Common Tunnel was installed in
January 2007. This site is situated on the eastbound (clockwise) carriageway of the M25
motorway to the west of junction 27. The site was installed with the aim of obtaining a
better understanding of the long term trend in emissions generated in the tunnel.
Monitoring at the Bell Common Tunnel site in 2010 was influenced by a major
construction and refurbishment project which resulted in closure of the eastbound tunnel
between November 2009 and March 2010. The monitoring equipment had to be
removed during this period to allow the contractor to use the stairwell where the
monitoring equipment was housed. Contractor changes during and after tunnel closure
caused chain of command and responsibility issues to arise for the construction
company. This in turn led to difficulties in gaining access to the stairwells and the
electricity supply. The tunnel closure and resulting issues resulted in the equipment
being reinstated on the 27th October 2010. Data collection was only carried out for two
months in 2010. The data has been included for information but was not compared with
objective concentrations due to the limited data capture.
Air quality data collected in the tunnel are unlikely to be as affected by meteorological
conditions as the other sites. However, prevailing wind directions, high wind speeds,
extreme ambient temperatures and changes in humidity may contribute to the dilution
or chemistry of the samples taken within the tunnel. Table 2-2 provides details of the
monitoring system and pollutants measured at the Bell Common Tunnel site.
Photographs and a map showing the location of the Bell Common Tunnel site are
provided in Appendix A.2.
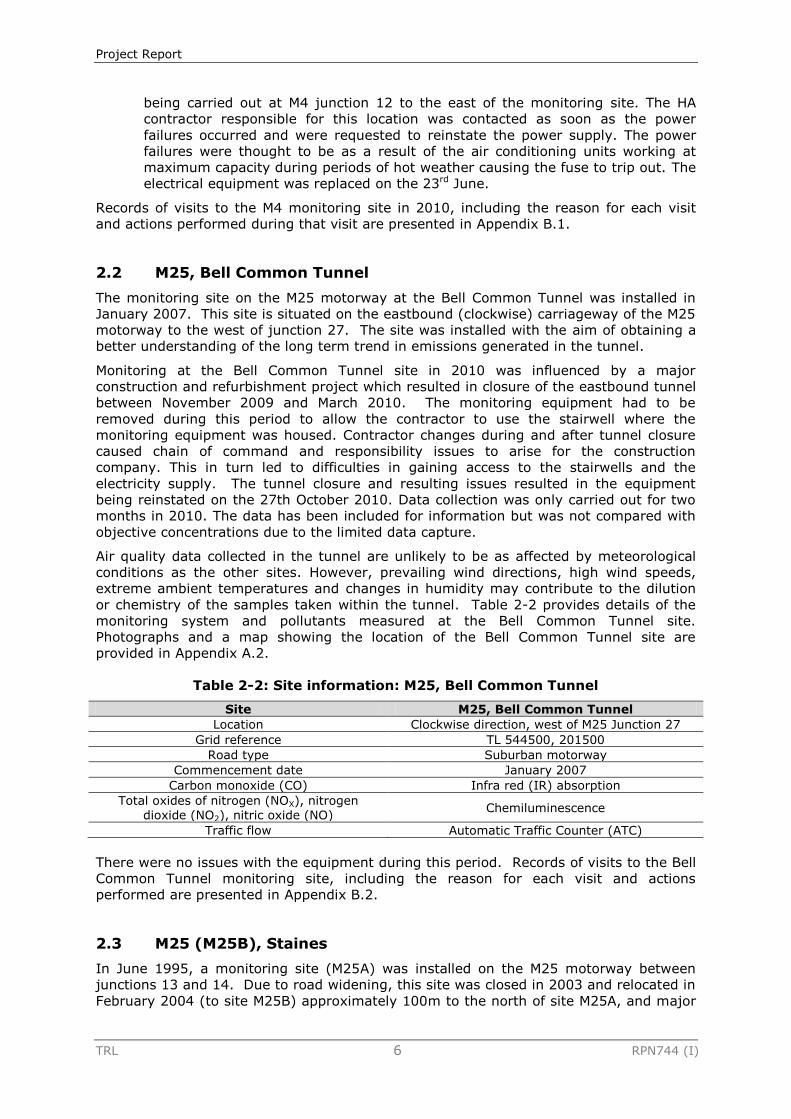
Table 2-2: Site information: M25, Bell Common Tunnel
Site M25, Bell Common Tunnel
Location Clockwise direction, west of M25 Junction 27
Grid reference TL 544500, 201500
Road type Suburban motorway
Commencement date January 2007
Carbon monoxide (CO) Infra red (IR) absorption
Total oxides of nitrogen (NOX), nitrogen dioxide (NO2), nitric oxide (NO)
Chemiluminescence
Traffic flow Automatic Traffic Counter (ATC)
There were no issues with the equipment during this period. Records of visits to the Bell
Common Tunnel monitoring site, including the reason for each visit and actions
performed are presented in Appendix B.2.
2.3 M25 (M25B), Staines
In June 1995, a monitoring site (M25A) was installed on the M25 motorway between
junctions 13 and 14. Due to road widening, this site was closed in 2003 and relocated in
February 2004 (to site M25B) approximately 100m to the north of site M25A, and major
Project Report
TRL 7 RPN744 (I)
road works on the M25 motorway during 2004 resulted in periods of data loss and
variations in vehicle emissions. The sample inlet was placed in its final position in
November 2005. Table 2-3 provides details of the monitoring system and pollutants
measured at the M25 site. Photographs and a map showing the location of the M25 site
are provided in Appendix A.3.
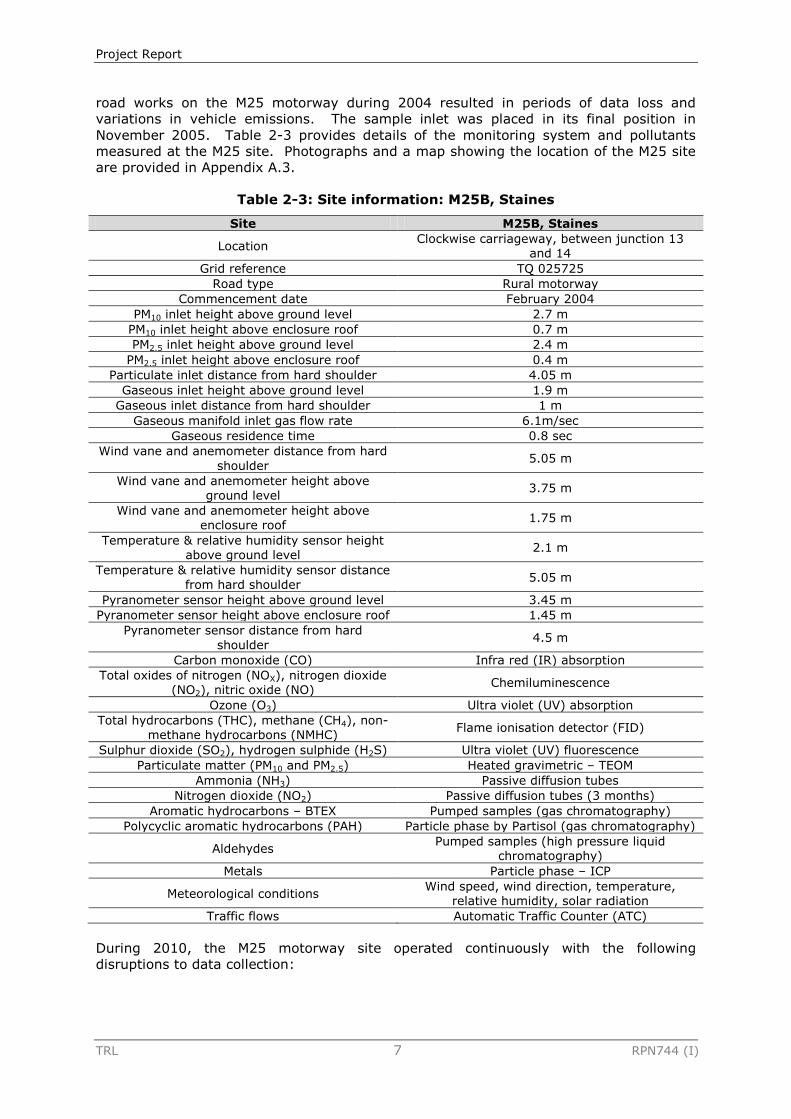
Table 2-3: Site information: M25B, Staines
Site M25B, Staines
Location Clockwise carriageway, between junction 13
and 14
Grid reference TQ 025725
Road type Rural motorway
Commencement date February 2004
PM10 inlet height above ground level 2.7 m
PM10 inlet height above enclosure roof 0.7 m
PM2.5 inlet height above ground level 2.4 m
PM2.5 inlet height above enclosure roof 0.4 m
Particulate inlet distance from hard shoulder 4.05 m
Gaseous inlet height above ground level 1.9 m
Gaseous inlet distance from hard shoulder 1 m
Gaseous manifold inlet gas flow rate 6.1m/sec
Gaseous residence time 0.8 sec
Wind vane and anemometer distance from hard
shoulder 5.05 m
Wind vane and anemometer height above ground level
3.75 m
Wind vane and anemometer height above enclosure roof
1.75 m
Temperature & relative humidity sensor height above ground level
2.1 m
Temperature & relative humidity sensor distance from hard shoulder
5.05 m
Pyranometer sensor height above ground level 3.45 m
Pyranometer sensor height above enclosure roof 1.45 m
Pyranometer sensor distance from hard
shoulder 4.5 m
Carbon monoxide (CO) Infra red (IR) absorption
Total oxides of nitrogen (NOX), nitrogen dioxide (NO2), nitric oxide (NO)
Chemiluminescence
Ozone (O3) Ultra violet (UV) absorption
Total hydrocarbons (THC), methane (CH4), non-methane hydrocarbons (NMHC)
Flame ionisation detector (FID)
Sulphur dioxide (SO2), hydrogen sulphide (H2S) Ultra violet (UV) fluorescence
Particulate matter (PM10 and PM2.5) Heated gravimetric – TEOM
Ammonia (NH3) Passive diffusion tubes
Nitrogen dioxide (NO2) Passive diffusion tubes (3 months)
Aromatic hydrocarbons – BTEX Pumped samples (gas chromatography)
Polycyclic aromatic hydrocarbons (PAH) Particle phase by Partisol (gas chromatography)
Aldehydes Pumped samples (high pressure liquid
chromatography)
Metals Particle phase – ICP
Meteorological conditions Wind speed, wind direction, temperature,
relative humidity, solar radiation
Traffic flows Automatic Traffic Counter (ATC)
During 2010, the M25 motorway site operated continuously with the following
disruptions to data collection:
Project Report
TRL 8 RPN744 (I)
Power failures on 06/03/2010, 14/09/2010 and 01/10/2010. These were all minor
disruptions affecting data from all instruments. The power returned within a few
hours, there was no known reason for these power disruptions.
NOX instrument faults occurred on or between 11/04/2010 and 12/04/2010,
13/4/2010(8hrs), 14/04/2010(10hrs), 15/04/2010(8hrs), 16/04/2010 to
17/04/2010, 19/04/2010 (10hrs), 22/4/2010(10hrs), 23/04/2010 to 24/04/2010.
Continued faults resulted in the analyser being removed to the service company
on the 28th April for repair; no hot spare was available at this time. The analyser
was removed and repaired between 28/04/2010 and 13/05/2010. The service
report indicated the analyser had developed a fault on the photomultiplier tube
temperature control unit and was replaced.
The CO instrument was intermittently faulty from 15/02/2010 to 20/02/2010
where an onsite repair was thought to have resolved the fault. The repair was not
effective, and the instrument was removed on 20/02/2010 to external service
company for repair. No hot spare was available at this time. The analyser
required replacement parts ordered. The analyser was re-installed on
18/03/2010.
Ozone data is missing between 23/03/2010 to 24/03/2010 as a result of
instrument removal for routine service. The instrument was tested overnight. On
06/04/2010 the ozone lamp failed, and the instrument was removed to the
service company for repair and re-installed on 19/04/2010.
The SO2 analyser was serviced on the 23/03/2010 to 24/03/2010, no data is
available during this period. Invalid SO2 data was removed between the following
dates 16/4/2010 to 17/04/2010, 21/04/2010 to the 23/04/2010. The intermittent
failures of the analyser resulted in removal of the instrument on the 25/04/2010
and returned to the service company. The unit was re-installed on the to
27/04/2010.
The PM2.5 TEOM developed a flow fault on the 25/03/2010 and was removed for
repair. Replacement parts were required. The instrument was returned from the
service company and re-installed on the 07/04/2010. No data was available
during this period.
Horiba FID; TRL were advised by Horiba in 2009 that the Horiba 350 FID was no
longer service supported by Horiba and spares were no longer available. Other
service companies also advised they would not support the unit. It was agreed
with the HA to keep the analyser running as long as practicable. The analyser
developed an intermittent fault with the flame ignition unit. This resulted in either
the flame ignition unit being cleaned at site and relit or the unit being removed
for repair at the TRL workshop. 01/01/2010 to 12/01/2010 (period of heavy snow
and unable to access site), 11/02/2010 to 15/02/2010 (flame fault), 06/03/2010
to 11/03/2010 (removed to workshop), 28/04/2010 to 05/05/2010 (removed to
workshop), 15/06/2010 to 24/06/2010 (removed to workshop), 29/07/2010 to
30/07/2010 (flame fault), 09/09/010 to 10/09/2010 (flame fault), 22/12/2010 to
24/12/2010 (flame fault).
Records of visits to the M25 monitoring site in 2010, including the reason for each visit
and actions performed are presented in Appendix B.3.
2.4 M60, Kirkhams
Monitoring began on the M60 motorway in May 1999. This site is located 18m from the
westbound hard shoulder (Manchester Orbital Road) on a shallow motorway
embankment approximately 300m north east of junction 17. Table 2-4 provides details
of the monitoring system and pollutants measured at the M60 site. Photographs and a
map showing the location of the M60 site are provided in Appendix A.4.
Project Report
TRL 9 RPN744 (I)
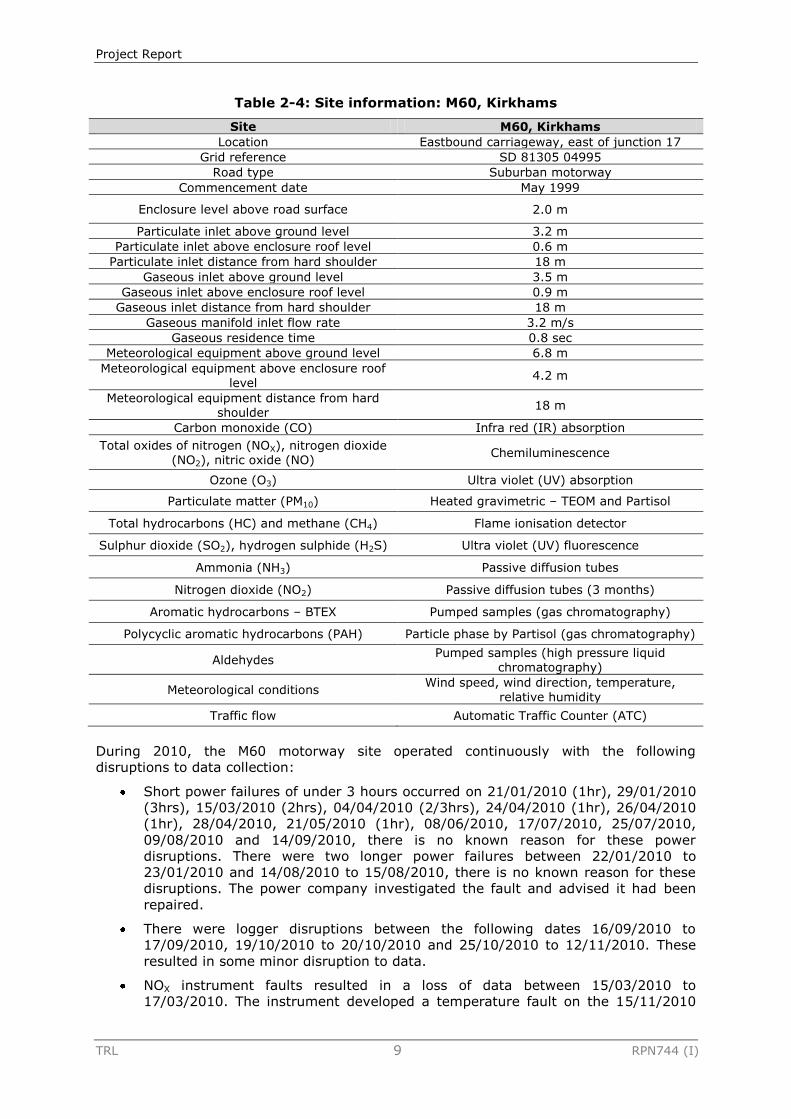
Table 2-4: Site information: M60, Kirkhams
Site M60, Kirkhams
Location Eastbound carriageway, east of junction 17
Grid reference SD 81305 04995
Road type Suburban motorway
Commencement date May 1999
Enclosure level above road surface 2.0 m
Particulate inlet above ground level 3.2 m
Particulate inlet above enclosure roof level 0.6 m
Particulate inlet distance from hard shoulder 18 m
Gaseous inlet above ground level 3.5 m
Gaseous inlet above enclosure roof level 0.9 m
Gaseous inlet distance from hard shoulder 18 m
Gaseous manifold inlet flow rate 3.2 m/s
Gaseous residence time 0.8 sec
Meteorological equipment above ground level 6.8 m
Meteorological equipment above enclosure roof
level 4.2 m
Meteorological equipment distance from hard shoulder
18 m
Carbon monoxide (CO) Infra red (IR) absorption
Total oxides of nitrogen (NOX), nitrogen dioxide (NO2), nitric oxide (NO)
Chemiluminescence
Ozone (O3) Ultra violet (UV) absorption
Particulate matter (PM10) Heated gravimetric – TEOM and Partisol
Total hydrocarbons (HC) and methane (CH4) Flame ionisation detector
Sulphur dioxide (SO2), hydrogen sulphide (H2S) Ultra violet (UV) fluorescence
Ammonia (NH3) Passive diffusion tubes
Nitrogen dioxide (NO2) Passive diffusion tubes (3 months)
Aromatic hydrocarbons – BTEX Pumped samples (gas chromatography)
Polycyclic aromatic hydrocarbons (PAH) Particle phase by Partisol (gas chromatography)
Aldehydes Pumped samples (high pressure liquid
chromatography)
Meteorological conditions Wind speed, wind direction, temperature,
relative humidity
Traffic flow Automatic Traffic Counter (ATC)
During 2010, the M60 motorway site operated continuously with the following
disruptions to data collection:
Short power failures of under 3 hours occurred on 21/01/2010 (1hr), 29/01/2010
(3hrs), 15/03/2010 (2hrs), 04/04/2010 (2/3hrs), 24/04/2010 (1hr), 26/04/2010
(1hr), 28/04/2010, 21/05/2010 (1hr), 08/06/2010, 17/07/2010, 25/07/2010,
09/08/2010 and 14/09/2010, there is no known reason for these power
disruptions. There were two longer power failures between 22/01/2010 to
23/01/2010 and 14/08/2010 to 15/08/2010, there is no known reason for these
disruptions. The power company investigated the fault and advised it had been
repaired.
There were logger disruptions between the following dates 16/09/2010 to
17/09/2010, 19/10/2010 to 20/10/2010 and 25/10/2010 to 12/11/2010. These
resulted in some minor disruption to data.
NOX instrument faults resulted in a loss of data between 15/03/2010 to
17/03/2010. The instrument developed a temperature fault on the 15/11/2010
Project Report
TRL 10 RPN744 (I)
and was removed to the service company, no hot spare was available at this
time. The instrument was returned after repairs and re-commissioned on the
02/12/2010.
An SO2 analyser fault occurred between the 22/01/2010 and 23/01/2010. The
instrument was also removed for a service between 04/03/2010 and 08/03/2010
which resulted in some data loss. The instrument failed on the 29/03/2010 as a
result of lamp failure and was removed to the service company. The analyser was
reinstalled on the 08/04/2010.
A CO instrument fault occurred on the 19/10/2010 the instrument developed a
temperature fault and was removed for repair, it was reinstalled on the
21/10/2010. The instrument failed again on the 25/10/2010 and was removed to
the service company for repair to the PMT temperature control unit. The unit was
reinstalled on 12/11/2010.
An O3 instrument service was carried out on the 04/03/2010, which resulted in a
few hours data loss, and an O3 instrument fault occurred on 19/10/2010,
removed to workshop for repair and reinstalled on 21/10/2010. The instrument
had a catastrophic failure on 25/10/2010 and the instrument was removed to an
external service company. There was no hot spare available at this time.
The M60 cabinet was broken into and set on fire on the 20/12/2010 resulting in
extensive equipment damage, there was no data collected at the M60 from this date
until the end of December 2010.
Records of visits to the M60 monitoring site in 2010, including the reason for each visit
and actions performed are presented in Appendix B.4.
2.5 Quality assurance and quality control
TRL quality assurance and quality control procedures require all data to be backed up on
a secure server and all documentation associated with each monitoring site to be
uniquely identified and securely stored. Quality assurance and quality control
procedures used by TRL follow those used in the Automatic Urban and Rural Network
(AURN)2 and are outlined below.
2.5.1 Site visits
TRL undertook regular site visits to calibrate the equipment at each monitoring site
during 2010, and the procedures used to carry out these calibrations follow those
outlined in the Site Operators Manual for the AURN3. Zero and span checking of the
equipment was completed on a fortnightly basis, and equipment was routinely serviced
by TRL and external contractors as required, in line with manufacturer’s
recommendations. Records of site visits to each monitoring site, including the reason for
each visit and actions performed at that site visit, are presented in Appendix B.
2.5.2 Data checking
TRL’s central data communication and logging facility (Enview 2000) has been externally
audited by the Environment Agency. This system was used to undertake daily data
inspections during office hours, during which three-day plots of data recorded at each
monitoring site were inspected for accurate date and time readings, continuous power
supply, continuity and validity of measurements, and maximum and minimum data
2 http://www.airquality.co.uk/reports/cat13/0910081142_AURN_QA_QC_Manual_Sep_09_FINAL.pdf 3 http://www.airquality.co.uk/reports/empire/lsoman/lsoman.html

Project Report
TRL 11 RPN744 (I)
values. Any anomalies or queries arising from the daily inspections were brought to the
attention of the Project Manager, who initiated any necessary action (e.g. a site visit).
On a weekly basis, data collected by the management system was examined using
summary statistics and outlier analysis, and any unusual episodes were recorded and
examined over longer data periods. Unusual episodes were cross-referenced with peaks
and troughs recorded at other national monitoring sites, with any pollution episodes
recorded by the London Air Quality Network or sites in the DEFRA AURN where possible.
2.5.3 Data calibration and ratification
Air pollutant data was ratified as per AURN recommended procedures3. The calibration
and ratification process for automatic gas analysers corrects the raw dataset for ‘drift’ in
the zero baselines and the upper range of the instrument. The zero reading recorded
during the calibration exercise was used to adjust any offset of the baseline. The
difference between the span values obtained at two subsequent calibration visits was
used to calculate a linear scaling factor, which was applied to data collected between
these two visits. Following application of the scaling factor and adjustment of the
baseline, data was validated by visual inspection. Trends in the data were also
compared with other sites in the AURN.
2.5.4 Data analysis
Statistical analysis has also been carried out to allow for comparison with UK Air Quality
objective values set out by the Air Quality (England) Regulations 2000 (SI 2000 No. 928)
and the Air Quality (England) (Amendment) Regulations 2002 (SI 2002 No. 3043).
Compliance with the relevant objective has been assessed for each pollutant covered by
the Regulations (see section 3). A number of pollutants monitored at the sites within the
highways agency network are not covered by the UK Air Quality Regulations, and so the
concentrations of these pollutants have been compared with Environment Agency
guidelines. Although these pollutants are not covered by UK legislation, guidance values
for safe levels of human exposure exist and it is therefore considered constructive to
monitor these concentrations.
Statistical analysis of hourly data collected at each monitoring site has also been
undertaken. Minimum, maximum, mean and standard deviation values have been
calculated for each pollutant at each monitoring site for the year 2010. This allows for
comparison with data collected in previous years and the analysis of long term trends in
pollutant concentrations. Data for 2010 are presented together with historical datasets
in Volume II.
Project Report
TRL 12 RPN744 (I)
3 Compliance with UK Air Quality objectives and
permitted exceedances
This section compares data collected at the four Highways Agency monitoring sites in
2010, with UK Air Quality objective concentrations and permitted numbers of
exceedances. A summary of the UK Air Quality objectives and permitted numbers of
exceedances is provided in Appendix D. It is important to note that these objectives do
not apply at the monitoring sites in the Highways Agency network because the sites are
classified as areas not accessible to the public and therefore no relevant exposure exists.
It is, however, still considered useful to compare the monitored data with these criteria.
Each pollutant covered by the UK Air Quality Regulations is discussed in turn, and
percentage data capture rates for calibrated data are provided. Concentrations of non-
regulated pollutants are also presented and discussed in comparison with guidance
values recommended by the Environment Agency4.
3.1 Nitrogen dioxide
Nitrogen dioxide (NO2) concentrations are recorded by the continuous analysers as 15-
minute means. 1-hour means have been calculated from the 15-minute data to allow for
comparison with UK Air Quality objectives. Time-series plots of hourly NO2
concentrations for all sites are presented in Volume II of this report.
The UK Air Quality Regulations provide two objectives for NO2; the 1-hour mean
concentration of 200 µg/m3, which must not be exceeded more than 18 times per year,
and the annual mean limit of 40 µg/m3. A comparison with these objective
concentrations is shown in Table 3-1
The monitoring at Bell common was disrupted due to major tunnel refurbishment which
took place between 2008 and 2010. The stairwell area of the tunnel housing the
monitoring site was required by the contractors for storage. The monitoring equipment
was removed and was not re-installed until late October 2010. The re-installation of the
site was hampered by contractors having removed the mains electrics, and disposed of
the monitoring rack and high volume sample system. The power supply was reinstalled,
along with replacement rack and high volume system. This resulted in only two months
monitoring data being collected from Bell Common tunnel. Therefore the results are only
provided for information and are not compared to the air quality objectives.
Data capture rates (i.e. above 90%) for NO2 were achieved at the M4 and M25
monitoring sites in 2010. Disruptions to data collection caused by power failures (noted
in Section 2) at the M4 site were reported to the contractor carrying out the roadworks
as soon as they were noticed. The data capture rate for the M60 site was affected by a
number of incidents including, power disruptions as noted in Section 2, an instrument
fault which resulted in two weeks data loss, and vandalism to the cabinet on the
20/12/2010.
The data capture rate for Bell common tunnel reported in Table 3-1 is for the whole
year, and is therefore low, and not a true representation of data capture rates; for the
period the instruments were installed in the Bell common tunnel a data capture rate of
99.8% was achieved. Only two months of data were collected at the tunnel site in 2010
as a result of the refurbishment work. It was not possible to annualise the data from Bell
common tunnel as a minimum of three months data is required as set out in DEFRA’s
technical guidance TG-09.
During 2010, the annual mean NO2 objective value was exceeded at the M25, M4 and
M60 monitoring sites. With the high concentrations reported during the two month
monitoring period at Bell Common Tunnel it is likely that the annual mean objective
would be exceeded. The one hour mean objective was exceeded at all sites but was
4 http://www.environment-agency.gov.uk/business/topics/pollution/35761.aspx
Project Report
TRL 13 RPN744 (I)
within the permitted number of exceedances under the UK Air quality regulations at the
M25, M60 and M4 sites.
The number of exceedances of the one hour mean objective at Bell Common Tunnel
during the two month monitoring period provided indicative results which were greater
than the number permitted under the Air Quality Objective.
The 1-hour mean NO2 levels at the M4 and the M60 site were observed to have slightly
lower concentrations than those recorded at the M25 site. It is suggested that this is
likely to be as a result of the increased volume of traffic at the M25 site compared with
volumes at the other two sites. The 1-hour mean concentrations at Bell Common Tunnel
were very high compared to the other sites. This is as a result of the tunnel environment
and reduced dispersion of pollutants. (Highways Agency, 2008, 2009)
The 1-hour mean NO2 concentrations at the M4 site were compared with concentrations
measured at Reading New Town monitoring site. Data from the Reading New town site
was available from the 13/03/2010 until the end of the year. The M4 and Reading New
town monitoring sites both followed similar trends. Exceedances at the M4 site occurred
on the 02/01/2010, 05/01/2010 and 13/01/2010. There was no data available for these
periods from Reading New Town. The 2/1/2011 occurred during the New Year Bank
Holiday weekend. There was an extensive programme of development work to the
bridges, roundabouts and slip roads at M4 J11 at this time. Lane closures and queuing
vehicles on the east bound carriageway prior to junction 11 had been observed on
several occasions and may have been one of the contributory factors to these
exceedences during a busy bank holiday period. January was host to a number of heavy
snow falls causing major disruption on the roads. Slow moving and stationary vehicles
during this period. The exceedance on the 05/01/2010 occurred during a period of heavy
snow, where an earlier accident had resulted in very long traffic delays. It is suggested
that this high concentration is real. The exceedance on the 13/01/2010 also occurred on
a day of heavy snowfall and slow moving traffic. It is suggested that this exceedance is
also real.
The 1-hour mean NO2 concentrations at the M25 site were compared with concentrations
measured at the London Hillingdon site located to the north of the M4 west of junction 4.
The data followed a similar trend for the majority of the year. There are short periods
when the concentrations at the two sites do not follow the same trend. These occurred
between 06/2/2010 and 12/02/2010, 06/03/2010 and 11/03/2010 and 14/06/2010 and
19/06/2010 and on the 14/01/2010, 26/01/2010, 09/02/2010, 08/03/2010,
17/04/2010, 18/04/2010 and 03/09/2010. During the periods in February and March the
concentrations at the M25 site were 50 µg/m3 to 120 µg/m3 higher than concentrations
recorded at the London Hillingdon site. These occasions coincided with winds from the
north suggesting that the lower NO2 concentrations at the Hillingdon site were as a result
of the northerly wind moving through the monitoring location towards the M4. The NO2
concentrations at the M25 site were more elevated as a result of the wind from the north
passing across the M25 towards the monitoring site. The NO2 concentrations in June
corresponded to low ozone concentrations. It is suggested that the higher NO2
concentrations at the M25 site would be as a result of a high rate of conversion of
vehicle NO emissions reacting with the ozone to form NO2 The exceedances at the M25
site also occurred during peak traffic times (07:00–09:00hrs and 16:00–19:00hrs) when
there would be increased vehicle volumes.
The M60 1-hour mean data was compared with data from local AURN air quality
monitoring sites, the urban background site located at Manchester Piccadilly, the urban
site located at Salford Eccles and the Bury motorway roadside side located on the north
side of the interchange at J17 of the M60. Data from all four sites indicated similar
trends. An exceedance of the 1-hour mean occurred at the M60 site on the 07/01/2010.
At this time a high concentration was also reported at the Manchester Piccadilly site,

Project Report
TRL 14 RPN744 (I)
Bury Roadside site, and the Salford Eccles site at the same time as the M60 site. It is
suggested the increase NO2 concentration recorded at this time was as a result of
general pollution episode in the area. There was also a peak in NO2 concentrations on
the 06/12/2010 at the M60 site which also correlated with an exceedance at the Bury
Roadside site. This peak concentration was not observed at other monitoring sites in the
area and occurred during the peak travel time. It is suggested the increased
concentration may have be as a result of a localised traffic incident.
NO2 concentrations reported at Bell Common Tunnel were between 100-700µg/m3.
These high concentrations are consistent with previous years data reported at the site
and are a result of limited air dispersion and dilution conditions within tunnel
environments as described in a previous years monitoring report (Highways Agency,
2008). A large number of exceedances of 1-hour mean were observed, the majority of
which were at peak traffic flow times (07:00 – 09:00 and 16:00 – 19:00pm). During the
period 11/11/2010 to 20/11/2010 there were high concentrations recorded in the tunnel
throughout the day. It is uncertain why the concentrations did not drop during quieter
periods of the day. One possible explanation could be that the metrological conditions
outside the tunnel influenced the pollution dispersion within the tunnel. Strong easterly
winds penetrating the clockwise, eastbound bore, may have influenced the flow of air
through this bore encouraging concentrations to increase.
The annual one-hour mean values reported for the M4, M60 and M25 sites were
47.9ug/m3, 49.7ug/m3 and 61.6ug/m3 respectively.
Table 3-1: Compliance with UK Air Quality objectives, nitrogen dioxide (NO2)
Statistic Objective
concentration Permitted number
of exceedances M25 M4 M60
Bell Common
1 hour mean 200 g/m3 18 17 8 1 553
Annual mean ( g/m3)
40 g/m3 n/a 61.6 47.9 49.7 187.3*
Calibrated data capture (% of calendar year)
n/a n/a 93 94 83 18*
Bold type indicates exceedance of UK Air Quality objective * Bell Common Tunnel site in place between 27/10/2010 and 31/12/2010, the mean is calculated for this
period, no annualised mean was calculated (data capture 99.8% for the monitoring period)
For information, annual mean concentrations of NO and NOX recorded at each monitoring
site are provided in Table 3-2 and Table 3-3.
Table 3-2: Annual mean nitric oxide (NO) concentration
Statistic M25 M4 M60 Bell Common
Annual mean (µg/m3) 116.4 92.5 71.6 878.0
Calibrated data capture (% of calendar
year) 93 94 86 18*

Project Report
TRL 15 RPN744 (I)
Table 3-3: Annual mean total oxides of nitrogen (NOX) concentration
Statistic M25 M4 M60 Bell Common
Annual mean (µg/m3) 177.9 140.4 121.8 1065.3
Calibrated data capture (% of calendar year)
93 94 86 18*
* Tunnel refurbishment resulted in only 2 months of data in 2010.
3.2 NO2 Diffusion tube results
During discussions with the Highways Agency in August 2010 it was agreed to deploy
NO2 diffusion tubes to support the oxides of nitrogen monitoring at the M25 and M60
sites. Two sets of triplicate NO2 diffusion tubes were deployed to monitor NO2
concentrations at the M25 and M60. A third set of triplicate tubes were deployed at the
sample inlet at the M60 site as this is located 18m from the roadside. The diffusion tube
monitoring began at the beginning of September and continues to March 2011. The bias
adjusted diffusion tube results for 2010 are provided in Table3-4 and Table3-5 with the
continuous analyser data for the same period for comparison.
The diffusion tube results at the M25 site are approximately 20 µg/m3 higher at the
roadside site than the background site. The concentration measured at the background
location would be expected to be lower with the increased distance from the traffic
source.
The diffusion tube results at the M60 site follow the expected trend with the
concentrations at the roadside location being the highest and the concentrations at the
background site, 18m from the M60 motorway traffic, being the lowest. The
concentrations observed at the inlet are approximately half those at the roadside. This is
to be expected as concentrations of NO2 generally drop off with increased distance from
the roadside source. The concentrations achieved by the diffusion tubes at the inlet site
compare well with the continuous analyser results across the same periods, this provides
confidence that the continuous analyser is responding well.
The NO2 concentrations recorded at the M25 background sites were higher at than at the
M60 site. Heathrow airport is located 5km to the north east of the M25 monitoring site.
It is suggested that increased NO2 background concentrations may be as a result of
additional contributions from the aircraft movements.

Project Report
TRL 16 RPN744 (I)
Table3-4: M25 NO2 diffusion tube results
Date on
Date off
Period 1
02/09/2010
30/09/2010
Period 2
30/09/2010
4/11/2010
Period 3
04/11/2010
09/12/2010
Average
Distance from hard
shoulder (m)
Grid reference
(OS)
Sample tube
height
(m)
Roadside tube
average (µg/m3)
49.0 72.3 67.7 63.0 2m 502807,173568 1.9 m
Background tube
average (µg/m3)
33.6 52.2 53.9 46.6 50m 502745,173520 1.7m
Analyser average (µg/m3)
49.0 59.0 60.0 56.0 2m 502807,173568 1.9m
Table3-5: M60 NO2 diffusion tube results
Date on
Date off
Period 1
02/09/2010
30/09/2010
Period 2
30/09/2010
4/11/2010
Period 3
04/11/2010
09/12/2010
Average
Distance from hard
shoulder (m)
Grid reference
(OS)
Sample tube
height
(m)
Roadside
tube average (µg/m3)
91.8 106.2 85.9 94.6 1m 381294,405022 1.5m
Background tube
average (µg/m3)
33.9 38.1 43.0 38.3 39m 381309,404983 2.1m
Inlet tube average (µg/m3)
44.0 47.1 54.5 48.6 18m 381310,405004 3.5m
Analyser average (µg/m3)
45.7 43.9 56.7 48.7 18m 381310,405004 3.5m
3.3 Sulphur dioxide
Sulphur dioxide (SO2) concentrations have been recorded by the continuous analysers as
15-minute means at two of the four monitoring sites (the M25 and M60 motorways).
The UK Air Quality Regulations provide three objective concentrations for SO2 (measured
as 15-minute, 1-hour and 24-hour means). Table 3-6 shows that there were no
exceedances of the SO2 objective concentrations at either monitoring site in 2010. The
DEFRA air quality archive5 was checked for comparison and there were no exceedances
of any SO2 objectives at sites in close proximity to the M25 or M60 sites. A high data
capture rate for SO2 was achieved at the M25 site. The data capture rate at the M60 site
was slightly lower as a result of power failures and an instrument faults that occurred
between the 29/03/2010 and 08/04/2010. Further details of which are outlined in
Section 2.4.
The 15-minute, 1-hour mean and 24-hour mean concentration for SO2 at the M25 site
was less than 20ug/m3 and there were no significant peaks in the data.
5 http://uk-air.defra.gov.uk/data/exceedence

Project Report
TRL 17 RPN744 (I)
The 15-minute, 1-hour mean and 24 hour mean concentrations at the M60 data
indicated slightly higher concentrations than those recorded at the M25 site. The M60
data was compared with data from the urban monitoring sites located at Manchester
Piccadilly and Salford Eccles. Data from the sites followed similar trends. The SO2
concentrations recorded were less than 30ug/m3 for the majority of the monitoring
period. There were some small peaks in the data on 04/01/2010, 15/10/2010,
03/12/2010 and 06/12/2010 which were not reported at the Manchester Piccadilly site.
There was no data available from the Manchester Piccadilly site during the peaks on the
03/12/2010 and 06/12/2010. Two additional small peaks observed on 07/01/2010 and
22/06/2010 were recorded at Manchester Piccadilly site. It should be noted that these
maximum concentrations are well within the UK Air Quality objectives. There was one
large peak of 159ug/m3 on the 21/05/2010 which was not reported at the Manchester
Piccadilly or Salford Eccles sites. The concentration started to increase at 03:45hrs and
remained high until 08:00hrs in the morning. The data recorded at the Manchester
Piccadilly site increases slightly over the same time period, suggesting that there might
have been a pollution episode at this time that may have been closer to the M60 site.
Further investigations found that high SO2 concentrations were reported an hour later at
Liverpool Speck site, it is possible a pollution incident occurred near the M60 site and
was carried by winds to the north-west winds to the Liverpool Speck site. The peak is
believed to be real, the cause of the higher concentration is unknown.
The 1-hour mean Time-series plots of 15-minute, 1-hour and 24-hour mean SO2
concentrations recorded at the M25 and M60 sites are presented in Volume II of this
report.
Table 3-6: Compliance with UK Air Quality objectives, sulphur dioxide (SO2)
Statistic Objective
concentration Permitted number
of exceedances M25 M60
15-minute mean
266 µg/m3 35 0 0
1-hour mean 350 µg/m3 24 0 0
24-hour mean 125 µg/m3 3 0 0
Calibrated 1-
hour data capture (% of calendar year)
n/a n/a 97 85
3.4 Ozone
Ozone (O3) concentrations have been recorded by the continuous analysers as 15-
minute means. 1-hour means have been calculated from the 15-minute data and the
running 8-hour mean has been calculated for comparison with the UK Air Quality
objective at the M4, M25 and M60 monitoring sites.
O3 is a secondary pollutant (i.e. it is not emitted directly from any source e.g. road
traffic). O3 forms in the lower atmosphere by reactions between volatile organic
compounds (VOCs), CO and NOX in the presence of sunlight. O3 reacts with NO emitted
directly from vehicle exhausts to form secondary NO2. At a roadside location, there is
routinely an excess of NO and thus the limit to the formation of NO2 is usually
determined by the availability of O3. During the summer months, higher concentrations
of O3 are typically observed as a result of increasing sunlight.
Concentrations of NO2 and O3 measured at the Highways Agency roadside sites have
been analysed in conjunction with each other in order to explain episodes of high and

Project Report
TRL 18 RPN744 (I)
low concentrations of these pollutants. Time-series plots presented in Volume II of this
report have been annotated accordingly. Table 3-8 shows exceedances of the 8-hour
running mean at the M25, M4 and M60 monitoring sites. The reported exceedances of
the 8-hour running mean at the M60 and M4 site exceed the number permitted under
the air quality objectives.
High data capture rates for O3 were achieved at the M25 and M4 sites in 2010. The data
capture rate at the M60 site is slightly lower due to minor power failures and an
instrument fault which occurred on the 25/10/2010 and was not re-installed prior to the
end of the year as discussed in Section 2.4.
The data reported at the M25 site has been compared with three local AURN sites,
London Teddington, Reading New Town and London Hillingdon. The exceedances
reported at the M25 site are all in the summer months when higher levels of ozone
would be expected. The exceedance at M25 on 24/05/2010 was also reported at London
Hillingdon, Reading New town, and London Teddington sites and each site indicated very
low concentrations of NO2. Exceedances on the 23/06/2010 and 27/06/2010 were also
experienced at London Teddington site with high levels at Reading New Town and
London Hillingdon. The exceedance at the M25 site in August was not experienced at any
of the other local sites but high levels were observed at Reading New Town. It is
suggested that the increase in O3 concentrations during this period may be as a result of
localised weather conditions combined with a large volume of traffic during the peak
holiday period.
The M60 ozone concentrations were compared to those reported at other local AURN
sites including, Wigan centre and Salford Eccles. There were a number of exceedances of
Ozone at M60 site in January which correspond to very low levels of NO2 at the site.
These exceedances were not reported at any other local site but a similar trend with
lower concentrations was observed at the Salford Eccles site. During this time there was
heavy snow across the region which may have influenced traffic flow on the M60 and
therefore influenced the ozone levels recorded. It is likely that the cold calm conditions
at the M60 site trapped the ozone resulting in periods of high ozone at the M60. The
exceedance in April (24/04/2010) was also reported at Glazebury and Liverpool Speck at
the same time and suggests that this was promoted by a regional weather episode.
There were also high levels at all other local sites. During the periods of exceedances in
June and September at the M60 site high concentrations were reported at all local sites.
There were several exceedances of the 8-hour running mean at the M4 site. The
majority of these exceedances occur in the summer months of May, June and July. This
is a period when the majority of high concentrations of ozone are likely to occur. The M4
ozone concentrations were compared with those reported at local AURN sites at Harwell
and Reading New Town. All three sites follow a similar trend with exceedances reported
at Harwell and Reading New Town during the same periods. This suggests that the high
concentrations are not only due to local traffic conditions, but may be as a result of a
regional pollution episode. The exceedances on 12/10/2010 and 12/11/2010 at the M4
site were not reported at Harwell and Reading New Town. It is suggested that this was
as a result of a localised pollution episode indicated by other species monitored at this
site during these periods.
It was agreed with the HA to discontinue monitoring ozone in Bell Common Tunnel for
2010 as concentrations were consistently very low, and as a result of the tunnel
refurbishment disruption. Therefore no data for Bell Common Tunnel are shown in Table
3-7.

Project Report
TRL 19 RPN744 (I)
Table 3-8: Compliance with UK Air Quality objectives, ozone (O3)
Statistic Objective
concentration
Permitted number of
exceedances M25 M4 M60
8-hour running mean
100 µg/m3 10 6 123 46
Calibrated data capture (% of calendar year)
n/a n/a 96 95 80
Bold type indicates exceedance of UK Air Quality objective
3.5 Particulate Matter
Particulate matter concentrations for PM10 and PM2.5 are recorded as 15-minute means at
each monitoring site. 1-hour and 24-hour means have been calculated from the 15-
minute data to allow for comparison with the UK Air Quality objectives for PM10 and the
proposed objectives for PM2.5, which are due to come into effect in 2020.
High data capture rates (i.e. above 90%) for PM10 and PM2.5 were achieved at the M25
and M4 motorway sites. The data capture rate at the M60 site was slightly lower due to
a number of issues including power failures and logger faults as discussed in Section 2.4.
This report does not contain particulate data collected at the Bell Common Tunnel site in
2010, as the Osiris monitor was removed in July 2008 due to a lack of space in the
tunnel caused by the major construction and refurbishment programme.
3.5.1 PM10
As discussed in previous monitoring reports (Highways Agency, 2008 & 2009), prior to
processing and ratification, the raw PM10 concentrations have been adjusted to a
gravimetric equivalent using the Volatile Correction Model (VCM) as recommended
by Defra (2009). This adjusts the TEOM data using the "purge" concentration
measured by an FDMS analyser, assuming this represents the volatile component that
has been lost. A "VCM web portal" has been established that allows this correction to be
derived from the mean of up to three nearby FDMS analysers in the national network,
along with meteorological measurements. Data presented in Table 3-10 have been
corrected using this method. For consistency with previous reports, the PM10 data
collected by TEOM analysers have also been adjusted by *1.3 and these statistics are
presented in Volume II (Section 6) of this report. As also observed with the 2008 and
2009 data, the PM10 annual means obtained using the VCM method are lower than those
obtained using TEOM *1.3 correction method.
Refurbishment work at Bell Common Tunnel resulted in the particulate monitor
previously located in the tunnel being removed. It was not possible to co-locate the
analyser within the confines of the refurbished tunnel. No comparisons are reported in Table 3-9.

Project Report
TRL 20 RPN744 (I)
Table 3-10: Compliance with UK Air Quality objectives, particulate matter
(PM10)
Statistic Objective
concentration
Permitted number of
exceedances
Measurement method
M25 M4 M60
24-hour mean 50 µg/m3 35 TEOM adjusted
(VCM) 11 3 0
Annual mean (µg/m3)
40 µg/m3 n/a TEOM adjusted
(VCM) 24.9 20.6 17.4
Calibrated data capture
(% of calendar year)
n/a n/a - 99 94 71
Table 3-10 shows that the annual mean PM10 objective was not exceeded at any of the
motorway monitoring sites during 2010, and that despite there being exceedences of the
24-hour mean objective for PM10 at the M25 and M4 sites, the number of exceedances
was below the 35 permitted per year under the objective.
Time-series plots of the 24-hour mean concentration of PM10 are presented in Volume II
of this report. The 24-hour mean concentration of PM10 was typically between 10 and
40µg/m3 at all three sites. Exceedances of the 24-hour mean objective occurred at the
M4 site in January, February and March and at the M25 site in January, February, April,
October and December. The exceedances in January (25th to 27th), February (18th) and
October (8th) all occurred at times when the London Air Quality Network reported a
pollution episode for PM10. The pollution episodes were due to light easterly winds
bringing secondary PM10 from continental Europe with the cold calm conditions leading to
poor dispersion. These episodes are the likely cause of the exceedances at the M4 and
M25 sites these periods.
The 24-hour mean PM10 concentrations reported at the M60 site were compared with the
local AURN sites; Bury roadside, Warrington and Salford Eccles. All of the sites followed
the same trend to the M60 site with all sites reporting similar concentrations. There
were no exceedances of the 24-hour mean at the M60 site in 2010.
3.5.2 PM2.5
Table 3-11 shows that there were no exceedances of the provisional UK Air Quality
objective concentration for annual mean PM2.5 at any of the monitoring sites in 2010.
High data capture rates (i.e. above 90%) for PM2.5 were achieved at the M25, M4 and
M60 motorway sites.
Table 3-11: Compliance with Provisional UK Air Quality objectives, particulate
matter (PM2.5)
Statistic Objective
concentration
Permitted number of
exceedances
Measurement method
M25 M4 M60
Annual mean 25 g/m3 n/a TEOM 14.3 10.9 14.8
1-hour mean Calibrated
data capture (% of
calendar year)
n/a n/a - 94 93
93
Project Report
TRL 21 RPN744 (I)
3.6 Aromatic hydrocarbons (BTEX)
Aromatic hydrocarbons, including benzene, toluene, ethyl benzene, meta-, para- and
ortho-xylene (collectively known as BTEX), are measured at the M25 and M60 sites using
pumped passive diffusion tubes that provide daily mean concentrations for each
pollutant. Table 3-12 shows that the UK Air Quality objective value for benzene (annual
mean of 5 g/m3 in England and Wales) was achieved at both the M25 site and the M60
sites in 2010. The monitoring of BTEX at the M60 site was discontinued as the results
had been consistently low for a number of years. The results in Table 3-1 show similar
concentrations at both the M25 and M60 sites. A very high concentration was reported
on the 11th February 2010 at the M25 site, an investigation showed that there were no
other AURN sites with high Benzene levels on this date which suggests that the high
concentration is due to the BTEX tube being contaminated either at site or during
analysis. This result was removed prior to the calculation of the annual average.
Table 3-12: Compliance with UK Air Quality objectives, benzene
Statistic Objective
concentration
Permitted number of
exceedances M25 M60
Annual mean 5 g/m3 n/a 0.30 0.32
Data capture (% of
calendar year)
n/a n/a 85 65*
*BTEX monitoring discontinued from October. Data capture for the monitoring period was 80%.
3.7 Carbon monoxide
Concentrations of carbon monoxide (CO) are recorded as 15-minute means by the
continuous analysers. 1-hour mean concentrations were calculated from the 15-minute
mean data for comparison with the UK Air Quality objective concentration. Time-series
plots of the running 8-hour mean concentration of CO are presented in Volume II of this
report. The running 8-hour mean concentrations for carbon monoxide were less than 1
mg/m3 for majority of the year at the M25, M4 and M60 sites and also for monitoring
period in Bell common Tunnel. There were no significant peaks at any of the sites.
Table 3-13 shows that there were no exceedances of the running 8-hour mean objective
for CO at any of the monitoring sites in 2010. High data capture rates were achieved for
CO at the M25, M4 and M60 motorway sites. Minor disruptions to data collection caused
by power failures or instrument faults are discussed in Section 2.
Table 3-13: Compliance with UK Air Quality objectives, carbon monoxide (CO)
Statistic Objective
concentration
Permitted number of
exceedances M25 M4 M60 Bell Common
Maximum running 8-hour mean
10 mg/m3 n/a 1.8 1.9 1.8 1.8
Calibrated data capture (% of calendar year)
n/a n/a 90 94 90 18*
* Bell Common Tunnel site in place between 27/10/2010 and 31/12/2010 (data capture 99.8%)
3.8 Lead
Concentrations of selected heavy metals are monitored at the M25 motorway site. The
measurement method follows that employed on the UK Heavy Metals Monitoring

Project Report
TRL 22 RPN744 (I)
Network in line with Directive 2004/107/EC (EC, 2004). The UK Air Quality Regulations
set an objective annual mean concentration for lead equal to or less than 0.25 g/m3.
Concentrations of other heavy metals which are not covered by the UK Air Quality
Regulations are discussed in section3.9.5.
The annual mean concentration of lead recorded at the M25 site in 2010 was well below
the UK Air Quality objective. A high data capture rate was achieved for lead monitoring
in 2010.
Table 3-14: Compliance with UK Air Quality objectives, lead
Statistic Objective
concentration Permitted number
of exceedances M25
Annual mean 0.25 g/m3 n/a 0.010
Data capture (% of calendar
year) n/a n/a 100
3.9 Pollutants not covered by the UK Air Quality Regulations
Concentrations of a number of pollutants not covered by the UK Air Quality Regulations
are recorded at sites within the Highways Agency long term roadside monitoring
network. Whilst these pollutants are not covered by UK legislation, guidance values for
safe levels of human exposure exist and it is therefore considered useful to monitor
concentrations. In addition, monitoring over an extended time period can provide a
useful indication of emissions trends at roadside sites.
3.9.1 Polycyclic aromatic hydrocarbons
PAH monitoring in the Highways Agency network began in 2003 at the M25 site and in
2004 at the M60 site. Benzo[a]pyrene (B[a]P) is the compound that is considered to be
representative for the cancer risk associated with the whole PAH mixture (EPAQS, 1999).
An annual mean concentration for B[a]P of 0.25 ng/m3 is the value listed in the UK Air
Quality Strategy (Defra, 2007) as an objective for PAH. This pollutant is not, however,
covered by EU Daughter Directives on Air Quality and is not therefore transposed into UK
law through the UK Air Quality Regulations.
There was a low data capture rate at both sites during 2010. This was largely due to
problems with partisol filters jamming during exchange at both sites. At the M25 site
there was prolonged data loss between 12/04/2010 and 04/06/2010 when a number of
onsite instrument repairs failed and the instrument was removed and sent away for
repair. There were also three other periods where the partisol filters jammed between
25/06/2010 and 05/07/2010, 19/09/2010 and 22/10/2010 and 30/11/2010 and
20/12/2010. The partisol did not jam for the whole periods but the number of filters
correctly collecting sample was insufficient to send away for analysis. There was missing
data at the beginning of January at both sites due to the filters running out over the
Christmas break and then site visits delayed due to heavy snowfall. At the M60 site
there was prolonged data loss between 28/03/2010 and 02/08/2010 due to an
instrument fault which took the service company a long time to fix. There was also a
filter jam between 18/08/2010 and 07/09/2010.
Table 3-15 presents the annual mean concentrations of B[a]P measured at the M25 and
M60 sites during 2010. The UK Air Quality Strategy provisional objective was exceeded
at both sites. This can only be used as a guide level as the data capture rate at the sites
was very low during 2010.
Project Report
TRL 23 RPN744 (I)
Table 3-15: Compliance with UK Air Quality provisional objective,
benzo[a]pyrene (B[a]P)
Statistic Objective
concentration
Permitted number of
exceedances M25 M60
Annual mean 0.25 ng/m3 n/a 0.26 0.34
Data capture (% of
calendar year)
n/a n/a 65.4 42.3
3.9.2 Aldehydes
Aldehydes are not included in the UK Air Quality Regulations. Human health effects
(including eye, skin and respiratory irritation and neurophysical and behavioural changes
(at particularly high levels)) resulting from exposure to aldehydes (particularly
formaldehyde) provide the reasons for measuring this group of pollutants. A report
prepared for the Committee on the Medical Effects of Air Pollution (COMEAP) records
threshold levels of exposure to formaldehyde being associated with sensory irritation in
the general population concentrations of approximately 0.6-1.2 mg/m3 for formaldehyde
and less than 90 mg/m3 for acetaldehyde6.
The monitoring of aldehydes at the M25 and M60 sites was stopped on 2nd August 2010
due to financial constraints on the project. Annual mean concentrations of formaldehyde
and acetaldehyde recorded at the M25 and M60 motorway sites in 2010 are presented in
Table 3-16. Concentrations were well below the recommended guidelines at both sites
during 2010. The data capture rate at both the M25 and M60 was 100 percent for the
period monitored.
Table 3-16: Annual mean concentration, acetaldehyde and formaldehyde
Pollutant
COMEAP recommended
maximum concentration
Statistic M25 M60
Acetaldehyde 90 mg/m3 Annual mean (mg/m3) 0.00057 0.00005
Formaldehyde 0.1-0.2 mg/m3 Annual mean (mg/m3) 0.00040 0.00043
Aldehydes n/a Data capture (% of
calendar year) 58 58
3.9.3 Total hydrocarbons
Total hydrocarbons and Methane are not included in the UK Air Quality Regulations or
Environment Agency Guidelines. However the UK government is committed to reduce
emissions of methane under the United Nations Framework Convention on Climate
Change (Kyoto Protocol). The target for the UK is to achieve a reduction of the global
warming potential of six greenhouse gases including methane of 12.5% by 2008-2012
(based on 1990 emissions estimates). Concentrations of total hydrocarbons (THC) and
methane (CH4) are measured at the M25 and M60 motorway sites. Long term problems
with the Flame Ionisation Detector (FID) method of data collection have meant that
results for non-methane hydrocarbons (NMHC) could not be validated and have not been
6 http://www.advisorybodies.doh.gov.uk/comeap/statementsreports/aldehydes-imperialcollreview.pdf

Project Report
TRL 24 RPN744 (I)
presented in this report. As no cost effective replacements for continuous ambient
hydrocarbon measurements could be found the decision was made to discontinue
monitoring NMHC. Data capture rates for concentrations of CH4 were slightly lower due
to a number of reasons including the flame going out on the FID, power cuts and at the
M60 the logger fault. Section 2 outlines when there is missing data and the explanation.
Table 3-17: Annual mean concentration, methane (CH4)
Statistic M25 M60
Annual mean (µg/m3) 0.97 1.56
Calibrated data capture (% of calendar year) 86 85
3.9.4 Ammonia
Ammonia (NH3) concentrations are recorded at the M4, M25 and M60 motorway sites
using passive diffusion tubes exposed at approximately 2-weekly intervals. The exposure
period was changed from 2-weekly to monthly sampling intervals at the beginning of
August. The change in sampling intervals was to make financial savings so that
monitoring could continue until the end of the year. Also an additional background site
was started at the M60 site at the beginning of September.
This pollutant is not included in the UK Air Quality Regulations. The Environment Agency
recommends a long term Environmental Assessment Level (EAL) of 180 µg/m3 as an
annual average7. The annual averages recorded at the Highways Agency roadside
monitoring sites in 2010 were well below this value.
At the M25 and M60 sites, triplicate tubes were deployed at two and three locations
respectively. At the M25 site, one set of tubes was deployed close to the inlet at the
roadside and the second set was deployed in the field at the rear of the monitoring
station 66m from the hard shoulder. A transact was deployed at 90 degrees to the
motorway at the M60 site, one set of tubes was deployed at the hard shoulder, the
second set was deployed at the inlet 18m from the roadside and the third set was
deployed at 39m from the hard should. At the M4 site, tubes were only located at the
hard shoulder at the sample inlet as no suitable background location was identified.
High data capture rates (i.e. above 90%) for ammonia were achieved at all three sites in
2010. The data capture rate at the M60 background site was also one hundred percent
for the monitoring period. One batch of samples from the M4 site in March was found to
have been removed from the inlet clips which resulted in a small period of data loss.
Table 3-18,Table 3-19 and Table 3-20 show the levels of ammonia found at the M60
roadside site are higher than the roadside (inlet) levels found at the M4 and M25 sites.
This is consistent with previous year’s results; however the concentrations in 2010 at the
M60 roadside site have decreased from an annual mean concentration of 12.9 µg/m3 in
2009. The annual mean concentration of ammonia at the inlet at the M60 site is similar
to those found at the M4 and M25 inlets; however the M60 inlet is 18m from the
roadside. The reason for the elevated levels of ammonia at the M60 roadside site is
unknown; there are no other known local sources however this result is consistent with
previous year’s results. The M60 Background site ammonia concentrations are lower
than the results at the M25 background site. The reason for the slightly higher ammonia
levels at the M25 background site could be due to the sheep that occasionally reside in
the field where the diffusion tubes are located.
7 Personal communication between TRL Ltd and Environment Agency, July 2010

Project Report
TRL 25 RPN744 (I)
Table 3-18: M25 Annual mean concentration, ammonia (NH3)
Site
Environmental Assessment Level (EAL)
annual mean
µg/m3
Annual mean
(µg/m3)
Data capture (% of
calendar year)
Distance from hard
shoulder (m)
Grid reference
(OS)
Sample tube
height
(m)
Roadside tube average (µg/m3)
180 5.93 100 2m 502807,173568 1.9 m
Background tube average (µg/m3)
180 7.78 100 50m 502745,173520 1.7m
Table 3-19: M4 Annual mean concentration, ammonia (NH3)
Site
Environmental Assessment Level (EAL)
annual mean
µg/m3
Annual mean
(µg/m3)
Data capture (% of
calendar year)
Distance from hard
shoulder (m)
Grid reference
(OS)
Sample tube
height
(m)
Roadside tube average (µg/m3)
180 5.63 94 0.5m 469937,169428 1.5m
Table 3-20 M60 Annual mean concentration, ammonia (NH3)
Site
Environmental Assessment Level (EAL)
annual mean
µg/m3
Annual mean
(µg/m3)
Data capture (% of
calendar year)
Distance from hard
shoulder (m)
Grid reference
(OS)
Sample tube
height
(m)
Roadside tube average (µg/m3)
180 8.62 100 1m 381294,405022 1.5m
Inlet tube average (µg/m3)
180 5.51 100 18m 381310,405004 3.5m
Background tube average (µg/m3)
180 3.75 22* 39m 381309,404983 2.1m
*Monitoring period 7/09/2010 to 31/12/2010
3.9.5 Heavy metals
Concentrations of selected heavy metals are recorded at the M25 motorway site. Lead is
included in the UK Air Quality Regulations and results obtained for this pollutant at the
M25 site in 2010 are discussed in Section 3.8. Annual mean concentrations of arsenic,
cadmium and nickel are also subject to target values under the 4th Daughter Directive
(2004/107/EC)8. Target values set under this directive require member states to take all
cost effective abatement measures but do not require them to undertake any measures
entailing disproportionate costs. Target values are 6 ng/m3, 5 ng/m3 and 20 ng/m3 for
8 http://eur-lex.europa.eu/LexUriServ/LexUriServ.do?uri=CELEX:32004L0107:EN:NOT

Project Report
TRL 26 RPN744 (I)
arsenic, cadmium and nickel respectively. Annual mean concentrations of arsenic,
cadmium and nickel recorded at the M25 site remained well below these target values in
2010 (see Table 3-21).
Table 3-21: Annual mean concentration, heavy metals
Pollutant Statistic Target Value M25
Arsenic
Annual mean (ng/m3) 6 ng/m3 0.74
Data capture (% of calendar year)
n/a 100
Cadmium
Annual mean (ng/m3) 5 ng/m3 0.06
Data capture (% of calendar year) n/a 100
Nickel
Annual mean (ng/m3) 20 ng/m3 1.53
Data capture (% of calendar year) n/a 100
3.9.6 Hydrogen sulphide
Concentrations of hydrogen sulphide (H2S) are measured at the M25 and M60 motorway
sites. This pollutant is not included in the UK Air Quality Regulations. The Environment
Agency9 recommends a long term EAL of 140 µg/m3. Annual average concentrations of
H2S recorded at the Highways Agency roadside monitoring sites in 2010 were well below
this value. High data capture rates (i.e. above 90%) for H2S were achieved at the M25
site in 2010. The data capture rate at the M60 site was slightly lower due to a number of
issues including power failures and instrument faults as discussed in Section 2.4.
Table 3-22: Annual mean concentration, hydrogen sulphide (H2S)
Statistic
Environmental Assessment Level (EAL) long term
µg/m3
M25 M60
Annual mean (µg/m3) 140 4.96 8.15
Calibrated data capture (% of calendar year)
n/a 95 85
3.10 Traffic data
In addition to pollutant concentrations, information on total traffic flow only are collected
by Automatic Traffic Counters (ATCs) at the M4, M25, and M60 sites (see Table 3-23). As
a result of ongoing refurbishment work of the Bell Common tunnel traffic data was not
available. Traffic flows recorded in 2010 at each monitoring site are presented together
with historical datasets in Volume II.
9 http://publications.environment-agency.gov.uk/pdf/GEHO1105BJXV-e-e.pdf
Project Report
TRL 27 RPN744 (I)
Table 3-23: Annual average daily and hourly traffic flow
Statistic M25 M4 M60
Annual average daily traffic flow CW 97632 EB 54869
WB 54339
CW 80390
ACW 79405 ACW 98410
Annual average vehicles per hour CW 4183 EB 2286
WB 2264
CW 3350
ACW 3309 ACW 4192
Data capture (% of calendar year) CW 97 EB 75
WB 86
CW 92
ACW 90 ACW 98
CW: clockwise; ACW: anti-clockwise; EB: Eastbound; WB: Westbound

Project Report
TRL 28 RPN744 (I)
4 Summary
This report provides a summary of air pollutant concentrations, meteorological data and
traffic flows measured at four motorway sites during the calendar year 2010 as part of
the Highways Agency long term roadside monitoring network.
The report compares concentrations of pollutants with objectives set out by the UK Air
Quality Regulations. The following exceedances have been recorded during 2010:
The annual mean NO2 objective concentration of 40 µg/m3 was exceeded at the
M25, M4 and M60 monitoring sites.
There were no exceedances of the 1-hour mean NO2 objective concentration of
200 µg/m3.
Exceedance of the running 8-hour mean O3 objective of 100 µg/m3 occurred at
the M60 and M4 sites.
There were no exceedances of the relevant objectives for SO2, PM10, benzene, CO
or lead at any of the monitoring sites.
Monitoring at Bell Common Tunnel site was only for two months between October and
December and therefore the results should be treated with caution when comparing with
other yearly data sets. During the two month monitoring period the NO2 annual mean
objective and one hour mean objective were both exceeded which provides an indicative
result for the expected results for 2010.
Concentrations of pollutants not covered by the UK Air Quality Regulations are reported
and discussed with reference to Environment Agency guidelines of other health
standards where applicable.
The provisional UK Air Quality objective for PM2.5 was met at all sites.
The provisional UK Air Quality objective for benzo[a]pyrene was exceeded at both
sites. It should be noted that these results are only indicative as due to technical
faults the data capture rate at both the M25 and M60 sites is low.
There were no exceedances of Environmental Assessment Level guideline values
for NH3 or H2S reported at the Highways Agency monitoring sites in 2010.
There were no exceedances of target values for heavy metals (arsenic, cadmium
and nickel) recorded at the M25 site 2010.
There were no exceedances of the COMEAP recommended maximum exposure
value for aldehydes (acetaldehyde and formaldehyde) recorded at the Highways
Agency sites in 2010.

Project Report
TRL 29 RPN744 (I)
References
Air Quality (England) Regulations 2000. Statutory Instrument 2000 No. 928.
http://www.opsi.gov.uk/si/si2000/20000928.htm
Air Quality (England) (Amendment) Regulations 2002. Statutory Instrument 2002. No.
3043. http://www.opsi.gov.uk/si/si2002/20023043.htm
Boulter P G, McCrae I S and Green J (2007). Primary NO2 emissions from vehicles in the
Hatfield and Bell Common Tunnels. TRL report PPR 262. TRL, Wokingham.
Defra (2007). The Air Quality Strategy for England, Scotland, Wales and Northern
Ireland: July 2007, Cm 7169 NIA 61/07-07. Department for Environment, Food and
Rural Affairs, the Scottish Executive, Welsh Assembly Government and the Department
of the Environment for Northern Ireland. The Stationary Office, London.
EC (2004). Directive 2004/107/EC of the European Parliament and of the Council relating
to arsenic, cadmium, mercury, nickel and polycyclic aromatic hydrocarbons in ambient
air.
EPAQS (1999). Polycyclic aromatic hydrocarbons. Expert Panel on Air Quality Standards.
Report for the former Department of the Environment, Transport and the Regions. DETR,
London.
Green J (2005). Impact of reduced emissions on air quality: the monitoring of aromatics
and aldehydes 1995 to 2003. TRL report UPR SEA/02/05. TRL, Wokingham.
Highways Agency (2007). The Highways Agency roadside air pollution monitoring
network 2005. TRL report PPR 192. TRL, Wokingham.
Highways Agency (2008). The Highways Agency roadside air pollution monitoring
network 2006. TRL report PPR 371. TRL, Wokingham.
Highways Agency (2004). The Highways Agency roadside air pollution monitoring
network 2002. TRL report UPR SE/020/04. TRL, Crowthorne.
Highways Agency (2003). The Highways Agency roadside air pollution monitoring
network 1992 to 2001. TRL report PR SE/742/03. TRL, Crowthorne.
Highways Agency (2005). The Highways Agency roadside air pollution monitoring
network 2003. TRL report UPR SE/145/04. TRL, Wokingham.
Highways Agency (2010). The Highways Agency roadside air pollution monitoring
network 2008 Volume II. TRL report RPN 744. TRL, Wokingham.
WHO (2000). Air quality guidelines for Europe, 2nd edition. World Health Organisation
Regional Publications, No. 91. WHO.

Project Report
TRL 30 RPN744 (I)
Appendix A Figures and locations of monitoring sites
A.1 M4 (Theale 2), Pinglewood
A.1.1 Ordnance Survey map
© Crown copyright. All rights reserved. License No. AL100021177
M4 Theale 2
N
Project Report
TRL 31 RPN744 (I)
A.1.2 Site photos
A.1.2.1 M4 monitoring station
A.1.2.2 Selection of instruments inside the M4 monitoring station

Project Report
TRL 32 RPN744 (I)
A.2 M25, Bell Common Tunnel
A.2.1 Ordnance Survey map
© Crown copyright. All rights reserved. License No. AL100021177
Bell Common
Tunnel
N
Project Report
TRL 33 RPN744 (I)
A.2.2 Site photos
A.2.2.1 Bell Common Tunnel monitoring station
A.2.2.2 Selection of instruments inside the Bell Common Tunnel monitoring station

Project Report
TRL 34 RPN744 (I)
A.3 M25 (M25B), Staines
A.3.1 Ordnance Survey map
© Crown copyright. All rights reserved. License No. AL100021177
M25B
N

Project Report
TRL 35 RPN744 (I)
A.3.2 Site photos
A.3.2.1 M25 monitoring station
A.3.2.2 Selection of instruments inside the M25 monitoring station
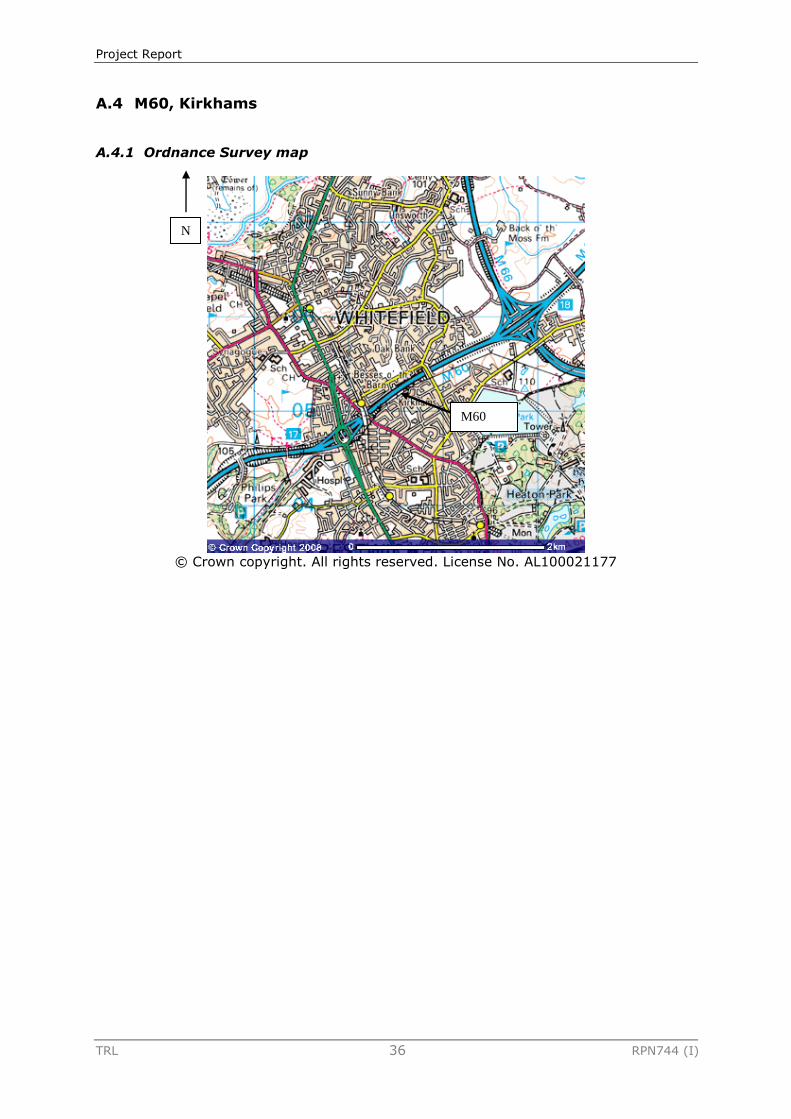
Project Report
TRL 36 RPN744 (I)
A.4 M60, Kirkhams
A.4.1 Ordnance Survey map
© Crown copyright. All rights reserved. License No. AL100021177
M60
N
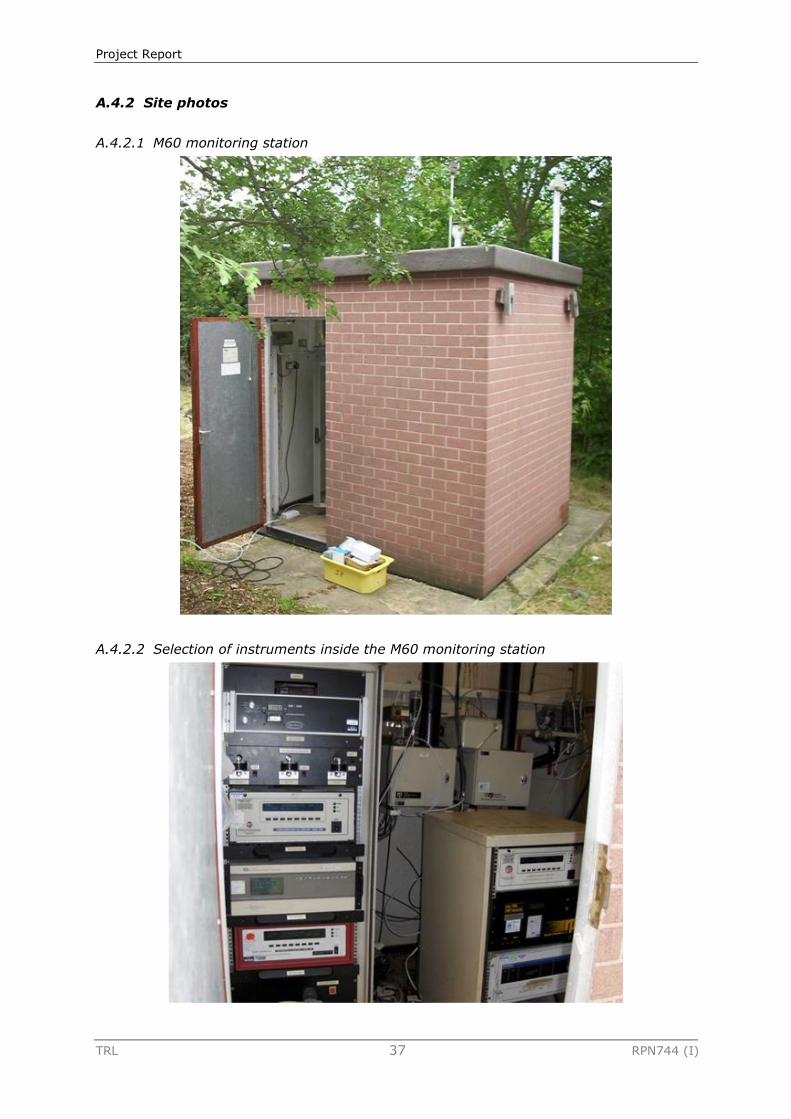
Project Report
TRL 37 RPN744 (I)
A.4.2 Site photos
A.4.2.1 M60 monitoring station
A.4.2.2 Selection of instruments inside the M60 monitoring station
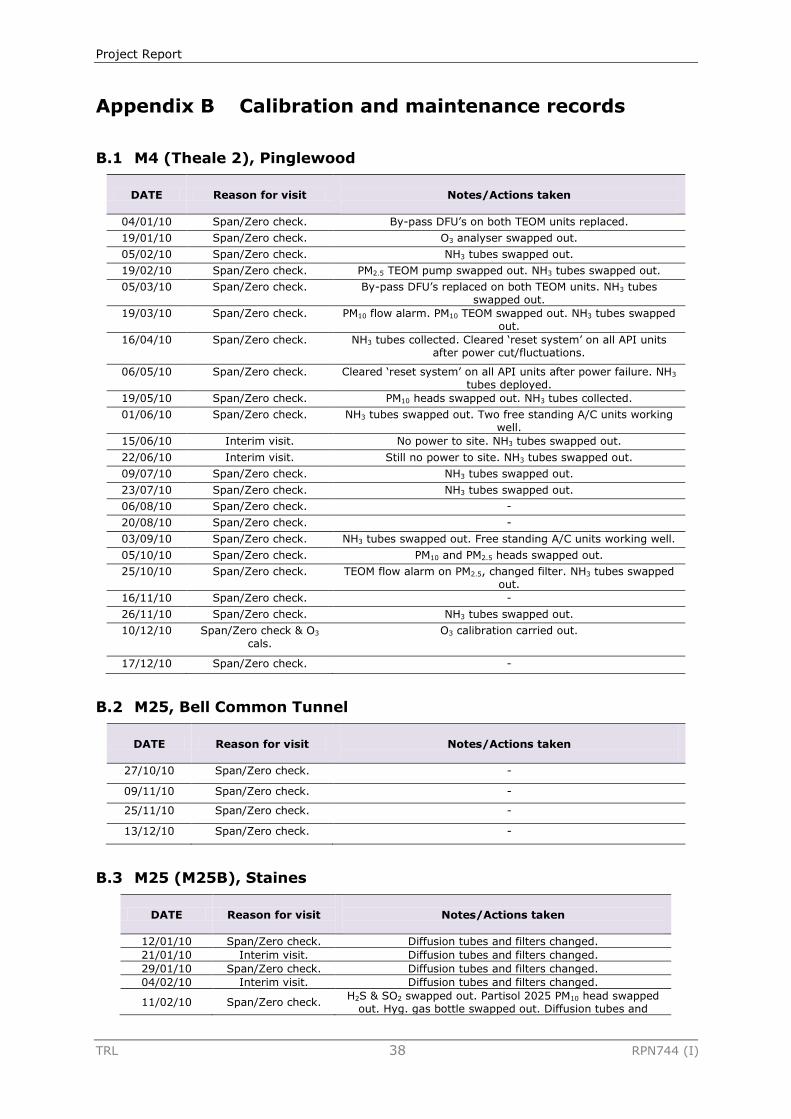
Project Report
TRL 38 RPN744 (I)
Appendix B Calibration and maintenance records
B.1 M4 (Theale 2), Pinglewood
DATE Reason for visit
Notes/Actions taken
04/01/10 Span/Zero check. By-pass DFU’s on both TEOM units replaced.
19/01/10 Span/Zero check. O3 analyser swapped out.
05/02/10 Span/Zero check. NH3 tubes swapped out.
19/02/10 Span/Zero check. PM2.5 TEOM pump swapped out. NH3 tubes swapped out.
05/03/10 Span/Zero check. By-pass DFU’s replaced on both TEOM units. NH3 tubes swapped out.
19/03/10 Span/Zero check. PM10 flow alarm. PM10 TEOM swapped out. NH3 tubes swapped out.
16/04/10 Span/Zero check. NH3 tubes collected. Cleared ‘reset system’ on all API units after power cut/fluctuations.
06/05/10 Span/Zero check. Cleared ‘reset system’ on all API units after power failure. NH3 tubes deployed.
19/05/10 Span/Zero check. PM10 heads swapped out. NH3 tubes collected.
01/06/10 Span/Zero check. NH3 tubes swapped out. Two free standing A/C units working well.
15/06/10 Interim visit. No power to site. NH3 tubes swapped out.
22/06/10 Interim visit. Still no power to site. NH3 tubes swapped out.
09/07/10 Span/Zero check. NH3 tubes swapped out.
23/07/10 Span/Zero check. NH3 tubes swapped out.
06/08/10 Span/Zero check. -
20/08/10 Span/Zero check. -
03/09/10 Span/Zero check. NH3 tubes swapped out. Free standing A/C units working well.
05/10/10 Span/Zero check. PM10 and PM2.5 heads swapped out.
25/10/10 Span/Zero check. TEOM flow alarm on PM2.5, changed filter. NH3 tubes swapped out.
16/11/10 Span/Zero check. -
26/11/10 Span/Zero check. NH3 tubes swapped out.
10/12/10 Span/Zero check & O3
cals.
O3 calibration carried out.
17/12/10 Span/Zero check. -
B.2 M25, Bell Common Tunnel
DATE Reason for visit
Notes/Actions taken
27/10/10 Span/Zero check. -
09/11/10 Span/Zero check. -
25/11/10 Span/Zero check. -
13/12/10 Span/Zero check. -
B.3 M25 (M25B), Staines
DATE Reason for visit
Notes/Actions taken
12/01/10 Span/Zero check. Diffusion tubes and filters changed.
21/01/10 Interim visit. Diffusion tubes and filters changed.
29/01/10 Span/Zero check. Diffusion tubes and filters changed.
04/02/10 Interim visit. Diffusion tubes and filters changed.
11/02/10 Span/Zero check. H2S & SO2 swapped out. Partisol 2025 PM10 head swapped
out. Hyg. gas bottle swapped out. Diffusion tubes and
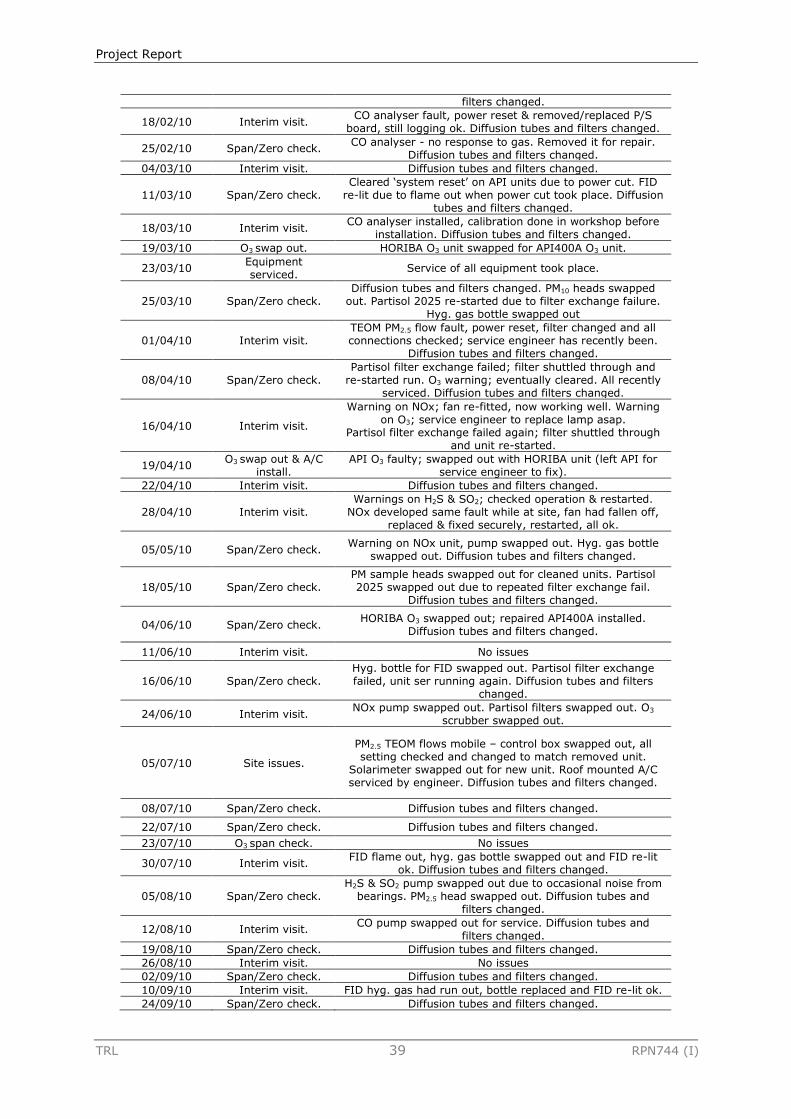
Project Report
TRL 39 RPN744 (I)
filters changed.
18/02/10 Interim visit. CO analyser fault, power reset & removed/replaced P/S
board, still logging ok. Diffusion tubes and filters changed.
25/02/10 Span/Zero check. CO analyser - no response to gas. Removed it for repair.
Diffusion tubes and filters changed.
04/03/10 Interim visit. Diffusion tubes and filters changed.
11/03/10 Span/Zero check. Cleared ‘system reset’ on API units due to power cut. FID
re-lit due to flame out when power cut took place. Diffusion tubes and filters changed.
18/03/10 Interim visit. CO analyser installed, calibration done in workshop before
installation. Diffusion tubes and filters changed.
19/03/10 O3 swap out. HORIBA O3 unit swapped for API400A O3 unit.
23/03/10 Equipment serviced.
Service of all equipment took place.
25/03/10 Span/Zero check. Diffusion tubes and filters changed. PM10 heads swapped
out. Partisol 2025 re-started due to filter exchange failure. Hyg. gas bottle swapped out
01/04/10 Interim visit. TEOM PM2.5 flow fault, power reset, filter changed and all connections checked; service engineer has recently been.
Diffusion tubes and filters changed.
08/04/10 Span/Zero check. Partisol filter exchange failed; filter shuttled through and
re-started run. O3 warning; eventually cleared. All recently serviced. Diffusion tubes and filters changed.
16/04/10 Interim visit.
Warning on NOx; fan re-fitted, now working well. Warning on O3; service engineer to replace lamp asap.
Partisol filter exchange failed again; filter shuttled through and unit re-started.
19/04/10 O3 swap out & A/C
install. API O3 faulty; swapped out with HORIBA unit (left API for
service engineer to fix).
22/04/10 Interim visit. Diffusion tubes and filters changed.
28/04/10 Interim visit. Warnings on H2S & SO2; checked operation & restarted.
NOx developed same fault while at site, fan had fallen off, replaced & fixed securely, restarted, all ok.
05/05/10 Span/Zero check. Warning on NOx unit, pump swapped out. Hyg. gas bottle
swapped out. Diffusion tubes and filters changed.
18/05/10 Span/Zero check. PM sample heads swapped out for cleaned units. Partisol 2025 swapped out due to repeated filter exchange fail.
Diffusion tubes and filters changed.
04/06/10 Span/Zero check. HORIBA O3 swapped out; repaired API400A installed.
Diffusion tubes and filters changed.
11/06/10 Interim visit. No issues
16/06/10 Span/Zero check. Hyg. bottle for FID swapped out. Partisol filter exchange failed, unit ser running again. Diffusion tubes and filters
changed.
24/06/10 Interim visit. NOx pump swapped out. Partisol filters swapped out. O3
scrubber swapped out.
05/07/10 Site issues.
PM2.5 TEOM flows mobile – control box swapped out, all setting checked and changed to match removed unit.
Solarimeter swapped out for new unit. Roof mounted A/C serviced by engineer. Diffusion tubes and filters changed.
08/07/10 Span/Zero check. Diffusion tubes and filters changed.
22/07/10 Span/Zero check. Diffusion tubes and filters changed.
23/07/10 O3 span check. No issues
30/07/10 Interim visit. FID flame out, hyg. gas bottle swapped out and FID re-lit
ok. Diffusion tubes and filters changed.
05/08/10 Span/Zero check. H2S & SO2 pump swapped out due to occasional noise from
bearings. PM2.5 head swapped out. Diffusion tubes and filters changed.
12/08/10 Interim visit. CO pump swapped out for service. Diffusion tubes and
filters changed.
19/08/10 Span/Zero check. Diffusion tubes and filters changed.
26/08/10 Interim visit. No issues
02/09/10 Span/Zero check. Diffusion tubes and filters changed.
10/09/10 Interim visit. FID hyg. gas had run out, bottle replaced and FID re-lit ok.
24/09/10 Span/Zero check. Diffusion tubes and filters changed.

Project Report
TRL 40 RPN744 (I)
07/10/10 Span/Zero check. Diffusion tubes and filters changed.
14/10/10 Interim visit. H2S & SO2 system reset warning, cleared ok.
Hyg. gas bottle swapped out.
21/10/10 Span/Zero check. TEOM PM10 head swapped out. Diffusion tubes and filters
changed.
28/10/10 Interim visit. FID gave negative values on sample but flame was lit (?).
04/11/10 Span/Zero check. NOx swapped out temperature warning. FID had no
response to gas – removed for investigation. Diffusion tubes and filters changed.
08/11/10 NOx re-install. NOx re-installed after repairs
17/11/10 Span/Zero check. Diffusion tubes and filters changed.
25/11/10 Interim visit. Partisol filter exchange failed; 1 cassette forced through
and unit set running again.
09/12/10 Span/Zero check. FID re-installed. O3 cals carried out. Diffusion tubes and
filters changed.
16/12/10 Interim visit. Diffusion tubes and filters changed.
22/12/10 Span/Zero check. Comms checked. FID hyg, bottle swapped for full to cover holiday period. H2S & SO2 temp warning, unit calibration
checks ok.
B.4 M60, Kirkhams
DATE Reason for visit
Notes/Actions taken
18/01/10 Span/Zero check. NH3 tubes swapped out. Partisol filters running ok.
01/02/10 Span/Zero check. No H2S gas. No comms to Partisol.
16/02/10 Span/Zero check. Partisol filters running ok.
01/03/10 Span/Zero check. Changed modem.
15/03/10 Span/Zero check. PM10, PM2.5 and Partisol sample heads changed.
29/03/10 Span/Zero check. BTEX tubes changed. Partisol being repaired.
14/04/10 Tubes changed Partisol, BTEX, and DNPH tubes changed.
29/04/10 Span/Zero check. -
10/05/10 Span/Zero check. Partisol being repaired.
24/05/10 Span/Zero check. Tubes to be changed later in the week.
07/06/10 Span/Zero check. Partisol working ok.
24/06/10 Span/Zero check. -
19/07/10 Span/Zero check. NH3 tubes collected. Cleared partisol jam.
02/08/10 Span/Zero check. NH3 tubes swapped out.
20/08/10 Span/Zero check. -
07/09/10 Span/Zero check. NH3 and NO2 tubes distributed.
20/09/10 Span/Zero check. -
14/10/10 Span/Zero check. Repaired regulator value assemblies.
15/11/10 Span/Zero check. Partisol jammed, no filters passed, reset, now ok. Faulty
modem on Partisol. Repaired CO filter assembly.
02/12/10 Span/Zero check. -

Project Report
TRL 41 RPN744 (I)
Appendix C Meteorological data
Meteorological data were collected at three of the four current monitoring sites. These
data were recorded to enable analysis of long term trends in emissions and pollutant
concentrations at each monitoring site.
C.1 Meteorological data
Statistic M25 M4 M60
Annual average wind speed (m/s) 1.89 1.41 0.22
Annual maximum wind speed (m/s) 8.41 8.49 3.26
Annual minimum wind speed (m/s) 0.15 0.00 0.00
Wind speed data capture (% of calendar year)
99.8 95.0 88.6
Annual average wind direction (degrees from north)
182.02 125.27 175.05
Wind direction data capture (% of calendar year)
99.8 95.0 93.3
Annual average temperature (⁰C) 11.25 10.03 10.23
Annual maximum temperature (⁰C) 30.38 31.46 27.55
Annual minimum temperature (⁰C) -8.19 -10.79 -7.75
Temperature data capture (% of calendar year)
99.8 95.0 72.3
Annual average relative humidity (%) 61.49 62.16 66.59
Annual maximum relative humidity (%) 92.08 99.9 92.03
Annual minimum relative humidity (%) 0.70 7.80 4.15
Relative humidity data capture (% of calendar year)
99.8 94.9 93.3
Annual average solar radiation (W/m2) 134.29 - -
Annual maximum solar radiation (W/m2)
1012.40 - -
Annual minimum solar radiation (W/m2) 0.00 - -
Solar radiation data capture (% of calendar year)
92.1 - -

Project Report
TRL 42 RPN744 (I)
Appendix D Air Quality Strategy objectives
D.1 UK Air Quality Strategy objectives
Pollutant Objective Compliance date
Nitrogen dioxide (NO2)
Hourly mean concentration should not exceed 200 μg/m3 more than 18 times a year
Annual mean concentration should not exceed 40 μg/m3 31 December 2005
Particulate matter,
expressed as PM10
24-hour mean concentration should not exceed 50 μg/m3 more than 35 times a year
Annual mean concentration should not exceed 40 μg/m3 31 December 2004
Particulate
matter,
expressed as PM2.5
Annual mean concentration should not exceed 25 μg/m3 in UK 2020
Benzene Running annual mean concentration should not exceed 16.25
μg/m3
Annual mean concentration should not exceed 5 μg/m3
31 December 2003
31 December 2010
1,3-butadiene
Running annual mean concentration should not exceed 2.25 μg/m3
31 December 2003
Carbon monoxide
(CO)
Maximum running 8-hour mean concentration should not exceed 10 mg/m3
31 December 2003
Polycyclic aromatic
hydrocarbons (PAH)
Annual mean concentration should not exceed 0.25 ng/m3 31 December 2010
Lead (Pb) Annual mean concentration should not exceed 0.5 μg/m3 Annual mean concentration should not exceed 0.25 μg/m3
31 December 2004
31 December 2008
Sulphur dioxide (SO2)
Hourly mean concentration of 350 μg/m3 not to be exceeded more than 24 times a year
24-hour mean of 125 μg/m3 not to be exceeded more than 3 times a year
15-minute mean of 266 μg/m3 not to be exceeded more than
35 times a year
31 December 2004
31 December 2004
31 December 2005
Ozone (O3) 8-hour mean of 100 μg/m3 not to be exceeded more than 10
times a year 31 December 2005

Project Report
TRL 43 RPN744 (I)
Appendix E Conversion factors
E.1 Conversion factors
Pollutant Conversion factor
Ozone 1 ppb = 2.00 µg/m3
Nitrogen oxide (as NO2 equivalent)
1 ppb = 1.91 µg/m3
Nitrogen dioxide 1 ppb = 1.91 µg/m3
Sulphur dioxide 1 ppb = 2.66 µg/m3
Methane 1 ppm = 0.67 mg/m3
Non-methane
hydrocarbons 1 ppm = 0.58 mg/m3
Carbon monoxide 1 ppm = 1.16 mg/m3
Ammonia 1 ppb = 0.71 µg/m3
Hydrogen sulphide 1 ppb = 1.42 µg/m3