the grading of soft tissue sarcomas results of a clinicohistopathologic correlation in a series of...
TRANSCRIPT

The Grading of Soft Tissue Sarcomas
Results of a Clinicohistopathologic Correlation in a Series of 163 Cases
JOSE COSTA,’ R. A. WESLEY,t E. GLATSTE1N.S AND S. A. ROSENBERGS
A multidisciplinary study of 163 patients treated at the NCI for soft tissue sarcomas allowed the correlation of a number of histologic features (histologic type, mitosis, necrosis, pleomorphism, cellularity, and matrix) of the primary lesion to time to recurrence and overall survival of the patients. The results of the stratified analyses show that necrosis is the single best histopathologic parameter to predict the time to recurrence (P = 0.025) and the overall survival of the patients ( P = 0.002). Necrosis in the primary lesion is also of value in predicting survival after the first recurrence has taken place (P = 0.001). The value of necrosis in the primary lesions predicting the clinical course after recurrence appears to be independent of age, sex, location, and size of the tumor. The authors propose a grading system based on histologic typing and histologic parameters to identify a group of lesions with minimal metastatic potential (Grade l), and on the use of necrosis to distinguish between aggressive lesions with good patient survival (Grade 2) and aggressive lesions with poor patient survival (Grade 3).
Cuncer 53530441, 1984.
LTHOUGH the management of soft tissue sarcomas A is dictated in great part by the size and the location of the tumor, other factors with prognostic value are im- portant in deciding the optimal treatment for a given patient. It is well known that certain histological types or subtypes of sarcoma as defined by the World Health Organization (WHO) classification’ have a slow clinical course and low metastatic potential, whereas other types characteristically exhibit a very aggressive course. Hence, the histologic type of sarcoma contributes substantially to the guidance of therapy in some cases. The recognition, however, that some histologic types exhibit a wide spec- trum of biological behavior, has lead a number of clinical investigators to propose the “grade of malignancy” as an important prognostic Grading systems have been difficult to define and the application of criteria
From the Laboratory of Pathology,’ Biometrics Branch,t Radiation Therapy Branch,$ and Surgery Branch,§ of the National Cancer Institute, National Institutes of Health, Bethesda, Maryland.
Address for reprints: Dr. Jose Costa, lnstitut de Pathologie. Rue du Bugnon 19, 101 I Lausanne, Switzerland.
The authors are indebted to the many pathologists who contributed material for our studies; their patience and generosity in loaning not only slides, but also blocks and wet tissue, made this study possible. Many housestaff and fellows have worked in the several departments involved in the study; the senior staff of the Surgery Branch and Radiation Oncology Branch cared for the patients, the staff of the Laboratory of Pathology camed out many of the dissections involved in the workup of pathologic specimens. Dr. W. Ouazzani and Ms. Claudia Seipp helped with data retrieval and review. The authors are also grateful to R. Isenburg for photographic assistance and to P. Kouroyen for typing the manuscript.
Accepted for publication June I , 1983.
involves a great deal of judgment that is difficult to de- scribe in precise terms.
The multidisciplinary experience accumulated at the National Cancer Institutes (NCI) since 1975, when a series of randomized clinical trials on patients with soft tissue sarcoma (STS) was initiated, has provided us with the opportunity to study the correlation of several histo- pathologic parameters with the response to therapy. In this article, we present the results of these correlations and a simplified grading strategy which should be widely tested. Because statistical analysis is not free of interpre- tative bias we give detailed information in tabular form. In this way we hope that other workers in the field can use our experience and compare it to their own.
Materials and Methods
Patient Popiilution
This series is based on the study of 163 patients treated and being followed at the NCI. All patients have had their definitive surgical therapy no later than 6 months after the establishment of a tissue diagnosis of STS. De- finitive therapy for the primary lesion was administered between December I I , I974 and July 2 I , I98 I . The details of the surgical technique, radiation therapy and adjuvant chemotherapy have been given in previous publica- t i o n ~ . ~ - ~ The age of the patients at time of definitive sur- gery for the primary tumor ranged from 11.4 to 64.3 years, with a median age at the time of therapy of 41.9 years. The age distribution is given in Table I . There
5 30

No. 3 GRADING OF SARCOMAS - Costa et al. 5 3 I
TABLE 1. Characteristics of the Patient’s Evaluated
No. of % of No. of % of patients total patients total
Age: decade 10-19 20-29 30-39 40-49 50-59 60-69
Site: Arm Proximal Arm Distal Forearm and Hand Thigh Proximal Thigh Distal Leg and Foot Head and Neck Trunk Retroperitoneal
Head, neck and trunk, retroperitoneal,
Head, neck and trunk, nonretroperitoneal,
Head, neck and trunk, retroperitoneal, no
Head, neck and trunk, nonretroperitoneal,
Extremity, amputation, chemotherapy,
Extremity, amputation, chemotherapy,
Extremity, amputation, no chemotherapy,
Extremity, amputation, no chemotherapy,
Extremity, conservative surgery,
Extremity, conservative surgery,
Stratification*
chemotherapy
chemotherapy
chemotherapy
no chemotherapy
proximal
distal
proximal
distal
chemotherapy, proximal
chemotheraw. distal
13 36 26 28 46 14
9 6
12 44 20 12 6
30 24
16
23
8
13
12
15
5
5
17
18
8.0 Extremity, conservative surgery, no 22. I chemotherapy, proximal 16.0 Extremity, conservative surgery, no 17.2 chemotherapy, distal 28.2 Histologic types
8.6 Well differentiated liposarcoma Myxoid liposarcoma Round cell liposarcoma Pleomorphic liposarcoma Liposarcoma not classified Synovial sarcoma Malignant fibrous histiocytoma Alveolar soft part sarcoma Malignant granular cell tumor Leiom yosarcoma Neurofi brosarcoma Unclassified Fibrosarcoma Malignant HPC Angiosarcoma Pleomorphic rhabdomyosarcoma Clear cell sarcoma Epithelioid malignant Schwannoma
Grade 1 Grade 2 Grade 3 NE
Grade:
Distribution of patients by length of follow- UP
Less than I 1-2 2-3 3-4 4-5 Over 5
Time followed in tears
15
16
6 7 7
17 I
19 34
1 1
19 13 23
6 2 2 3 I 1
14 52 83 14
0 I I 45 22 27 58
* All patient’s underwent surgical resection that resulted in removal of all gross tumor.
were 10 1 males and 62 females. White patients accounted for 85.3% of the cases, 1 I .7% were black, 1.2% Oriental, and 1.8% belonged to other races. Follow-up of the pa- tients ranged between 268 and 2926 days (median, 1539 days).
One hundred three patients had a lesion in the ex- tremity, whereas 60 patients presented with head, neck, or trunk tumors. Twenty-four of the latter group were located in the retroperitoneum. Table 1 provides the de- tailed location of the lesions. For stratification purposes, the lesions in the extremities occurring within the prox- imal half of the arm and proximal half of the thigh were classified as proximal, the rest of the extremity lesions were classified as distal.
All patients were treated by the Surgery Branch and the Radiation Oncology Branch of the NCI. Therapy for local control was either radical surgery or local excision plus radiation therapy. Details of the surgical therapy and
NE: not evaluable due to technical reasons or sampling problems.
radiation therapy have been presented el~ewhere.~-~ In brief, all patients underwent resection of all gross tumors. All patients with head, neck and trunk lesions greater than Grade 1 received radiotherapy. All patients with extremity sarcomas greater than Grade 1 that received limb-sparing surgery received radiation therapy. The dis- tribution of patients in each treatment group is given in Table 1.
Pathologic Features
All available material for each of the patients in the study was reviewed without knowledge of the clinical course. For each operation the information recorded in- cluded presence or absence of tumor, histologic type of the tumor, grade of malignancy, mitotic activity, necrosis, pleomorphism, cellularity and matrix. For the primary tumor the review included review of the gross morphology

532 CANCER February I 1984 V O l . 5 3
TABLE 2. Grade of Malignancy of Soft Tissue Sarcoma as Assigned at the Beginning of the Studies
Histologic type
Well differentiated liposarcoma Myxoid liposarcoma Round cell liposarcoma Pleomorphic liposarcoma
Fibrosarcoma
Malignant fibrous histiocytoma Inflammatory malignant fibrous histiocytoma Myxoid malignant fibrous histiocytoma D.F.S.P. Malignant giant cell tumor
Leiom yosarcoma Malignant hemangiopericytoma
Embryonal rhabdomyosarcoma Alveolar rhabdomyosarcoma Pleomorphic rhabdomyosarcoma Combined rhabdomyosarcoma
Chondrosarcoma Mesenchymal chondrosarcoma Myxoid chondrosarcoma
Osteosarcoma
Soft tissue sarcoma resembling Ewing's sarcoma
Synovial sarcoma
Epithelioid sarcoma
Clear cell sarcoma
Malignant superficial schwannoma Neurofibrosarcoma Epithelioid schwannoma Malignant Triton tumor
Angiosarcoma
Alveolar soft part sarcoma
Malignant granular cell tumor
Kaoosi's sarcoma
Grade*
1 2 3
x - - x - - - x x - - x - x x - x x - x x - x - x - - - x x x x x x x x
X X X X
x x x X
x x - X
X
X
- x x - x x - x - x x x - x x
X
- x x X
- x x - x x
- - - - - - - -
- -
- - - - - -
- -
- -
* The possible variation in grade is indicated for each recognized common histological type.
and review of all the slides available. When sampling was judged inadequate further tissue was obtained. In a few cases either the histologic type or the grade could not be amved for because of sampling problems. In general we considered adequate sampling at least 2 sections in lesions up to 3 cm in largest dimension, a minimum of 5 sections for lesions up to 10 cm in largest dimension, and up to 10 sections for lesions 20 cm or larger.
the basis of hematoxylin and eosin (H & E) stained slides. In some cases special stains were used including trichrome, reticulin, periodic acid-Schiff (PAS) with and without diastase, Alcian blue, oil red-0 and iron.
Grade of Malignancy
The grade of malignancy was estimated using a com- bination of the histologic type or subtype and a composite of histopathologic parameters that included necrosis, cel- lularity, pleomorphism and mitosis.
During 1975 and 1976, after review of the literature, a grading strategy was designed based on the following principles. Each histologic type or subtype is known to have a spectrum of biological behavior. Some tumors exhibit a narrow spectrum namely a very prolonged be- nign course, e.g., myxoid liposarcoma, whereas other le- sions are consistently aggressive. The range attributed to each type and used as a grading guide since 1976 is given in Table 2. The Grade 1 lesions included: myxoid and well differentiated liposarcoma, deep seated dermatofi- brosarcoma protuberans, leiomyosarcoma, malignant hemangiopericytoma, malignant schwannoma and chor- doid sarcoma or myxoid chondrosarcoma. Liposarcomas were classified as well differentiated or myxoid either when they were homogeneously so or when other components such as round cell or pleomorphic subtype did not exceed 15% to 20% of the tissue. Leiomyosarcomas were char- acterized as Grade 1 when they exhibited an orderly fas- ciculated pattern, well differentiated cytologic features, absence of pleomorphism, absence of necrosis and ex- ceedingly low mitotic activity. Similarly hemangioperi- cytomas in the adult were classified as Grade 1 where they exhibited no necrosis, no hemorrhagic areas, and when mitotic figures were hard to find and averaged less than 1 per 10 high power fields. Malignant Schwannomas were classified as Grade 1 when they had the appearance of a neurofibroma but mitoses were present and the tumor was composed of areas of high cellularity. In the case of myxoid chondrosarcoma lesions uniformly myxoid, hy- pocellular, and with no detectable mitotic activity were classified as Grade 1. Myxoid chondrosarcomas with cel- lular areas or mitotic activity were classified as Grade 2 lesions. Lesions with the features of myxoid malignant fibrous histiocytoma were given a Grade 2, whereas other lesions such as synovial sarcoma were always attributed a Grade 3. In the case of tumors with a wide range of behavior, mitoses, pleomorphism, cellularity, matrix, and necrosis were used to distinguish between the different grades. The weight given to each feature was modified depending on the histologic type; whereas mitotic figures were of great importance in leiomyosarcoma, pleomor- phism was of secondary value in distinguishing MFH Grade 2 from MFH Grade 3. Grades amved at using
Histologic Type
For histologic typing the basic criteria used were those of the WHO classification' and those summarized by Rosai.' In most cases a histologic type was decided on

No. 3 GRADING OF SARCOMAS - Costa et a/. 533
FIGS. IA-IC. Examples of cellularity low (A, left), moderate (B, center), high (C, right) (H & E X 250).
this system are referred to in this article as “grade of malignancy.”
Individual Histologic Variables
In addition to the grade of malignancy a number of histologic features were evaluated as single variables in each case.
With respect to mitotic activity the tumors were clas- sified in two groups: “low mitotic activity” when there were fewer than 6 mitotic figures per 10 high power fields, or “high mitotic activity” when there were 6 or more mitotic figures per 10 high power fields. A high power field with the microscope used for all the examinations (Zeiss X12.5 ocular and X40 Planapo lens) measured 1256 p2. In terms of necrosis the cases were categorized into four groups: absent; minimal necrosis when the ne- crotic areas did not exceed 15% of the tumor; moderate necrosis when the necrotic tissue was 15 to 50% of the tumor; and massive necrosis when it was over 50% of the tumor. Necrosis thought to be related to previous surgery or necrosis related to ulceration was not taken into account. All other necrosis (inflammatory ischemic, individual cells, large geographic areas) was quantitated based on the gross and microscopic findings. For most of the analysis the cases were divided in two groups: those with absent and minimal necrosis versus those with mod- erate and massive necrosis.
Cellularity was estimated and categorized into high, intermediate and low as was the matrix. As a rule matrix and cellularity were inversely related (Figs. 1 A- 1 C).
The degree of pleomorphism was estimated by the
number of hyperchromatic tumor giant cells. Possible reactive forms such as entrapped striated muscle or giant cells around hemorrhagic foci were not interpreted as a sign of pleomorphism. Pleomorphism was categorized as absent, minimal, moderate or marked depending on the ease with which pleomorphic tumor cells could be found at intermediate power (Figs. 2A-2D).
End Points ef the Study and Statistical Methods
The clinical course of each patient was reviewed to determine time to recurrence of disease, either local or distant (disease-free survival) and total surival. Time to recurrence or death, was defined as the time from initial definitive surgery for primary disease to the time of first recurrence or death respectively. Kaplan-Meier curves were generated for all of the groups compared, and the differences found were tested by the stratified Mantel- Haenszel test8 All P values generated were one-sided un- less stated otherwise. The 12 strata that were used for all analyses are given in Table 3. This rather extensive strat- ification ensured that all factors known to have substantial prognostic importance were taken into account in eval- uating the histopathologic variable and their impact on the disease-free survival or total survival of the patient. For cellularity, pleomorphism and matrix P values are derived from a test for trend.
Results and Discussion
All analyses were stratified for disease and treatmept factors thought to impact on prognosis such as exact site

5 34 CANCER February 1 1984 VOl. 53
FIGS. 2A-2D. Examole of Dleomomhism: absent (A. toD left). minimal (B, top right). moderate (C. bottom left). marked (D, bottom right) (H & E, X250).
of the tumor, treatment with chemotherapy, and the type of surgery. Initial analysis determined that age and sex were of no prognostic significance. These factors were not considered in further analyses. The pattern of recur- rences in the 163 patients is given in Table 3.
Correlulion qf' Prognosis With Hist ologic Type
The distribution of histologic type as evaluated in the biopsy material is given in Table 1. All analyses were done using the histologic type determined at the first biopsy since in the great majority of cases the first biopsy produced an adequate sample for evaluation. To assess the impact of the histologic type as determined in the biopsy on the time to recurrence or survival we used the
T A R 1 F 3. Recurrences in 163 STS/NCI
Type of recurrence Extremity H N T Total
No recurrence 12 33 I05 Local only 2 9 I I Distant only 24 14 38 Local and distant 5 4 9
Total 103 60 I63
five histologic groups with the largest numbers of patients in each group, namely, leiom yosarcoma, MFH, neuro- fibrosarcoma, sarcoma unclassified, and synovial sarcoma and tested for heterogeneity in the outcome among the different groups. No significant differences were observed among the five histologic types compared (Fig. 3). Because of the small numbers of patients and of recurrences or deaths in each group only marked differences among the groups would have been evident in these analyses.
Correlation of' Prognosis With Gradc. qf Malignancy
The distribution of the grades as evaluated in the biopsy specimens is given in Table I . When grades given to the biopsy specimen were compared to the grades given in 54 cases that had further tissue evaluated, it was found that in only one instance the grade was changed from Grade I to a higher grade lesion. Six cases were upgraded from Grade 2 to Grade 3 and two cases were downgraded from Grade 3. Overall there were 14 patients in grade 1 for whom we had data on time to recurrence. Twelve of these patients were in the extremity group and did sig- nificantly better in terms of time to recurrence than pa- tients with Grades 2 or 3 lesions ( P = 0.01) (Fig. 4).

No. 3 GRADING OF SARCOMAS CosfU el d. 535
0 . 9
FIG. 3. Recurrences occurring in the different histologic types of STS (see also Table 6). 0
t
1:: I 0 . o
0
FIG. 4. Recurrence and survival in STS patients as correlated to grade of malignancy.
4-
HISTOLOGY[ RLL I T O T R L F R I L
19 7 [3 L E I O M Y O S R R C O N R
3 4 12 0 MFH
12 3 A N E U R O F I B R O S R R C
23 7 X SRRCOMA U N C L .
19 8 0 S Y N O V I R L S R R C .
23 8 X t I P O S H R C O M R [ 3 ~
J I I I I I 1 I I , I I 1 1 1 - 1 1 - 1 1 2 2 4 36 4 8 60 7 2 8 4 96 1 0 8 1 2
R E M I S S I O N IN M O N T H S
1 .o
0 . 9
o .a
0.7 z 0
v)
- 0.6
x W LL
z - 0.5 z 0 I t
GRRDE--l V S 2 V S 3 T O T R L F R I L
1 4 1 [3 GAFiDE 1
52 20 0 GRROE 2
8 3 3 2 A G R R D t 3
0 .1
0 . 0 1 - 1 I ! u I L L L - l . 0 12 2 4 36 4 8 60 72 8 4 9 6
REMISSION IN M O h T F S
o . 2 I
5 36 CANCER February 1 1984 VOl. 53
T ~ B L E 4. Subgroups Compared for Each Histologic Parameter Analyzed
Histologic type: Grade: I . 2. 3 Mitoses: Low. high Necrosis: Absent. minimal, moderate, marked Pleomorphism: Absent. minimal. moderate. marked Cellularity: Low. intermediate. high Matrix: Absent. sparse, intermediate. abundant
Different types and subgroups
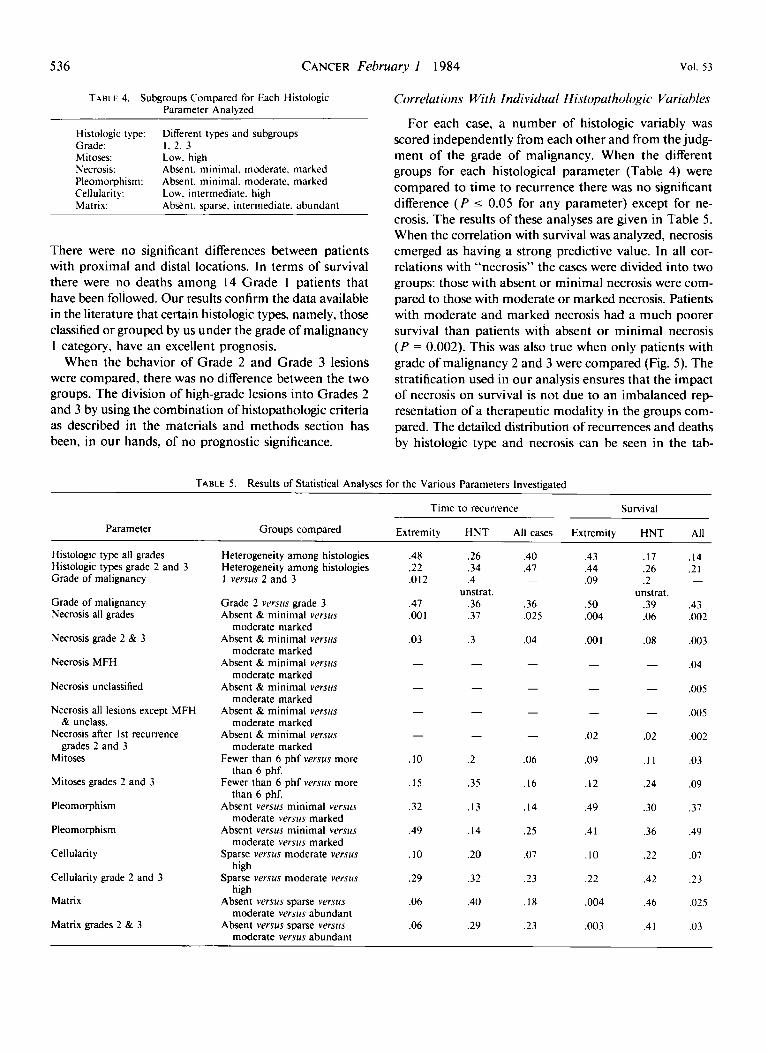
There were no significant differences between patients with proximal and distal locations. In terms of survival there were no deaths among 14 Grade 1 patients that have been followed. Our results confirm the data available in the literature that certain histologic types, namely, those classified or grouped by us under the grade of malignancy 1 category, have an excellent prognosis.
When the behavior of Grade 2 and Grade 3 lesions were compared, there was no difference between the two groups. The division of high-grade lesions into Grades 2 and 3 by using the combination of histopathologic criteria as described in the materials and methods section has been, in our hands, of no prognostic significance.
Correlations With Individuul Histopathologic Variables
For each case, a number of histologic variably was scored independently from each other and from the judg- ment of the grade of malignancy. When the different groups for each histological parameter (Table 4) were compared to time to recurrence there was no significant difference (P I 0.05 for any parameter) except for ne- crosis. The results of these analyses are given in Table 5. When the correlation with survival was analyzed, necrosis emerged as having a strong predictive value. In all cor- relations with “necrosis” the cases were divided into two groups: those with absent or minimal necrosis were com- pared to those with moderate or marked necrosis. Patients with moderate and marked necrosis had a much poorer survival than patients with absent or minimal necrosis (P = 0.002). This was also true when only patients with grade of malignancy 2 and 3 were compared (Fig. 5). The stratification used in our analysis ensures that the impact of necrosis on survival is not due to an imbalanced rep- resentation of a therapeutic modality in the groups com- pared. The detailed distribution of recurrences and deaths by histologic type and necrosis can be seen in the tab-
TABLE 5. Results of Statistical Analyses for the Various Parameters Investigated
Time to recurrence Survival
Parameter Groups compared Extremity HNT All cases Extremity HNT All
Histologic type all grades Histologic types grade 2 and 3 Grade of malignancy
Grade of malignancy Necrosis all grades
Necrosis grade 2 & 3
Necrosis MFH
Necrosis unclassified
Necrosis all lesions except MFH
Necrosis after 1st recurrence
Mitoses
Mitoses grades 2 and 3
Pleomorphism
Pleomorphism
Cellularity
Cellularity grade 2 and 3
Matrix
Matrix grades 2 & 3
& unclass.
grades 2 and 3
Heterogeneity among histologies Heterogeneity amodg histologies 1 versus 2 and 3
Grade 2 v e r m grade 3 Absent & minimal versus
moderate marked Absent & minimal versus
moderate marked Absent & minimal versus
moderate marked Absent & minimal versus
moderate marked Absent & minimal versus
moderate marked Absent & minimal versus
moderate marked Fewer than 6 phf versus more
than 6 phf. Fewer than 6 phf versus more
than 6 phf. Absent versus minimal versus
moderate versus marked Absent versus minimal versus
moderate versus marked Sparse versus moderate versus
high Sparse versus moderate versus
high Absent versus sparse versus
moderate versus abundant Absent versus sparse versus
moderate versus abundant
.48
.22
.OI2
.47
.oo I
.03
-
-
-
-
.I0
.I5
.32
.49
.I0
.29
.06
.06
.26
.34
.4 unstrat.
.36
.37
.3
-
-
-
-
.2
.35
. I3
.I4
.20
.32
.40
.29
.40
.47 -
.36
.025
.04
-
-
-
-
.06
.I6
. I4
.25
.07
.23
. I 8
.23
.43
.44
.09
S O ,004
.oo I -
-
-
.02
.09
.I2
.49
.4 I
.I0
.22
,004
,003
.I7
.26
.2 unstrat.
.39
.06
.08
-
-
-
.02
. I I
.24
.30
.36
.22
.42
.46
.4 I
.I4
.2 1 -
.43
.002
.003
.04
.005
,005
,002
.03
.09
.37
.49
.07
.23
,025
.03

No. 3
0 .2
0 .1
0 .o
GRADING OF SARCOMAS * cO.StU el a/
-
NECROSIS I G R F l O E S 2 & 3 1 T O T R L F R l L
104 20 cl R B S E N T / V I N l V R L
25 12 0 M O D E R R T E / V R R K E O
-
I 1 I l l , l , l , l l l l l l l
537
FIG. 5. Correlation of necrosis groups with time to recurrence and survival in STS with grade of malignancy 2 and 3. Patients with tumors exhib- iting moderate or marked necrosis have a signifi- cantly poorer prognosis. !
* (L
2 0 . 4 0 (L L
0.3
ulation of NCI Grades 2 and 3. Because the histologic type was not a stratifying factor, we thought it necessary to analyze the impact of necrosis in the different histo- logical subgroups where the number of patients and num- ber of recurrences in each group allowed for adequate sensitivity of the statistical methods employed. For high- grade (Grades 2 and 3) malignant fibrous histiocytoma and unclassified sarcomas necrosis has strong predictive value, survival being much better in the absent/minimal group. This is also true when all other groups except for high-grade MFH and unclassified are considered inde- pendently (Fig. 6). Thus, although our series cannot pro- vide a formal demonstration of the value of necrosis as a predictive factor for survival in each histologic group of tumors, clearly for sarcomas overall, for “high-grade” lesions only and for the two histologic groups amenable to be tested, necrosis is a strong predictor of overall sur- vival.
When groups with varying degrees of mitotic activity were analyzed for survival (few mitoses versus many mi- toses), it was found that the overall survival appeared better for the cases with low mitotic counts ( P = 0.04). The P value for comparing differences in time to recur- rence related to the mitotic counts was 0.07. The difference seen in total survival is of marginal significance but it was in the expected direction. Mitotic counts thus be a histopathologic criteria of interest, and perhaps further
quantification will enable us to show a stronger corre- lation. All of the other parameters examined showed no significant predictive value for time to recurrence or sur- vival.
From the analysis of each individual histopathologic variable, only one of them, i .e., necrosis, has a strong predictive value for overall survival. The rest of the vari- ables when used independently have no predictive value. This suggests that the lack of value of the distinction between Grade 2 and 3 was due to the fact that the single effective variable (necrosis) was obscured when combined with the other four histological variables with no prog- nostic impact.
The Value of Necrosis in Predicting Survival Afer the First Recurrence
Having established that necrosis in the primary tumor correlated strongly with the overall survival after the first therapeutic surgical intervention, we investigated if ne- crosis in the primary tumor was also of value in predicting survival after the first recurrence (either local or distant) had occurred. Thus we analyzed a group of 48 Grade 2 and 3 patients, who had recurred. The survival after re- currence of cases with absent and minimal necrosis was compared to the survival in cases with moderate and marked necrosis. Figure 7 shows that there was a signif-

538
1 .o
0 . 9
0 . 8
0 . 7
0 f > 0 . 6
a .. >
3 v)
0.5 0
+ I a p 0.4 0 w 0
0.3
0 .2
0.1
G . 0
CANCER February 1 1984
R B S E N T / N I N I f l R L
M O O E R R T E / N A R K E O
U U J 0 1 2 24 36 4 8 6 0 7 2 84 96 108 1 2 0
S U R V I Y R L I N n O N T H S
0 . 8
0 . 7
0 ! 0 . 5 o.61 L L
N E C R O S I S : W / C M F H . S R R C . U N C L R S S I F I E D T O T R L F A I L
84 16 [I] R B S E N T / f l l N l M R L
I I 5 0 n O D E R R T E / M R R K E O
0.1
0 .0 I L . 1 L I l
0 12 24 36 48 GO 7 2 84 9 6 108 S U R V I V R L I N U O N T H S
icant difference (P = 0.002) between the two groups in favor of absent and minimal necrosis. For this analysis we maintained the same stratification factors used in all previous correlations. Because the predictive value of ne- crosis is potentially important in determining clinical management of patients with recurrence, we investigated the possibility of necrosis being a surrogate parameter for
I20
1 .o
0.9
0 . 8
0.7
0 z I
> 0.G I
z E 1 Ln
0.5 0
+ LL
I
0 . 4 0 LL e
0.3
0.2
0.1
0 .o
VOl. 53
N € C R O S I S : M F H T O T R L F A I L
2 2 2 [I] R B S E N T / M l N l N R L
I I 4 0 f l 0 0 E R R l E / f 7 R R ~ E I
I I LL 1 , J L l 1 - L - L 1 I 1 II 1 2 24 36 48 60 72 84 91
S U R W I V R L IN n a N I n s
FIGS. 6A-6C. Correlation of necrosis groups with survival for specific histological subgroups of the population of patients con- sidered in Fig. 5. (A, top left) STS unclassified, (B. top right) MFH, (C, bottom left) all histological types except unclassified and MFH.
another as yet unevaluated factor such as age, sex, lo- cation, volume (size) of the tumor and ability of subse- quent therapy to render the patient free of disease. There were no significant differences in age or sex between the high and low necrosis groups and all histologic types had a distribution similar to that seen for the totality of patients studied. A scattergram of the tumor sizes demonstrates

No. 3 GRADING OF SARCOMAS * Costa et d. 5 39
1 .o
0 . 9
0.8
0.7
c.3 z 2 0 .6 - > Q 3 v)
FIG. 7. Correlation of necrosis groups with survival after the first recurrence has taken place. Patients with grade I lesions are excluded. Patients with moderate or marked necrosis in the primary tumor have a significantly poorer survival. 0
0.5 0
+ OI
- 0 . 4
a! a
0.3
0.2
0.0 O.I 6, 0 12
that both groups, absent and minimal necrosis and mod- erate and marked necrosis, overlap in terms of size (Fig. 8). In order to test if the differences in size could explain the differences in survival we repeated the analyses strat- ifying both for size and location (extremity versus head, neck, and trunk). Forty-three patients with known tumor size and “high-grade’’ lesions were divided into two strata: those with small tumors (a tumor measuring less than 100 cm’) and those with large tumors (a tumor over 100 cm3); 20 patients fell in the first group and 23 patients in the second group. For patients with small tumors ne- crosis was highly predictive of the overall survival with a P value of 0.002. The results of the analysis in the “small size group” clearly indicate that the value of ne- crosis is independent of size. Another parameter that we thought might explain the survival differences seen in these 48 patients was the ability of therapy for the re- currence to render patients free ofdisease. For 35 patients for whom the information was available we found that 1 1 of 24 (46%) patients were rendered free of disease in the group with low necrosis and 6 of I I (55%) patients were rendered disease free in the group with high necrosis. Thus, it is unlikely that the effectiveness of therapy after the first recurrence could explain the differences seen in overall survival and post-recurrence survival.
S U R V I VRL I G R R O E S 2 6 3 3 ~~
T O T R L F A I L 34 20 D R E S E N T / P l I N I M R L
1 4 12 0 M O O E R Q T E / M R R K E O L L l l l l l l l l l l l i l l l l l
2 4 36 48 60 7 2 8 4 96 ICE 120
S U R V I V R L I N MONTHS
Conclusions
Having collected a variety of data for each patient treated for a soft tissue sarcoma at our institution, we set out to ascertain if any of the commonly used histopath- ologic parameters that can be easily evaluated in routinely processed tissue are of value in determining the patient’s prognosis. All the histologic parameters evaluated were
joooor ABSENT/MINIMAL MODERATE/MARKED
FIG. 8. Distribution of sizes of primary tumors in the 43 patients that recurred is related to the necrosis subgroups. There are 31 patients in the group of absent or minimal necrosis and 12 patients in the group of moderate or marked. The respective median sizes are 81 cc and 234 cc.

CANCER February 1 1984 Vol. 53 540
I . o
0.9
0 .E
0.7 2 0
m
I: w =
- 2 0.6
5. 0.5
0 2
r LL 0 . 4 e 0 LL e
0.3
0.2
0 .1
c . c
I .r,
0 . 9 t
NCI GHRDE--l d S 7 .IS 3 T O T R L F A I L
1 4 I 0 N C I G A R O E I
1 0 4 14 (9 N C I G R R O E 2 :: : 4 C. N i i G P A G E 3
a 0.4 0 m a
0.3
0.1 O.: I
L,
Lli 1 .-
* * . . . _..
L.. * .
l i C I GRHOF 1 V S 2 V S 3 T O T A L F A i L
I 4 0 0 N C I CRRDE I 1 0 4 2 0 m N C I G u m 2 25 I: A NCI G'IRDf 3
0 Ii 7 4 16 4 8 5 C 7: H 4 36 il.8 l?C 0 I ? 2 4 36 4 8 60 72 R 4 96 :18 I:C
PEY!5c ,13 t , ;I< ' I O 1 r T w i S U P V I I R I :G MONTHS
FIGS. 9A AND 9B. Proposed grading of STS based on the findings of our study. The three NCI grades have a significantly different prognosis.
determined in a retrospective review of all material avail- able in each case without knowledge of the clinical out- come of the patient.
Our results confirm that certain histologic types or sub- types of soft tissue sarcoma respond well to therapy and that the rate of recurrence and death from tumor in these types is extremely low if the tumor is completely excised. Hence, this subgroup of histologic types is grouped under Grade 1. Our results also indicate that the remaining histological types of soft tissue sarcoma can be divided into two groups depending on the extent of necrosis of the tumor. Those with absent or minimal necrosis (up to 15% of the tumor) have a favorable prognosis, both in terms of time to recurrence and survival, whereas those with moderate and marked necrosis have a significantly poorer survival than the preceding group ( P < 0.002). From the recurrence and survival curves (Fig. 9) it appears that the great majority of patients with Grade 3 lesions recur in the first two years whereas a significant proportion of recurrences among the patients with Grade 2 lesions take place beyond the 2-year follow-up period. The amount of necrosis in the primary lesion is also predictive of the survival after the first recurrence has occurred. This appears to be independent of the location and the size of the primary lesion, of the age and sex of the patient, and of the ability to render the patient disease free by treatment of the recurrence.
Given the results seen in our material, we have partially replaced our initial grading strategy as formulated in Ap- pendix 2 by the following: Grade 1 lesions defined by
histologic type and certain histopathologic features, re- main the same as described in detail in the material and methods section. Grade 1 lesions will rarely recur if com- pletely excised and have negligible metastatic potential. Patients with Grade 1 lesions are at high risk for recurrence ifthese lesions are incompletely excised, and the potential of histological progression and metastases exists.
If the lesion is not in the Grade I group, necrosis governs the grade. Lesions with absent or minimal necrosis (up to 15%) are given a Grade 2 whereas lesions with moderate or marked necrosis are given a Grade 3. This grading, referred to as NCI grading, is, in our hands, indicative of the overall survival after therapy for the primary disease (Fig. 9) and also of the survival after the first recurrence takes place. Thus this simple grading scheme seems suit- able to be used as a factor in guiding therapy. The detailed recurrence and survival status of the patients studied by NCI grade are given in Table 6.
Many questions remain to be resolved and larger series of patients with prolonged follow-up (over 10 years) will be needed to refine histologic grading. Among the most crucial questions to be resolved is to determine if certain histologic types of lesion have a poor prognosis even in the absence of necrosis and if for these lesions the his- tologic type overrides the absence of necrosis.
In addition, we must keep in mind that new forms of therapy will require modification of the criteria that cor- relate with prognosis. In most instances the end points of clinicopathologic studies are responses to therapeutic intervention and as therapy is more effective and responses

No. 3 GRADING OF SARCOMAS - C O s f U el u[. 54 I
TABLE 6. NCI Grade. Histology, Recurrence, and Survival
Histology Survival:
recurrence Local Distant Distant dead/alive No Local and
NCI Grade I Leiom yosarcoma Liposarcoma myxoid Liposarcoma well differentiated Malignant fibrous histiocytoma, myxoid
Alveolar soft part Angiosarcoma Epithelioid sarcoma Fibrosarcorna Hemangiopericytoma Leiom yosarcoma Liposarcoma, pleomorphic Liposarcoma, round cell Malignant fibrous histiocytoma Malignant fibrous histiocytoma, myxoid Neu rofi brosarcoma Rhabdom yosarcoma Sarcoma, unclassified Synovial sarcoma
Fi brosarcoma Leiom yosarcoma Liposarcoma, pleomorphic Liposarcoma, round cell Malignant fibrous histiocytoma Malignant fibrous histiocytoma, inflammatory Neurofibrosarcoma Rhabdom yosarcoma Sarcoma, unclassified Synovial sarcoma
NCI Grade NE Fi brosarcorna Granular cell sarcoma Leiom yosarcoma Liposarcoma Liposarcoma, pleomorphic Liposarcoma, well differentiated Malignant fibrous histiocytoma Neurofibrosarcoma Sarcoma. unclassified Synovial sarcoma
NCI Grade 2
NCI Grade 3
Total
I 6 5 1
0 0 I 2 I 10 I I 3 I2 2
I 9
10
0 I I 0 6 I 0 I 1 0
0 I 0 I 0 1 0 I 6 1
105
n
0 0 I 0
0 0 0 I 0 0 2 0 I 1 0 1 0 0
0 0 0 0 0 I 0 0 0 0
0 0 0 0 1 0 0 2 0 II 0
0 0 0 0
1 2 0 0 I 2 1 3 5 0 I 0 4 3
1 1 0 I 2 0 1 0 2 2
I 0 2 0 0 0 1 0 0 I
38
0 0 0 0
0 0 0 0 0 2 I 0 0 0 0 0 0 2
0 0 0 0 1 0 0 0 I 0
I 0 0 0 0 0 0 0 0 0
9
Recurrence Status
Total __
1 6 6 I
I 2 1 3 2 14 15 6
3 9 2 13 15
1 2 I I 9 2 I I 4 2
2 I 2 I I I I 3 6 2
I63
i n
improve, treatment results for lesions with a given “grade of malignancy” and, hence, the criteria to judge it, will be changed.
REFERENCES
I . Enzinger FM, Lattes R, Torloni R. Histological typing of soft tissue tumors: International classification of tumors No. 3. Geneva: WHO, 1969.
2. Russell WO, Cohen J, Enzinger FM et ul. A clinical and pathological staging system for soft tissue sarcomas. Cunciv 1977; 40: 1562.
3. Suit D, Russell WO, Martin RG. Management of patients with sarcoma of soft tissue in an extremity. Cuncer 1973; 3 I : 1247. 4. Rosenberg SA, Kent H, Costa JC d al. Prospective randomized
evaluation of the role of limb-sparing surgery, radiation therapy, and
adjuvant chemoimmunotherapy in the treatment of adult soft tissue sarcoma. Surgery 1978; 84:62.
5. Rosenberg SA, Tepper J , Glatstein E d ul. The treatment of soft tissue sarcomas of the extremities: Prospective randomized evaluations of ( I ) limb-sparing surgery plus radiation therapy compared with am- putation and (2) the role of adjuvant chemotherapy. Ann Surg 1982; 196:305.
6 . Rosenberg SA, Tepper J, Glatstein E rl a/. Prospective random- ization evaluation of adjuvant chemotherapy in adults with soft tissue sarcoma of extremities. (hnccv 1983; 52:424-434. 7. Rosai J. Ackerman’s Surgical Pathology. St. Louis: Mosby, 198 I ;
1407-1479. 8. Mantel N, Haenszel W. Statistical aspects of the analysis of data
from retrospective studies of disease. J Nut1 C’unccr Inst 1959; 22:719- 748.