the global operations of european firms · the global operations of european firms the second efige...
TRANSCRIPT

1
The Global Operations of European Firms
The second Efige Policy Report
Giorgio Barba Navaretti (University of Milan and Centro Studi Luca d‟Agliano), Matteo Bugamelli (Bank of Italy), Fabiano Schivardi (University of Cagliari, EIEF,
CEPR), Carlo Altomonte (Bocconi University and Bruegel), Daniel Horgos (Centro Studi
Luca d‟Agliano) and Daniela Maggioni (Centro Studi Luca d‟Agliano)
Summary This report uses newly collected, comparable cross country data from 15,000 firms in Austria, France, Germany, Hungary, Italy, Spain and the United Kingdom with detailed information on international activities. In line with a large literature, we find that size, productivity, the skill intensity of the workforce and the ability to innovate are positively related to firms' export performance in all countries. The same firm characteristics support more complex internationalization strategies, such as exporting to a larger number of markets, to more distant countries and producing abroad through FDI or international outsourcing. Moreover, these features influence the patterns of internationalization in a remarkably similar way across countries. Consequently, national differences in export performance are mostly related to differences in the industrial structure, in the distribution of firm characteristics, like size and productivity. We also find that firms pursuing comprehensive international strategies have coped with the crisis better. We conclude that structural policies that contribute to firm growth, productivity, accumulation of human capital and innovation are the best way to strengthen the international projection of European firms. Although more difficult to implement, their effects are going to be larger and more long lasting than those of policies directly targeting international activities.
November 7, 2010
The research leading to this report has received funding from the European Community's Seventh Framework Programme/ Socio-economic Sciences and Humanities (FP7/2007-2013) under grant agreement n° 225551 and by Unicredit Group. The survey was conducted by GFK Eurisko. The authors wish to thank Gianmarco Ottaviano, Thierry Mayer, André Sapir, Jean Pisani-Ferry, Alessandro Turrini, Alessandra Tucci, Andrea Brasili, Elena D‟Alfonso, and Giulia Felice for comments on a preliminary draft. The views expressed in this publication are the sole responsibility of the authors and do not necessarily reflect the views of the European Commission.

2
INTRODUCTION AND EXECUTIVE SUMMARY
The increased world integration of real and financial markets has made a country‟s overall
growth performance more reliant than in the past on its trade competitiveness and, more in general, on
its ability to operate on a global scale. This is particularly true for European countries that have gone
through a process of internal market integration including, for many of them, the introduction of a
single currency. On top of that, the recent crisis has shown that the heterogeneity in trade imbalances
(from the German surplus of 6.4 per cent of GDP to the Spanish deficit at 9.7) is among the key causes
of macroeconomic instability throughout the region. Therefore, understanding the roots of trade
performance and global involvement is an essential policy challenge.1
Why is there so much variation in trade performance across European Union countries?
Germany is by far the most export oriented, with a share of exports to gross domestic product (GDP)
of 39.9 percent, followed by Italy (23.4), France (21.3), UK (17.2) and Spain (16.7). Why are there
similar, if not larger, differences in terms of foreign direct investment and other forms of production
internationalization?2
Some of the variation results, of course, from country-specific features such as macroeconomic
policies, market size or infrastructure. Nonetheless, it is firms that are at the heart of competitiveness. Firms
carry out global operations, exporting to, importing from and producing in foreign countries. A crucial
issue for policymakers is thus to understand to what extent the global reach and the international performance of
European economies are determined by the characteristics of their firms, independently of other features of national
economies. This is especially important because key firms‟ characteristics and their within-country
distributions are every different across European nations.
This report is the first one to explore systematically the interaction between firm and country
characteristics, using the newly collected EU-EFIGE/Bruegel-UniCredit survey of 15,000 manufacturing
companies in seven EU countries (Austria, France, Germany, Hungary, Italy, Spain and the United
Kingdom). The survey provides consistent cross-country data on all the international activities of firms,
combined with many other firm characteristics. This wide span of information was not available in
earlier data sets.
1 For more detailed information on aggregate trade patterns see Appendix III. 2
In this report, we analyse the drivers of international performance and discuss potential policy options to improve it. We do not discuss the issue of the welfare effects of firms internalization strategies, a topic that goes well beyond the scope of our work.

3
This report finds that the international performance of European firms is largely independent of the country
where they are located. Companies which internationalise successfully their sales or their production have similar features in
all European countries. Size, productivity, the skill intensity of the workforce and the ability to innovate are positively
related to firms' export performance in all countries, in terms of both exporter status and export value as a
share of firm turnover. The same firm characteristics support more complex internationalization
strategies, such as exporting to a larger number of markets, or to more difficult and farther countries,
or producing abroad, either through foreign direct investment (FDI) or international outsourcing (IO),
i.e. production carried out by a third foreign firm under some sort of arm-length contract3.
Multi-country strategies of international production are essential in fostering exports,
particularly to fast growing emerging economies. In those economies entry is harder and more costly
than in the European export market. Whereas more than 90% of European exporters sell their products within the
EU, a much smaller fraction reaches distant emerging markets. Even more importantly, in all countries the smaller
are the firms, the more difficult is to overcome the rising fixed costs of global operations:
The emphasis on firms size consolidation and growth does not imply that firms should be very
large to be successful exporters. Size must be sufficient to undertake complex global operations,
including global production, that is undertaken also by many mediums size firms, as shown before.
The report also finds that firms with comprehensive global operations have been more resilient
in facing the crisis between 2008 and 2009. The articulate patterns of internationalisation of German
firms, for example, partly explain their ability to withstand the crisis better than Italian companies.
Aggregate data on trends in exports hide much churning at the firm level. In our sample half of the
firms reduced their exports and half of them either increased or stabilised foreign sales.
How can the finding that internationalization patterns are predominantly driven by firm
characteristics be reconciled with the evidence that, overall, countries perform very differently in terms
of their exports and global production strategies? The main reason is that the within country
distribution of these characteristics is very heterogeneous: industrial structures differ significantly across
European countries, in terms of size and sectoral distributions, as well as of innovative capacity and productivity.
Moreover, consistently with the results of Pagano and Schivardi (2003), this has little to do with the
sectoral distribution of industrial production. Even within narrowly defined industries, differences in
3 Notice that the result that size is an important driving factor, does not imply that SMEs cannot also have a good
export performance. I In our sample, many small firms display a high degree of international projection in terms of both
export and international production. However, on average their contribution to internationalization is substantially lower
than that of larger firms. Therefore an industrial structure in which medium to large size firms are well represented can
significantly raise to export and FDI.

4
size persist (see appendix III), with clear country patterns: for example, German firms tend to be larger
and Italian firms smaller than the EU average in all sectors
The fact that firm characteristics are central raises new challenges for policy. . Should policy
making work in the direction of fostering those firm specific drivers of internationalization? For
example, we find that, if the industrial structure (in terms of firm size and sectors) of countries like Italy and Spain
were to converge to the structure of Germany, the value of Italian and Spanish total exports would rise considerably – by
37% and 24% respectively. Needless to say, this suggestive counterfactual exercise must be interpreted
with a grain of salt, particularly when deriving policy implications.
The importance of firms‟ characteristics supports the view that policies focused on improving the
general business environment, on reforming institutional, regulatory, infrastructural or other factors that hinder long term
investments, innovation capabilities and firms’ growth are likely to be more effective in strengthening international
competitiveness than targeted interventions, like actions for export promotion. Yet, observed industrial structures are
the endogenous outcome of macro policies and several other country features, and not necessarily of
market imperfections. The „right sort of industrial features‟ for internationalisation cannot therefore be
enforced In our view there is little scope for policies forcing growth in firms’scale or changes in the sectoral composition
of industry. These policies are not necessarily likely to improve global competitiveness.
This report is, of course, not the first to stress the importance of firm characteristics.4 However,
this is the first time that country, industry and firm characteristics have been jointly analyzed using fully
comparable cross-country data. In addition, and again for the first time, it has been possible to study
within a unique framework the comprehensive span of global operations available to firms: export,
imports, FDI and international outsourcing.
4 The report contributes to a growing international trade literature on the importance of firm characteristics for international trade performance. Based on the findings that exporters are more productive and bigger (cf. Helpman et al., 2004; Eaton et al., 2004), Melitz (2003) presented the theoretical framework that became the cornerstone of the so called New New Trade Literature: while only the more productive firms export, less productive firms serve only the domestic market, whereas the least productive ones exit. Several theoretical and empirical contributions extended the Melitz model and supported the finding that firm productivity is one of the crucial characteristics affecting trade performance (see e.g. Bernad et al., 2007). Within this area of literature, Mayer and Ottaviano (2007) presented the first policy report comparing firm level characteristics with export performance across countries. Considering Germany, France, the UK, Italy, Hungary, Belgium and Norway, they show that it is the “Happy Few”, only a small amount of firms, that account for most aggregate international trade activity. However, due to a lack of data availability at the level of the firm, these studies are not able to base their analysis on comparative data for a bigger set of European economies and to explore several instances of the international performance of firms. While Mayer and Ottaviano (2007) do not use a homogeneous data set, most of the empirical studies even focus on one single economy and thus, are not able to examine the interaction between firm level and country or industry characteristics. The only exception is ISGEP (2008), that investigates the relationship between firm productivity and export performance for 14 economies and shows how country characteristics relate to export premium. ISGEP (2008) use a comparative dataset by collecting firm(plant) level information provided by National sources. Even if this dataset combines a large number of economies and covers the whole firm population (or at least firms exceeding a specific threshold of employees), it does not allow to investigate the different firm internationalization modes and a more comprehensive set of firm level characteristics.

5
The rest of this work is organized as follows. We first briefly introduce the survey and the basic
evidence comparing exporting and non exporting firms. Section 2 is devoted to explaining the decision
to export across countries: the share of firms exporting, and for those exporting how much of their
turnover gets sold abroad. Section 3 looks at where and to how many markets firms export. Then,
section 4 examines patterns of global production, either as foreign direct investments or as international
outsourcing. All these sections address the key question of whether country patterns are related to
country or firm characteristics. Consequently, section 5 examines how far a change in the industrial
structure in terms of size and sectoral composition might affect export performance. Finally, section 6
looks at whether internationalized firms have been better able to weather the international crisis, or
rather they have been more exposed to it. Section 8 concludes and sums up the key policy implications.

6
MAIN MESSAGES OF THE REPORT
Fact 1 In all countries, firms involved in international markets are, in general, larger, more productive, more skill intensive and more innovative.
Fact 2a The international performance of European firms is primarily explained by firm-specific characteristic. Country or sector features play a secondary role.
Fact 2b Exports are related to firm characteristics in a remarkably similar way across countries
Fact 3 Most firms export to a few nearby countries only. Their geographical reach primarily depends on firm characteristics, first of all size.
Fact 4a The majority of European firms use imported inputs. Between five and ten per cent among them in each sample country produces abroad using foreign affiliates or international outsourcing.
Fact 4b FDI and IO are generally exclusive modes of carrying out international production. FDI are more frequently used by larger firms to support sales in foreign markets. German firms are more likely to choose FDI, Italian and French ones IO.
Fact 4c Multi-country strategies of international production are instrumental in increasing foreign exports, especially in emerging economies.
Fact 5a Internationalisation patterns of countries differ mainly because nations differ in their internal industrial structures, i.e in the distributions of their firms’ characteristics, like size and productivity
Fact 5b If Italy and Spain had the industrial structure of Germany their exports would grow considerably, mostly because of firm size effects.
Fact 6 The effects of the crisis have been extremely heterogeneous across firms. Larger firms and those exporting out of the EU recorded less dramatic changes in export during the crisis.
7
1. THE SOURCE OF INFORMATION:
NEW AND UNIQUE DATA
This report is the first research output based on the the Efige dataset, collected within the
project “Efige - European Firms in a Global Economy: internal policies for external competitiveness”. This data set
is unique in that it provides for the first time comparable and consistent cross country information on
many characteristics of European firms, with a strong focus on internationalisation. The Efige data
have been complemented by balance sheet data drawn from the database Amadeus managed by Bureau
van Dyck. Since the sample design overweighs large firms, we constructed sampling weights in terms of
size-sector cells to make the sample representative of the underlying population. All the analysis of the
report is based on the weighted sample. In Appendix I we provide a detailed description of the dataset,
the questionnaire, the sampling scheme, the weighting procedures. The variables used throughout the
report and their acronyms are also described in the Appendix I.
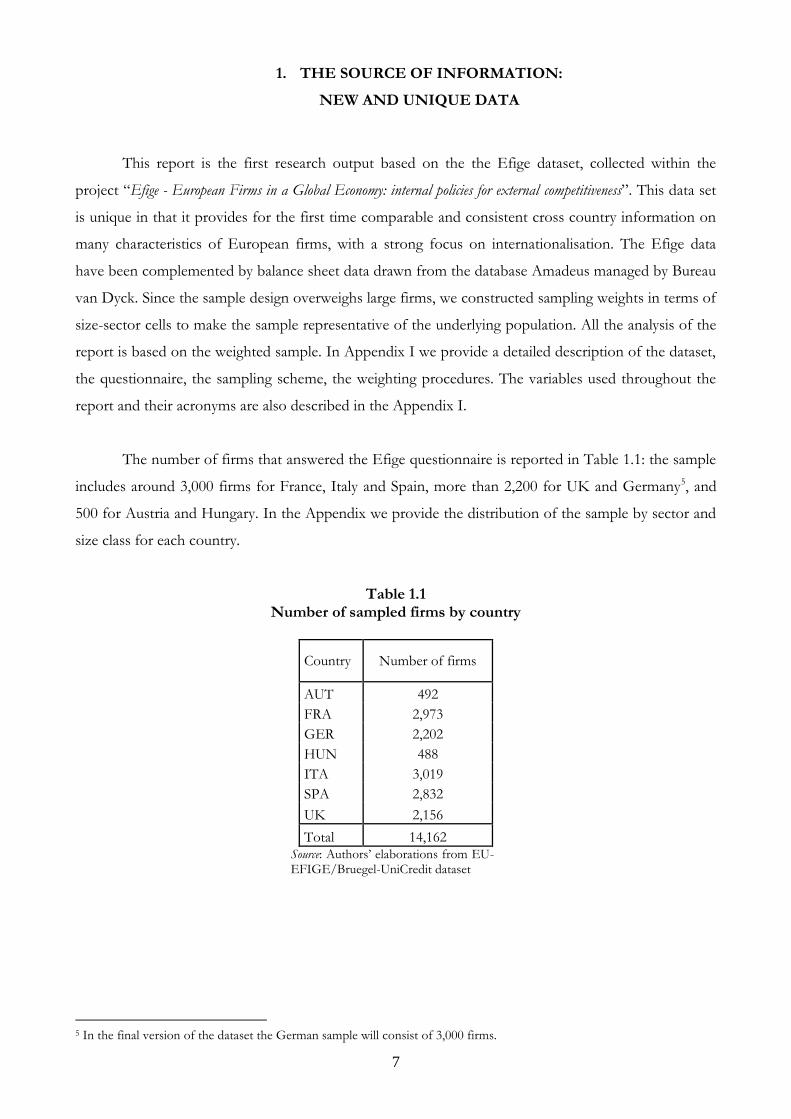
The number of firms that answered the Efige questionnaire is reported in Table 1.1: the sample
includes around 3,000 firms for France, Italy and Spain, more than 2,200 for UK and Germany5, and
500 for Austria and Hungary. In the Appendix we provide the distribution of the sample by sector and
size class for each country.
Table 1.1 Number of sampled firms by country
Country Number of firms
AUT 492
FRA 2,973
GER 2,202
HUN 488
ITA 3,019
SPA 2,832
UK 2,156
Total 14,162 Source: Authors‟ elaborations from EU-EFIGE/Bruegel-UniCredit dataset
5 In the final version of the dataset the German sample will consist of 3,000 firms.

8
Fact 1 – Firms involved in international markets are larger, more productive, more skill intensive and more innovative in all countries.
The questionnaire is mainly focused on 2008, with some questions on firms‟ activity in 2009
and in previous years. It contains a rich section on internationalization. Firms are asked several
questions on exports, imports, foreign direct investments (FDI) and international outsourcing (IO),
which includes international production carried out under arm-length contracts by third foreign
companies. Our data are consistent with a large and recent body of empirical work in international
trade with heterogeneous firms (see Bernard, Jensen, Redding, and Schott, 2007 and references
therein). In all 7 sampled countries, exporting firms are larger, more productive, have a lower share of
blue collar workers and a higher share of college graduates, are more likely to belong to a group or to a
foreign owner, are more innovative and invest more in R&D (Table 1.2).
Table 1.2
Descriptive statistics by export status DANIELA TO BE REPLACED
Variable AUT (1) FRA GER HUN (1) ITA SPA UK (1)
Exp. Non Exp.
Exp. Non Exp.
Exp. Non Exp.
Exp. Non Exp.
Exp. Non Exp.
Exp. Non Exp.
Exp. Non Exp.
Employment 92 82 108 38 94 47 90 35 48 29 60 32 143 49
Labour Productivity
157 214 125 99 180 111 63 49 159 138 116 82 - -
Blue-collar share
55.2 64.3 55.9 55.4 56.1 55.7 68.3 63.6 64.4 70.8 72.8 76.1 66.5 68.6
Graduate share
5.3 4.3 10.6 5.0 12.9 9.1 15.9 14.8 7.2 4.5 11.5 9.0 10.4 5.6
Age 44 51 43 33 46 44 19 15 31 26 29 24 38 33
Group 15.6 4.4 14.9 3.4 7.4 1.6 14.9 7.7 3.7 1.2 6.2 1.0 19.6 5.9
Foreign Ownership
15.9 4.3 14.8 4.1 8.7 2.3 24.0 11.3 5.2 1.4 6.6 1.1 16.2 5.3
Product innovation
61.4 50.7 54.0 35.6 59.1 34.9 47.6 34.8 55.4 28.3 52.1 31.9 66.6 37.9
RD share 3.6 2.0 3.9 1.8 5.5 2.1 1.8 0.5 4.5 2.4 3.8 2.3 4.3 1.7
Bank debt share
87.4 85.7 78.4 79.1 82.9 86.0 81.5 86.1 88.4 85.2 86.9 85.7 65.7 64.3
Venture Capital
5.2 0.0 4.6 6.0 5.2 4.5 0.0 0.0 0.4 0.5 3.0 3.1 2.5 2.2
(1) Turnover data are not fully reliable for UK and available only for few Austrian and Hungarian firms. Bank debt share and Venture Capital, computed only for firms with external financing. Source: Authors‟ elaborations from EU-EFIGE/Bruegel-UniCredit dataset
When we plot distributions (Kernel densities) of labor productivity for non exporters, exporters
with no foreign direct investment, and firms with some production abroad we find for all the main 4

9
continental European countries, the productivity distribution of exporter is rightward-shifted with
respect to that of non exporters, and that of FDI makers is to the right of that of exporters (Figure 1.1).
That only more productive firms invest in more complex internationalization strategies is already
known from the literature (see e.g. Antras and Helpman, 2004 and Helpman et al., 2004).
Figure 1.1 Kernel density of productivity for non exporters, exporters and FDI makers
DANIELA TO BE REPLACED
Source: Authors‟ elaborations from EU-EFIGE/Bruegel-UniCredit dataset
This descriptive evidence confirms the well known fact that exporting firms are “better” than
non exporting ones. However, there are noticeable differences across countries in firms characteristics,
even within the exporting group. For example, Spanish and especially Italian exporter are substantially
smaller than those located in the other countries. This descriptive evidence, therefore, suggests that
both firm characteristics and country specificities play a role in determining the internationalization
modes of European firms. The main goal of the rest of this report is to try to disentangle these two
factors.
10
2. EXPORTING ACTIVITY
Fact 2a – The international performance of European firms is primarily explained by firm-specific characteristic. Country or sector features play a secondary role.
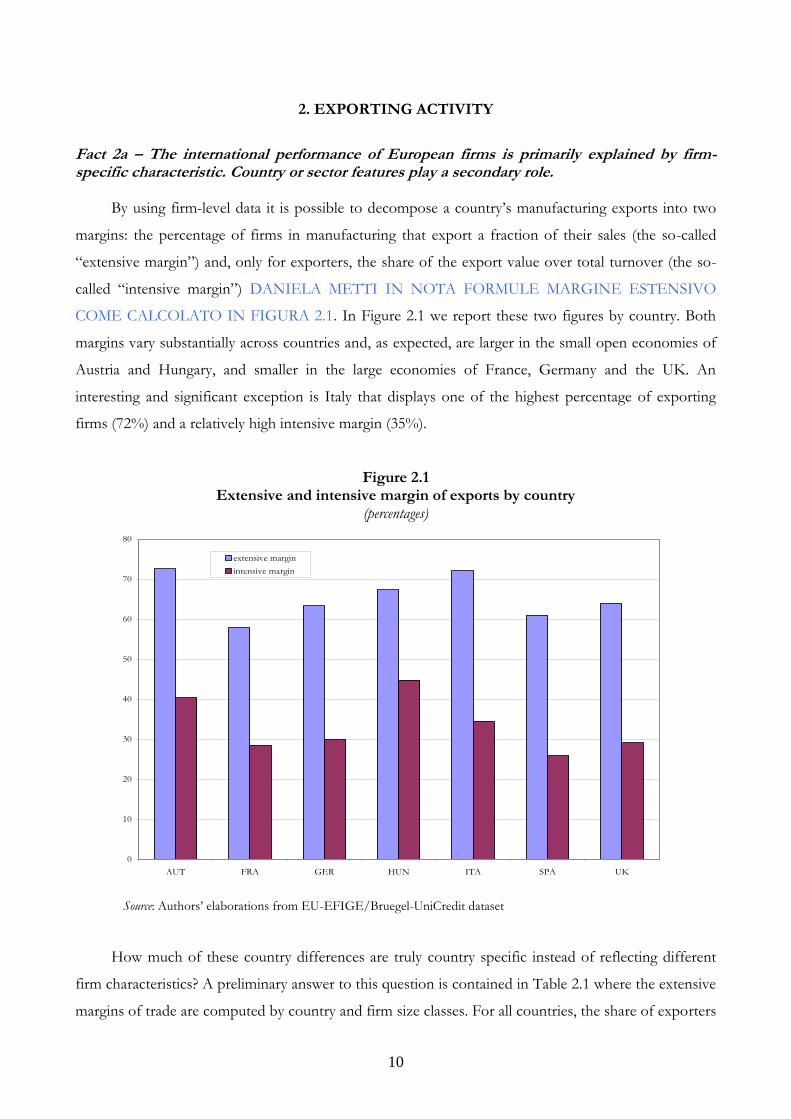
By using firm-level data it is possible to decompose a country‟s manufacturing exports into two
margins: the percentage of firms in manufacturing that export a fraction of their sales (the so-called
“extensive margin”) and, only for exporters, the share of the export value over total turnover (the so-
called “intensive margin”) DANIELA METTI IN NOTA FORMULE MARGINE ESTENSIVO
COME CALCOLATO IN FIGURA 2.1. In Figure 2.1 we report these two figures by country. Both
margins vary substantially across countries and, as expected, are larger in the small open economies of
Austria and Hungary, and smaller in the large economies of France, Germany and the UK. An
interesting and significant exception is Italy that displays one of the highest percentage of exporting
firms (72%) and a relatively high intensive margin (35%).
Figure 2.1 Extensive and intensive margin of exports by country
(percentages)
0
10
20
30
40
50
60
70
80
AUT FRA GER HUN ITA SPA UK
extensive margin
intensive margin
Source: Authors‟ elaborations from EU-EFIGE/Bruegel-UniCredit dataset
How much of these country differences are truly country specific instead of reflecting different
firm characteristics? A preliminary answer to this question is contained in Table 2.1 where the extensive
margins of trade are computed by country and firm size classes. For all countries, the share of exporters

11
increases significantly with firm size: the difference in export propensity between the group of firms
with 10-19 employees and the group of firms with at least 250 employees is always above 25 percentage
points and almost 40 percentage points for Germany. Differences across countries within the same
class size are smaller.
Table 2.1
Extensive margin of exports, by country and firm size class (percentages)
Size Class AUT FRA GER HUN ITA SPA UK
10-19 69.8 44.7 45.7 58.0 65.4 51.2 54.9
20-49 63.8 59.1 65.4 64.7 73.3 63.5 62.8
50-249 88.6 75.4 78.2 79.3 86.6 76.2 76.8
more than 249 90.8 87.6 84.0 97.4 92.6 88.0 80.7
Total 72.6 57.9 63.4 67.3 72.2 61.1 64.0
Source: Authors‟ elaborations from EU-EFIGE/Bruegel-UniCredit dataset
A similar result holds for the intensive margin (Table 2.2). In this case, the differences across size
classes are less pronounced. This is an expected result. Models with fixed costs of entering the export
markets predict that firm characteristics impact the probability of exporting, but, conditional on being
an exporter, not the share of export over total sales (Melitz, 2003).
Table 2.2 The intensive margin of exports, by country and firm size class
(percentages)
Size Class AUT FRA GER HUN ITA SPA UK
10-19 26.2 23.0 25.9 30.2 30.4 21.4 26.2
20-49 33.3 27.0 28.1 43.6 34.2 24.5 27.8
50-249 55.9 33.0 33.9 53.2 42.2 33.3 33.2
more than 249 64.7 41.2 37.8 66.6 52.6 40.6 34.2
Total 40.4 28.5 30.0 44.8 34.6 25.9 29.1
Source: Authors‟ elaborations from EU-EFIGE/Bruegel-UniCredit dataset
It is therefore remarkable that also the intensive margin is strictly related to firm size. One
possible explanation is that the fixed cost has to be paid for each destination, and that large firms
export to more destinations, something that we will show below to be the case. Another difference
with the extensive margin results is that the share of export differs substantially across countries
especially in the larger size classes, while in Table 2.1 the cross country differences were more marked
for small firms.

12
Size is not the only relevant firm characteristics for internationalization. As pointed out in many
recent papers analyzing the determinants of exporting activity on the basis of firm level data, exporting
firms are usually larger, more productive and innovative than average. In other words, several firm
characteristics, often but not always correlated to size, are also expected to affect patterns of
internationalisation. Equally country and industry features are related to internationalisation patterns.
We therefore now follow a more general and systematic approach, encompassing the interplay of
several contributing factors. We perform a regression analysis of the extensive (if firms do export or
not) and intensive margins (how much firms export) of trade on country, sector and firm
characteristics. In this way, we can assess the relative importance of the different factors and the
magnitude of their impact on exports.
As a first step we analyse the decision of exporting, the extensive margin of export. Results are
reported in Table 2.3. Specifically we estimate a linear probability model where the dependent variable
is a dummy which is equal to 1 if a firm export and 0 otherwise6. The first set of estimates has only
country dummies as regressors (column 1). With respect to Germany (the benchmark country), the
propensity to export is higher in Austria and Italy by about 9 percentage points, and smaller in France
and Spain by, respectively, 5.4 and 2.3 percentage points. Hungary and UK are in line with Germany.
Overall, the country dummies explain a very low fraction of the total variance: the R2 is equal to 1.1 per
cent. In column 2 we add sector dummies (2 digits of the Nace 2 rev.1 classification): the explanatory
power of the regression increases significantly, to 5.4 per cent. Focusing on the country dummies, we
see that an unfavourable sectoral specialization absorbs the negative coefficient of Spain, and makes the
one of Hungary significantly positive. Sectoral dummies (not reported) point to significant cross
sectoral differences. The share of firms engaged in export activity is lowest for the food sector,
followed by traditional, low-tech sectors. Chemical and mechanical firms are the most engaged in
export activity.
Things interestingly change when we add firm size (column 3). First of all, the probability that a
firm exports grows significantly with its size: doubling the number of employees increases the
probability by 10 per cent. The most relevant change in the coefficients of the country dummies occurs
for Italy: after controlling for an unfavourable size structure of Italian firms, the country factor
becomes even larger than before (0.10 versus 0.8). More importantly, the inclusion of a single firm
control raises significantly the fraction of variance explained by the regression: now the R2 is equal to 9
per cent.
6 Similar results are obtained with probit regressions. We run OLS regressions because they facilitate the computation of the contribution of each variable to explaining the variability of the dependent variable.
13
It is a well known fact that exporters are on average more productive than non exporters. In
column 4 we therefore add labor productivity (we are forced to exclude UK firms for which we have
no reliable data on value added). Both firm size and labor productivity are positively and significantly
correlated with export propensity. Controlling for the lower than average efficiency of Hungarian firms
raises significantly the correspondent country dummy. Again, as pointed out before, the introduction of
a second firm level characteristics further increases the R2 of the regression. In the last two columns we
include additional firm level controls (in column 5 we exclude Spain, that lacks data on the share of
blue-collar workers, and UK, that lacks productivity). Overall, we can confirm evidence that exporters
are on average larger, more productive, more innovative and employ more skilled workers. Firms
belonging to a foreign group are also more likely to be exporters.
Given an R2 around 15 per cent, we can approximately estimate that 64% of the total variance
explained by the model comes from firm level controls, against 29% from the sectoral composition and
only less than 7% by the country dummies.7 Some of the latter remain statistically significant, despite
the inclusion of a wide set of controls; in particular, with respect to Germany, export propensity is
smaller in France, higher in Spain, Hungary, Austria and Italy.
If we repeat the same econometric exercise on the export share (intensive margin) restricting the
sample to the exporters, we find similar results (Table 2.4). The export share is higher for larger, more
productive and innovative firms, for those that are endowed with a highly skilled workforce. Morevoer,
being part of a group, and in particular of a foreign group is also positively correlated with the export
share. Again, the contribution of the firm characteristics to the explanatory power of the model is the
largest (almost 51%, against 34% for sectors and about 15% for the country dummies). The higher
export propensity of Austrian, Hungarian and Italian firms is also confirmed.
To sum up, firm characteristics – size, productivity, innovative activity, skill content of the
workforce – are the primary determinants of export performance and dominate country effects.
Moreover, firm characteristics affect the probability of engaging in exporting and the share of turnover
exported in the same direction: larger, more productive, more innovative firms are both more likely to
export and tend to export a larger share of their production.
7 Because of the correlation existing between country dummies, sector dummies and firm characteristics, the sum of the R2 obtained when we include only one set of variables does not correspond exactly to the R2 of the regression including all variables together. Thus, we present only some approximated shares.

14
Table 2.3 Exporting or not (the extensive margin)
A linear probability model of the decision to export DANIELA SOSTITUISCI LE TAVOLE CON LE NUOVE SENZA STANDARD ERRORS
(1) (2) (3) (4) (5) (6) THE DEPENDENT VARIABLE IS:….
Country dummies
Add sector dummies
Add firm size
Add productivity No UK
All controls No UK & SP All controls
Log(Employment) 0.105*** 0.096*** 0.075*** 0.078***
[0.004] [0.006] [0.006] [0.005]
Log(Age) 0.046*** 0.055***
[0.007] [0.005]
Log(LP) 0.090*** 0.083***
[0.006] [0.007]
Group -0.023 0.013
[0.034] [0.025]
Foreign Own 0.108*** 0.118***
[0.030] [0.023]
Blue-Collar share 0.000
[0.000]
Graduate share 0.002*** 0.003***
[0.000] [0.000]
Product Innov 0.144*** 0.151***
[0.011] [0.008]
RD share 0.005*** 0.005***
[0.001] [0.001]
Bank Debt share 0.000*** 0.000***
[0.000] [0.000]
AUT 0.092*** 0.101*** 0.104*** 0.113*** 0.113*** 0.101***
[0.027] [0.026] [0.026] [0.031] [0.030] [0.025]
FRA -0.054*** -0.048*** -0.038*** -0.058*** -0.046*** -0.026**
[0.013] [0.013] [0.013] [0.016] [0.015] [0.013]
HUN 0.040 0.046* 0.045* 0.138*** 0.142*** 0.071***
[0.025] [0.024] [0.024] [0.029] [0.030] [0.025]
ITA 0.088*** 0.078*** 0.104*** 0.074*** 0.077*** 0.119***
[0.011] [0.011] [0.010] [0.013] [0.013] [0.011]
SPA -0.023* -0.021 0.004 -0.002 0.028**
[0.013] [0.013] [0.013] [0.015] [0.013]
UK 0.006 -0.010 -0.004 -0.005
[0.014] [0.014] [0.013] [0.014]
Constant 0.634*** 0.473*** 0.107*** -0.245*** -0.466*** -0.121***
[0.008] [0.012] [0.019] [0.038] [0.047] [0.025]
No. obs. 14162 14162 14162 8313 7111 13345
R-squared 0.011 0.054 0.092 0.110 0.168 0.150 Robust standard errors in brackets . Due to missing observations concerning productivity for UK and blue-collar share for both UK and SPA, SPA has not been included in the regression 5, UK in the column 4 and 5. ***, **, * significant at 1%, 5%, 10%
Columns 2-6 include sector dummies

15
Table 2.4 How much to export (the intensive margin) Estimates of export shares, only exporters
(1) (2) (3) (4) (5) (6) THE DEPENDENT VARIABLE IS:….
Country dummies
Add sector dummies
Add firm size
Add productivity No UK
All controls No UK & SP All controls
Log(Employment) 0.049*** 0.053*** 0.043*** 0.042***
[0.003] [0.004] [0.005] [0.003]
Log(Age) -0.003 0.001
[0.006] [0.004]
Log(LP) 0.030*** 0.030***
[0.008] [0.009]
Group 0.009 0.034*
[0.028] [0.020]
Foreign Own 0.129*** 0.097***
[0.028] [0.019]
Blue-Collar share 0.000**
[0.000]
Graduate share 0.001*** 0.001***
[0.000] [0.000]
Product Innov 0.042*** 0.038***
[0.010] [0.007]
RD share 0.004*** 0.003***
[0.001] [0.000]
Bank Debt share -0.000*** -0.000***
[0.000] [0.000]
AUT 0.104*** 0.112*** 0.113*** 0.101*** 0.091*** 0.116***
[0.023] [0.022] [0.021] [0.033] [0.032] [0.020]
FRA -0.015 -0.010 -0.008 -0.006 -0.002 -0.003
[0.011] [0.011] [0.011] [0.013] [0.012] [0.011]
HUN 0.148*** 0.165*** 0.163*** 0.191*** 0.178*** 0.162***
[0.025] [0.024] [0.024] [0.031] [0.033] [0.025]
ITA 0.045*** 0.048*** 0.066*** 0.059*** 0.080*** 0.093***
[0.010] [0.010] [0.010] [0.011] [0.011] [0.010]
SPA -0.041*** -0.032*** -0.018* -0.022 0.003
[0.011] [0.011] [0.011] [0.015] [0.011]
UK -0.009 -0.010 -0.003 -0.007
[0.012] [0.011] [0.011] [0.012]
Constant 0.300*** 0.202*** 0.017 -0.150*** -0.193*** -0.010
[0.008] [0.013] [0.019] [0.050] [0.059] [0.024]
16
No. Obs. 7625 7625 7625 4532 3930 7195
R-squared 0.021 0.069 0.096 0.115 0.158 0.141 Robust standard errors in brackets. Due to missing observations concerning productivity for UK and blue-collar share for both UK and SPA, SPA has not been included in the regression 5, UK in the column 4 and 5. ***, **, * significant at 1%, 5%, 10%
Columns 2-6 include sector dummies.
Fact 2b – Exports are related to firm characteristics in a remarkably similar way across countries
MATTEO AND FABIANO TO REVISE THE FOLLOWING ON THE BASIS OF JEAN‟S
COMMENTS; SHOULD WE INCLUDE THE GRAPH DECOMPOSING THE VARIANCE AS
OF OUR SLIDE SHOW??
After showing that firm characteristics – size, productivity, innovative activity, skill content of the
workforce – are the primary determinants of export performance and dominate country effects, we
now ask whether their impact is similar or different across countries.
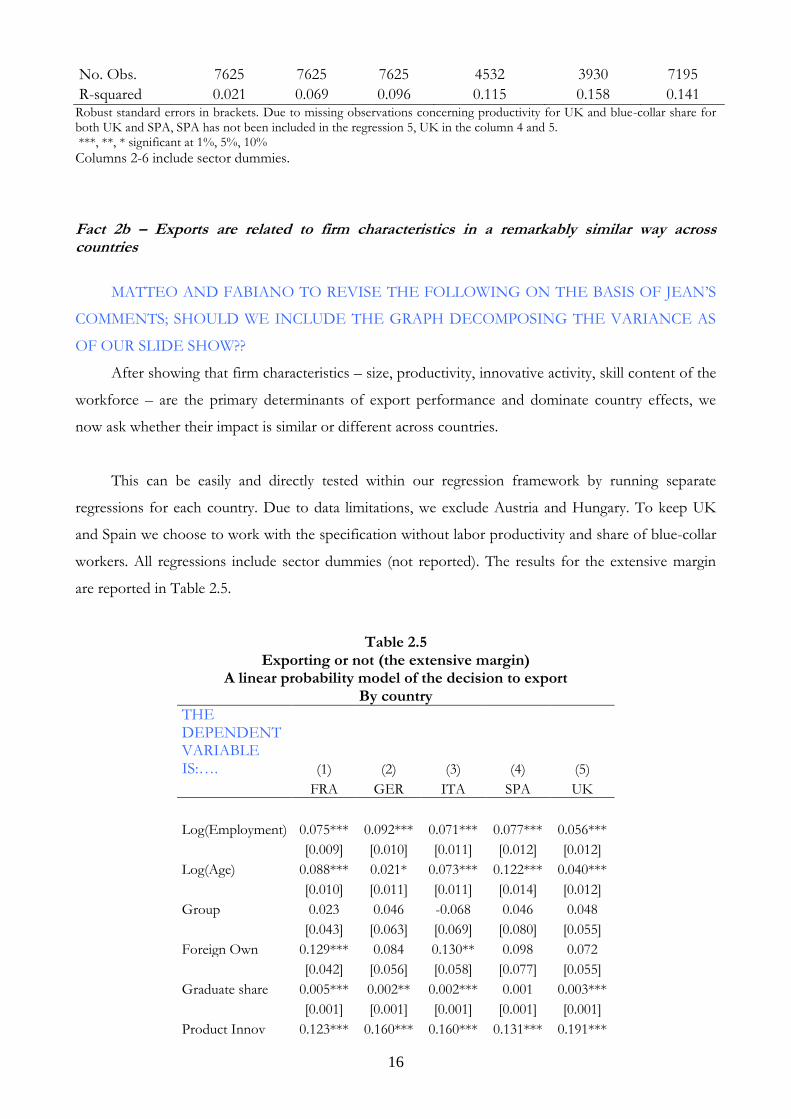
This can be easily and directly tested within our regression framework by running separate
regressions for each country. Due to data limitations, we exclude Austria and Hungary. To keep UK
and Spain we choose to work with the specification without labor productivity and share of blue-collar
workers. All regressions include sector dummies (not reported). The results for the extensive margin
are reported in Table 2.5.
Table 2.5 Exporting or not (the extensive margin)
A linear probability model of the decision to export By country
THE DEPENDENT VARIABLE IS:…. (1) (2) (3) (4) (5)
FRA GER ITA SPA UK
Log(Employment) 0.075*** 0.092*** 0.071*** 0.077*** 0.056***
[0.009] [0.010] [0.011] [0.012] [0.012]
Log(Age) 0.088*** 0.021* 0.073*** 0.122*** 0.040***
[0.010] [0.011] [0.011] [0.014] [0.012]
Group 0.023 0.046 -0.068 0.046 0.048
[0.043] [0.063] [0.069] [0.080] [0.055]
Foreign Own 0.129*** 0.084 0.130** 0.098 0.072
[0.042] [0.056] [0.058] [0.077] [0.055]
Graduate share 0.005*** 0.002** 0.002*** 0.001 0.003***
[0.001] [0.001] [0.001] [0.001] [0.001]
Product Innov 0.123*** 0.160*** 0.160*** 0.131*** 0.191***

17
[0.017] [0.020] [0.017] [0.019] [0.023]
RD share 0.003** 0.006*** 0.003*** 0.005*** 0.004**
[0.001] [0.001] [0.001] [0.001] [0.001]
Bank Debt share 0.000** 0.000 0.000** 0.000 0.000
[0.000] [0.000] [0.000] [0.000] [0.000]
Constant -0.296*** -0.113** 0.039 -0.158** -0.022
[0.046] [0.053] [0.056] [0.062] [0.065]
No. obs. 2926 2144 3002 2521 1827
R-squared 0.197 0.182 0.124 0.137 0.177 Robust standard errors in brackets ***, **, * significant at 1%, 5%, 10%
Regressions include sector summies.
The estimated coefficient of firm size is visibly similar across countries; the same is true for
innovation (both the product innovation dummy and the R&D variable) and for graduate employment.
A more systematic test run by pooling the data of all countries and adding interaction terms confirms in
most cases the conjecture of statistical equality of the coefficients across countries. As to size, only the
coefficient of UK turns out to be significantly smaller than the others.
Table 2.6 reports the country regressions on the intensive margin of exports. Some more
marked differences across countries emerge. In particular, the estimated impact of firm size is larger in
Italy and Spain as compared to Germany, France and UK. This is to say that the differential export
share between large and small firms is relatively higher in Italy and Spain than in the other countries.
Table 2.6 How much to export (the intensive margin) Estimates of export shares, only exporters
By country
(1) (2) (3) (4) (5) THE DEPENDENT VARIABLE IS:…. FRA GER ITA SPA UK
Log(Employment) 0.029*** 0.030*** 0.053*** 0.056*** 0.027***
[0.007] [0.007] [0.008] [0.009] [0.009]
Log(Age) 0.004 0.005 0.005 -0.006 -0.000
[0.009] [0.008] [0.009] [0.012] [0.010]
Group 0.057 -0.017 0.045 -0.027 0.135***
[0.038] [0.044] [0.049] [0.057] [0.049]
Foreign Own 0.122*** 0.130*** 0.067* 0.136** -0.032
[0.040] [0.044] [0.038] [0.058] [0.047]
Graduate share 0.002*** 0.001 0.001* 0.001* 0.004***
[0.001] [0.001] [0.001] [0.001] [0.001]
Product Innov 0.009 0.051*** 0.053*** 0.009 0.040**

18
[0.016] [0.015] [0.013] [0.016] [0.018]
RD share 0.002** 0.003*** 0.002*** 0.003*** 0.003***
[0.001] [0.001] [0.001] [0.001] [0.001]
Bank Debt share -0.000 -0.000*** -0.000 -0.000 -0.000*
[0.000] [0.000] [0.000] [0.000] [0.000]
Constant 0.065 0.016 -0.005 0.035 -0.012
[0.048] [0.048] [0.043] [0.050] [0.052]
No. Obs. 1412 1013 1958 1271 1050
R-squared 0.146 0.165 0.123 0.106 0.168 Robust standard errors in brackets ***, **, * significant at 1%, 5%, 10% Regressions include sector summies.

19
3. GLOBAL MARKETS
Fact 3 – Most firms export to a few nearby countries only. Their geographical reach primarily depends on firm characteristics, first of all size.
Export propensities and shares provide just part of the overall picture on the
internationalization of firms. The global operations undertaken by European firms are very
heterogeneous and entail very complex and different internationalisation patterns. We begin by looking
at other dimensions of the exporting activity. In Table 3.1 we show the distribution of exporting firms
across geographical markets of destination.
Table 3.1
Where do exporters go The distribution of exporting firms across markets of destination
(percentage of exporters exporting to)
country EU15 Other EU Other
Europe China India
Other Asia
US Canada
Central South
America Others
AUT 94.2 49.9 46.8 16.4 17.7 22.5 7.08 12.4
FRA 92.5 36.8 41.8 22.0 27.0 31.6 14.7 30.6
GER 93.1 47.9 52.7 27.9 25.9 36.8 16.4 16.6
HUN 82.0 50.1 24.1 1.6 5.2 6.9 0.7 4.3
ITA 89.6 41.0 49.7 17.7 23.6 30.5 19.3 24.2
SPA 92.6 27.6 26.6 10.8 14.3 18.4 29.6 24.0
UK 92.3 33.7 33.7 25.9 31.6 44.5 15.0 35.1 Source: Authors‟ elaborations from EU-EFIGE/Bruegel-UniCredit dataset
Almost all exporting firms sell a fraction of their production in the EU15 market, which is the
closest proxy to a domestic market, but much fewer go to farther destinations like the US and the fast
growing markets of China, India or Latin America. This pattern is invariant in all sample countries.
These extra European destinations are more costly to reach and often involve higher risks and other
barriers than EU markets. Moreover, when we move to more distant destinations, more marked
country differences seem to emerge. For example, in India and China, two markets where most of
exporters still have to make their entry move, German firms have gained a competitive edge: the share
of German firms exporting there is 5 percentage points higher than that of France, 10 points than in
Italy and almost 20 points than in Spain. Expectedly, Spanish firms are more likely to export to Central
and South America.
So the question becomes again: is it due to firm characteristics or to some country effect that
benefits all German exporters? To answer it, we rely on the regression analysis where the dependent

20
variable is a dummy of export activity in China and India. The analysis concerns only exporting firms.8
The empirical specification is identical to the one used in the previous section. The results are shown in
Table 3.2.
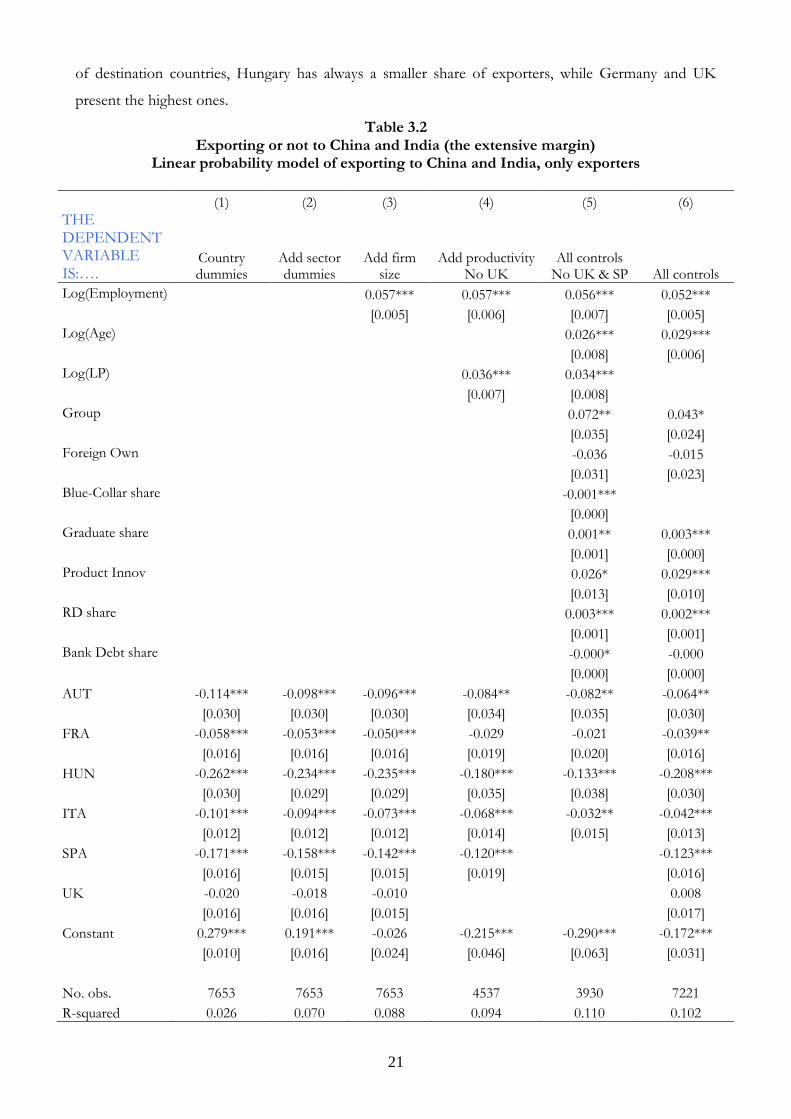
First of all, as it can be inferred from the R2 of the different regressions, again firm
characteristics explain overall more than country features. Quantitatively, their explanatory power
amounts to almost 32% of the total variance explained against a lower 25% for the country dummies.
Interestingly, the sectoral patterns, that now contributes for 43%, seems to be more important than for
total exports. As to the firm characteristics, the usual suspects matter: the probability of exporting to
China and India is positively correlated with firm size, productivity, innovation and human capital.
Older firms and those belonging to a group are also more capable of reaching the farthest, largest and
dynamic markets in Asia.
The country dummies, that now matter slightly more than for exporting activity tout court, tell
also a story which is interestingly different from what we have seen in the previous section. The
stronger (than Germany) export propensity of Austria, Hungarian and Italian firms is not anymore true
when focusing on export to China and India, where instead the German predominance emerges quite
clearly with respect to all the other sampled countries excluding UK. The gap in terms of share of
exporting firms able to sell their products in China and India is relevant even for large economies like
Spain and Italy: it amounts to 17 and 10 percentage points in the regressions without any other control.
Interestingly, however, Italy‟s gap closes down to 4 percentage point, only a bit larger than France‟s,
when we control for firm characteristics. In other words, it is the industrial structure that limits Italy‟s
ability to get access to those markets.
A different indicator on the complexity of exporting activity is given by the number of
destination markets at the firm level. Eaton, Kortum and Kramarz (2004) found that the number of
French exporters dramatically reduce with the increase in the number of destination countries.9 Figure
3.1. shows that this is the case also in our sample. In all countries, only a small share of firms export to
more than 20 destinations. Anyway, we can notice some differences across countries. For each number
8 We restrict the sample to exporters only because we are interested in the complexity of firms‟ internationalization strategies and we want to investigate whether firms involved in simple strategies (i.e., exporting to the EU) are different from the ones involved in more sophisticated internationalization activities. Anyway, the main results do not change when the analysis covers the whole population. 9 Examining French firm level data, they show that firms differ substantially in export participation: While most firms serve only the domestic market, exporting firms are more productive and bigger in firm size. With respect to internationalization complexity, the number of firms selling to multiple markets falls with the number of destination areas. Using more recent data (2000-2006), also Fontagnè and Gaulier (2008) show that the great part of French exporters are involved in only one foreign market. In addition, they display that the number of served countries is increasing with firm size and productivity.
21
of destination countries, Hungary has always a smaller share of exporters, while Germany and UK
present the highest ones.
Table 3.2 Exporting or not to China and India (the extensive margin)
Linear probability model of exporting to China and India, only exporters
(1) (2) (3) (4) (5) (6) THE DEPENDENT VARIABLE IS:….
Country dummies
Add sector dummies
Add firm size
Add productivity No UK
All controls No UK & SP All controls
Log(Employment) 0.057*** 0.057*** 0.056*** 0.052***
[0.005] [0.006] [0.007] [0.005]
Log(Age) 0.026*** 0.029***
[0.008] [0.006]
Log(LP) 0.036*** 0.034***
[0.007] [0.008]
Group 0.072** 0.043*
[0.035] [0.024]
Foreign Own -0.036 -0.015
[0.031] [0.023]
Blue-Collar share -0.001***
[0.000]
Graduate share 0.001** 0.003***
[0.001] [0.000]
Product Innov 0.026* 0.029***
[0.013] [0.010]
RD share 0.003*** 0.002***
[0.001] [0.001]
Bank Debt share -0.000* -0.000
[0.000] [0.000]
AUT -0.114*** -0.098*** -0.096*** -0.084** -0.082** -0.064**
[0.030] [0.030] [0.030] [0.034] [0.035] [0.030]
FRA -0.058*** -0.053*** -0.050*** -0.029 -0.021 -0.039**
[0.016] [0.016] [0.016] [0.019] [0.020] [0.016]
HUN -0.262*** -0.234*** -0.235*** -0.180*** -0.133*** -0.208***
[0.030] [0.029] [0.029] [0.035] [0.038] [0.030]
ITA -0.101*** -0.094*** -0.073*** -0.068*** -0.032** -0.042***
[0.012] [0.012] [0.012] [0.014] [0.015] [0.013]
SPA -0.171*** -0.158*** -0.142*** -0.120*** -0.123***
[0.016] [0.015] [0.015] [0.019] [0.016]
UK -0.020 -0.018 -0.010 0.008
[0.016] [0.016] [0.015] [0.017]
Constant 0.279*** 0.191*** -0.026 -0.215*** -0.290*** -0.172***
[0.010] [0.016] [0.024] [0.046] [0.063] [0.031]
No. obs. 7653 7653 7653 4537 3930 7221
R-squared 0.026 0.070 0.088 0.094 0.110 0.102

22
Robust standard errors in brackets. Due to missing observations concerning productivity for UK and blue-collar share for both UK and SPA, SPA has not been included in the regression 5, UK in the column 4 and 5. ***, **, * significant at 1%, 5%, 10%
Columns 2-6 include sector dummies.
Table 3.3 shows the distribution of the number of export destinations by country and firm size
class. For the total sample, German firms perform better than those in other countries. We have
already argued that a larger share of these firms export to fast growing emerging countries. On average,
German firms export to 3 countries more than Italian and French firms. Yet, when we take into
account firm size classes, the number of markets invariably rises with size in all countries. In Germany,
for example, it jumps from 7 destination markets for the smallest firms to almost 30 for the largest
ones. Moreover, given the size class, cross country differences are smaller. Again, this suggests that a
large part of the highest export propensity of German firms is due to the industrial (size) structure.
Figure 3.1 Number of export Destinations for Exporters, by Country
Source: Authors‟ elaborations from EU-EFIGE/Bruegel-UniCredit dataset
Table 3.3 Average number of export destinations of exporting firms by country and size class
Size Class AUT FRA GER HUN ITA SPA UK
10-19 5 7 7 3 8 5 9
20-49 8 9 12 4 10 8 12
50-249 18 14 18 6 17 12 18
more than 249 32 24 28 14 29 23 27
23
Total Sample 12 11 14 5 11 8 13 Source: Authors‟ elaborations from EU-EFIGE/Bruegel-UniCredit dataset
Table 3.4
Number of export destinations (only exporters)
(1) (2) (3) (4) (5) (6) THE DEPENDENT VARIABLE IS:….
Country dummies
Add sector dummies
Add firm size
Add productivity No UK
All controls No UK & SP All controls
Log(Employment) 0.379*** 0.374*** 0.344*** 0.328***
[0.012] [0.016] [0.018] [0.013] Log(Age) 0.155*** 0.174***
[0.020] [0.015] Log(LP) 0.201*** 0.204***
[0.019] [0.020]
Group -0.014 0.035
[0.084] [0.062] Foreign Own 0.109 0.151***
[0.075] [0.057] Blue-Collar share -0.004***
[0.001]
Graduate share 0.003** 0.009***
[0.001] [0.001] Product Innov 0.391*** 0.382***
[0.032] [0.024] RD share 0.007*** 0.003**
[0.002] [0.001] Bank Debt share -0.001 -0.000
[0.000] [0.000]
AUT -0.226*** -0.195** -0.176** -0.188** -0.185** -0.098
[0.084] [0.082] [0.077] [0.088] [0.087] [0.076]
FRA -0.230*** -0.228*** -0.208*** -0.170*** -0.140*** -0.182***
[0.045] [0.044] [0.042] [0.050] [0.048] [0.041]
HUN -0.879*** -0.818*** -0.829*** -0.466*** -0.273*** -0.705***
[0.080] [0.078] [0.074] [0.089] [0.090] [0.075]
ITA -0.196*** -0.187*** -0.047 -0.060 0.050 0.050
[0.034] [0.033] [0.032] [0.037] [0.038] [0.032]
SPA -0.502*** -0.487*** -0.384*** -0.394*** -0.295***
[0.043] [0.042] [0.040] [0.048] [0.041]
UK -0.107** -0.130*** -0.075* -0.076*
[0.044] [0.043] [0.041] [0.043]
Constant 2.012*** 1.772*** 0.338*** -0.672*** -1.263*** -0.450***
[0.027] [0.045] [0.063] [0.120] [0.154] [0.079]
No. obs. 7597 7597 7597 4530 3928 7178
R-squared 0.029 0.077 0.179 0.212 0.271 0.238

24
Robust standard errors in brackets. ***, **, * significant at 1%, 5%, 10%
Columns 2-6 include sector dummies.
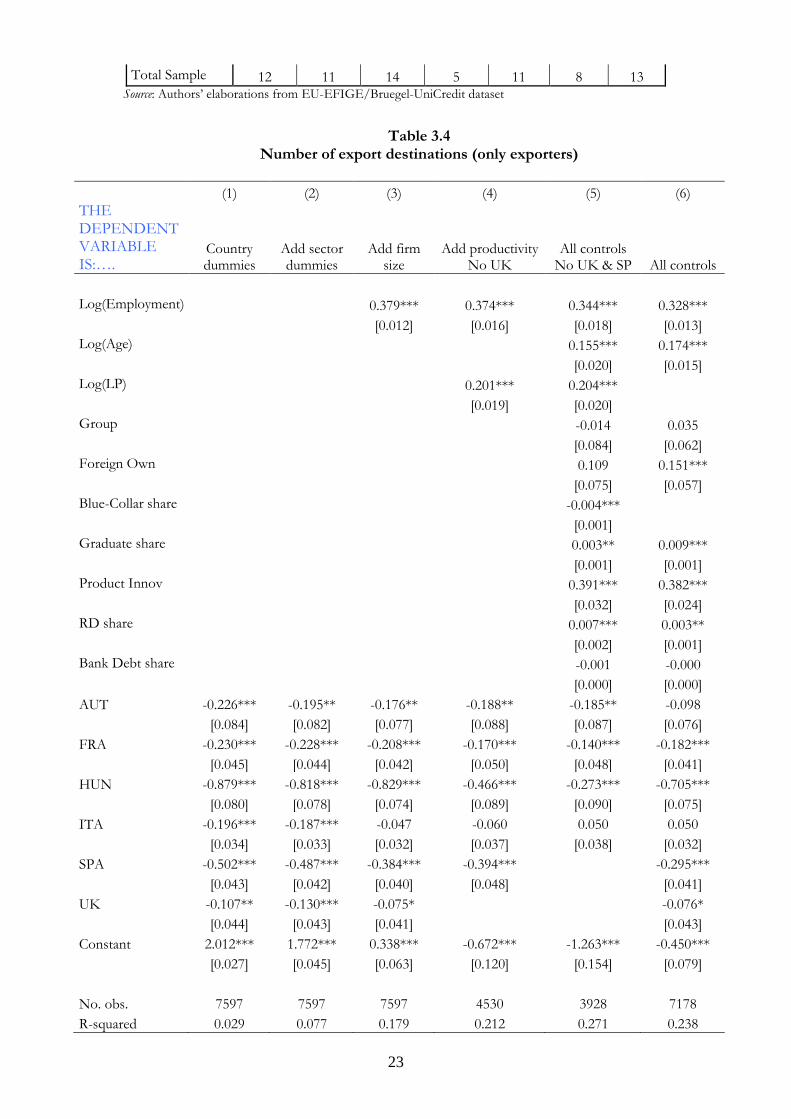
This pattern persists in the econometric analysis (Table 3.4): firms that are larger, more
productive and innovative, older and endowed with more skilled labor, export to many more markets.
Again almost 70% of the total variance explained is due to firm characteristics; only 12 and 20%
to country and sector factors, respectively. As for China and India, Germany present a clear
competitive advantage which however decreases substantially after controlling for a full set of firm
characteristics.

25
4. GLOBAL PRODUCTION
Fact 4a – The majority of European firms use imported inputs. Between five and ten per cent among them in each sample country produces abroad using foreign affiliates or international outsourcing.
Having looked at export patterns, we now focus on global production. The internationalisation
of production is important because it helps firms reducing production costs, tapping foreign
technologies and fostering sales in foreign markets. This can take place through different modalities
which are analysed in our survey. The simplest one is by purchasing foreign inputs and components
through imports for use in domestic production. The largest the share of imported materials, the lower
the value added produced at home. This is the simplest way of internationalising production. The
second modality is international outsourcing (IO), which implies setting up specific arm-length
agreements with companies in foreign markets, for example for the production of finished goods under
licensing or the production of specific components. The third modality, which generally involves higher
investment and fixed costs, is carrying out own production through FDI. Whereas all imports are made
of inputs purchased for home production, FDI and IO are also used to produce items (components or
finished products) for sale in the host market or to third countries.10
We find that in all the countries more than half of the firms are involved in at least one mode of
global production (Table 4.1, first column). This is consistent with the general evidence that a large
share of world trade is in parts and components or it is intra-firm. Imports is the most frequent
modality of internationalising production, given that it is also the least costly one. The share of firms
doing FDI or IO is much lower, varying between around 4 % for Spain and Hungary, up to almost
11% for Austria.
Therefore, country patterns differ when we consider specific modalities of internationalising
production. Germany has a lower share of firms producing abroad than the other countries when we
consider all three modalities. This is driven by the fact that a lower share of German firms use imported
inputs, possibly because in this country a large share of firms are vertically integrated (use less
purchased inputs than elsewhere). This finding is apparently at odd with the larger aggregate German
share of imports of goods on GDP compared to the other large continental countries, but it can likely
be driven by the larger size of German firms. The picture in fact changes completely if we only focus
10 A big and growing strand of the literature investigates the different strategies that firms use in order to internationally organize their production. For the basic framework, see e.g. Antràs (2003) and Antràs and Helpman (2004). They investigated the link between firm productivity and the sourcing mode and thus are able to differentiate between international outsourcing and FDI activities. They showed theoretically that, in headquarter intensive sectors, least productive firms exit the market. With increasing productivity firms start to outsource to the domestic market, vertically integrate at home, outsource to the foreign market, and finally, engage in FDI. Thus, only the most productive firms are able to investigate in more complex internationalization strategies. An excellent overview of this kind of literature can be found in Helpman (2006).

26
on IO and FDI. Here German firms are more likley to pursue these strategies than firms in other
countries (excluding Austria), followed by France and Italy.
Table 4.1
Share of firms involved in global production
Country Import, FDI, IO FDI, IO only
AUT 61.1 11.1
FRA 62.9 8.2
GER 45.1 9.2
HUN 57.2 4.0
ITA 50.3 6.2
SPA 53.5 4.2
UK 58.0 8.7 Source: Authors‟ elaborations from EU-EFIGE/Bruegel-UniCredit dataset
Even though the extensive margin of imports is larger than for IO and FDI, the ranking is
opposite when we consider the intensive margins, i.e. the conditional share of the value of imports over
turnover is much lower than the conditional share of turnover from FDI and IO on total firms‟
turnover (see table 4.2). In other words, fewer firms enter into FDI or IO (extensive margin), but then
these modes imply a much larger share of (or shift to) foreign production for firms that do it.
Table 4.2 Average Share of Firm Turnover from Imports, IO, and FDI
(percentage of Firm Turnover)
country Imports FDI and IO
AUT 8.9 28.4
FRA 12.9 31.7
GER 8.3 31.1
HUN 16.7 34.0
ITA 10.8 29.7
SPA 9.9 33.6
UK 11.6 45.4 Source: Authors‟ elaborations from EU-EFIGE/Bruegel-UniCredit dataset
In what follows we focus our discussion on IO and FDI. First, we look at the geographical
distribution of firms carrying out foreign production, either through IO or FDI (Table 4.3): where do
these firms carry out foreign production? In contrast to exports, notice that one firm out of two among
those producing abroad has no production facilities in the EU15. This supports the view that the EU

27
market can easily be supplied through exports, given the low barriers within the single market. We also
notice that for all the sample countries China and India are the most frequent production locations
outside Europe. A very sizeable share of firms is more likely to invest there than in the US, even
though the US are still the most important non European export market. Producing in China is
important, both to overcome sizeable trade barriers, and in order to benefit from lower production
costs there.
Table 4.3
The geographical distribution of firms producing abroad through IO and/or FDI
(percentages)
country EU15 Other EU Other
Europe China India
Other Asia
USA CAN
Central South
America Others
AUT 62.6 53.7 20.0 17.4 7.1 5.9 4.6 7.1
FRA 53.4 23.3 13.2 35.0 13.1 14.7 5.1 30.4
GER 55.4 42.2 22.5 34.1 12.7 20.1 8.9 8.1
HUN 46.0 51.9 28.2 0.0 0.0 0.0 0.0 5.9
ITA 47.4 31.5 18.3 32.7 13.3 6.2 6.1 15.2
SPA 62.9 13.7 4.0 41.1 5.5 9.2 5.6 16.9
UK 52.7 19.2 10.9 42.9 22.1 21.6 4.1 17.3 Source: Authors‟ elaborations from EU-EFIGE/Bruegel-UniCredit dataset
The share of firms producing in China and India is very close in three major EU exporting
economies (France, Italy and Germany), although this picture hides a composition effect. In fact
Germany has a higher share of FDI, whereas Italy and France a higher share of IO. We will come back
to this issue later in this section.
Now, as we did for exports, we want to understand how far the share of firms doing FDI and
IO can be related to country characteristics or rather to firm specific factors. As a first pass on the data,
note from Table 4.4 that also in this case the share of foreign producers rises with size, and in all
countries it is especially high for firms with more than 250 employees. There are of course differences
in the average share across countries, with once more Germany having the highest share (after Austria),
but these appear second order compared to dissimilarities according to size.

28
Table 4.4 Percentage share of firms doing FDI and/or IO by country and size class
Size Class AUT FRA GER HUN ITA SPA UK
10-19 5.9 5.3 3.5 4.7 3.6 2.0 5.7
20-49 5.6 5.7 7.6 3.0 5.8 3.8 6.7
50-249 22.1 13.6 13.0 2.8 12.9 8.3 14.2
more than 249 40.9 30.8 38.4 12.7 32.4 25.7 23.3
Total 11.1 8.2 9.2 4.0 6.2 4.2 8.7
Source: Authors‟ elaborations from EU-EFIGE/Bruegel-UniCredit dataset
This pattern persists if we carry out our usual econometric exercise and we test the linear
probability of doing foreign production either through IO or FDI (Table 4.5). Country dummies are
significant and persistently negative for Italy, Hungary and Spain. This is consistent with the average
shares of Table 4.4. Firm characteristics are once more very important in explaining this dimension of
internationalisation: size, productivity and human capital are always significant and with the expected
sign.11
Table 4.5 Producing abroad or not (the extensive margin)
Linear probability model of producing abroad through FDI and/or IO
(1) (2) (3) (4) (5) (6) DEPENDENT VARIABLE IS….
Country dummies
Add sector dummies
Add firm size
Add productivity No UK
All controls No UK & SP All controls
Log(Employment) 0.059*** 0.058*** 0.060*** 0.050***
[0.002] [0.003] [0.004] [0.003]
Log(Age) 0.003 0.006**
[0.004] [0.003]
Log(LP) 0.035*** 0.028***
[0.003] [0.004]
Group 0.003 0.028**
[0.020] [0.014]
Foreign Own 0.034* 0.045***
11 Concerning empirical evidence on the Global Sourcing model of Antras and Helpman, Nunn and Trefler (2008) use data for the US economy (covering the years 2000 and 2005) in order to investigate the intra-firm share of imports. Overall, they support the findings of the Antras and Helpman models and thus show that as productivity increases, firms start first to outsource and then to serve the foreign market via FDI. In a recent discussion paper, Kohler and Smolka (2009) investigate the impact of productivity on the sourcing mode for Spanish firms. They also found support for the predictions of the Antras and Helpman (2004) framework. Defever and Toubal (2007) examine the internationalization mode of France firms. However, their analysis does not directly support the picture drawn above. Since their results show that more productive firms engage in outsourcing instead of FDI, they rearranged the theoretical framework by assuming higher fixed costs under outsourcing than with FDI. Andersson et al. (2008) present evidence for the selection of more productive firms in more complex internationalization modes for the Swedish economy. Federico (2009) supports the increasing complexity of internationalization modes with firm productivity for the Italian economy. For additional empirical evidence concerning the link between productivity and internationalization modes, see e.g. Fryges and Wagner (2008) examining a huge data set for Germany, or Serti and Tomasi (2008) for additional evidence on Italy, Fontagnè and Gaulier (2008). Wagner (2007) gave a review of this literature.

29
[0.018] [0.013]
Blue-Collar share -0.001***
[0.000]
Graduate share 0.001*** 0.002***
[0.000] [0.000]
Product Innov 0.032*** 0.030***
[0.006] [0.005]
RD share -0.000 0.000
[0.000] [0.000]
Bank Debt share 0.000** 0.000**
[0.000] [0.000]
Venture capital 0.277*** 0.161***
[0.049] [0.031]
AUT 0.019 0.022 0.023 0.039** 0.050*** 0.030**
[0.015] [0.014] [0.014] [0.017] [0.018] [0.014]
FRA -0.010 -0.009 -0.004 0.001 0.002 0.000
[0.007] [0.007] [0.007] [0.009] [0.009] [0.007]
HUN -0.052*** -0.052*** -0.052*** -0.019 -0.026 -0.059***
[0.014] [0.013] [0.013] [0.016] [0.018] [0.014]
ITA -0.030*** -0.035*** -0.021*** -0.023*** -0.011 -0.013**
[0.006] [0.006] [0.006] [0.007] [0.008] [0.006]
SPA -0.050*** -0.052*** -0.038*** -0.039*** -0.039***
[0.007] [0.007] [0.007] [0.008] [0.007]
UK -0.004 -0.012 -0.009 -0.013*
[0.008] [0.008] [0.007] [0.008]
Constant 0.092*** 0.041*** -0.162*** -0.321*** -0.294*** -0.193***
[0.004] [0.007] [0.011] [0.021] [0.027] [0.014]
No. obs. 14161 14161 14161 8313 7110 13326
R-squared 0.005 0.022 0.061 0.077 0.106 0.080 Robust standard errors in brackets. ***, **, * significant at 1%, 5%, 10%
Columns 2-6 include sector dummies.
Fact 4b – FDI and IO are generally exclusive modes of carrying out international production. FDI are more frequently used by larger firms to support sales in foreign markets. German firms are more likely to choose FDI, Italian and French ones IO.
Up to here we have considered jointly all firms producing abroad, without distinguishing
between FDI and IO. We now examine if there are different patterns in these two modalities of
internationalising production. The theoretical literature has very clear predictions on the conditions
under which it is more effective to carry out international production within the boundaries of the firm
or through arm-length agreements12. These choices are both related to the characteristics of the
activities to be carried out abroad (knowledge content, relevance for the overall activities of the firm)
and to the ability of the firms to overcome the fixed costs invoved in pursuing each modality. In this
12
Refer back to footnote 8 for a discussion of this literature

30
respect, we would predict that the modes of internationalising production are generally mutually
exclusive and that if, as expected, FDI involves larger fixed costs, the more efficient firms, other things
equal, choose this modality. Consistently with these predictions we notice in fact that choices are in
most cases exclusive, in that only a minority of firms engage in both modes (Table 4.6). Note also that
these patterns vary across countries: German and Spanish firms are more likely to do FDI than IO, in
contrast to French and Italian firms.
Table 4.6
The choice between FDI and IO (only firms producing abroad) (% of Firms engaging in each mode of foreign production)
Country Only FDI Only IO Both FDI
and IO
AUT 53.0 34.0 12.9
FRA 33.5 54.7 11.8
GER 57.0 35.1 7.9
HUN 49.4 50.6 0.0
ITA 34.0 60.5 5.6
SPA 61.0 34.8 4.2
UK 49.9 37.6 12.6
Source: Authors‟ elaborations from EU-EFIGE/Bruegel-UniCredit dataset
This difference is important because it suggests that the two modes are frequently used to
pursue different purposes. FDI seems to be predominantly used for sales in foreign countries, either
the ones where affiliates are based or other foreign markets, whereas offshoring to de-localise
production both of parts and components and finished products (Figures 4.1 and 4.2). Note that this
pattern is pretty consistent across countries: in all the largest countries analysed almost 80% of firms
doing IO declare that they re-import at home the goods produced abroad. These goods are either
finished products or components. The shares of FDI makers that import goods back home is also
sizeable, but lower than for IO. For most countries a large share of firms investing abroad use foreign
affiliates for sales to the host or to third foreign countries. This share is especially high in Germany
(60%).
Figure 4.1
Main Destinations of FDI production

31
Source: Authors‟ elaborations from EU-EFIGE/Bruegel-UniCredit dataset
Figure 4.2 Main Destinations of IO production
Source: Authors‟ elaborations from EU-EFIGE/Bruegel-UniCredit dataset
32
Table 4.7 The choice between FDI and IO for firms producing abroad
(1) (2) (3) (4) (5) (6) THE DEPENDENT VARIABLE IS ..
Country dummies
Add sector dummies
Add firm size
Add productivity No UK
All controls No UK & SP All controls
Log(Employment) 0.126*** 0.129*** 0.100*** 0.108***
[0.010] [0.014] [0.016] [0.012]
Re-Import -0.175*** -0.123***
[0.047] [0.033]
Log(Age) 0.035 0.038**
[0.024] [0.017]
Log(LP) 0.022 0.013
[0.022] [0.024]
Group 0.062 0.013
[0.087] [0.058]
Foreign Own 0.075 0.097*
[0.083] [0.056]
Blue-collar share 0.000
[0.001]
Graduate share -0.001 0.000
[0.001] [0.001]
Product Innov 0.042 0.034
[0.041] [0.030]
RD share 0.001 0.003*
[0.002] [0.002]
Bank Debt share -0.000 -0.000
[0.000] [0.000]
Venture capital 0.306** 0.222**
[0.129] [0.104]
AUT 0.011 0.035 0.018 -0.067 -0.069 0.016
[0.078] [0.076] [0.072] [0.083] [0.084] [0.073]
FRA -0.196*** -0.179*** -0.160*** -0.150*** -0.128** -0.133***
[0.044] [0.044] [0.041] [0.052] [0.052] [0.042]
HUN -0.155 -0.127 -0.064 -0.117 -0.196 -0.081
[0.115] [0.114] [0.108] [0.146] [0.158] [0.113]
ITA -0.254*** -0.194*** -0.143*** -0.140*** -0.133*** -0.115***
[0.038] [0.038] [0.036] [0.044] [0.048] [0.040]
SPA 0.003 0.021 0.056 0.079 0.095*
[0.055] [0.054] [0.051] [0.075] [0.056]
UK -0.024 0.009 0.043 0.016
[0.045] [0.045] [0.042] [0.048]
Constant 0.649*** 0.723*** 0.160** -0.133 0.009 0.134
[0.025] [0.069] [0.080] [0.171] [0.205] [0.104]
No. obs. 1180 1180 1180 671 617 1091
R-squared 0.051 0.093 0.193 0.197 0.230 0.221 Robust standard errors in brackets. ***, **, * significant at 1%, 5%, 10%
Columns 2-6 include sector dummies.

33
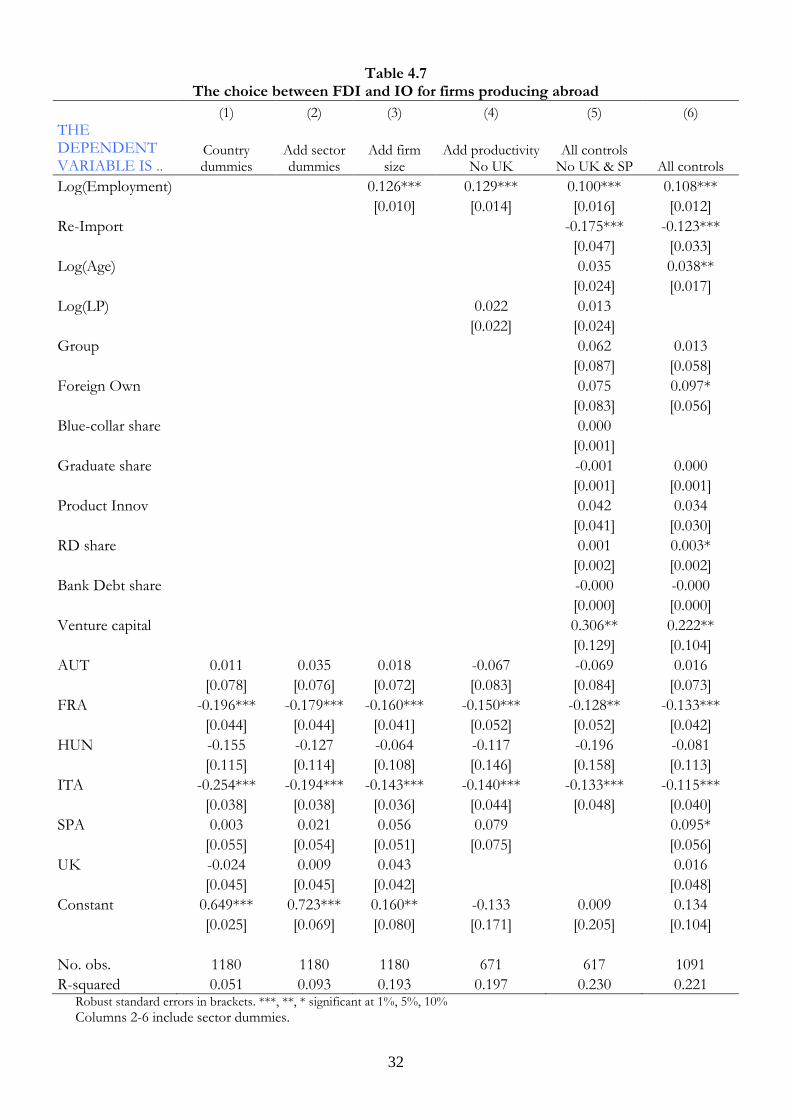
To corroborate this evidence, in the econometric analysis of table 4.7 we test the linear
probability that firms carrying foreign production choose FDI instead of IO. The dependent variable is
one if the firm chooses FDI and zero otherwise. We keep exactly the same set of explanatory variables
we have used in all other regressions, except for a dummy that controls for the destinations of the
goods produced and which is one if these goods are re-imported back into the home country.
The regressions confirm that when they produce abroad firms in Italy and France are less likely
to do it through FDI than throuh IO compared to German ones (the two country dummies are
persistently significant and negative). This result holds even when we control for firm characteristics.
Nonetheless, firm charactristics remain the dominant explanatory facors also for the choice between IO
and FDI (the explanatory power of the regressions increase when we include firm characteristics)
Among firm level features, size is by far the dominant explanatory factor.
Finally, note that foreign affiliates are a less likely mode of foreign production when output is
imported back into the home country. This emerges from the negative and significant sign of the Re-
import dummy and it also confirms the average patterns reported in Figures 4.1 and 4.2.
Fact 4c – Multi-country strategies of international production are instrumental in increasing foreign exports, especially in emerging economies.
The survey shows that foreign production is an extremely important component of firms‟
global strategies. To strengthen this point even further, it is useful to look at whether firms pursue
multi-country geographical strategies in internationalizing production and how far these are related to
export patterns. In oter words if firms tend to have a limited number of production facilities in few
regions or, rather if they pursue comprehensive multi-country strategies. This is an important issue,
given that difference in factor costs and market dynamics enhance returns from spreaidng production
globally.
Let us focus on China and India the two fastest growing and arguably most difficult markets. In
Table 4.8 we report, only for those firms that do FDI in China and India, the share of them that also
have foreign plants in other regions. This table shows clearly that German and French firms pursue
more comprehensive and diversified geographical strategies than firms from other countries. For
example, 40% of the French firms and 35.4% of the German firms investing in China also invest in the
US. This share is much lower for Spanish and Italian firms. Their firms investing in China are generally
not very likely to invest in any other geographical area.

34
Table 4.8
The geographical distribution of FDI, conditional on doing FDI in China and India (percentages)
country EU15 Other EU Other
Europe Other Asia USA CAN
Central South
America Others
AUT 90.6 86.2 36.8 38.4 24.6 36.8 35.4
FRA 57.0 32.6 23.0 24.1 39.9 11.2 19.3
GER 54.2 39.2 37.6 25.5 35.4 14.5 8.3
ITA 32.8 10.0 7.6 7.3 4.2 7.3 13.0
SPA 35.3 16.4 0.0 3.7 8.7 0.0 5.6
UK 37.5 24.1 7.8 20.1 29.5 4.1 14.2 No Hungarian firm invests in China and India. Source: Authors‟ elaborations from EU-EFIGE/Bruegel-UniCredit dataset
This comprehensive geographical pattern of foreign production is also linked to export
patterns, particularly in fast growing emrging economies. As shown in table 4.9, the share of total
country exports to India and China of firms that also have a foreign plant in those countries is over one
quarter for France, Germnay and Italy. This is partly due to the fact that FDI makers are large, but also
that FDI foster exports to emerging economies. The higher propensity of German firms to carry
foreign production and the ability of its firms to pursue multi country production strategies especially in
FDI is therefore a key competitive tool to foster also exports.
Note that this link between foreign production and exports is weaker if we consider North
American markets, possibly because exports to this area faces lower trade barriers than to China and
India. In this case there are pretty large differences in the behaviour of our sample countries. A large
share of French exports to North America originate from firms producing there. This share is lower for
Germany and even more so for Spain and Italy.
DANIELA ESTENDI AL TAVOLA ANCHE AGLI USA
Table 4.9 Exports of firms with FDI to China and India over total country exports to China and India
Country Export of firms with FDI to China and India over total
exports
FRA 28.3
GER 25.1
ITA 28.2 Source: Authors‟ elaborations from EU-EFIGE/Bruegel-UniCredit dataset

35

36
5. RECONCILING AGGREGATE AND FIRM-LEVEL EVIDENCE: THE ROLE OF INDUSTRIAL STRUCTURES
FABIANO E MATTEO SEZIONE A RIVEDERE. HO GIA’ CAMBIATO I CLAIMS
Fact 5a –Internationalisation patterns of countries differ mainly because nations differ in their internal industrial structures, i.e in the distributions of their firms’ characteristics, like size and productivity
How can we reconcile the findings that internationalisation patterns are predominantly driven
by firm characteristics and that their impact is similar across countries, with the evidence that, overall,
countries perform very differently in terms of their exports and global production strategies? This
apparent inconsistency can easily be reconciled if we consider the overall industrial structure of the
countries analysed, as reported in tables Tables A5 and A6 in Appendix III and as discussed in the
introduction. If we just focus on size and sectoral compositions, we immediately see that firms
characteristics are indeed distributed very differently in each of our countries. And of course these
differences are also mirrored in our representative samples.
The claim that firm characteristics play a predominant role is supported by our regressions,
particularly in section 2, where we show that in all countries the share of exporting firms (the extensive
margin) and the share of export per exporting firm (the intensive margin) both increase with size and
other firms‟ characteristics. When we control for these features and for the sectoral structure of
industry, country differences loose explanatory power of the export performance. Of course,
differences still persist: we have argued for example that Italian firms, independently of their
characteristics, have a higher export propensity than others, and that German firms show a lower
export propensity, possibly induced by the large size of their domestic market. However, these are
second order explanatory factors relatively to the industrial structure and the characteristics of the
firms.
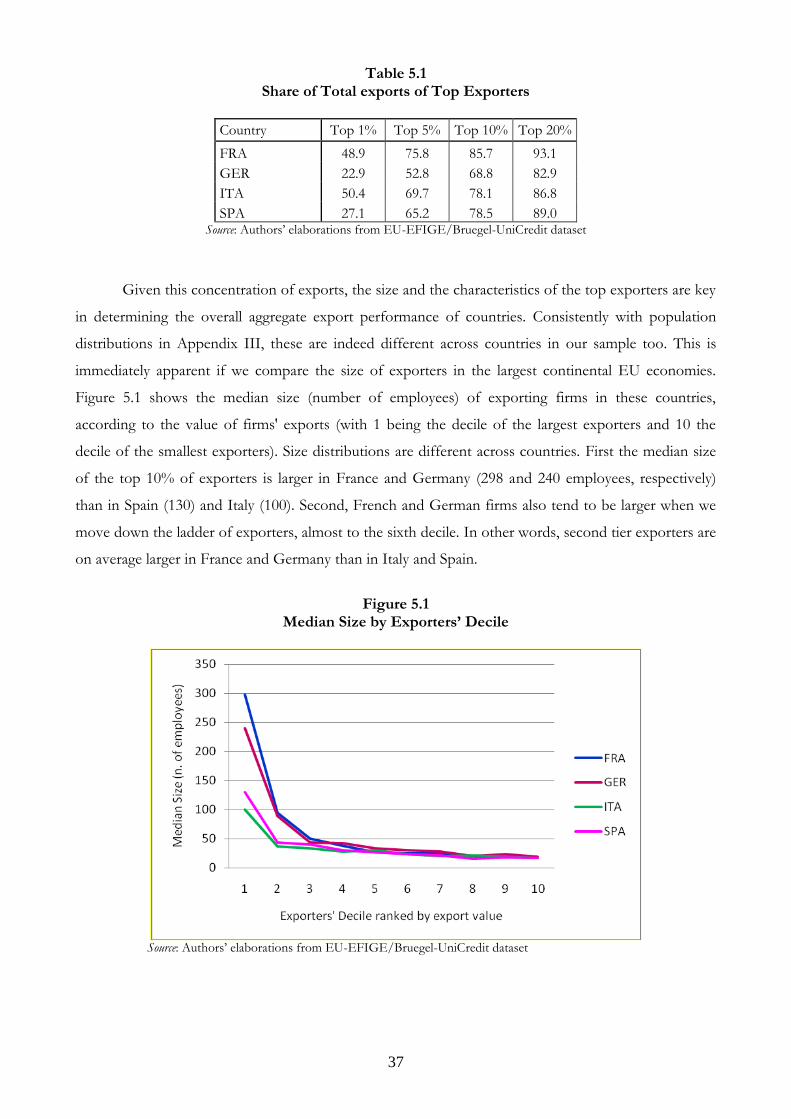
This finding is also consistent with the statistics on the share of total exports per percentile of
exporter, up to the second top decile, reported in table 5.1. For all our countries the top 20% of
exporters, ranked in terms of export size account for over 85% of exports. This was also the central
result of Mayer and Ottaviano (2007), who showed that in all European economies exports were very
concentrated among the largest „happy few‟ firms.
37
Table 5.1 Share of Total exports of Top Exporters
Country Top 1% Top 5% Top 10% Top 20%
FRA 48.9 75.8 85.7 93.1
GER 22.9 52.8 68.8 82.9
ITA 50.4 69.7 78.1 86.8
SPA 27.1 65.2 78.5 89.0 Source: Authors‟ elaborations from EU-EFIGE/Bruegel-UniCredit dataset
Given this concentration of exports, the size and the characteristics of the top exporters are key
in determining the overall aggregate export performance of countries. Consistently with population
distributions in Appendix III, these are indeed different across countries in our sample too. This is
immediately apparent if we compare the size of exporters in the largest continental EU economies.
Figure 5.1 shows the median size (number of employees) of exporting firms in these countries,
according to the value of firms' exports (with 1 being the decile of the largest exporters and 10 the
decile of the smallest exporters). Size distributions are different across countries. First the median size
of the top 10% of exporters is larger in France and Germany (298 and 240 employees, respectively)
than in Spain (130) and Italy (100). Second, French and German firms also tend to be larger when we
move down the ladder of exporters, almost to the sixth decile. In other words, second tier exporters are
on average larger in France and Germany than in Italy and Spain.
Figure 5.1
Median Size by Exporters’ Decile
Source: Authors‟ elaborations from EU-EFIGE/Bruegel-UniCredit dataset

38
An interesting point emerging from these descriptive statistics, is that, even if exports are very
concentrated, medium sized firms contribute importantly to aggregate exports. Notice from table 5.1.
that German exports are less concentrated than the exports of other European countries. This implies
that in Germany also medium sized firms, which in the case of this country are second tier exporters,
contribute considerably to total exports. Also the top tier exporters in Italy and Spain are in fact
medium sized firms (their median size is 100 and 130 respectively).
The emphasis on firms size consolidation and growth does not imply that firms should be very
large to be successful exporters. Size must be sufficient to undertake complex global operations,
including global production, that is undertaken also by many mediums size firms, as shown before. Still,
countries like Italy and Spain would benefit from a larger population of medium and large firms. This is
our next point.
Fact 5b – If Italy and Spain had the industrial structure of Germany their exports would grow considerably, mostly because of firm size effects.
We have established that country effects are less important that firm characteristics in
determining internationalization patterns. In particular, each country‟s export performance is explained
mostly by its industrial structure – specifically, firm size distribution and specialization pattern -- rather
than by some other aggregate country effect. To further corroborate this point, we ask what the export
performance of each country would be if they had a different industrial structure, keeping its firms‟
export propensity fixed. For example, we have seen that Italian firms have a high export propensity
controlling for size, but at the same time the small average size limits the overall export performance. It
is then natural to ask how Italian exports would change if Italy had a firm size distribution similar to
that of France or Germany. A similar reasoning can be applied to any country. This counterfactual
experiment requires to choose a common industrial structure to be applied to all countries. In theory,
we could choose, as a benchmark, any of the European countries in our dataset, or the average
structure across countries. In practice, since we want to highlight the role of firm size, it is more
convenient to use the industrial structure of Germany, that we have shown to be populated by a higher
share of medium and large firms.
Three remarks are needed before proceeding. First, we define industrial structures in terms not
only of firm size but also of sector specialization to take into account, and thus not attribute to firm
size, an effect due to different export propensity across sectors. Second, due to limitations in the census
data, we cannot consider firms‟ productivity as a third trait of industrial structures: as a consequence,
the contribution of size to export performance might be overestimated to the extent that size and
productivity are positively related. Thirdly – and we will come back on this in the policy conclusions –,

39
the choice of Germany as a benchmark country does not have to be interpreted as a prescription to the
other European countries to become more “German”, but rather simply as an alternative and realistic
firm size distribution.
As a first exercise, we recomputed the share of firms that engage in export activity and the share
of export over total sales using a weighting scheme that replicates the German industrial structure by
size and sector. That is, we use the same firm observations at the country level but we apply a different
weighting scheme, assuming that the firms we observe are drawn from the German population. We
explain in Appendix II how we construct these weighting schemes.
Table 5.2 reports the results for the extensive margin in the first three columns. The first
column reports the actual country shares of exporters, the second one what the shares would be with
German weights, and the third one the difference between the two. With the exception of Hungary, in
all countries the share of exporting firms increases. The effect is maximum in Italy and Spain, where it
increases by 2.5 and 4.3 percentage points respectively. The same occurs for the share of export over
turnover (intensive margins), reported in the remaining three columns of Table 5.2. These increase on
average by slightly more than one percentage points, again reaching a maximum for Spain (2.7).
Table 5.2 Counterfactual exercises: share of firms exporting and export share
(percentages)
Share of firms exporting Share of export over turnover
Country Weights Difference Weights Difference
Own German Own German
AUT 51.8 53.1 1.3 40.4 41.5 1.0
FRA 44.4 46.7 2.3 28.5 29.8 1.3
GER 44.0 44.0 0.0 30.0 30.0 0.0
HUN 49.1 48.5 -0.6 44.8 46.1 1.3
ITA 63.5 66.0 2.5 34.5 35.7 1.2
SPA 47.9 52.2 4.3 25.9 28.6 2.7
UK 55.7 56.2 0.6 29.1 29.6 0.4
Source: Authors‟ elaborations from EU-EFIGE/Bruegel-UniCredit dataset
These effects can be explained by the fact that in the German industrial structure there are
larger firms that, as we have seen, are more export oriented. Still, the increases we observe are modest.
However, one should keep in mind that these are average values. In computing the average export
propensity, for example, the share of one small firm will contribute to the mean in the same way as that
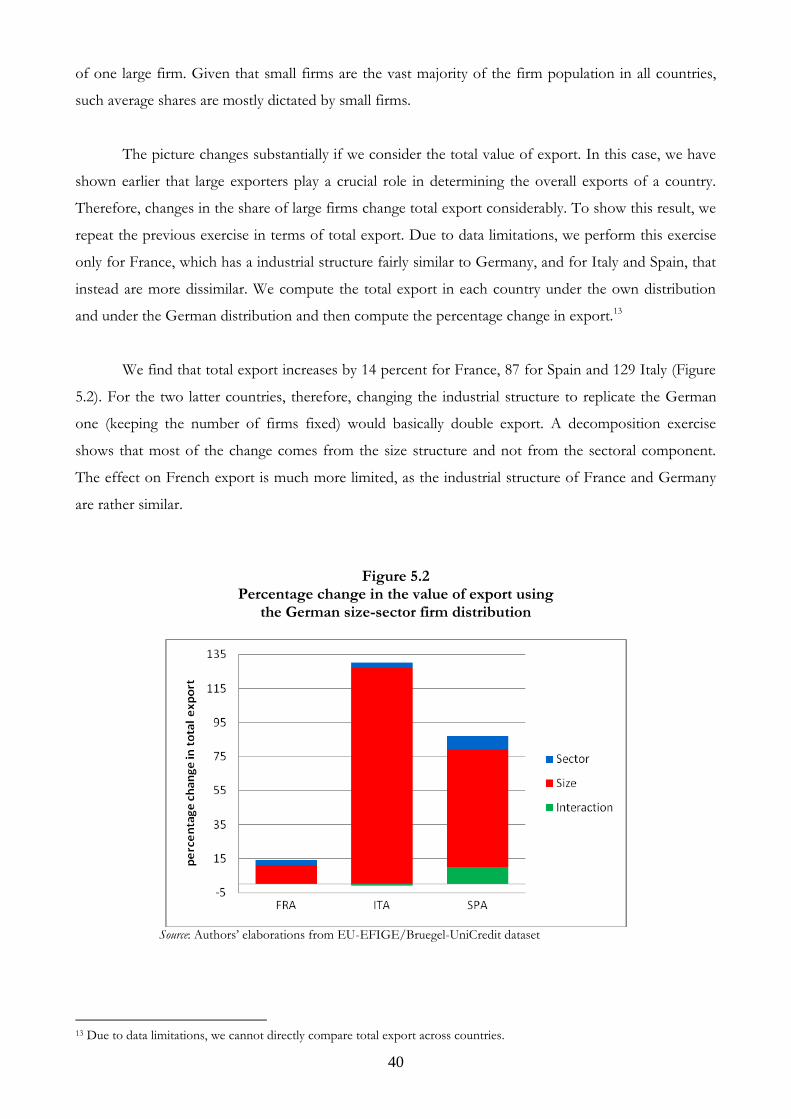
40
of one large firm. Given that small firms are the vast majority of the firm population in all countries,
such average shares are mostly dictated by small firms.
The picture changes substantially if we consider the total value of export. In this case, we have
shown earlier that large exporters play a crucial role in determining the overall exports of a country.
Therefore, changes in the share of large firms change total export considerably. To show this result, we
repeat the previous exercise in terms of total export. Due to data limitations, we perform this exercise
only for France, which has a industrial structure fairly similar to Germany, and for Italy and Spain, that
instead are more dissimilar. We compute the total export in each country under the own distribution
and under the German distribution and then compute the percentage change in export.13
We find that total export increases by 14 percent for France, 87 for Spain and 129 Italy (Figure
5.2). For the two latter countries, therefore, changing the industrial structure to replicate the German
one (keeping the number of firms fixed) would basically double export. A decomposition exercise
shows that most of the change comes from the size structure and not from the sectoral component.
The effect on French export is much more limited, as the industrial structure of France and Germany
are rather similar.
Figure 5.2
Percentage change in the value of export using the German size-sector firm distribution
Source: Authors‟ elaborations from EU-EFIGE/Bruegel-UniCredit dataset
13 Due to data limitations, we cannot directly compare total export across countries.

41
One important caveat is that in the previous exercise we are keeping fixed the number of firms
and changing their size, so that we modify the total size of the manufacturing sector. For example, Italy
has a large firm population, but with a small average size. Making the average size the same as the
German one, keeping the number of firms fixed, increases the industrial sector substantially. It is
therefore interesting to repeat the exercise using employment based weights. In this case, we keep total
employment fixed at the country level (rather than the total number of firms), but redistribute it across
size-sector classes according to the German distribution of employment. By doing this, we keep the
size of the manufacturing sector fixed in terms total employment, but reshuffle workers so as to
replicate the German distribution and implicitly change the number of firms.
When we perform this experiment, effects are smaller but still very sizable: total export would
increase by 24% for Spain and 37 for Italy (Figure 5.3). For France, the increase is a more modest 9 per
cent, in line with the fact that its industrial structure is more similar to the German one.
Note that these changes occur while keeping the total employment fixed, and only derives
from shifting employment in the size-sector distribution to replicate the German distribution. In this
case the sectoral component also plays an important role, particularly for Spain and France. This is due
to three reasons. First, in Italy the sector effect is small, because a large share of its exports are in
traditional industries which are no longer competitive in other countries like Germany. And the size
effect is large even though Italian firms have overall a high export propensity, because, as shown in
Section2, exports increase with size faster in this country than elsewhere. Second, compared to the
previous case, by keeping overall employment constant we are limiting the effects of firm size, that was
dominant in the previous table. Third, our size component only captures a within-sector size effect. The
sector component could also involve an additional size effect. For example, shifting employment from
the textile sector to the chemical sector implies also an increase in average firm size, as chemical firms
are on average larger than textile firms. We choose a decomposition scheme that attributed all this
factor to the sectoral component, constraining size effects to occur only within sector. This seems a
more reasonable decomposition than the alternative one that would attribute to the size effect also the
across sectoral changes. If we were to apply this decomposition we would find that the size component
becomes predominant in all countries (see the Appendix II for details).

42
Figure 5.3 Percentage change in the value of export using the German size-sector employment distribution with constant total employment
Source: Authors‟ elaborations from EU-EFIGE/Bruegel-UniCredit dataset
All in all, the evidence indicates that the main differences across countries are dictated by the
industrial structure. Similar firms behave similarly across countries, but Germany has a structure which
favors the internationalization of its economy much more than Spain and Italy: in particular, the larger
presence of medium and large size firms dictates higher involvement in international activities.

43
6. THE ECONOMIC CRISIS AND THE GLOBAL OPERATIONS OF EUROPEAN FIRMS
In this section we depart from the structural analysis of global operations of European firms,
which has been based on 2008 data, and move to the recent international economic crisis. Thanks to
some questions added to the questionnaires and aiming at assessing how the crisis hit the single firm,
we can not provide, again for the first time, a description of the effects of the crisis from a perspective
that is both comparative and at firm level. Just to keep a link with the previous sections, we separately
address the effects on the extensive and intensive margins of trade.
Fact 6 – The effects of the crisis have been extremely heterogeneous across firms. Larger firms and those exporting out of the EU recorded less dramatic changes in export during the crisis.
According to our sample of 7,536 exporting firms, in 2009 the crisis has caused a reduction of
the value of export for slightly more than half of the firms (51.5%); 29.8% of firms did not vary their
export values, while 18.7% increased them (Table 6.1). Only 3.8% of sampled firms report having
stopped exporting altogether.14 The share of firms that managed to expand their exports during the
crisis is pretty sizeable, considered the magnitude of the systemic effect.
Table 6.1 Exporters and the crisis (2009 vs. 2008)
N. of firms %
N. of firms increasing export 1,449 18.7
N. of firms reducing export 3,983 51.5
- of which stopped exporting * (151) (3.8)
No changes 2,104 29.8
Total 7,536 100.0 Source: Authors‟ elaborations from EU-EFIGE/Bruegel-UniCredit dataset
Given the high heterogeneity in the effects of the downturn in world demand, it is interesting to
look for detectable factors, in terms of country of origin and firm characteristics, that explain the
observed patterns. In Table 6.2 we can see that, out of the 3,983 firms reporting a reduction in export
volumes, German (and Austrian) firms have been relatively less hit, with 45.4% of firms affected (vs. a
sample average of 51.5). Also, a relatively large share of them managed to increase exports (only the
UK did better on this front). This is a first indication that the comprehensive global strategy pursued by
German firms also made them more resilient to the effects of the crisis. On the other side, France,
14 Also Fontagnè et al. (2009) find that exit from exporting has been relatively small for French firms in 2009.

44
Hungary, Italy and Spain have recorded an higher than average percentage of firms with an export
reduction.
In terms of size, medium to large exporters have on average suffered marginally more, with
around 54% of large exporting firms reporting a reduction in exports compared to 50% within the
small exporters group. Moreover, firms exporting beyond the EU market have been more frequently
hit by the compression in their export volumes, with 52.5% of „global‟ firms reporting a fall in export
vs. 47.7% of those exporting only to the „domestic‟ EU market. This result is not surprising, because
these firms are more exposed to changes in global demand.
Table 6.2 Percentage of exporting firms changing export volumes (2009 vs. 2008)
Reducing export Increasing export
All firms 51.5 18.7
By country AUT 43.8 17.5
FRA 58.8 17.1
GER 45.4 20.1
HUN 58.7 12.0
ITA 54.5 13.5
SPA 53.1 22.6
UK 45.2 29.6
By firms‟ size 10-19 50.0 18.4
20-49 51.2 18.5
50-249 53.4 19.4
250 or more 54.0 19.6
By destination Exporters only to EU 47.7 17.6
Global exporters 52.5 19.1 Source: Authors‟ elaborations from EU-EFIGE/Bruegel-UniCredit dataset
However, focusing only on the share of firms that increased or decreased their exports does not
say much on the real effects of the crisis. To be more precise, it is useful to focus on how large the
latter decreases or increases have been by looking at the impact on firms‟ export volumes. To this
extent, the survey also asked firms to report the change in exports experienced during 2009 in
percentage of total export volumes in 2008 (Table 6.3). Restricting to the subsample of exporting firm
which experienced in 2009 a reduction in exports, the average reduction in export volumes has been
very large, in line with aggregate data (30.7%). At the same time, though, the 18.7% of exporters that
increased their exports did it by a significant amount (24.9%). This is to say that the crisis has been
extremely selective and that average figures hide a lot of interesting heterogeneity at the firm level.
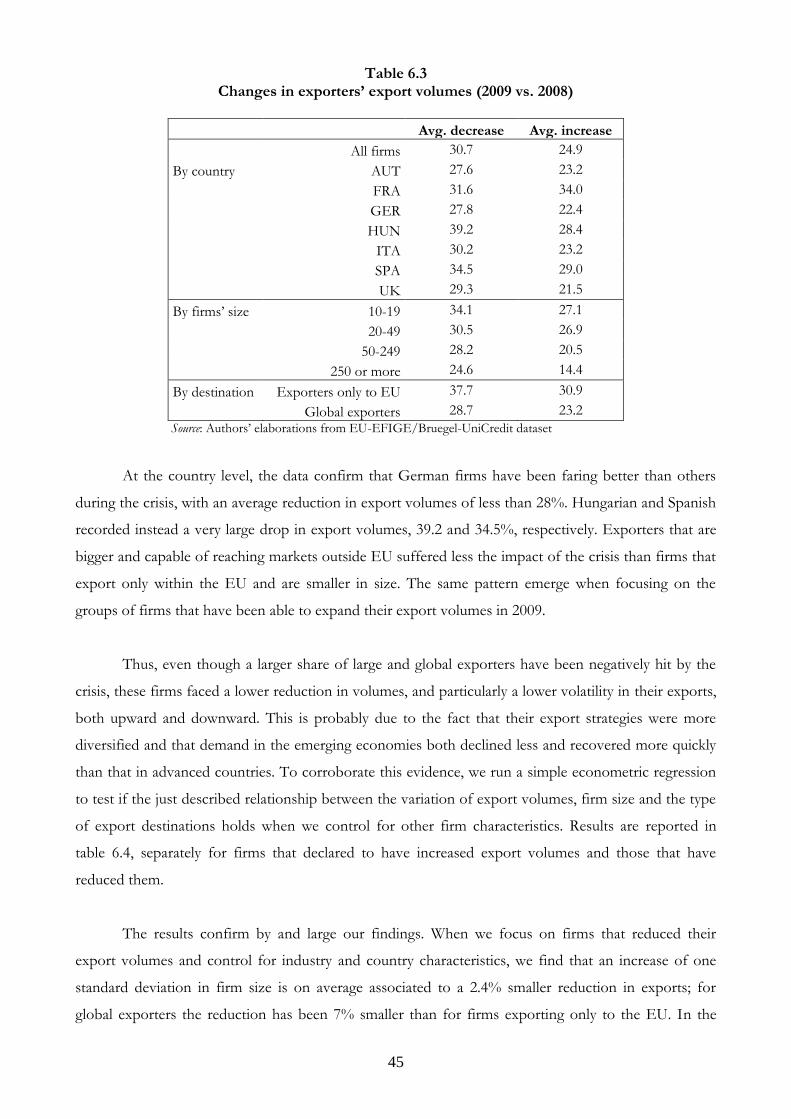
45
Table 6.3 Changes in exporters’ export volumes (2009 vs. 2008)
Avg. decrease Avg. increase
All firms 30.7 24.9
By country AUT 27.6 23.2
FRA 31.6 34.0
GER 27.8 22.4
HUN 39.2 28.4
ITA 30.2 23.2
SPA 34.5 29.0
UK 29.3 21.5
By firms‟ size 10-19 34.1 27.1
20-49 30.5 26.9
50-249 28.2 20.5
250 or more 24.6 14.4
By destination Exporters only to EU 37.7 30.9
Global exporters 28.7 23.2 Source: Authors‟ elaborations from EU-EFIGE/Bruegel-UniCredit dataset
At the country level, the data confirm that German firms have been faring better than others
during the crisis, with an average reduction in export volumes of less than 28%. Hungarian and Spanish
recorded instead a very large drop in export volumes, 39.2 and 34.5%, respectively. Exporters that are
bigger and capable of reaching markets outside EU suffered less the impact of the crisis than firms that
export only within the EU and are smaller in size. The same pattern emerge when focusing on the
groups of firms that have been able to expand their export volumes in 2009.
Thus, even though a larger share of large and global exporters have been negatively hit by the
crisis, these firms faced a lower reduction in volumes, and particularly a lower volatility in their exports,
both upward and downward. This is probably due to the fact that their export strategies were more
diversified and that demand in the emerging economies both declined less and recovered more quickly
than that in advanced countries. To corroborate this evidence, we run a simple econometric regression
to test if the just described relationship between the variation of export volumes, firm size and the type
of export destinations holds when we control for other firm characteristics. Results are reported in
table 6.4, separately for firms that declared to have increased export volumes and those that have
reduced them.
The results confirm by and large our findings. When we focus on firms that reduced their
export volumes and control for industry and country characteristics, we find that an increase of one
standard deviation in firm size is on average associated to a 2.4% smaller reduction in exports; for
global exporters the reduction has been 7% smaller than for firms exporting only to the EU. In the

46
group of firms that were able to increase their exports, the increase has been smaller for larger and
global exporters. This is to say that size and global exporting seemed to have acted as „buffers‟ for the
volatility of the export intensive margins, for both upward and downward changes.
Table 6.4 Change of export volumes, size of exporting firms and export destinations
All exporters
Reduction Empl -2.42 ***
EU_dest 7.32 ***
Increase Empl -3.76 ***
EU_dest 7.00 *** Source: Authors‟ elaborations from EU-EFIGE/Bruegel-UniCredit dataset. Country and industry dummies included but not reported ***, **, * significant at 1%, 5%, 10%
To better appreciate how important is the use of firm level statistics, let us compare Germany
and Italy, the two leaders in European manufacturing exports. As shown in Table 6.4, behind similar
aggregate developments (-18.4% for Gemany and -21.4% for Italy), there are many interesting
differences. In Germany the percentage of firms that say a reduction in their export volumes has been
significantly smaller than in Italy (45.3% against 54.4%), especially among large firms (49.2% against
61.1%). The average reduction in export volumes has been on average smaller in Germany (27.8%)
than in Italy (30.2%), even if larger firms suffered slightly more in Germany (24.6% against 23.8 in
Italy). Similar patterns, again more favourable to Germany, emerge when focusing on firms that
increased or did not change their export volumes.
So how is it then that the aggregate performance of Germany has not been considerably better
than that of Italy? This has to do with the distribution of exporting firms by size. In particular, given
that large firms had more similar performances in the two countries and that these firms typically
account for most of a country‟s aggregate exports, at the end Italy and Germany performed similarly.
On the other side, though, aggregate statistics mask the fact that Italian firms suffered much more
during the crisis. With their smaller size and relatively less sophisticated export strategies they were
clearly more exposed to the crisis than their German counterparts.

47
Table 6.5
Decomposing aggregate exports’ statistics (Italy and Germany; 2009 vs. 2008)
Italy Germany % of firms reducing export 54.4 45.3
- of which large firms (61.1) (49.2) average export reduction (%) -30.2 -27.8
- of which large firms (-23.8) (-24.6) % of firms increasing export 13.5 20.1
- of which large firms (14.3) (20.2) average export increase (%) +23.2 +22.4
- of which large firms (+15.0) (+13.9) % of firms not changing export 32.1 34.6 Aggregate export change -21.4 -18.4
Source: Authors‟ elaborations from EU-EFIGE/Bruegel-UniCredit dataset

48
7. CONCLUSIONS AND POLICY CHALLENGES
The findings of the study, „The Global Operations of European Firms‟, raise potentially
significant policy challenges. While the exploitation of this new data is only beginning, our findings so
far already suggest several areas worth deeper investigation.
First, it is clear that firm characteristics are key in determining the global operations of
European firms. The aggregate performance of countries is different mostly because their industrial
structures are different. Thus, the superior performance of Germany in the export market has much to
do with the number and the characteristics of its firms, rather than with its macro policy and the
orientation of its aggregate demand.
Second, much of these characteristics are correlated to and can be summarised by size. This is
reasonable because there are economies of scales in global operations. Entry barriers have been rising
with the toughening of competition in the global markets and with the shift of market dynamism
towards the emerging economies. To operate in the global markets firms need innovative technologies,
brand recognition, complex organisation and governance structures, capable managers. These are more
difficult to accumulate for small firms.
Third, firm size is not the whole story, though. There are many features that are not always
correlated to size and which are also important. This report has given a very cursory look at them.
Much more research is needed to understand features of successful globalisers that can be carried
through also to other firms.
Fourth, firm growth and consolidation could therefore generate a considerable increase in the
value of European exports. Of course, SME play a fundamental role in the European economy.
However, as shown by Bartelsman, Scarpetta and Schivardi (2005), European firms tend to grow less
than US firms. This suggests the existence of barriers to firm growth that prevent firms from fully
exploiting their growth potential. Identifying such barriers is a key issue for both research and policy
making. Structural reforms that make it easier for firms to grow and to move towards more
sophisticated forms of management, organisation and innovation, could be extremely effective for
strengthening the competitiveness of the region. Also measures of support for small firms should be
clearly and explicitly targeted to their growth.
49
Fifth, structural reforms may be required in several areas, such as labour regulation, taxation,
bureaucracy and many other domains. The global projection of European firms starts however in the
single market, as this is the quintessential quasi-domestic space where firms initially grow and reinforce
their competitiveness. The coordination of structural policies at the European level, that has been
lagging behind compare to aggregate demand policies, would also contribute to strengthening
European firms.
Sixth, policies forcing firms‟ growth and a sectoral allocation of industrial activities would not
necessarily strengthen international competitiveness. The key policy argument of this report is that
country should favour growth and industrial reallocation simply by improving the business
environment, not by forcing the right features for exporting.
Seventh, the report finds that global production is fundamental for global sales, particularly in
emerging markets. Through foreign production firms can often reduce production costs and also enter
more easily into distant markets. In fact, China and India are the countries were European firms are
more likely to have production facilities outside the EU, even more than in the US, which is the main
export destination. Measures that restrict the ability of firms to transfer production abroad could
severely hinder export growth, particularly in difficult markets. At the same time such measures would
weaken the global competitiveness of national firms, with long-term negative effects on domestic
employment.
Eighth, and finally, measures directly targeted at supporting exports can be helpful at reducing
the entry cost into exporting, particularly for complex global operations. However, they cannot
substitute for more difficult, but also more rewarding, structural policies that would strengthen
European firms.
50
REFERENCES Andersson, M., H. Lööf and S. Johansson (2008). Productivity and International Trade: Firm Level
Evidence from a Small Open Economy, Review of World Economics 144 (4), 774-801. Antràs, P. (2003), Firms, contracts, and trade structure, Quarterly Journal of Economics 118 (4), 1375-
1418. Antràs, P. and E. Helpman (2004), Global Sourcing, Journal of Political Economy 112 (4), 552-80. Bartelsman, E., S. Scarpetta and F. Schivardi “Comparative Analysis of Firm Demographics and
Survival: Micro-level Evidence for the OECD countries”, Industrial and Corporate Change, Vol. 14, pp. 365-391, 2005.
Defever, F. and F. Toubal (2007), Productivity and the sourcing modes of multinational firms:
Evidence from French firm level data, CEP discussion paper No 842. Eaton, J., S. Kortum, and F. Kramarz (2004). Dissecting trade: Firms, industries, and export
destinations. American Economic Review (Papers and Proceedings) 94, 150–54. Federico, S. (2009), Outsourcing versus integration at home or abroad and firm heterogeneity,
Empirica, Online Publication Data: 2009/12/10. Fontagné, L. and g. Gaulier, 2010, “Performance à l‟Exportation de la France et de l‟Allemagne‟,
Conseil d‟Analyse Economique, Paris Fryges, H. and J. Wagner (2008). Exports and Productivity Growth: First Evidence from a Continuous
Treatment Approach, Review of World Economics 144 (4), 695-722. Helpman, E. (2006). Trade, FDI, and the Organization of Firms, Journal of Economic Literature,
44(3), 589-630 Helpman, E.; M. J. Melitz and S. R. Yeaple (2004), Exports vs. FDI with heterogeneous firms,
American Economic Review, 94 (1), 300-316. International Study Group on Exports and Productivity (2008), Understanding Cross-Country
Differences in Exporter Premia: Comparable Evidence for 14 Countries, Review of World Economics 144 (4), 596-635
Kohler, W. and M. Smolka (2009), Global Sourcing Decisions and Firm Productivity: Evidence from
Spain, CESifo Working Paper No. 2903. Mayer, T. and G. Ottaviano (2007), The Happy Few: The Internationalization of European Firms,
Bruegel Blueprint Series, Volume III. Melitz, M. J. (2003), The impact of trade on intra-industry reallocations and aggregate industry
productivity, Econometrica 71 (6), 1695-1725. Melitz, M. and G. Ottaviano, Market size, trade and productivity, Review of Economic Studies, 2008, 75, pp. 295 - 316. Nunn, N. and D. Trefler (2007), The boundaries of the multinational firm: An empirical analysis,
University of Toronto, mimeo.

51
Pagano, P. and F. Schivardi (2003), Firm Size Distribution and Growth, Scandinavian Journal of Economics, 105, 255-274.
Serti, F. and C. Tomasi (2008), Self-Selection and Post-Entry Effects of Exports: Evidence from Italian Manufacturing Firms, Review of World Economics, 144 (4), 660-694.

52
APPENDIX
Appendix I. Sample Description
The present report uses the final version of the firm level EU-Efige/Bruegel-UniCredit dataset
( only for Germany we use an intermediate release). The data have been collected within the project
Efige - European Firms in a Global Economy: internal policies for external competitiveness -
supported by the Directorate General Research of the European Commission through its FP7
program. GFK Eurisko dealt with the collection of data via CATI (Computer Assisted Telephone
Interview) and CAWI (Computer Assisted Web Interview). The sample includes around 3,000 firms for
France, Italy and Spain, more than 2,200 firms for UK and Germany15, and 500 firms for Austria and
Hungary.
GFK Eurisko has adopted a sampling design following a stratification by sector and firm size.
Since this sampling design oversamples large firms, we have applied a weighting procedure described
below in order to guarantee the representativeness. The distribution by sectors and firm size for the
sample and the reference population are shown for each country in tables A2.
The survey questionnaire contains both qualitative and quantitative data on firms‟
characteristics and activities, split into six sections providing different pieces of information: Structure
of the Firm; Workforce; Investment, Technological Innovation and R&D; Internationalization;
Finance; Market and Pricing.16 All questions concern the year 2008, with some questions asking
information in 2009 and previous years in order to have a picture of the crisis effects and the dynamic
evolution of firms‟ activity.
Data from the Survey have then been matched with balance sheets information from Amadeus.
The Efige research team is still working on the data collection concerning turnover data. Only for
France, Germany, Italy and Spain we still have a fairly large number of observations when we focus on
turnover data. We will therefore limit the analysis requiring balance sheet data to these countries.
The main focus of the report is on the firms‟ internationalization strategies. In order to identify
these modes of internationalization, we use the following information from the survey. To classify the
firm as an exporter, we combine the following two questions: Firms replying “yes, directly from the
home country” to “Has the firm sold abroad some or all of its own products / services in 2008?” and
15 The German sample will consist of 3,000 firms in the final version. 16 The complete questionnaire is available on the Efige web page.

53
firms replying “regularly/always” or “sometimes” to “Before 2008, has the firm exported any of its
products?”. In fact, using only the 2008 exporters might miss temporary exporters, which might be
more likely not to export in 2008, a year of strong contraction in international trade. Concerning
imports, we follow the same procedure, taking into account materials and service imports as well.
Therefore, we combine the following questions: Firms replying “yes, from abroad” to “In 2008 has the
firm purchased any materials (services) for its domestic production?” and firms replying
“regularly/always” or “sometimes” to “Before 2008, did the firm purchase any materials (services) from
abroad?”. With respect to FDI and IO, we refer to the question “Does the firm currently run at least
part of its production activity in another country?”. Firms replying “yes, through direct investment (i.e.
foreign affiliates/controlled firms)” are considered as FDI makers, firms replying “Yes, through
contracts and arms length agreements with local firms” are considered as International Outsourcers.
The questionnaire provides a variety of other information about the geographical destinations and the
type of goods and services involved in the internationalization strategies.
In Table A4 we report the mean and standard deviation of some key variables by country.
Average size is substantially smaller in Italy and Spain, who also have a higher share of blue collar
workers. Innovation indicators are low in Hungary and highest in Austria and UK. Corporate finance
indicators also point to a more similar structure for Italian and Spanish firms, with low role of groups
and foreign ownership and role of bank debt.

54
Table A1 Sector Definition
NACE Rev 1.1 DESCRIPTION
DA Food products, beverages and tobacco
DB Textiles and textile products
DC Leather and leather products
DD Wood and wood products
DE Pulp, paper and paper products, publishing
and printing
DF Coke, refined petroleum products and
nuclear fuel
DG Chemicals, chemical products and man-
made fibres
DH Rubber and plastic products
DI Other non metallic mineral products
DJ Basic metals and fabricated metal products
DK Machine and equipment n.e.c.
DL Electrical and optical equipment
DM Transport equipment
DN n.e.c.

55
Table A2 Distribution by Size and Sector, Sample/Reference Population
AUSTRIA
Firm Size
Nace Rev 1.1 Between 10 and
49 Between 50 and
249 More than 250 Total
Sample Pop. Sample Pop. Sample Pop. Sample Pop.
DA 39 1,239 7 217 4 39 50 1,495
DB 16 179 5 57 1 12 22 248
DC 3 20 0 10 1 3 4 33
DD 29 479 7 93 0 23 36 595
DE 38 404 12 131 8 31 58 566
DF+DG 8 115 4 55 0 24 12 194
DH 16 186 3 90 3 29 22 305
DI 18 257 6 98 1 22 25 377
DJ 71 963 17 258 9 80 97 1,301
DK 29 534 22 244 7 85 58 863
DL 31 394 16 136 9 58 56 588
DM 10 95 1 48 2 32 13 175
DN 31 703 7 87 1 21 39 811
Total 339 5,568 107 1,524 46 459 492 7,551
FRANCE
Firm Size
Nace Rev 1.1 Between 10 and
49 Between 50 and
249 More than 250 Total
Sample Pop. Sample Pop. Sample Pop. Sample Pop.
DA 142 6,166 45 1,091 27 328 214 7,585
DB 134 1,766 37 429 6 62 177 2,257
DC 21 259 12 105 0 11 33 375
DD 77 1,622 13 214 6 24 96 1,860
DE 181 2,939 42 626 10 165 233 3,730
DF+DG 48 794 38 448 21 255 107 1,497
DH 172 1,553 49 617 15 141 236 2,311
DI 117 1,141 30 272 8 86 155 1,499
DJ 754 7,486 160 1,421 29 237 943 9,144
DK 193 2,848 65 719 23 187 281 3,754
DL 216 2,664 77 759 38 239 331 3,662
DM 54 806 21 288 26 171 101 1,265
DN 42 1,975 19 376 5 80 66 2,431
Total 2,151 32,019 608 7,365 214 1,986 2,973 41,370

56
GERMANY
Firm Size
Nace Rev 1.1 Between 10 and
49 Between 50 and
249 More than 250 Total
Sample Pop. Sample Pop. Sample Pop. Sample Pop.
DA 150 11,889 61 2,226 25 526 236 14,641
DB 43 1,459 35 560 2 88 80 2,107
DC 8 304 0 84 1 27 9 415
DD 58 2,734 17 364 2 62 77 3,160
DE 139 4,731 56 1,457 9 335 204 6,523
DF+DG 33 1,061 28 713 14 321 75 2,095
DH 82 2,319 52 1,361 11 272 145 3,952
DI 38 2,065 19 675 4 165 61 2,905
DJ 281 12,887 143 3,207 24 624 448 16,718
DK 221 7,281 145 2,897 27 756 393 10,934
DL 163 8,350 82 2,082 27 590 272 11,022
DM 19 935 17 632 7 342 43 1,909
DN 97 2,748 55 763 7 128 159 3,639
Total 1,332 58,763 710 17,021 160 4,236 2,202 80,020
HUNGARY
Firm Size
Nace Rev 1.1 Between 10 and
49 Between 50 and
249 More than 250 Total
Sample Pop. Sample Pop. Sample Pop. Sample Pop.
DA 43 1,176 15 336 5 75 63 1,587
DB 15 497 6 165 4 30 25 692
DC 3 106 0 47 1 15 4 168
DD 12 434 5 64 0 4 17 502
DE 32 527 11 127 0 27 43 681
DF+DG 17 140 1 59 2 17 20 216
DH 25 440 10 147 5 29 40 616
DI 22 232 3 65 5 25 30 322
DJ 73 1,327 29 293 6 27 108 1,647
DK 41 575 22 202 5 41 68 818
DL 18 510 10 202 6 101 34 813
DM 7 120 2 74 5 59 14 253
DN 17 421 4 93 1 10 22 524
Total 325 6,505 118 1,874 45 460 488 8,839

57
ITALY
Firm Size
Nace Rev 1.1 Between 10 and
49 Between 50 and
249 More than 250 Total
Sample Pop. Sample Pop. Sample Pop. Sample Pop.
DA 196 6,680 35 773 7 122 238 7,575
DB 256 9,005 37 954 12 127 305 10,086
DC 96 3,988 17 365 2 25 115 4,378
DD 83 3,329 4 212 1 15 88 3,556
DE 146 4,254 20 527 10 73 176 4,854
DF+DG 67 1,650 35 536 14 150 116 2,336
DH 133 3,663 24 612 12 71 169 4,346
DI 141 4,143 21 551 5 86 167 4,780
DJ 571 18,679 95 1,876 20 168 686 20,723
DK 295 8,211 60 1,599 25 242 380 10,052
DL 215 5,808 42 943 15 137 272 6,888
DM 53 1,775 13 435 14 137 80 2,347
DN 193 5,907 26 679 8 55 227 6,641
Total 2,445 77,092 429 10,062 145 1,408 3,019 88,562
SPAIN
Firm Size
Nace Rev 1.1 Between 10 and
49 Between 50 and
249 More than 250 Total
Sample Pop. Sample Pop. Sample Pop. Sample Pop.
DA 377 5,287 61 991 25 199 463 6,477
DB 84 3,018 9 359 3 34 96 3,411
DC 42 1,336 5 96 0 9 47 1,441
DD 197 2,082 11 173 4 16 212 2,271
DE 100 2,947 15 531 12 66 127 3,544
DF+DG 85 1,125 24 361 12 120 121 1,606
DH 114 1,709 30 383 4 46 148 2,138
DI 114 3,071 44 627 5 81 163 3,779
DJ 537 8,492 86 1,104 25 127 648 9,723
DK 253 2,830 40 509 12 70 305 3,409
DL 82 1,646 17 358 17 92 116 2,096
DM 63 1,086 23 361 20 115 106 1,562
DN 232 3,487 41 388 7 35 280 3,910
Total 2,280 38,116 406 6,241 146 1,010 2,832 45,367

58
UK
Firm Size
Nace Rev 1.1 Between 10 and
49 Between 50 and
249 More than 250 Total
Sample Pop. Sample Pop. Sample Pop. Sample Pop.
DA 102 1,883 50 802 14 354 166 3,039
DB 78 1,390 18 336 4 44 100 1,770
DC 6 112 4 33 0 4 10 149
DD 78 1,494 14 225 2 28 94 1,747
DE 185 3,831 61 886 20 187 266 4,904
DF+DG 76 776 28 455 9 167 113 1,398
DH 86 1,911 32 704 7 117 125 2,732
DI 42 960 17 295 2 65 61 1,320
DJ 258 5,909 92 1,275 14 137 364 7,321
DK 146 2,817 50 832 17 175 213 3,824
DL 216 2,718 79 992 14 203 309 3,913
DM 29 962 28 446 1 203 58 1,611
DN 213 2,424 56 513 8 74 277 3,011
Total 1,515 27,187 529 7,794 112 1,758 2,156 36,739
Source: Authors‟ elaborations from EU-EFIGE/Bruegel-UniCredit dataset and Eurostat SBS 2007. For missing data in some cells for the population (due to confidential reasons), we made some hypothesis looking at the distributions in previous
years or sectors with similar technology intensity.
Table A3 Description of the variables used in the report
Variable Description
Employment Number of employees in 2008
Labour Productivity (LP)
Labour Productivity in 2008, in € thousands, calculated as Value Added per employee
Blue-collar share Share of blue collars in 2008
Graduate share Share of employment with an university degree in 2008
Age Firm‟s age
Group Dummy Variable: 1 if the firm belong to a group, and 0 otherwise
Foreign Ownership
Dummy Variable: 1 if the firm is foreign-owned (with at least 50% of its capital owned by foreign shareholders) , and 0 otherwise
Product Innovation
Dummy Variable: 1 if the firm has carried out some product innovation, and 0 otherwise
RD share R&D expenses as percentage of the firm total turnover in 2008
Bank Debt share Share of bank debt over the total external financing
Venture capital Dummy Variable: 1 if the firm has increased its external financing through venture capital, and 0 otherwise
Re-Import Dummy Variable: 1 if the firm re-imports materials/services/products produced abroad, and 0 otherwise

59
Table A4
Descriptive Statistics for the Whole Sample
Variable AUT FRA GER HUN ITA SPA UK
mean (sd)
mean (sd)
mean (sd)
mean (sd)
mean (sd)
mean (sd)
mean (sd)
Employment 90 79 77 72 42 49 109
413 473 247 179 126 178 915
LP 170(a) 114 156 59(a) 153 102 -
328(a) 146 291 106(a) 176 141 -
Blue-collar share 57.7 55.7 56.0 66.7 66.2 74.1 67.2
27.5 29.7 28.6 23.9 18.6 14.4 18.7
Graduate share 5.0 8.2 11.5 15.5 6.5 10.5 8.6
9.9 12.4 15.3 18.8 10.3 13.0 14.6
Age 46 39 45 17 30 27 36
39 33 39 14 20 20 33
Group 12.5 10.1 5.3 12.6 3.0 4.2 14.6
33.1 30.1 22.3 33.2 17.0 20.0 35.4
Foreign Own 12.8 10.3 6.3 19.8 4.1 4.5 12.2
33.4 30.4 24.3 39.9 19.9 20.8 32.8
Product Innov 58.5 46.2 50.2 43.4 47.8 44.3 56.3
49.3 49.9 50.0 49.6 50.0 49.7 49.6
RD share 3.1 3.0 4.2 1.4 3.9 3.2 3.4
7.9 7.6 8.3 6.2 7.5 7.3 8.2
Bank Debt share 87.0 78.7 83.9 82.9 87.5 86.4 65.2
29.5 34.7 30.6 35.4 28.0 27.9 43.1
Venture capital 2.2 1.9 1.3 0.9 0.5 1.0 5.7
14.8 13.6 11.4 9.3 7.2 10.2 23.2 (a)As shown in table 1.1 we have at our disposal a restrict sample of Austrian and Hungarian firms providing turnover data. Anyway these observations have also been used in the regressions. Source: Authors‟ elaborations from EU-EFIGE/Bruegel-UniCredit dataset

60
Appendix II. Weighting Scheme and Counterfactual Exercise
A. Weighting Scheme
Since we are working with a survey we need to construct and use sample weights in order to
correct for some imperfections between the sample at our disposal and the reference population17, and
make sure that data are representative of firm population.
All the analyses in the report are prepared using the following weighting scheme. We build two
types of weights, relative and absolute weights, splitting the sample in 30 cells by sector/size. We define
3 firm size classes (10-49 employees, 50-249 employees, more than 249 employees) and 10 Nace sector
groups (Nace Rev1.1 Sections: DA, DB+DE, DC+DI+DL, DD, DF, DG, DJ, DK, DM, DN).
For each country, the relative weight (rw) for firms in sector k and size class s is built as follows:
SfirmsSfirms
PfirmsPfirmsrw
ks
ksks
/
/
we define Pfirmsks as the number of firms in sector k and size class s for the population in a given
country18, Sfirmsks as the number of firms in sector k and size class s in the sample, Pfirms and Sfirms as
the total number of firms in the population and sample respectively. These weights have the property
that their sum over the firms is equal to the total number of firms in the sample by country.
Absolute weight (w) for the firms in sector k and size class s is built as follows:
ks
ks
ks
ksks
Sfirms
Pfirms
Pfirms
Pfirms
Sfirms
Pfirms
SfirmsSfirms
PfirmsPfirmsw
/
/, that is
ks
ksks
Sfirms
Pfirmsw
These weights have the property that their sum over the firms is equal to the total number of firms in
the reference population by country. Firms belonging to the same sector/size cell share the same
weight.
17 GFK Eurisko collected the data making use of a sampling design that oversamples large firms, in order to capture the higher variability characterizing this part of firm population. 18 As reference population we use firms with more than 10 employees, as defined in the survey.
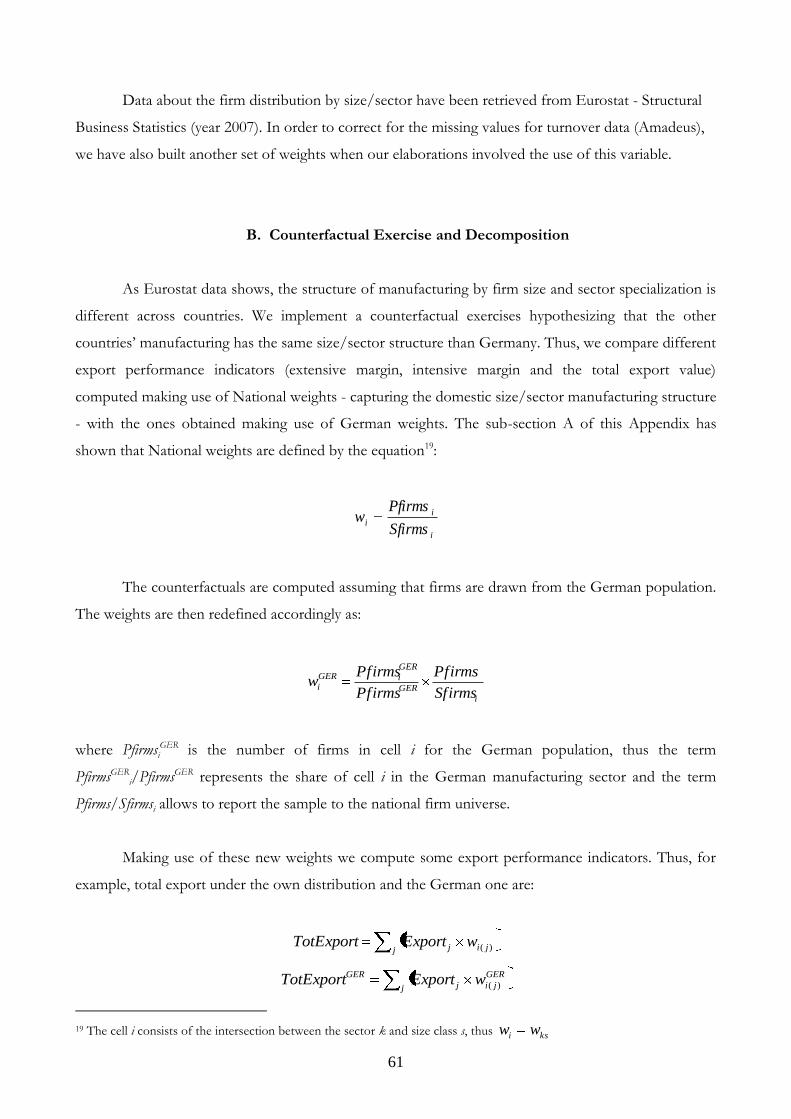
61
Data about the firm distribution by size/sector have been retrieved from Eurostat - Structural
Business Statistics (year 2007). In order to correct for the missing values for turnover data (Amadeus),
we have also built another set of weights when our elaborations involved the use of this variable.
B. Counterfactual Exercise and Decomposition
As Eurostat data shows, the structure of manufacturing by firm size and sector specialization is
different across countries. We implement a counterfactual exercises hypothesizing that the other
countries‟ manufacturing has the same size/sector structure than Germany. Thus, we compare different
export performance indicators (extensive margin, intensive margin and the total export value)
computed making use of National weights - capturing the domestic size/sector manufacturing structure
- with the ones obtained making use of German weights. The sub-section A of this Appendix has
shown that National weights are defined by the equation19:
i
i
iSfirms
Pfirmsw
The counterfactuals are computed assuming that firms are drawn from the German population.
The weights are then redefined accordingly as:
i
GER
GER
iGER
iSfirms
Pfirms
Pfirms
Pfirmsw
where PfirmsiGER is the number of firms in cell i for the German population, thus the term
PfirmsGERi/PfirmsGER represents the share of cell i in the German manufacturing sector and the term
Pfirms/Sfirmsi allows to report the sample to the national firm universe.
Making use of these new weights we compute some export performance indicators. Thus, for
example, total export under the own distribution and the German one are:
j jij wExportTotExport )(
j
GER
jij
GER wExportTotExport )(
19 The cell i consists of the intersection between the sector k and size class s, thus ksi ww
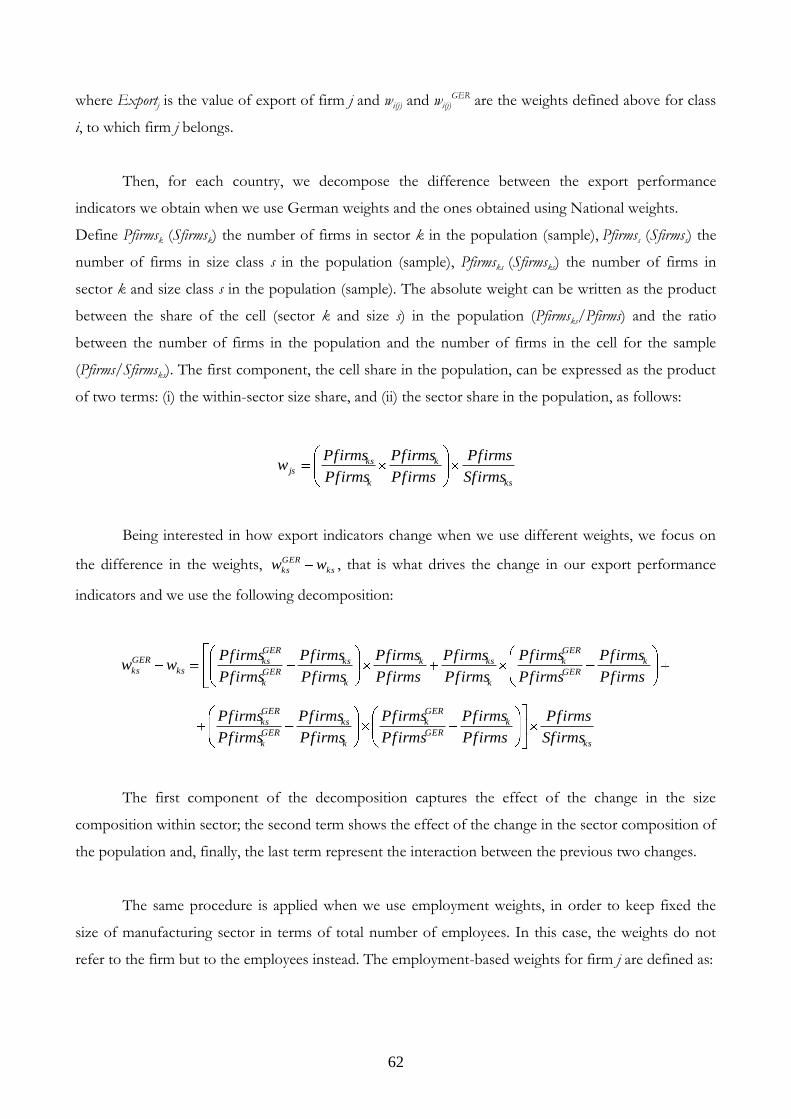
62
where Exportj is the value of export of firm j and wi(j) and wi(j)GER are the weights defined above for class
i, to which firm j belongs.
Then, for each country, we decompose the difference between the export performance
indicators we obtain when we use German weights and the ones obtained using National weights.
Define Pfirmsk (Sfirmsk) the number of firms in sector k in the population (sample), Pfirmss (Sfirmss) the
number of firms in size class s in the population (sample), Pfirmsks (Sfirmsks) the number of firms in
sector k and size class s in the population (sample). The absolute weight can be written as the product
between the share of the cell (sector k and size s) in the population (Pfirmsks/Pfirms) and the ratio
between the number of firms in the population and the number of firms in the cell for the sample
(Pfirms/Sfirmsks). The first component, the cell share in the population, can be expressed as the product
of two terms: (i) the within-sector size share, and (ii) the sector share in the population, as follows:
ks
k
k
ksjs
Sfirms
Pfirms
Pfirms
Pfirms
Pfirms
Pfirmsw
Being interested in how export indicators change when we use different weights, we focus on
the difference in the weights, ks
GER
ks ww , that is what drives the change in our export performance
indicators and we use the following decomposition:
Pfirms
Pfirms
Pfirms
Pfirms
Pfirms
Pfirms
Pfirms
Pfirms
Pfirms
Pfirms
Pfirms
Pfirmsww k
GER
GER
k
k
ksk
k
ks
GER
k
GER
ksks
GER
ks
ks
k
GER
GER
k
k
ks
GER
k
GER
ks
Sfirms
Pfirms
Pfirms
Pfirms
Pfirms
Pfirms
Pfirms
Pfirms
Pfirms
Pfirms
The first component of the decomposition captures the effect of the change in the size
composition within sector; the second term shows the effect of the change in the sector composition of
the population and, finally, the last term represent the interaction between the previous two changes.
The same procedure is applied when we use employment weights, in order to keep fixed the
size of manufacturing sector in terms of total number of employees. In this case, the weights do not
refer to the firm but to the employees instead. The employment-based weights for firm j are defined as:
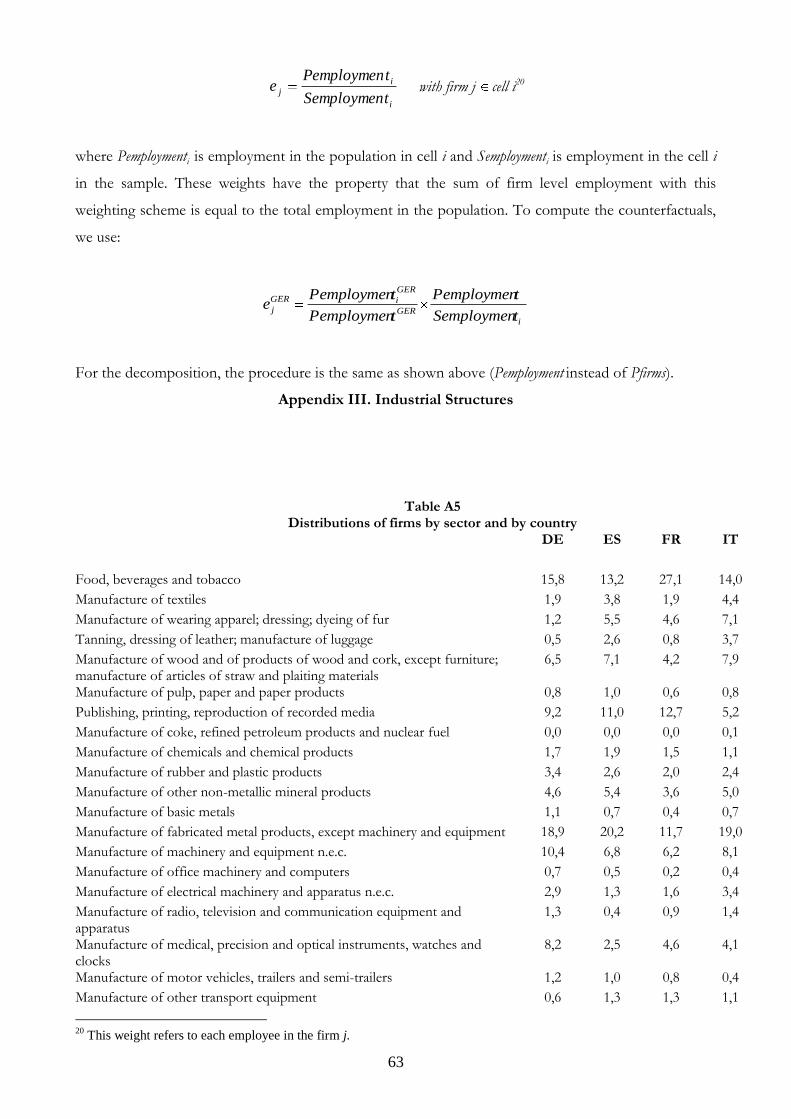
63
i
i
jtSemploymen
tPemploymene with firm j cell i20
where Pemploymenti is employment in the population in cell i and Semploymenti is employment in the cell i
in the sample. These weights have the property that the sum of firm level employment with this
weighting scheme is equal to the total employment in the population. To compute the counterfactuals,
we use:
i
GER
GER
iGER
jtSemploymen
tPemploymen
tPemploymen
tPemploymene
For the decomposition, the procedure is the same as shown above (Pemployment instead of Pfirms).
Appendix III. Industrial Structures
Table A5 Distributions of firms by sector and by country DE ES FR IT
Food, beverages and tobacco 15,8 13,2 27,1 14,0
Manufacture of textiles 1,9 3,8 1,9 4,4
Manufacture of wearing apparel; dressing; dyeing of fur 1,2 5,5 4,6 7,1
Tanning, dressing of leather; manufacture of luggage 0,5 2,6 0,8 3,7
Manufacture of wood and of products of wood and cork, except furniture; manufacture of articles of straw and plaiting materials
6,5 7,1 4,2 7,9
Manufacture of pulp, paper and paper products 0,8 1,0 0,6 0,8
Publishing, printing, reproduction of recorded media 9,2 11,0 12,7 5,2
Manufacture of coke, refined petroleum products and nuclear fuel 0,0 0,0 0,0 0,1
Manufacture of chemicals and chemical products 1,7 1,9 1,5 1,1
Manufacture of rubber and plastic products 3,4 2,6 2,0 2,4
Manufacture of other non-metallic mineral products 4,6 5,4 3,6 5,0
Manufacture of basic metals 1,1 0,7 0,4 0,7
Manufacture of fabricated metal products, except machinery and equipment 18,9 20,2 11,7 19,0
Manufacture of machinery and equipment n.e.c. 10,4 6,8 6,2 8,1
Manufacture of office machinery and computers 0,7 0,5 0,2 0,4
Manufacture of electrical machinery and apparatus n.e.c. 2,9 1,3 1,6 3,4
Manufacture of radio, television and communication equipment and apparatus
1,3 0,4 0,9 1,4
Manufacture of medical, precision and optical instruments, watches and clocks
8,2 2,5 4,6 4,1
Manufacture of motor vehicles, trailers and semi-trailers 1,2 1,0 0,8 0,4
Manufacture of other transport equipment 0,6 1,3 1,3 1,1
20
This weight refers to each employee in the firm j.
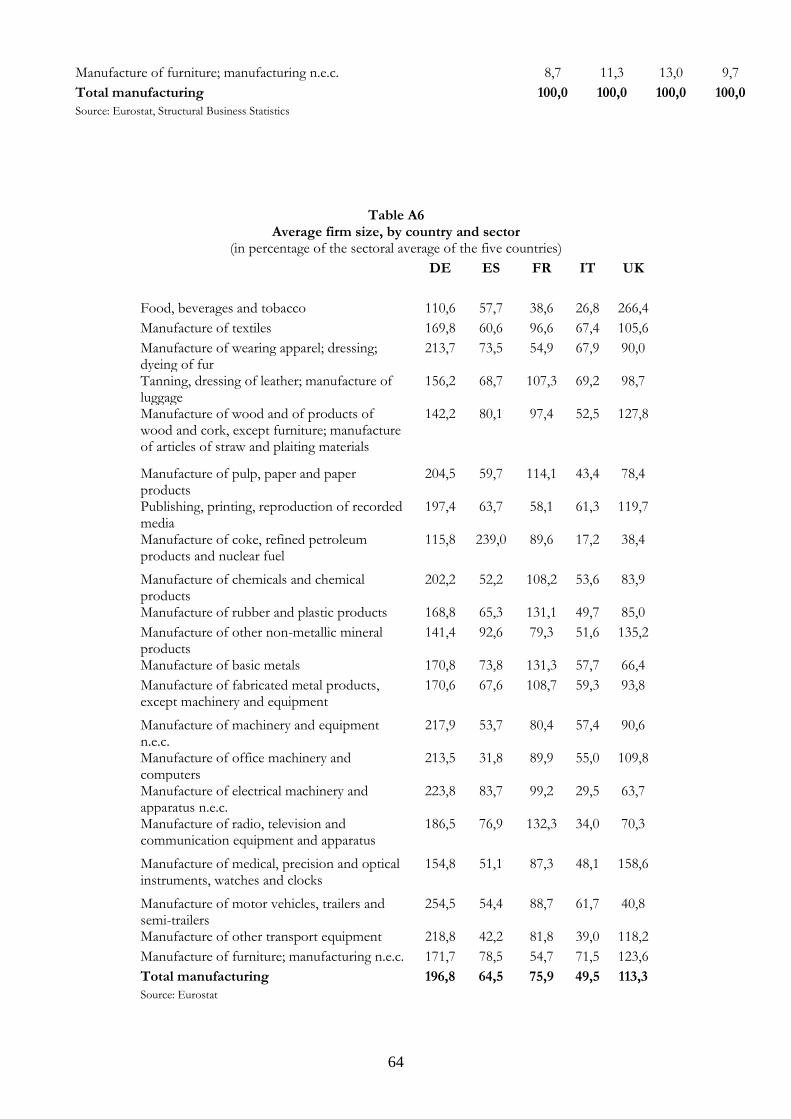
64
Manufacture of furniture; manufacturing n.e.c. 8,7 11,3 13,0 9,7
Total manufacturing 100,0 100,0 100,0 100,0 Source: Eurostat, Structural Business Statistics
Table A6 Average firm size, by country and sector
(in percentage of the sectoral average of the five countries)
DE ES FR IT UK
Food, beverages and tobacco 110,6 57,7 38,6 26,8 266,4
Manufacture of textiles 169,8 60,6 96,6 67,4 105,6
Manufacture of wearing apparel; dressing; dyeing of fur
213,7 73,5 54,9 67,9 90,0
Tanning, dressing of leather; manufacture of luggage
156,2 68,7 107,3 69,2 98,7
Manufacture of wood and of products of wood and cork, except furniture; manufacture of articles of straw and plaiting materials
142,2 80,1 97,4 52,5 127,8
Manufacture of pulp, paper and paper products
204,5 59,7 114,1 43,4 78,4
Publishing, printing, reproduction of recorded media
197,4 63,7 58,1 61,3 119,7
Manufacture of coke, refined petroleum products and nuclear fuel
115,8 239,0 89,6 17,2 38,4
Manufacture of chemicals and chemical products
202,2 52,2 108,2 53,6 83,9
Manufacture of rubber and plastic products 168,8 65,3 131,1 49,7 85,0
Manufacture of other non-metallic mineral products
141,4 92,6 79,3 51,6 135,2
Manufacture of basic metals 170,8 73,8 131,3 57,7 66,4
Manufacture of fabricated metal products, except machinery and equipment
170,6 67,6 108,7 59,3 93,8
Manufacture of machinery and equipment n.e.c.
217,9 53,7 80,4 57,4 90,6
Manufacture of office machinery and computers
213,5 31,8 89,9 55,0 109,8
Manufacture of electrical machinery and apparatus n.e.c.
223,8 83,7 99,2 29,5 63,7
Manufacture of radio, television and communication equipment and apparatus
186,5 76,9 132,3 34,0 70,3
Manufacture of medical, precision and optical instruments, watches and clocks
154,8 51,1 87,3 48,1 158,6
Manufacture of motor vehicles, trailers and semi-trailers
254,5 54,4 88,7 61,7 40,8
Manufacture of other transport equipment 218,8 42,2 81,8 39,0 118,2
Manufacture of furniture; manufacturing n.e.c. 171,7 78,5 54,7 71,5 123,6
Total manufacturing 196,8 64,5 75,9 49,5 113,3 Source: Eurostat

65
Appendix IV. International Trade Statistics: Aggregate Data
Aggregate statistics show that there are huge country differences in export performance. The
WTO (2009) report “International Trade Statistics” e.g. provides extensive evidence of export and
import statistics for all WTO member states. Concerning merchandise exports, Europe accounts in
2008 for 41% of world‟s total merchandise exports. Within Europe, there are still large differences
between the single economies. While Germany accounts for 9.3% of the world‟s merchandise exports,
France accounts for 3.9, Italy for 3.4 and the UK for 2.9. The shares of imports are quite similar, even
when not showing such strong differences. Germany e.g. accounts for 7.5% of worlds merchandise
imports, France for 4.4, the UK for 3.9 and Italy for 3.4. In the same year, according UNCTAD, the
share of exports over GDP was 39.9% for Germany, 23.5% for Italy, 21.6% for France, 16.7% for
Spain, 43.3 for Austria and 69.3 for Hungary. With respect to the current account position in 2008, the
IMF (2009) shows that in 2008, Germany had a surplus of 6.4% of GDP, Austria 2.9%, France a deficit
of -1.6% of GDP, Italy -3.2%, and Spain -9.6%.
Concerning the value in USD, Germany was exporting merchandise products for 1,461.9
Billion USD in 2008, France 605.4 Billion USD, Italy 538.0 Billion USD, the UK 458.6 Billion USD,
Spain 268.3 Billion USD, Austria 181.0 Billion USD, and Hungary 107.7 Billion USD. With respect to
merchandise imports, Germany imported in 2008 1,203.8 Billion USD, France 705.6 Billion USD, the
UK 632.0 Billion USD, Italy 554.9 Billion USD, Spain 401.4 Billion USD, Austria 183.4 Billion USD,
and Hungary 107.9 Billion USD. As these figures suggest , Germany is the world‟s leading exporter in
2008, followed by China, the US, and Japan. France is ranked at number 6, Italy rank 7, the UK rank
10, Spain 17, Austria 25, and Hungary rank 36.
However, with respect to the export participation rate (percentage of exporting firms),
Germany is not as outstanding: A study by the International Study Group on Exports and Productivity
(2008) shows that in 2004, distinguishing between East and West Germany, West Germany has 69.3%
of firms that export, whereas East Germany has only 50.9%. For France this work shows an extensive
margin of 74.8, for the UK a rate of 69.5, and Italy of 69.3%. Sweden is leading the European countries
with an export participation rate of 83.0%.
Moving on outward FDI, the FDI Stat database from UNCTAD reports that France in 2008
has a share of 49.5% of outward FDI to GDP, Austria of 36.6%, Germany of 39.7%, Hungary 9.1%,
Italy 22.7%, Spain 37.5% and UK 57%. Concerning the value of sales by foreign affiliates, Germany is
leading with 400.1 Billion USD in 2004, French foreign affiliates sold goods with a value of 145.6
Billion USD in 2003, and Italian ones 115.3 Billion USD.

66
Looking at the competitiveness of European countries in China, Germany accounts for the
largest share of total world exports to China when compared with other economies in 2008: 4.6% for
Germany, 1.4% for France, 1.2% for Italy, 0.3% for Spain, and 1.3% for UK.
For a huge amount of additional statistics concerning country differences in international trade
structures, also e.g. the contribution of exports to the countries‟ growth rate, see e.g. IMF (2005).