the global naval vessels and surface combatants market ... - sp.pdf · the global naval vessels and...
TRANSCRIPT

Ss
The Global Body Armor and Personal Protection Market 2013–2023
The Global Naval Vessels and Surface
Combatants Market 2015–2025
Reference Code: DF0069SR
Published: July 2015
Report Price: US$ 4,800 (Single Copy)

The Global Naval Vessels and Surface Combatants Market 2015–2025 Single Copy Price: $4,800
2
Summary
“The Global Naval Vessels and Surface Combatants Market 2015–2025” report offers the reader detailed
analysis of the global naval vessels and surface combatants market over the next ten years, alongside
potential market opportunities to enter the industry, using detailed market size forecasts.
The global naval vessels market is estimated to value US$XX billion in 2015. The market consists of five
categories of naval vessels: aircraft carriers, destroyers, amphibious ships, frigates and corvettes. The value
of the global naval vessels market is expected to increase at a CAGR of XX% during the forecast period, to
reach US$XX billion by 2025.
“The Global Naval Vessels and Surface Combatants Market 2015–2025” provides detailed analysis of the
current industry size and growth expectations from 2015 to 2025, including highlights of key growth
stimulators. It also benchmarks the industry against key global markets and provides a detailed understanding
of emerging opportunities in specific areas.
Key Findings
The global naval vessels and surface combatants market is expected to be worth US$XX billion in 2015 and is
expected increase to US$XX billion by 2025, representing a CAGR of XX% during the forecast period. The
expenditure on naval vessels is expected to be driven by the ongoing global turmoil, internal and external
security threats, fleet replacement programs, modernization strategies and territorial disputes across the
world. Additionally, emerging economies in the Middle East and South Asian regions are witnessing
increasing defense expenditure and are therefore likely to present global naval vessels manufacturers with
greater opportunities in the coming decade. Cumulatively, the global market is expected to value US$XX
billion during the forecast period.
Key Features and Benefits
The report provides detailed analysis of the Naval Vessels and Surface Combatants market during 2015–
2025, including the factors that influence why countries are investing or cutting expenditure on naval vessels.
It provides detailed expectations of growth rates and projected total expenditure. The report will also provide a
deep qualitative analysis of the global naval vessels market covering sections including demand drivers,
SWOT, industry trends, latest technological developments, among others. The major programs section will
inform the user about programs being undertaken within the global naval vessels and surface combatants
departments in different segments of the market.
The naval vessels and surface combatants market is anticipated to be dominated by North America followed
by Asia Pacific and Europe. The US is the largest spender, with a cumulative expenditure of US$XX billion
over the next decade. Expenditure in the Asia-Pacific region, which occupies XX% of the global market share,
is driven by emerging nations, such as China, India, and Taiwan, among others. Europe occupies XX% of the
global naval vessels market share, and expenditure is driven by the need to upgrade or replace aging fleets in
most nations. In spite of the budgetary restraints faced by a majority of the countries in this region, the
European market is expected to grow at a nominal CAGR of XX% during 2015-2025.
The Global Naval Vessels and Surface Combatants Market 2015–2025 Single Copy Price: $4,800
3
1 Global Naval Vessels and Surface Combatants Market Size and Drivers
1.1 Naval Vessels and Surface Combatants Market Size and Forecast 2015–2025
1.1.1 Global Naval Vessels and Surface Combatants market to show positive growth during the forecast
period
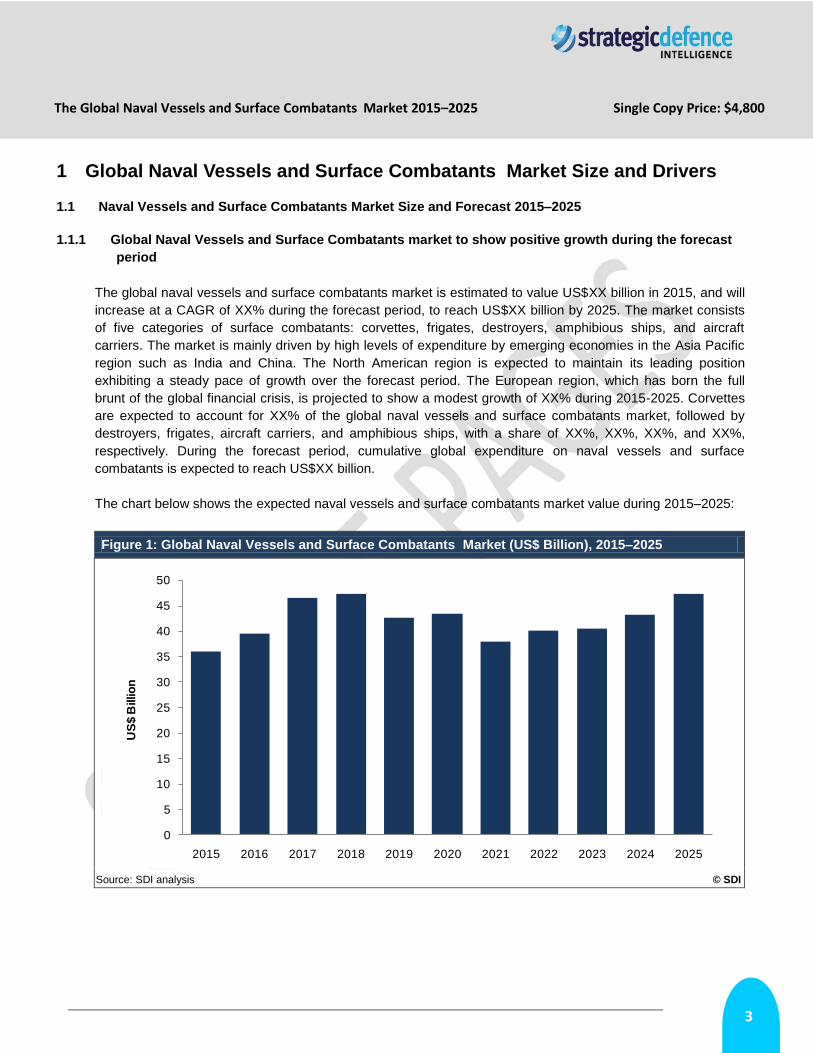
The global naval vessels and surface combatants market is estimated to value US$XX billion in 2015, and will
increase at a CAGR of XX% during the forecast period, to reach US$XX billion by 2025. The market consists
of five categories of surface combatants: corvettes, frigates, destroyers, amphibious ships, and aircraft
carriers. The market is mainly driven by high levels of expenditure by emerging economies in the Asia Pacific
region such as India and China. The North American region is expected to maintain its leading position
exhibiting a steady pace of growth over the forecast period. The European region, which has born the full
brunt of the global financial crisis, is projected to show a modest growth of XX% during 2015-2025. Corvettes
are expected to account for XX% of the global naval vessels and surface combatants market, followed by
destroyers, frigates, aircraft carriers, and amphibious ships, with a share of XX%, XX%, XX%, and XX%,
respectively. During the forecast period, cumulative global expenditure on naval vessels and surface
combatants is expected to reach US$XX billion.
The chart below shows the expected naval vessels and surface combatants market value during 2015–2025:
Figure 1: Global Naval Vessels and Surface Combatants Market (US$ Billion), 2015–2025
Source: SDI analysis © SDI
0
5
10
15
20
25
30
35
40
45
50
2015 2016 2017 2018 2019 2020 2021 2022 2023 2024 2025
US
$ B
illio
n

The Global Naval Vessels and Surface Combatants Market 2015–2025 Single Copy Price: $4,800
4
1.2 Global Naval Vessels and Surface Combatants Market – Regional Analysis
1.2.1 North America dominates the global Naval Vessels and Surface Combatants market
The global naval vessels and surface combatants market is dominated by North America and the US is the
largest defense spender in the world; overall, North America is expected to spend US$XX billion on surface
combatants during the forecast period. Asia-Pacific represents the second-largest market, with the total naval
vessels and surface combatants market valued at US$XX billion, offering a potentially attractive investment
opportunity for western firms. Due to defense budget cuts announced by most countries in the region, Europe
is projected to spend an estimated US$XX billion on naval vessels and surface combatants during the forecast
period, followed by the Middle East, Latin America, and Africa with a cumulative expenditure of US$XX billion.
The table below gives a brief overview of the global naval vessels and surface combatants market:
Table 1: Global Naval Vessels and Surface Combatants Market Overview
Region Market in 2015 Market in 2025 Total Market (2015–2025)
Annualized growth/decline
(2015–2025)
North America
Asia-Pacific
Europe
Middle East
Latin America
Africa
Total Naval Vessels and Surface Combatants Market
Source: SDI analysis © SDI

The Global Naval Vessels and Surface Combatants Market 2015–2025 Single Copy Price: $4,800
5
The following chart shows the regional breakdown of the global naval vessels and surface combatants market:
Figure 2: Naval Vessels and Surface Combatants Market Breakdown by Region (%), 2015–2025
Source: SDI analysis © SDI
0%
10%
20%
30%
40%
50%
60%
70%
80%
90%
100%
2015 2016 2017 2018 2019 2020 2021 2022 2023 2024 2025
North America Asia Pacific Europe Africa Middle East Latin America
The Global Naval Vessels and Surface Combatants Market 2015–2025 Single Copy Price: $4,800
6
2 SWOT Analysis of the Naval Vessels and Surface Combatants Market
Table 2: SWOT Analysis of the Naval Vessels and Surface Combatants market
Source: SDI Analysis © SDI
Strengths
Weaknesses
Opportunities
Threats
The Global Naval Vessels and Surface Combatants Market 2015–2025 Single Copy Price: $4,800
7
3 Country Analysis – Naval Vessels and Surface Combatants Market
3.1 United States Market Size and Forecast 2015–2025
The US’ expenditure on naval vessels is driven hugely by its policy of maintaining global military supremacy,
especially in light of the threat posed by China’s growing military might and a robust military procurement
policy being adopted by a resurgent Russia. Furthermore, the threat posed by the highly volatile military
situation in North Korea is also expected to be a significant catalyst to the country’s growing expenditure in the
sector over the forecast period. The US Navy plans to deploy XX% of its naval fleet in the Pacific Ocean to re-
balance the power in the Eastern parts of the World and aid its allies such as the Philippines and Japan,
against the aggression of China.
To achieve this purpose, the US Navy is required to maintain a fleet of no less than XX operational aircraft
carriers, and at least XX cruisers and destroyers consistently over the long run, as per the John Warner
National Defense Authorization Act-2007. Moreover, the US Navy estimates that it needs a fleet of XX ships of
various types to carry out its missions across the world. However, the country now operates with XX aircraft
carriers due to the decommissioning of the aircraft carrier, CVN-65, in 2012. In addition, two more aircraft
carriers are scheduled for retirement by 2025, and the US Navy would witness a shortfall of XX% in its fleet,
with many destroyers reaching the end of their operational life during the next 15 years. Advertently, the DoD
prepared the latest 30-year shipbuilding plan in 2012, under which the navy will procure warships to replace its
aging naval vessels, in order to maintain a fleet of more than XX ships during the period 2013-2042. The plan
includes the procurement of more than XX ships including Joint High Speed Vessels (JHSVs), amphibious
vessels, landing helicopter docks, aircraft carriers, and destroyers over the next two decades.
Expenditure in the MRO sphere is driven by the US Navy’s implementation of one of the biggest ship
modernization programs in its history in 2009, which entails refitting and upgrade of its Ticonderoga (CG 47)
class cruisers and Arleigh Burke (DDG 51) class destroyers. The total number of ships being considered for
modernization is projected to be XX and the MRO processes are expected to be completed over a period of
more than XX years. These vessels account for almost a third of the entire fleet and are expected to have
complete combat systems installed. These MRO initiatives have arisen from the US DoDs observation that a
number of US regional military commanders are placing requirement formulation requests for Ballistic Missile
Defense (BMD)-capable Aegis ships, and the number of requests for such capabilities is growing faster than
the number of BMD-capable Aegis ships that are currently available. These ships are also undergoing hull,
mechanical, and electrical (HM&E) modernization, and will also be equipped with fully-integrated bridges and
improved machinery control so as to keep them in full operation throughout their projected XX year service
lives. Another factor that is expected to boost the market for US naval vessel MRO is that the US Navy is also
expected to extend the service lives of its LSD 41, LSD 49, and LHD 1 class amphibious ships over the next
XX years. US spending on naval MRO activities are expected to value US$XX billion in 2015 which is
expected to increase at a CAGR of XX% to reach US$XX billion in 2025.
Major programs of the US ship building plan over the period 2015-2025 include the Carrier Replacement
program, procuring XX aircraft carriers at an estimated cost of US$XX billion; development of Littoral Combat
Ships (LCS), at an approximate cost of US$XX billion; and the development of the Arleigh Burke (DDG-51)
and Zumwalt (DDG-1000 series) destroyers, at a combined projected value of US$XX billion over the next ten
years. The US market, valued at US$XX billion in 2015, is projected to grow at a CAGR of XX% over the
forecast period, to reach US$XX billion by 2025.
The Global Naval Vessels and Surface Combatants Market 2015–2025 Single Copy Price: $4,800
8
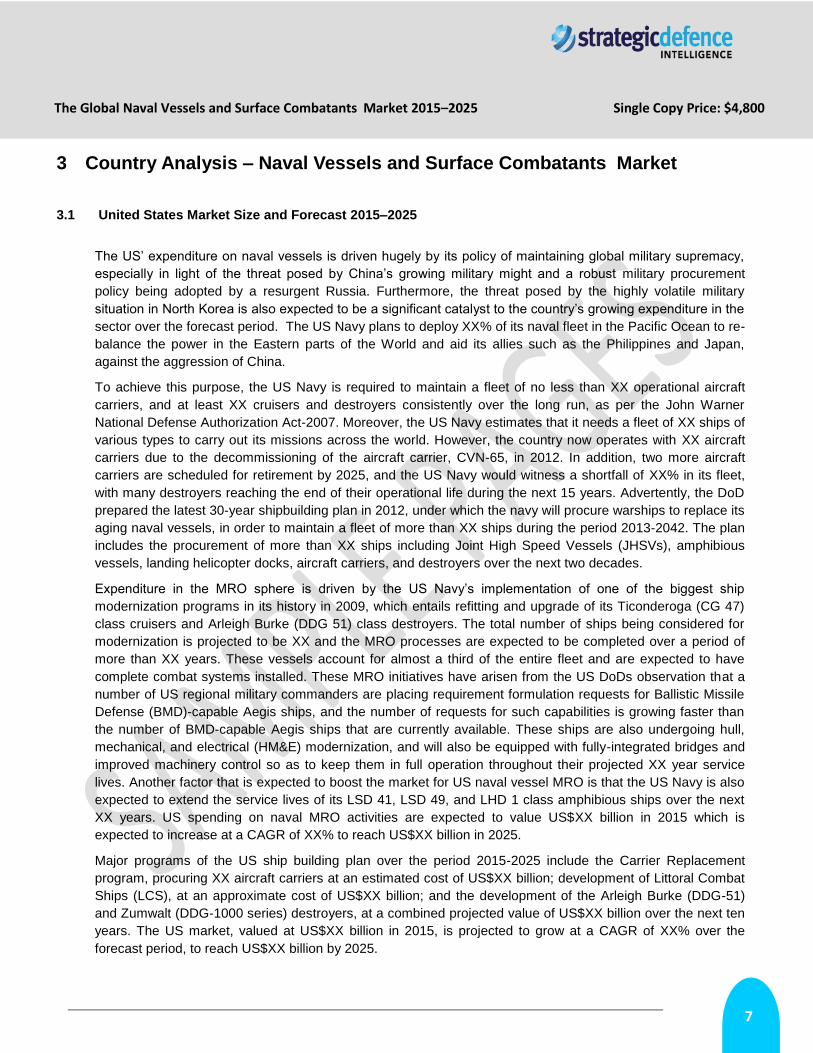
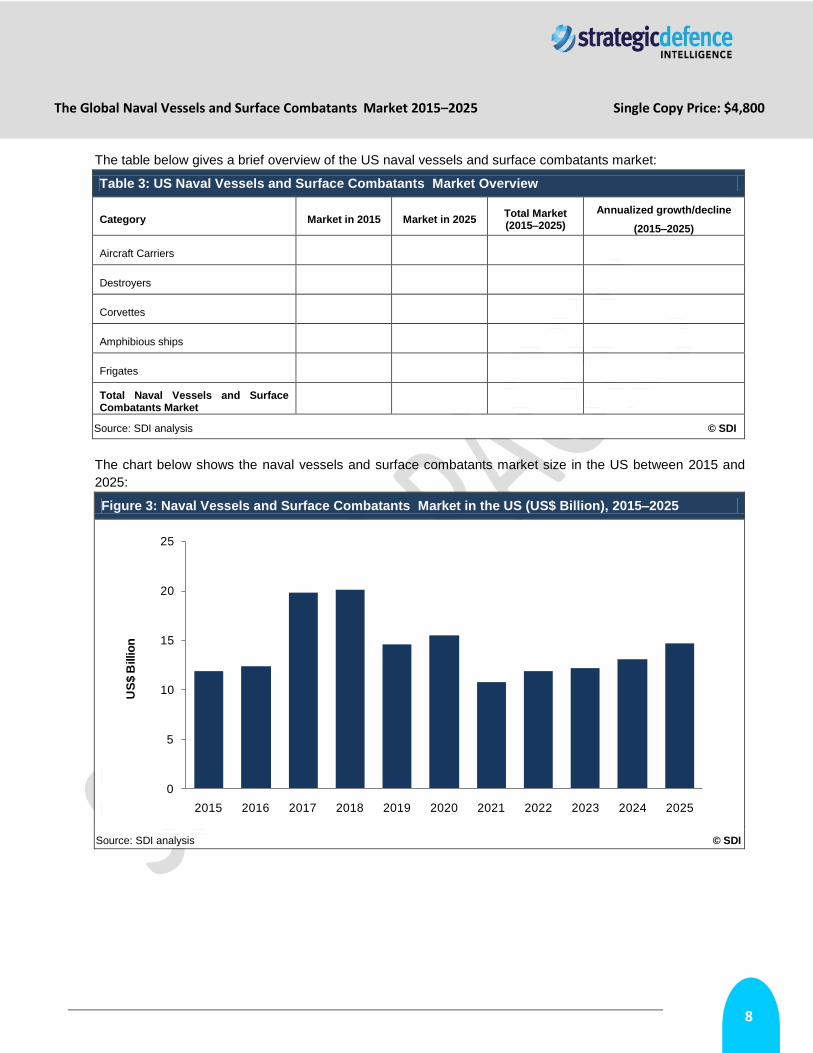
The table below gives a brief overview of the US naval vessels and surface combatants market:
Table 3: US Naval Vessels and Surface Combatants Market Overview
Category Market in 2015 Market in 2025 Total Market (2015–2025)
Annualized growth/decline
(2015–2025)
Aircraft Carriers
Destroyers
Corvettes
Amphibious ships
Frigates
Total Naval Vessels and Surface Combatants Market
Source: SDI analysis © SDI
The chart below shows the naval vessels and surface combatants market size in the US between 2015 and
2025:
Figure 3: Naval Vessels and Surface Combatants Market in the US (US$ Billion), 2015–2025
Source: SDI analysis © SDI
0
5
10
15
20
25
2015 2016 2017 2018 2019 2020 2021 2022 2023 2024 2025
US
$ B
illio
n
The Global Naval Vessels and Surface Combatants Market 2015–2025 Single Copy Price: $4,800
9
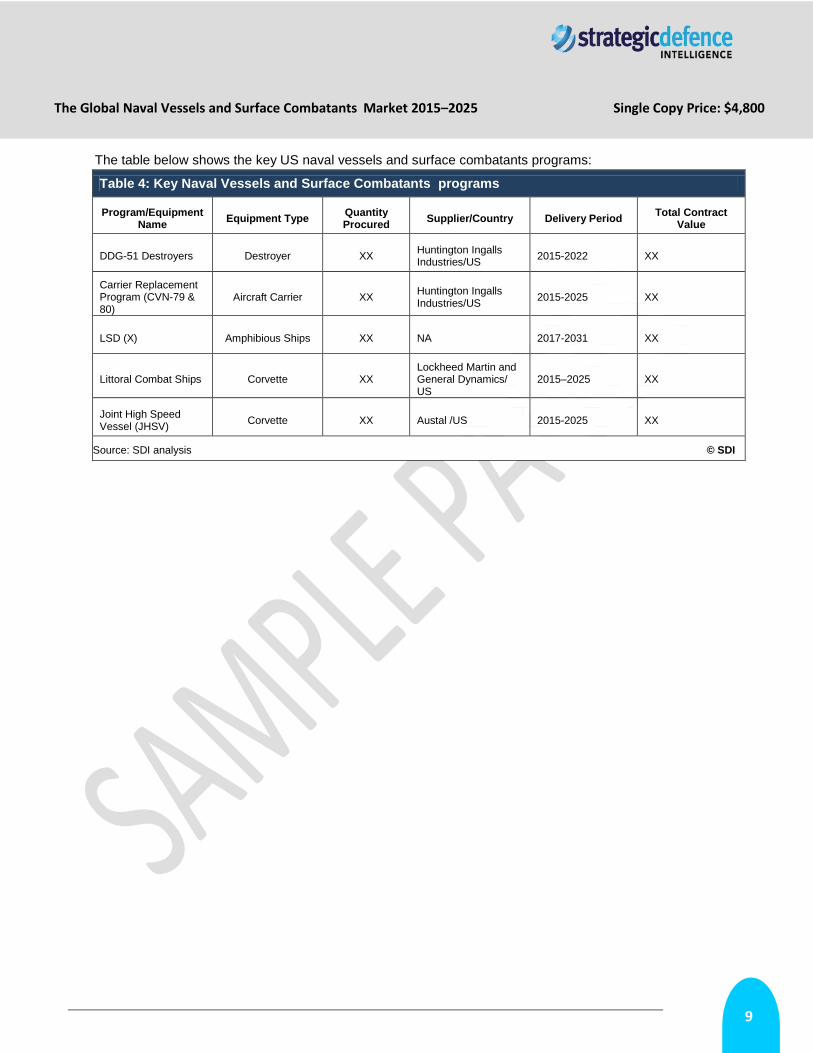
The table below shows the key US naval vessels and surface combatants programs:
Table 4: Key Naval Vessels and Surface Combatants programs
Program/Equipment Name
Equipment Type Quantity Procured
Supplier/Country Delivery Period Total Contract
Value
DDG-51 Destroyers Destroyer XX Huntington Ingalls Industries/US
2015-2022 XX
Carrier Replacement Program (CVN-79 & 80)
Aircraft Carrier XX Huntington Ingalls Industries/US
2015-2025 XX
LSD (X) Amphibious Ships XX NA 2017-2031 XX
Littoral Combat Ships Corvette XX Lockheed Martin and General Dynamics/ US
2015–2025 XX
Joint High Speed Vessel (JHSV)
Corvette XX Austal /US 2015-2025 XX
Source: SDI analysis © SDI

The Global Naval Vessels and Surface Combatants Market 2015–2025 Single Copy Price: $4,800
10
The following chart shows the category break–up of the naval vessels market in the US from 2015–2025:
Figure 4: Naval Vessels and Surface Combatants Market Split By Category in the US (%), 2015–2025
Source: SDI analysis © SDI
0%
10%
20%
30%
40%
50%
60%
70%
80%
90%
100%
2015 2016 2017 2018 2019 2020 2021 2022 2023 2024 2025
Aircraft Carriers Amphibious Ships Corvettes Destroyers Frigates

The Global Naval Vessels and Surface Combatants Market 2015–2025 Single Copy Price: $4,800
11
Report Methodology
Strategic Defense Intelligence (SDI) dedicated research and analysis teams consist of experienced
professionals with a background in industry research and consulting in the defense sector. The market size is
derived by consolidating ongoing procurement programs, modernization initiatives, and future procurement
plans, utilizing information gathered through primary and secondary sources. Forecasting is conducted based
on the lifetime of current inventory levels, suitability/need of the weapon category for a specific country, budget
availability, and opinion of leading industry experts. The following research methodology is followed for all
databases and reports.
Secondary Research
The research process begins with exhaustive secondary research to source reliable qualitative and
quantitative information related to the Naval Vessels and Surface Combatants market. The secondary
research sources that are typically referred to include, but are not limited to:
Globally renowned think tanks
Industry associations
National government documents and statistical databases
Company websites, annual reports, financial reports, broker reports, and investor presentations
Industry trade journals and other literature
Internal and external proprietary databases
News articles, press releases, and webcasts specific to the companies operating in the market
Primary Research
SDI conducts hundreds of primary interviews a year with industry participants and commentators in order to
validate its data and analysis. A typical research interview fulfils the following functions:
Provides first-hand information on market size, market trends, growth trends, competitive landscape,
and future outlook.
Helps to validate and strengthen secondary research findings.
Further develops the analyses team’s expertise and market understanding.
The participants who typically take part in such a process include, but are not limited to:
Industry participants: CEOs, VPs, business development managers, market intelligence managers,
and national sales managers.
External experts: investment bankers, valuation experts, research analysts, and key opinion leaders
specializing in defense markets.
The Global Naval Vessels and Surface Combatants Market 2015–2025 Single Copy Price: $4,800
12
Conventions
Currency conversions are performed on the basis of average annual conversion rate format
calculations.
All the values in tables, with the exception of compounded annual growth rate (CAGR) and
compounded annual rate of change (CARC) are displayed to one decimal place. Growth rates may,
therefore, appear inconsistent with absolute values due to this rounding method.
Related Reports
The Global Military Radar Market 2014-2024
The Global Missiles and Missile Defense Systems Market 2014-2024
The Global Electronic Warfare (EW) Market 2014-2024
The Global Cybersecurity Market 2014-2024
The Global Naval Vessels and Surface Combatants Market 2015–2025 Single Copy Price: $4,800
13
TABLE OF CONTENTS
1 Introduction ......................................................................................................................... 14
1.1 What is this Report About? ............................................................................................................. 14
1.2 Definitions ...................................................................................................................................... 14
1.3 Summary Methodology ................................................................................................................... 16
1.4 About Strategic Defence Intelligence .............................................................................................. 17
2 Executive Summary ............................................................................................................ 18
3 Global Naval Vessels and Surface Combatants Market Size and Drivers ...................... 20
3.1 Naval Surface Combatants Market Size and Forecast 2015–2025 ................................................. 20
3.1.1 Global naval surface combatants market expected to witness a marginal increase ................................20
3.2 Global Naval Vessels and Surface Combatants Market – Regional Analysis .................................. 21
3.2.1 North America is expected to lead the global naval vessels and surface combatants market .................21
3.2.2 US spending on naval fleet replacement to aid the global naval vessels and surface combatants market
during the forecast period ......................................................................................................................................23
3.2.3 Naval vessels and surface combatant market expected to grow at a CAGR of XX% in the Asia-Pacific
region ...................................................................................................................................................................25
3.2.4 European naval vessels market to register a decline owing to defense budget cuts ...............................27
3.2.5 Naval force modernization and safety of sea routes to drive demand in Middle East ..............................29
3.2.6 Latin America to be the fastest growing market for the Naval Surface combatants over the forecast period
...................................................................................................................................................................31
3.2.7 African naval vessels market to register a marginal increase over the forecast period ............................32
3.3 Naval Vessels and Surface Combatants Sub–Sector Market Size Composition ............................. 34
3.3.1 Corvettes and destroyers to account for XX% of the market during the forecast period ..........................34
3.3.2 Corvettes to account for highest share of the market ...............................................................................36
3.3.3 Destroyers market to experience marginal growth ...................................................................................38
3.3.4 Frigates market to witness a marginal increase during the forecast period ..............................................40
3.3.5 Aircraft carrier market to grow at a CAGR of XX% ...................................................................................42
3.3.6 Market for amphibious ships to register a CAGR of XX% .........................................................................44
3.4 Demand Drivers and Growth Stimulators ........................................................................................ 46
3.4.1 Maritime security threats to drive investment on naval vessels ................................................................46
3.4.2 Regional tensions, conflicting territorial claims and peacekeeping operations to fuel global demand .....46
3.4.3 Naval force modernization to drive demand for naval vessels over the forecast period ..........................47
3.5 Defense Budget Spending Review ................................................................................................. 48
3.5.1 North American defense expenditure projected to increase marginally during the forecast period .........48
3.5.2 Asian defense budgets expected to increase at a robust pace ................................................................49
3.5.3 European capital expenditure expected to increase during the forecast period .......................................50
3.5.4 Defense budgets of Middle Eastern countries likely to increase during the forecast period ....................51
The Global Naval Vessels and Surface Combatants Market 2015–2025 Single Copy Price: $4,800
14
3.5.5 Modernization programs likely to drive defense expenditure in South American countries .....................52
3.5.6 Military budgets of African countries expected to increase during the forecast period .............................53
3.6 Defense Modernization Review ...................................................................................................... 54
3.6.1 Financial constraints causing delays in European defense modernization programs ..............................54
3.6.2 Defense budgets of Asian countries likely to be driven by competitive arms acquisitions .......................54
3.6.3 Need to replace aging equipment driving South American defense expenditure .....................................55
3.6.4 Security threats increasing the defense budget of African countries ........................................................55
3.6.5 Middle Eastern countries maintain sustained expenditure on the naval vessels domain .........................55
4 Industry Trends, Recent Developments, and Challenges ................................................ 57
4.1 Technological Developments .......................................................................................................... 57
4.1.1 US Navy introduces technology to convert seawater into fuel ..................................................................57
4.1.2 Size and capability of naval surface combatants driving demand for hybrid electric propulsion systems 57
4.1.3 Increased use of stealth technology expected in naval warships .............................................................58
4.1.4 Mobile deck handlers facilitating efficient helicopter landing on small surface ships ...............................58
4.2 Market Trends ................................................................................................................................ 59
4.2.1 Nations prefer multi-role naval vessels to cater for needs other than war ................................................59
4.2.2 Small combatant vessels are likely to attract more investment ................................................................59
4.2.3 Surface combatants capable of littoral waters operations to drive demand .............................................59
4.2.4 Countries looking to install ballistic missile defense capabilities in their naval warships ..........................60
4.2.5 Navies outsourcing MRO work to decrease response time ......................................................................60
4.3 Industry Consolidation .................................................................................................................... 61
4.3.1 Joint ventures for R&D and manufacturing expected to increase during the forecast period ...................61
4.3.2 Foreign companies acquiring domestic companies to gain entry into attractive markets .........................61
4.3.3 Companies focus on military shipbuilding while selling off non-core civil activities ..................................62
4.4 Key Challenges .............................................................................................................................. 63
4.4.1 Economic slowdown and defense budget cuts to impact the naval surface combatants market .............63
4.4.2 Focus on multi-mission capability and program delays to cause cost overruns .......................................63
4.4.3 Controlling upgrade costs for C4ISR systems ..........................................................................................63
4.4.4 Lack of skilled workforce may hinder growth for manufacturers ...............................................................64
5 SWOT Analysis of the Naval vessels and Surface Combatants Market ......................... 65
5.1 Strengths ........................................................................................................................................ 66
5.1.1 Growth in Asia Pacific to boost overall global market ...............................................................................66
5.1.2 The increased global focus on naval modernization to result in a robust market .....................................66
5.1.3 Upgrade and MRO programs for existing vessels to result in overall market growth ...............................67
5.1.4 Modularization of surface combatants enabling ships to assume multiple roles ......................................67
5.2 Weaknesses ................................................................................................................................... 68
5.2.1 High costs of surface combatants negatively impacting demand .............................................................68
The Global Naval Vessels and Surface Combatants Market 2015–2025 Single Copy Price: $4,800
15
5.2.2 Limited ability of surface combatants to counter rising asymmetric threats ..............................................68
5.2.3 Cost and resource limitation leads to extended MRO cycle times ............................................................69
5.3 Opportunities .................................................................................................................................. 70
5.3.1 Aging fleets of naval vessels to present new procurement and upgrade opportunities ............................70
5.3.2 Mine counter measure vehicles to present new opportunities ..................................................................70
5.3.3 Growing submarine fleets creating demand for ships capable of anti-submarine warfare .......................71
5.4 Threats ........................................................................................................................................... 72
5.4.1 Global economic crisis to impact demand for naval vessels .....................................................................72
5.4.2 Mid-life upgrades and modernization resulting in lower demand for new surface combatants ................72
6 Country Analysis – Naval vessels and Surface Combatants .......................................... 73
6.1 United States Market Size and Forecast 2015-2025 ....................................................................... 73
6.1.1 US expenditure on aircraft carriers to account for the largest share of spending in the domain ..............77
6.1.2 Destroyers to account for the second largest share of expenditure during the forecast period ...............79
6.1.3 Spending on Corvettes to account for the third largest segment in the US ..............................................81
6.2 Russia Market Size and Forecast 2015-2025 ................................................................................. 83
6.2.1 Frigates to lead the Russian naval vessels and surface combatants market ...........................................86
6.2.2 Corvettes expected to be the second largest spend category in Russia ..................................................87
6.2.3 The aircraft carrier market to post a CAGR of XX% over the forecast period ..........................................88
6.3 UK Market Size and Forecast 2015-2025 ....................................................................................... 89
6.3.1 Aircraft carriers expected to account for the largest spending in the UK during the forecast period ........93
6.3.2 Frigates projected to grow at a CAGR of XX% over the forecast period ..................................................94
6.3.3 Amphibious ships to account for the third largest share of expenditure ...................................................95
6.4 France Market Size and Forecast 2015-2025 ................................................................................. 96
6.4.1 Frigates to post a CAGR of XX% over the forecast period .....................................................................100
6.4.2 Corvettes to account for the second largest sector during the forecast period .......................................101
6.6 India Market Size and Forecast 2015–2025 ................................................................................. 103
6.6.1 Indian spending on corvettes to grow at a CAGR of XX% over the forecast period ...............................107
6.6.2 Frigates expected to account for the second largest share of the Indian naval surface combatant market .
.................................................................................................................................................................109
6.6.3 Aircraft Carriers expected to account for the third largest share of the Indian naval surface combatant
market .................................................................................................................................................................111
6.7 China Market Size and Forecast 2015-2025 ................................................................................. 112
6.7.1 Destroyers to account for the largest area of expenditure by China on naval surface combatants .......115
6.7.2 Expenditure on amphibious ships expected to grow at a CAGR of XX% over the forecast period ........117
6.7.3 Corvettes expected to emerge as the third largest market in China .......................................................118
6.8 Australian Market Size and Forecast 2015-2025 .......................................................................... 120
6.8.1 Destroyers account for the largest share of Australian spending on naval surface combatants ............123
6.8.2 Frigates to account for the second largest share of expenditure by Australia during the forecast period125
The Global Naval Vessels and Surface Combatants Market 2015–2025 Single Copy Price: $4,800
16
6.8.3 Corvettes to account for the third largest segment of expenditure on Australian naval surface combatants
.................................................................................................................................................................127
6.9 Saudi Arabia Market Size and Forecast 2015–2025 ..................................................................... 128
6.9.1 Saudi Arabian spending on corvettes to increase at a CAGR of XX% ...................................................130
6.9.2 Frigates to account for the second largest segment of expenditure by Saudi Arabia over the forecast
period .................................................................................................................................................................132
6.9.3 Proposed acquisition of Arleigh Burke class destroyers to drive Saudi Arabian market during the forecast
period .................................................................................................................................................................133
6.10 Israel Market Size and Forecast 2015-2025 ................................................................................. 134
6.10.1 Israeli investment in frigates to grow at a CAGR of XX% over the forecast period ................................136
6.10.2 Corvettes to account for the second largest segment of expenditure .....................................................137
6.11 Brazil Market Size and Forecast 2015-2025 ................................................................................. 138
6.11.1 Aircraft Carriers expected to garner the largest share of expenditure over the forecast period .............142
6.11.2 Corvettes expected to account for the largest area of expenditure during the forecast period ..............143
6.12 Peru Market Size and Forecast 2015-2025 .................................................................................. 145
6.12.1 Expenditure on frigates to be the largest in Peruvian naval vessels market ..........................................147
6.13 South Africa Market Size and Forecast 2015–2025 ...................................................................... 148
6.13.1 Corvettes expected to account for the largest spending in South Africa ................................................151
6.13.2 Amphibious vessels market to account for the second largest share during the forecast period ...........152
6.14 Algeria Market Size and Forecast 2015–2025 .............................................................................. 153
6.14.1 Algeria’s expenditure on frigates expected to account for the largest segment of expenditure .............156
6.14.2 Corvettes to account for second largest share of spending ....................................................................157
7 Major Naval Vessels and Surface Combatants Programs ............................................. 158
7.1 Destroyers .................................................................................................................................... 158
7.1.1 US - DDG-51 Flight III .............................................................................................................................158
7.1.2 Australia - SEA 4000 Air Warfare Destroyer ...........................................................................................159
7.1.3 India - Project 15B destroyer ...................................................................................................................160
7.2 Corvette ........................................................................................................................................ 161
7.2.1 US - Littoral Combat Ship........................................................................................................................161
7.2.2 Russia - Steregushchy-class corvette .....................................................................................................162
7.2.3 India - Project 28 corvettes......................................................................................................................163
7.3 Frigates ........................................................................................................................................ 164
7.3.1 France and Italy - The FREMM European multi-mission frigate .............................................................164
7.3.2 Russia - Admiral Gorshkov-class frigate .................................................................................................165
7.3.3 India - Project 17A ...................................................................................................................................166
7.4 Amphibious Ships ......................................................................................................................... 167
7.4.1 US - San Antonio-class Landing Platform Dock (LPD) ...........................................................................167
7.4.2 US - Mobile landing platform Afloat Forward Staging Base ....................................................................168
The Global Naval Vessels and Surface Combatants Market 2015–2025 Single Copy Price: $4,800
17
7.4.3 India - Landing Platform Dock .................................................................................................................169
7.5 Aircraft Carriers ............................................................................................................................ 170
7.5.1 US –Carrier Replacement Program ........................................................................................................170
7.5.2 UK - Queen Elizabeth-class aircraft carrier .............................................................................................171
7.5.3 India –IAC1 and IAC2 ..............................................................................................................................172
8 Competitive Landscape and Strategic Insights .............................................................. 173
8.1 Competitive Landscape Overview ................................................................................................ 173
8.1.1 Daewoo Shipbuilding & Marine Engineering: overview ..........................................................................175
8.1.2 Daewoo Shipbuilding & Marine Engineering: products and services .....................................................175
8.1.3 Daewoo Shipbuilding & Marine Engineering: alliances ...........................................................................175
8.1.4 Daewoo Shipbuilding & Marine Engineering: recent contract awards ....................................................175
8.1.5 Daewoo Shipbuilding & Marine Engineering: financial analysis .............................................................176
8.1.6 Huntington Ingalls Industries: overview ...................................................................................................178
8.1.7 Huntington Ingalls Industries: products and services ..............................................................................178
8.1.8 Huntington Ingalls Industries: recent contract awards ............................................................................178
8.1.9 Huntington Ingalls Industries: financial analysis .....................................................................................180
8.1.10 Fincantieri: overview ................................................................................................................................182
8.1.11 Fincantieri: products and services ...........................................................................................................182
8.1.12 Fincantieri: alliances ................................................................................................................................182
8.1.13 Fincantieri: recent contract awards .........................................................................................................183
8.1.14 Fincantieri: financial analysis ..................................................................................................................184
8.1.15 BAE Systems: overview ..........................................................................................................................186
8.1.16 BAE Systems: products and services .....................................................................................................186
8.1.17 BAE Systems: alliances ..........................................................................................................................186
8.1.18 BAE Systems: recent contract awards ....................................................................................................186
8.1.19 BAE Systems: financial analysis .............................................................................................................188
8.1.20 Hyundai Heavy Industries: overview .......................................................................................................190
8.1.21 Hyundai Heavy Industries: products and services ..................................................................................190
8.1.22 Hyundai Heavy Industries: recent contract awards .................................................................................190
8.1.23 Hyundai Heavy Industries: financial analysis ..........................................................................................191
8.1.24 PO Sevmash: overview ...........................................................................................................................193
8.1.25 PO Sevmash: products and services ......................................................................................................193
8.1.26 PO Sevmash: recent contract awards .....................................................................................................193
8.1.27 ThyssenKrupp Marine Systems AG: overview ........................................................................................194
8.1.28 ThyssenKrupp Marine Systems AG: products and services ...................................................................194
8.1.29 ThyssenKrupp Marine Systems AG: alliances ........................................................................................195
8.1.30 ThyssenKrupp Marine Systems AG: recent contract awards .................................................................195
8.1.31 Thales: overview .....................................................................................................................................196
The Global Naval Vessels and Surface Combatants Market 2015–2025 Single Copy Price: $4,800
18
8.1.32 Thales: products and services ................................................................................................................196
8.1.33 Thales: alliances ......................................................................................................................................197
8.1.34 Thales: recent contract awards ...............................................................................................................198
8.1.35 Thales: financial analysis ........................................................................................................................199
8.1.36 Lockheed Martin Corp.: overview ............................................................................................................201
8.1.37 Lockheed Martin Corp.: products and services .......................................................................................201
8.1.38 Lockheed Martin Corp.: alliances ............................................................................................................204
8.1.39 Lockheed Martin Corp.: recent contract awards .....................................................................................204
8.1.40 Lockheed Martin Corp.: financial analysis ...............................................................................................205
8.1.41 ASC Pty Ltd.: overview ............................................................................................................................207
8.1.42 ASC Pty Ltd: products and services ........................................................................................................207
8.1.43 ASC Pty Ltd.: alliances ............................................................................................................................207
8.1.44 ASC Pty Ltd.: recent contract awards .....................................................................................................207
8.1.45 ASC Pty Ltd.: financial analysis ..............................................................................................................208
8.1.46 Damen Schelde Naval Shipbuilding (DSNS): overview ..........................................................................210
8.1.47 Damen Schelde Naval Shipbuilding (DSNS): products and services .....................................................210
8.1.48 Damen Schelde Naval Shipbuilding (DSNS): alliances ..........................................................................210
8.1.49 Damen Schelde Naval Shipbuilding (DSNS): recent contract awards ....................................................211
8.1.50 Abu Dhabi Ship Building: overview .........................................................................................................212
8.1.51 Abu Dhabi Ship Building: products and services ....................................................................................212
8.1.52 Abu Dhabi Ship Building: alliances .........................................................................................................212
8.1.53 Abu Dhabi Ship Building: recent contract awards ...................................................................................213
8.1.54 Abu Dhabi Ship Building: financial analysis ............................................................................................214
8.1.55 DCNS: overview ......................................................................................................................................216
8.1.56 DCNS: products and services .................................................................................................................216
8.1.57 DCNS: alliances ......................................................................................................................................216
8.1.58 DCNS: recent contract awards ................................................................................................................217
8.1.59 DCNS: financial analysis .........................................................................................................................218
8.1.60 Navantia: overview ..................................................................................................................................220
8.1.61 Navantia: products and services .............................................................................................................220
8.1.62 Navantia: alliances ..................................................................................................................................220
8.1.63 Navantia: recent contract awards ............................................................................................................221
8.1.64 General Dynamics: overview...................................................................................................................222
8.1.65 General Dynamics: products and services..............................................................................................222
8.1.66 General Dynamics: recent contract awards ............................................................................................222
8.1.67 General Dynamics: financial analysis .....................................................................................................224
8.1.68 Austal: overview ......................................................................................................................................226
8.1.69 Austal: products and services .................................................................................................................226

The Global Naval Vessels and Surface Combatants Market 2015–2025 Single Copy Price: $4,800
19
8.1.70 Austal: alliances ......................................................................................................................................226
8.1.71 Austal: recent contract awards ................................................................................................................227
8.1.72 Austal: financial analysis .........................................................................................................................228
8.1.73 Mazagon Docks Limited: overview ..........................................................................................................230
8.1.74 Mazagon Docks Limited: products and services .....................................................................................230
8.1.75 Mazagon Docks Limited: alliances ..........................................................................................................230
8.1.76 Mazagon Docks Limited: recent contract wins ........................................................................................230
8.1.77 Mazagon Docks Limited: financial analysis .............................................................................................231
9 Appendix ............................................................................................................................ 233
9.1 Methodology ................................................................................................................................. 233
9.2 About SDI ..................................................................................................................................... 233
9.3 Disclaimer .......................................................................................................................... 233
The Global Naval Vessels and Surface Combatants Market 2015–2025 Single Copy Price: $4,800
20
LIST OF FIGURES
Figure 1: Global Naval Vessels and Surface Combatants Market (US$ Billion), 2015–2025 ............................................................................... 20 Figure 2: Naval Vessels and Surface Market Breakdown by Region (%), 2015–2025 ......................................................................................... 22 Figure 3: North American Naval Vessels and Surface Combatants Market (US$ Billion), 2015–2025 ................................................................. 24 Figure 4: Asia-Pacific Naval Vessels and Surface Combatants Market (US$ Billion), 2015–2025 ....................................................................... 26 Figure 5: European Naval Vessels and Surface Combatants Market (US$ Billion), 2015–2025 .......................................................................... 28 Figure 6: Middle East Naval Vessels and Surface Combatants Market (US$ Billion), 2015–2025 ....................................................................... 30 Figure 7: Latin American Naval Vessels and Surface Combatants Market (US$ Billion), 2015-2025 ................................................................... 31 Figure 8: African Naval Vessels and Surface Combatants Market (US$ Million), 2015–2025 .............................................................................. 33 Figure 9: Naval Vessels and Surface Combatants Market Breakdown by Segment (%), 2015–2025 .................................................................. 35 Figure 10: Global Corvettes Market Size (US$ Billion), 2015–2025 .................................................................................................................... 37 Figure 11: Global Destroyers Market Size (US$ Billion), 2015–2025................................................................................................................... 39 Figure 12: Global Frigates Market Size (US$ Billion), 2015–2025 ....................................................................................................................... 41 Figure 13: Global Aircraft Carriers Market Size (US$ Billion), 2015–2025 ........................................................................................................... 43 Figure 14: Global Amphibious ships Market Size (US$ Billion), 2015–2025 ........................................................................................................ 45 Figure 15: Defense Capital Expenditure of Top North American Defense Spenders (US$ Billion), 2015–2025 ................................................... 48 Figure 16: Defense Capital Expenditure of Top Three Asian Defense Spenders (US$ Billion), 2015–2025 ........................................................ 49 Figure 17: Defense Capital Expenditure of Top Three European Defense Spenders (US$ Billion), 2015–2025 .................................................. 50 Figure 18: Defense Capital Expenditure of Top Three Middle Eastern Defense Spenders (US$ Billion), 2015–2025 .......................................... 51 Figure 19: Defense Capital Expenditure of Top Three South American Defense Spenders (US$ Billion), 2015–2025 ........................................ 52 Figure 20: Defense Capital Expenditure of Top Three African Countries (US$ Billion), 2015–2025.................................................................... 53 Figure 21: Naval Vessels and Surface Combatants Market in the US (US$ Billion), 2015–2025 ......................................................................... 74 Figure 22: Naval Vessels and Surface Combatants Market by Category in the US (%), 2015–2025 ................................................................... 76 Figure 23: Aircraft Carriers Market Size in the US (US$ Billion), 2015–2025 ....................................................................................................... 78 Figure 24: Destroyers Market Size in the US (US$ Billion), 2015–2025 .............................................................................................................. 80 Figure 25: Corvettes Market Size in the US (US$ Billion), 2015–2025 ................................................................................................................ 82 Figure 26: Naval Vessels and Surface Combatants Market in the Russia (US$ Billion), 2015–2025 ................................................................... 84 Figure 27: Naval Vessels and Surface Combatants Market By Category in Russia (%), 2015–2025 ................................................................... 85 Figure 28: Frigates Market Size in Russia (US$ Million), 2015–2025 .................................................................................................................. 86 Figure 29: Corvette Market Size in Russia (US$ Million), 2015–2025 ................................................................................................................. 87 Figure 30: Aircraft Carrier Market Size in Russia (US$ Million), 2015–2025 ....................................................................................................... 88 Figure 31: Naval Vessels and Surface Combatants Market in the UK (US$ Billion), 2015–2025 ......................................................................... 90 Figure 32: Naval Vessels and Surface Combatants Market Split by Sector in the UK (%), 2015–2025 ............................................................... 92 Figure 33: Aircraft Carriers Market Size in the UK (US$ Million), 2015–2025 ...................................................................................................... 93 Figure 34: Frigates Market Size in the UK (US$ Million), 2015–2025 .................................................................................................................. 94 Figure 35: Amphibious Ships Market Size in the UK (US$ Million), 2015–2025................................................................................................... 95 Figure 36: Naval Vessels and Surface Combatants Market in France (US$ Billion), 2015–2025 ......................................................................... 97 Figure 37: Naval Vessels and Surface Combatants Market Split by Sector in France (%), 2015–2025 ............................................................... 99 Figure 38: Frigates Market Size in France (US$ Million), 2015–2025 ................................................................................................................ 100 Figure 39: Corvettes Market Size in France (US$ Million), 2015–2025 ............................................................................................................. 102 Figure 40: Naval Vessels and Surface Combatants Market in India (US$ Billion), 2015–2025 .......................................................................... 105 Figure 41: Naval Vessels and Surface Combatants Market Split by Sector in India (%), 2015–2025................................................................. 106 Figure 42: Corvette Market Size in India (US$ Million), 2015–2025 .................................................................................................................. 108 Figure 43: Frigates Market Size in India (US$ Million), 2015–2025 ................................................................................................................... 110 Figure 44: Aircraft Carrier Market Size in India (US$ Million), 2015–2025 ......................................................................................................... 111 Figure 45: Naval Vessels and Surface Combatants Market in China (US$ billion), 2015–2025 ......................................................................... 113 Figure 46: Naval Vessels and Surface Combatants Market Split by Sector in China (%), 2015–2025 ............................................................... 114 Figure 47: Destroyers Market Size in China (US$ Million), 2015–2025 ............................................................................................................. 116 Figure 48: Amphibious Ships Market Size in China (US$ Million), 2015–2025 .................................................................................................. 117 Figure 49: Corvettes Market Size in China (US$ Million), 2015–2025 ............................................................................................................... 119 Figure 50: Naval Vessels and Surface Combatants Market in Australia (US$ Billion), 2015–2025 .................................................................... 121 Figure 51: Naval Vessels and Surface Combatants Market Split by Sector in Australia (%), 2015–2025 .......................................................... 122 Figure 52: Destroyers Market Size in Australia (US$ Million), 2015–2025 ......................................................................................................... 124 Figure 53: Frigates Market Size in Australia (US$ Million), 2015–2025 ............................................................................................................. 126 Figure 54: Corvettes Market Size in Australia (US$ Million), 2015–2025 ........................................................................................................... 127

The Global Naval Vessels and Surface Combatants Market 2015–2025 Single Copy Price: $4,800
21
Figure 55: Naval Vessel and Surface Combatant Market in Saudi Arabia (US$ Billion), 2015–2025 ................................................................. 129 Figure 56: Naval Vessels and Surface Combatants Market by Sector in Saudi Arabia (%), 2015–2025 ............................................................ 129 Figure 57: Corvettes Market Size in Saudi Arabia (US$ Million), 2015–2025 .................................................................................................... 131 Figure 58: Frigates Market Size in Saudi Arabia (US$ Million), 2015–2025 ....................................................................................................... 132 Figure 59: Destroyers Market Size in Saudi Arabia (US$ Million), 2015–2025 .................................................................................................. 133 Figure 60: Naval Vessels and Surface Combatants Market in Israel (US$ Million), 2015–2025 ......................................................................... 135 Figure 61: Naval Vessels and Surface Combatants Market Split by Sector in Israel (%), 2015–2025 ................................................................ 135 Figure 62: Frigate Market Size in Israel (US$ Million), 2015–2025 .................................................................................................................... 136 Figure 63: Corvette Market Size in Israel (US$ Million), 2015–2025.................................................................................................................. 137 Figure 64: Naval Vessels and Surface Combatants Market in Brazil (US$ Billion), 2015–2025 ......................................................................... 139 Figure 65: Naval Vessels and Surface Combatants Market Split By Category in Brazil (%), 2015–2025 ........................................................... 141 Figure 66: Corvettes Market Size in Brazil (US$ Million), 2015–2025 ................................................................................................................ 142 Figure 67: Corvettes Market Size in Brazil (US$ Million), 2015–2025 ................................................................................................................ 144 Figure 68: Naval Vessels and Surface Combatants Market in Peru (US$ Million), 2015–2025 .......................................................................... 146 Figure 69: Frigates Market Size in Peru (US$ Million), 2015–2025 ................................................................................................................... 147 Figure 70: Naval Vessels and Surface Combatants Market in South Africa (US$ Million), 2015–2025 .............................................................. 149 Figure 71: Naval Vessels and Surface Combatants Market Split By Category in South Africa (%), 2015–2025 ................................................ 150 Figure 72: Corvettes Market Size in South Africa (US$ Million), 2015–2025 ..................................................................................................... 151 Figure 73: Amphibious Ships Market Size in South Africa (US$ Million), 2015–2025 ........................................................................................ 152 Figure 74: Naval Vessels and Surface Combatants Market in Algeria (US$ Million), 2015–2025 ...................................................................... 154 Figure 75: Frigates Market Size in Algeria (US$ Million), 2015–2025 ................................................................................................................ 156 Figure 76: Corvettes Market Size in Algeria (US$ Million), 2015–2025 ............................................................................................................. 157 Figure 77: Daewoo Shipbuilding & Marine Engineering – Revenue Trend Analysis (US$ Million), FY2010–2014 ............................................. 176 Figure 78: Daewoo Shipbuilding & Marine Engineering – Operating Profit (US$ Million), FY2010–2014 ........................................................... 177 Figure 79: Daewoo Shipbuilding & Marine Engineering – Net Profit Trend Analysis (US$ Million), FY2010–2014 ............................................. 177 Figure 80: Huntington Ingalls Industries – Revenue Trend Analysis (US$ Billion), FY2010–2014 ..................................................................... 180 Figure 81: Huntington Ingalls Industries – Operating Profit (US$ Million), FY2010–2014 .................................................................................. 181 Figure 82: Huntington Ingalls Industries – Net Profit Trend Analysis (US$ Million), FY2010–2014 .................................................................... 181 Figure 83: Fincantieri – Revenue Trend Analysis (US$ Billion), FY2012–2014 ................................................................................................. 184 Figure 84: Fincantieri – EBITDA (US$ Million), FY2012–2014 .......................................................................................................................... 185 Figure 85: Fincantieri – Net Profit Trend Analysis (US$ Million), FY2012–2014 ................................................................................................ 185 Figure 86: BAE Systems – Revenue Trend Analysis (GBP Billion), FY2010–2014 ........................................................................................... 188 Figure 87: BAE Systems – Operating Profit Trend Analysis (GBP Billion), FY2010–2014 ................................................................................. 189 Figure 88: BAE Systems – Net Profit Trend Analysis (GBP Billion) FY2010–2014 ............................................................................................ 189 Figure 89: Hyundai Heavy Industries – Revenue Trend Analysis (US$ Billion), FY2010–2014.......................................................................... 191 Figure 90: Hyundai Heavy Industries – Operating Profit Trend Analysis (US$ Million), FY2010-2014 ............................................................... 192 Figure 91: Hyundai Heavy Industries – Net Profit Trend Analysis (US$ Million), FY2010-2014 ......................................................................... 192 Figure 92: Thales – Revenue Trend Analysis (EURO Billion), FY2010–2014 .................................................................................................... 199 Figure 93: Thales – Thales – Operating Profit Trend Analysis (EURO Billion), FY2010–2014 ........................................................................... 200 Figure 94: Thales – Net Profit Trend Analysis (EURO Million), FY2010–2014................................................................................................... 200 Figure 95: Lockheed Martin Corp. – Revenue Trend Analysis (US$ Billion), FY2010–2014 .............................................................................. 205 Figure 96: Lockheed Martin Corp. – Operating Profit Trend Analysis (US$ Billion), FY2010–2014 ................................................................... 206 Figure 97: Lockheed Martin Corp. – Net Profit Trend Analysis (US$ Billion), FY2010–2014 ............................................................................. 206 Figure 97: ASC Pty Ltd. – Revenue Trend Analysis (AUD Million), FY2009–2013 ............................................................................................ 208 Figure 99: ASC Pty Ltd. – Operating Profit (AUD Million), FY2009–2013 .......................................................................................................... 209 Figure 100: ASC Pty Ltd. – Net Profit Trend Analysis (AUD Million), FY2009–2013 .......................................................................................... 209 Figure 101: Abu Dhabi Ship Building – Revenue Trend Analysis (AED Million), FY2010–2014 ......................................................................... 214 Figure 102: Abu Dhabi Ship Building – Operating Profit (AED Million), FY2010–2014 ...................................................................................... 215 Figure 103: Abu Dhabi Ship Building – Net Profit Trend Analysis (AED Million), FY2010–2014 ........................................................................ 215 Figure 104: DCNS – Revenue Trend Analysis (EUR Billion), FY2010–2014 ..................................................................................................... 218 Figure 105: DCNS – Operating Profit (EUR Million), FY2010–2014 .................................................................................................................. 219 Figure 106: DCNS – Net Profit Trend Analysis (EUR Million), FY2010–2014 .................................................................................................... 219 Figure 107: General Dynamics – Revenue Trend Analysis (US$ Million), FY2010–2014 .................................................................................. 224 Figure 108: General Dynamics – Operating Profit (US$ Million), FY2010–2014 ................................................................................................ 225 Figure 109: General Dynamics – Net Profit Trend Analysis (US$ Million), FY2010–2014 .................................................................................. 225 Figure 110: Austal – Revenue Trend Analysis (AUD Million), FY2010–2014 ..................................................................................................... 228 Figure 111: Austal – Operating Profit Trend Analysis (AUD Million), FY2010–2014 .......................................................................................... 229 Figure 112: Austal – Net Profit Trend Analysis (AUD Million), FY2010–2014 .................................................................................................... 229 Figure 113: Mazagon Docks Limited – Revenue Trend Analysis (INR Crores), FY2009–2013 .......................................................................... 231

The Global Naval Vessels and Surface Combatants Market 2015–2025 Single Copy Price: $4,800
22
Figure 114: : Mazagon Docks Limited – Profit Before Tax (INR Crores), FY2009–2013 .................................................................................... 232 Figure 115: : Mazagon Docks Limited – Net Profit Trend Analysis (INR Crores), FY2009–2013 ....................................................................... 232
The Global Naval Vessels and Surface Combatants Market 2015–2025 Single Copy Price: $4,800
23
LIST OF TABLES
Table 1: Global Naval Vessels and Surface Combatants Market Overview ......................................................................................................... 20 Table 2: Global Naval Vessels and Surface Combatants Market Overview ......................................................................................................... 33 Table 3: SWOT Analysis of the Naval vessels and Surface Combatants Market ................................................................................................. 64 Table 4: Current and Forecast Number of Submarines in Countries in the Asia-Pacific Region .......................................................................... 70 Table 5: US Naval Vessels and Surface Combatants Market Overview .............................................................................................................. 73 Table 6: Key US Naval Vessel and Surface Combatants Programs .................................................................................................................... 74 Table 7: Russian Naval Vessels and Surface Combatants Market Overview ...................................................................................................... 83 Table 8: Key Russian Naval Vessel and Surface Combatant Programs .............................................................................................................. 84 Table 9: UK Naval Vessels and Surface Combatants Market Overview .............................................................................................................. 89 Table 10: Major UK Naval Vessel and Surface Combatant Programs ................................................................................................................. 90 Table 11: French Naval Vessels and Surface Combatants Market Overview ...................................................................................................... 96 Table 12: Major French Naval Vessel and Surface Combatant Programs ........................................................................................................... 97 Table 13: Indian Naval Vessels and Surface Combatants Market Overview ..................................................................................................... 103 Table 14: Major Indian Naval Vessels and Surface Combatants Programs ....................................................................................................... 104 Table 15: Chinese Naval Vessels and Surface Combatants Market Overview .................................................................................................. 112 Table 16: Major Chinese Naval Vessels and Surface Combatants Programs.................................................................................................... 113 Table 17: Australian Naval Vessels and Surface Combatants Market Overview ............................................................................................... 120 Table 18: Major Australian Naval Vessels and Surface Combatants Programs ................................................................................................. 121 Table 19: Saudi Arabian Naval Vessel and Surface Combatants Market Overview ........................................................................................... 127 Table 20: Israeli Naval Vessels and Surface Combatants Market Overview ...................................................................................................... 133 Table 21: Brazilian Naval Vessels and Surface Combatants Market Overview.................................................................................................. 138 Table 22: Key Brazilian Naval Vessels and Surface Combatants Programs ...................................................................................................... 139 Table 23: Peruvian Naval Vessels and Surface Combatants Overview ............................................................................................................. 144 Table 24: Key Peruvian Naval Vessels and Surface Combatants Programs ..................................................................................................... 145 Table 25: South African Naval Vessels and Surface Combatants Market Overview .......................................................................................... 148 Table 26: Key South African Naval Vessels and Surface Combatants Programs .............................................................................................. 149 Table 27: Algerian Naval Vessels and Surface Combatants Market Overview .................................................................................................. 153 Table 28: Key Algerian Naval Vessels and Surface Combatants Programs ...................................................................................................... 154 Table 29: Program Details – DDG-51 Flight III .................................................................................................................................................. 157 Table 30: Program Details –SEA 4000 Air Warfare Destroyer........................................................................................................................... 158 Table 31: Program Details – K2 Black Panther ................................................................................................................................................. 159 Table 32: Program Details – Littoral Combat Ships ........................................................................................................................................... 160 Table 33: Program Details –Steregushchy-class Corvettes ............................................................................................................................... 161 Table 34: Program Details – Project 28 ............................................................................................................................................................ 162 Table 35: Program Details – FREMM Frigates .................................................................................................................................................. 163 Table 36: Program Details – Admiral Gorshkov-class Frigates.......................................................................................................................... 164 Table 37: Program Details – LPD-17A .............................................................................................................................................................. 165 Table 38: Program Details – San Antonio-class LPD ........................................................................................................................................ 166 Table 39: Program Details – Mobile Landing Platform ...................................................................................................................................... 167 Table 40: Program Details – LPD ..................................................................................................................................................................... 168 Table 41: Program Details –Carrier Replacement Program .............................................................................................................................. 169 Table 42: Program Details – Queen Elizabeth-Class aircraft carrier .................................................................................................................. 170 Table 43: Program Details – IAC1 and IAC2 ..................................................................................................................................................... 171 Table 44: Key Naval Vessel and Surface Combatant Manufacturers and Capabilities ...................................................................................... 173 Table 45: Daewoo: Alliances ............................................................................................................................................................................ 174 Table 46:Daewoo Shipbuilding & Marine Engineering: Recent Contract Awards ............................................................................................... 174 Table 47:Huntington Ingalls Industries: Recent Contract Awards ...................................................................................................................... 177 Table 48: Fincantieri: Alliances ......................................................................................................................................................................... 181 Table 49:Fincantieri: Recent Contract Awards .................................................................................................................................................. 182 Table 50:BAE Systems: Alliances ..................................................................................................................................................................... 185 Table 51:BAE Systems: Recent Contract Awards ............................................................................................................................................. 185 Table 52:Hyundai heavy Industries: Recent Contract Awards ........................................................................................................................... 189 Table 53:PO Sevmash: Recent Contract Awards .............................................................................................................................................. 192 Table 54: ThyssenKrupp Marine Systems AG: Alliances .................................................................................................................................. 194 Table 55: ThyssenKrupp Marine Systems AG: Recent Contract Awards........................................................................................................... 194 Table 56: Thales: Alliances ............................................................................................................................................................................... 196
The Global Naval Vessels and Surface Combatants Market 2015–2025 Single Copy Price: $4,800
24
Table 57: Thales: Recent Contract Awards ....................................................................................................................................................... 197 Table 58: Lockheed Martin Corp.: Alliances ...................................................................................................................................................... 203 Table 59: Lockheed Martin Corp: Recent Contract Awards ............................................................................................................................... 203 Table 60: ASC Pty Ltd.: Alliances ..................................................................................................................................................................... 206 Table 61: ASC Pty Ltd.: Recent Contract Awards ............................................................................................................................................. 206 Table 62: Damen Schelde Naval Shipbuilding (DSNS): Alliances ..................................................................................................................... 209 Table 63: Damen Schelde Naval Shipbuilding (DSNS): Recent Contract Awards ............................................................................................. 210 Table 64: Abu Dhabi Ship Building: Alliances ................................................................................................................................................... 211 Table 65: Abu Dhabi Ship Building: Recent Contract Awards ........................................................................................................................... 212 Table 66: DCNS: Alliances ............................................................................................................................................................................... 215 Table 67: DCNS: Recent Contract Awards ....................................................................................................................................................... 216 Table 68: Navantia: Alliances ........................................................................................................................................................................... 219 Table 69: Navantia: Recent Contract Awards ................................................................................................................................................... 220 Table 70: General Dynamics: Recent Contract Awards .................................................................................................................................... 221 Table 71: Austal: Alliances................................................................................................................................................................................ 225 Table 72: Austal: Recent Contract Awards ........................................................................................................................................................ 226 Table 73: Mazagon Docks Limited: Alliances .................................................................................................................................................... 229 Table 74: Mazagon Docks Limited: Recent Contract Wins ................................................................................................................................ 229