the global economic environment policy challenges per... · 2016-11-26 · the global economic...
TRANSCRIPT
Odd Per Brekk
Director
IMF Regional Office for Asia and the Pacific
June 3, 2015
The Global Economic Environment
Policy Challenges

Global Economic Outlook
Global Economy: Moderate and uneven growth,
with low inflation
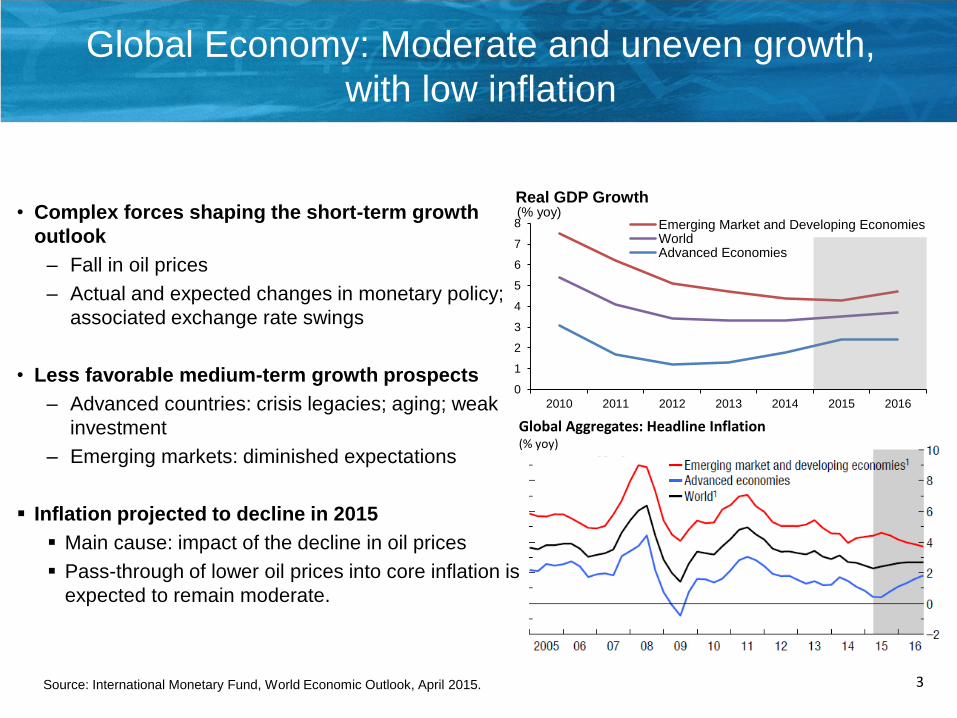
• Complex forces shaping the short-term growth
outlook
– Fall in oil prices
– Actual and expected changes in monetary policy;
associated exchange rate swings
• Less favorable medium-term growth prospects
– Advanced countries: crisis legacies; aging; weak
investment
– Emerging markets: diminished expectations
Inflation projected to decline in 2015
Main cause: impact of the decline in oil prices
Pass-through of lower oil prices into core inflation is
expected to remain moderate.
3Source: International Monetary Fund, World Economic Outlook, April 2015.
Global Aggregates: Headline Inflation(% yoy)
0
1
2
3
4
5
6
7
8
2010 2011 2012 2013 2014 2015 2016
(% yoy)Real GDP Growth
Emerging Market and Developing EconomiesWorldAdvanced Economies
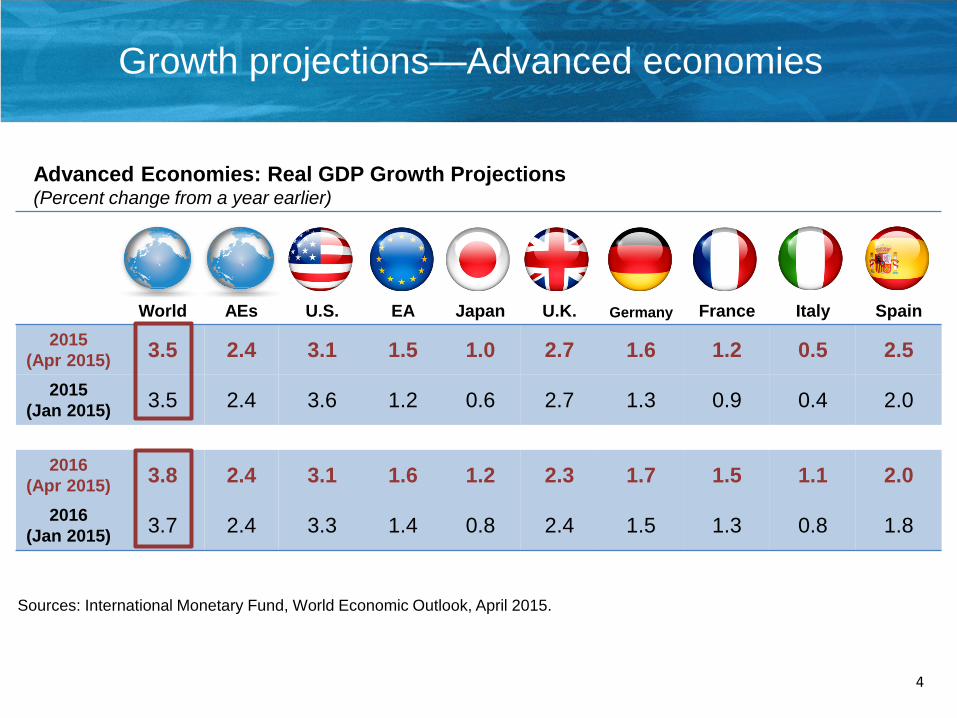
Growth projections—Advanced economies
4
World AEs U.S. EA Japan U.K. Germany France Italy Spain
2015
(Apr 2015)3.5 2.4 3.1 1.5 1.0 2.7 1.6 1.2 0.5 2.5
2015
(Jan 2015)3.5 2.4 3.6 1.2 0.6 2.7 1.3 0.9 0.4 2.0
2016
(Apr 2015)3.8 2.4 3.1 1.6 1.2 2.3 1.7 1.5 1.1 2.0
2016
(Jan 2015)3.7 2.4 3.3 1.4 0.8 2.4 1.5 1.3 0.8 1.8
Advanced Economies: Real GDP Growth Projections (Percent change from a year earlier)
Sources: International Monetary Fund, World Economic Outlook, April 2015.

5
EMDEs China India Russia LAC Brazil Mexico LIDCs
2015
(Apr 2015)4.3 6.8 7.5 -3.8 0.9 -1.0 3.0 5.5
2015
(Jan 2015)4.3 6.8 6.3 -3.0 1.3 0.3 3.2 5.9
2016
(Apr 2015)4.7 6.3 7.5 -1.1 2.0 1.0 3.3 6.0
2016
(Jan 2015)4.7 6.3 6.5 -1.0 2.3 1.5 3.5 6.1
Emerging Market and Developing Economies: Real GDP Growth Projections (Percent change from a year earlier)
Sources: International Monetary Fund, World Economic Outlook, April 2015.
Growth projections—Emerging market
and developing economies
0
40
80
120
160
200
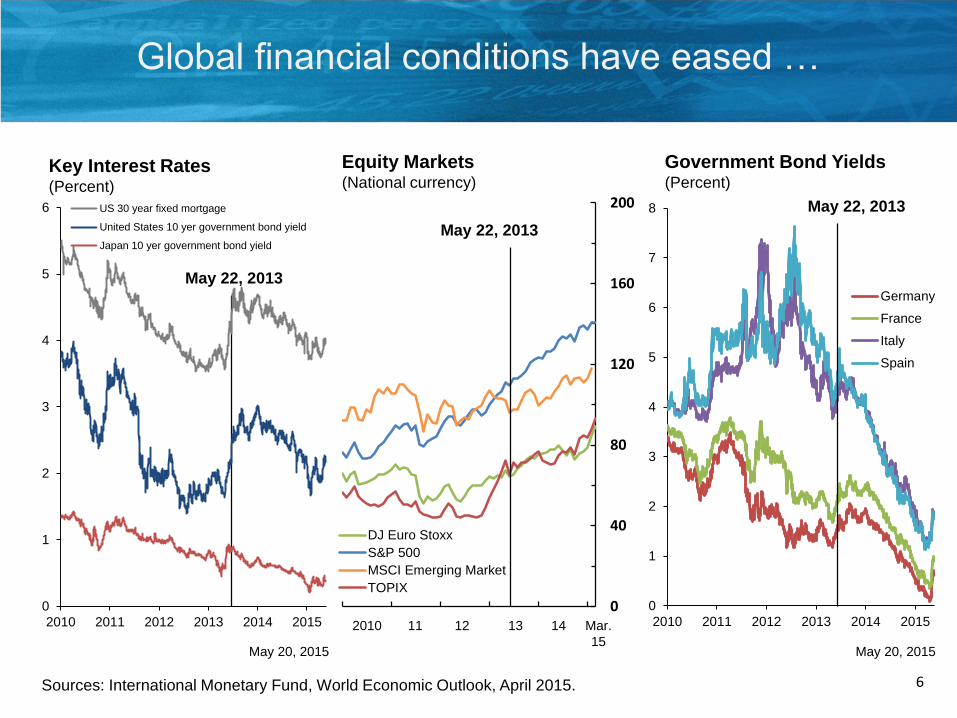
DJ Euro Stoxx
S&P 500
MSCI Emerging Market
TOPIX
Equity Markets(National currency)
Key Interest Rates(Percent)
Government Bond Yields(Percent)
May 22, 2013
May 22, 2013
May 22, 2013
Global financial conditions have eased …
2010 11 1312 Mar.
15
14
Sources: International Monetary Fund, World Economic Outlook, April 2015. 6
0
1
2
3
4
5
6
7
8
2010 2011 2012 2013 2014 2015
Germany
France
Italy
Spain
0
1
2
3
4
5
6
2010 2011 2012 2013 2014 2015
US 30 year fixed mortgage
United States 10 yer government bond yield
Japan 10 yer government bond yield
May 20, 2015 May 20, 2015
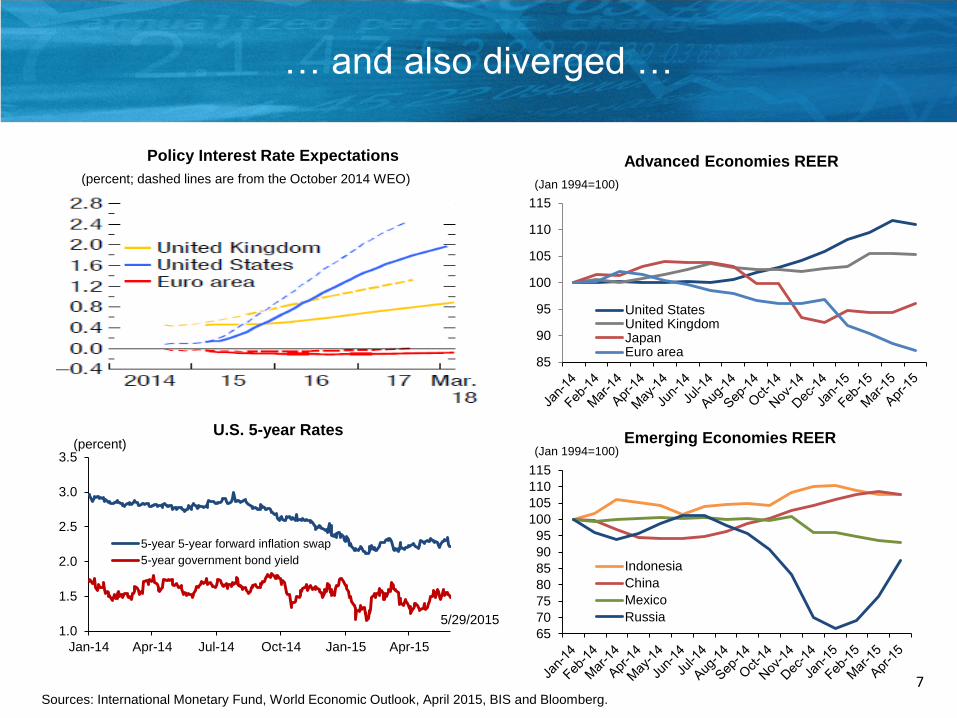
… and also diverged …
7
U.S. 5-year Rates
Sources: International Monetary Fund, World Economic Outlook, April 2015, BIS and Bloomberg.
5/29/2015
Advanced Economies REER
Emerging Economies REER
(Jan 1994=100)
(Jan 1994=100)
85
90
95
100
105
110
115
United StatesUnited KingdomJapanEuro area
Policy Interest Rate Expectations
65
70
75
80
85
90
95
100
105
110
115
Indonesia
China
Mexico
Russia1.0
1.5
2.0
2.5
3.0
3.5
Jan-14 Apr-14 Jul-14 Oct-14 Jan-15 Apr-15
5-year 5-year forward inflation swap
5-year government bond yield
(percent; dashed lines are from the October 2014 WEO)
(percent)

Forecast assumptions:
Partial and gradual reversal of oil price decline
8
Oil Spot and Futures Prices(IMF APSP, U.S. dollars per barrel)
Sources: IMF, GAS Live database; International Energy Agency (IEA).
40
60
80
100
120
2011M1 2012M1 2013M1 2014M1 2015Q1 2016Q1
Oil Price
April 2015 projection
October 2014 projection
Potential Impact of the Decline in
Oil Prices since Aug 2014(percent change)
9
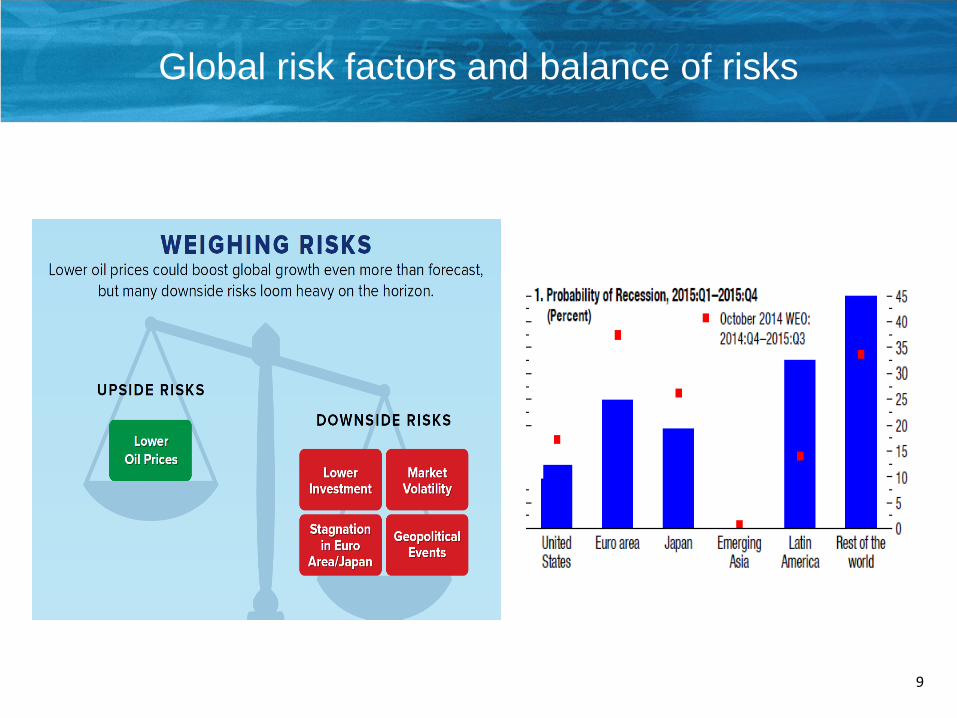
Global risk factors and balance of risks
3
4
5
6
7
8
9
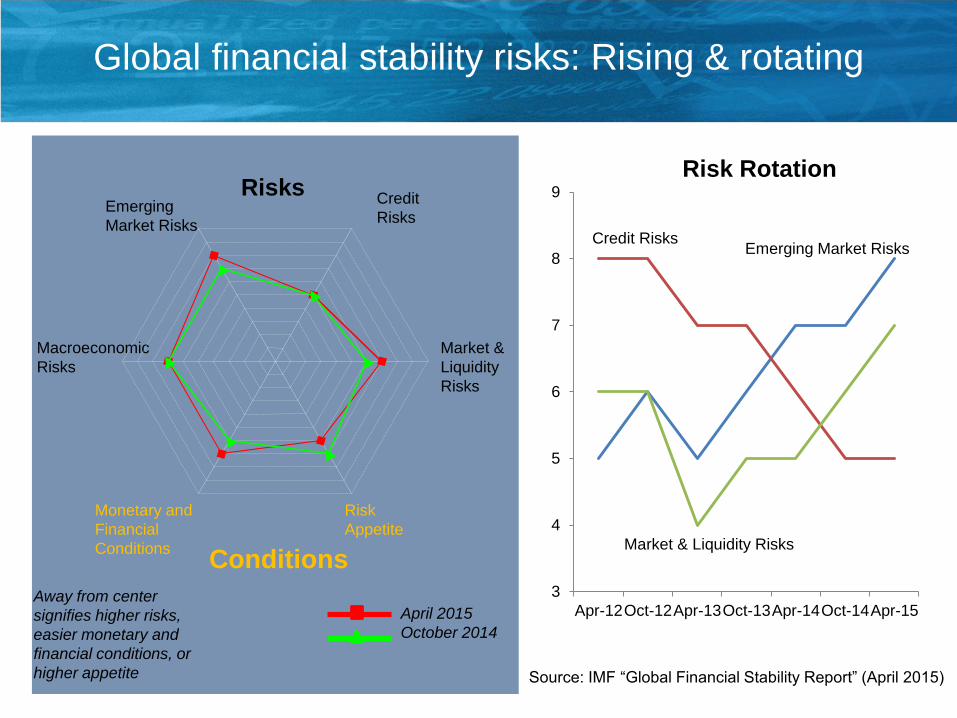
Apr-12Oct-12Apr-13Oct-13Apr-14Oct-14Apr-15
Credit Risks
Market & Liquidity Risks
Emerging Market Risks
Risk Rotation
2
Emerging
Market Risks
Credit
Risks
Market &
Liquidity
Risks
Macroeconomic
Risks
Monetary and
Financial
Conditions
Risk
Appetite
Conditions
Risks
Away from center
signifies higher risks,
easier monetary and
financial conditions, or
higher appetite
Global financial stability risks: Rising & rotating
Source: IMF “Global Financial Stability Report” (April 2015)
April 2015
October 2014

Asian Economic Outlook

(percent change from a year earlier)
12
Asia—Growth outlook
Note: East Asia includes China, Hong Kong SAR, Korea, Taiwan POC. South Asia includes Bangladesh, India and Sri Lanka.
Source: International Monetary Fund, Regional Economic Outlook, May 2015.
2014 2015 2016
Asia 5.6 5.6 5.5
Japan -0.1 1.0 1.2
East Asia 6.7 6.3 5.9
China 7.4 6.8 6.3
Korea 3.3 3.3 3.5
South Asia 7.1 7.4 7.4
India 7.2 7.5 7.5
ASEAN 4.6 5.1 5.3
Indonesia 5.0 5.2 5.5
Malaysia 6.0 4.8 4.9
Philippines 6.1 6.7 6.3
Singapore 2.9 3.0 3.0
Thailand 0.7 3.7 4.0
Vietnam 6.0 6.0 5.8

13
Asia: Region will benefit from oil price decline
Impact of Oil Price Decline on Macro–forecasts
(In percentage points of GDP; growth in percent)Oil Price Windfall: Impact on the Oil Trade Balance in 2015
(In percent of GDP)
Less than 1.5%
Between 1.5-3%
Greater than 3%
Country Oil Price windfall
Australia 0.2
Vietnam 0.4
Malaysia 0.7
New Zealand 0.9
China 0.9
Indonesia 1.1
Japan 1.4
Philippines 1.8
Singapore 1.9
India 2.0
Taiwan Province of China 2.1
Korea 2.7
Hong Kong SAR 2.8
Thailand 5.0
Asia (simple average) 1.7
Asia (weighted average) 1.4
Source: IMF staff estimates.Note: Based on 2014 oil trade balance, assuming unchanged quantities and the April 2015 WEO oil
price projections for 2015.
-4
-3
-2
-1
0
1
2
GDP Growth S-I (public) S-I (private) Current accountbalance
Commodity exporters
Simple average Weighted average
Max
Min
-1
0
1
2
3
GDP Growth S-I (public) S-I (private) Current accountbalance
Net oil importers
Simple average
Weighted averageMax
Min

Asia: Domestic demand remains the growth driver
-2
0
2
4
6
8
10
2014 2015 2014 2015 2014 2015 2014 2015 2014 2015 2014 2015
Asia Australia,Japan & New
Zealand
China East Asia(excl. China)
India ASEAN
Net exports Investment Consumption Growth
Contributions to Projected Growth(in percentage points; year over year)
Sources: IMF, World Economic Outlook; and IMF staff calculations.
Note: ASEAN includes Indonesia, Malaysia, the Philippines, Singapore, Thailand, and Vietnam
14
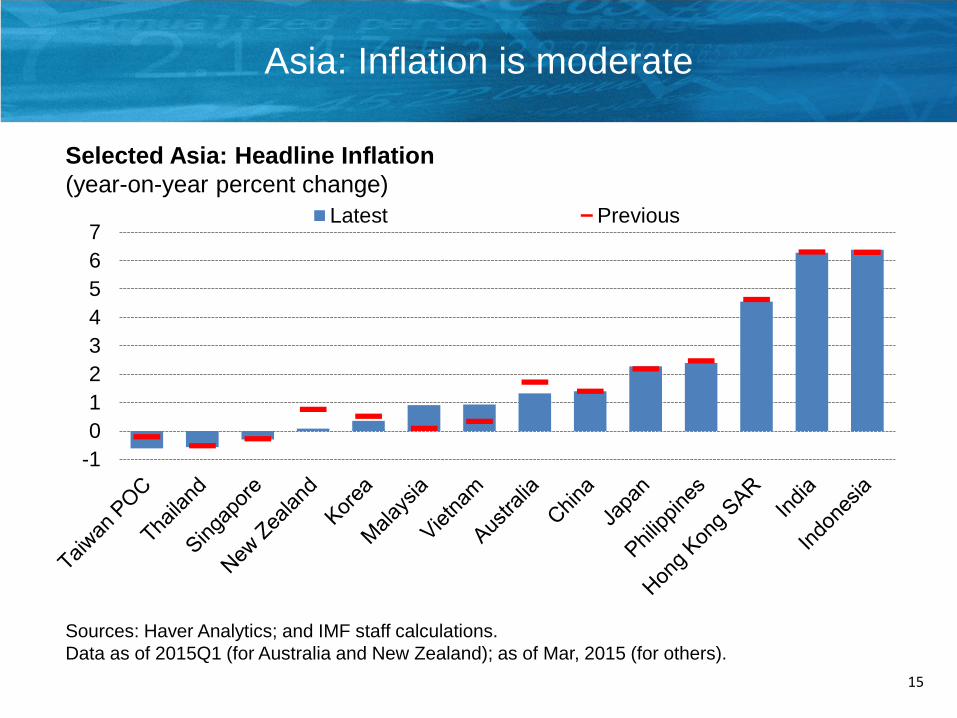
Asia: Inflation is moderate
15
Sources: Haver Analytics; and IMF staff calculations.
Data as of 2015Q1 (for Australia and New Zealand); as of Mar, 2015 (for others).
-1
0
1
2
3
4
5
6
7Latest Previous
Selected Asia: Headline Inflation
(year-on-year percent change)
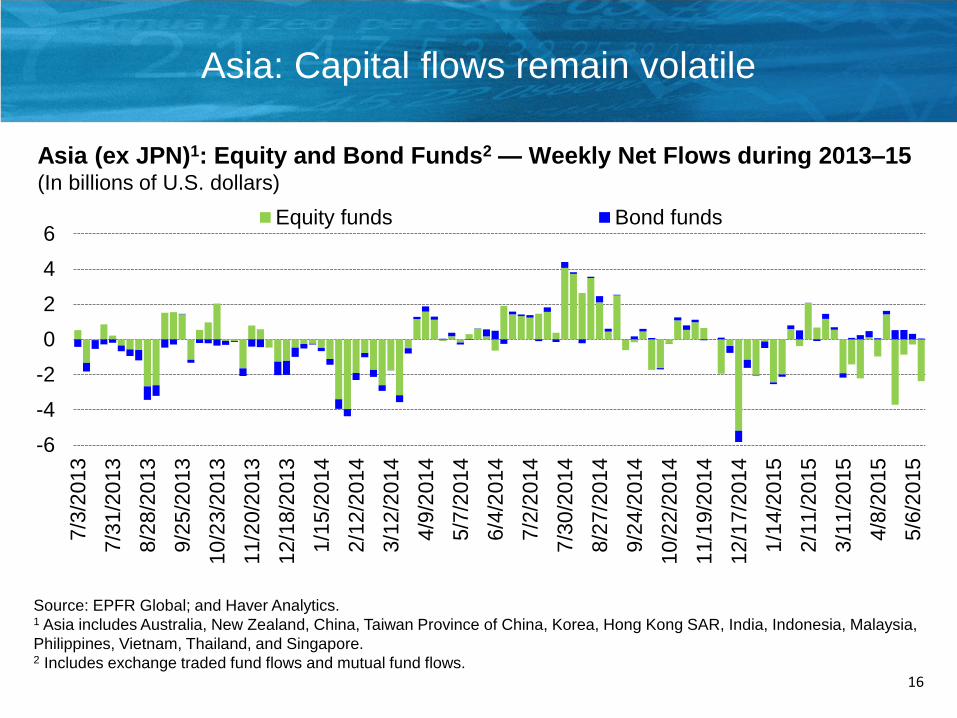
Asia: Capital flows remain volatile
16
Source: EPFR Global; and Haver Analytics.1 Asia includes Australia, New Zealand, China, Taiwan Province of China, Korea, Hong Kong SAR, India, Indonesia, Malaysia,
Philippines, Vietnam, Thailand, and Singapore.2 Includes exchange traded fund flows and mutual fund flows.
-6
-4
-2
0
2
4
6
7/3
/2013
7/3
1/2
013
8/2
8/2
013
9/2
5/2
013
10/2
3/2
013
11/2
0/2
013
12/1
8/2
013
1/1
5/2
014
2/1
2/2
014
3/1
2/2
014
4/9
/2014
5/7
/2014
6/4
/2014
7/2
/2014
7/3
0/2
014
8/2
7/2
01
4
9/2
4/2
014
10/2
2/2
014
11/1
9/2
014
12/1
7/2
014
1/1
4/2
015
2/1
1/2
015
3/1
1/2
015
4/8
/2015
5/6
/2015
Equity funds Bond funds
Asia (ex JPN)1: Equity and Bond Funds2 — Weekly Net Flows during 2013–15(In billions of U.S. dollars)

Real exchange rates have appreciated
17
Sources: Haver Analytics; and IMF staff calculations.
CHN
HK IND
IDN
KOR
MYS
PHL
SGP
THL
AUS
NZ
JPN
USA
EUR
-15
-10
-5
0
5
10
15
20
REER appreciation since June vs 2014 external assessment
External position
<-- weaker stronger-->
Ap
pre
cia
tio
n --
>
"moderately" "substantially""moderately"
Sources: IMF Global Data Source; IMF Staff Reports; IMF staff calculations.
0
5
10
15
20
25
30
35
40
45
To
tal
No
nfin
ancia
l
To
tal
No
nfin
ancia
l
To
tal
No
nfin
ancia
l
To
tal
No
nfin
ancia
l
To
tal
No
nfin
ancia
l
To
tal
No
nfin
ancia
l
To
tal
No
nfin
ancia
l
To
tal
No
nfin
ancia
l
Korea TaiwanProvince of
China
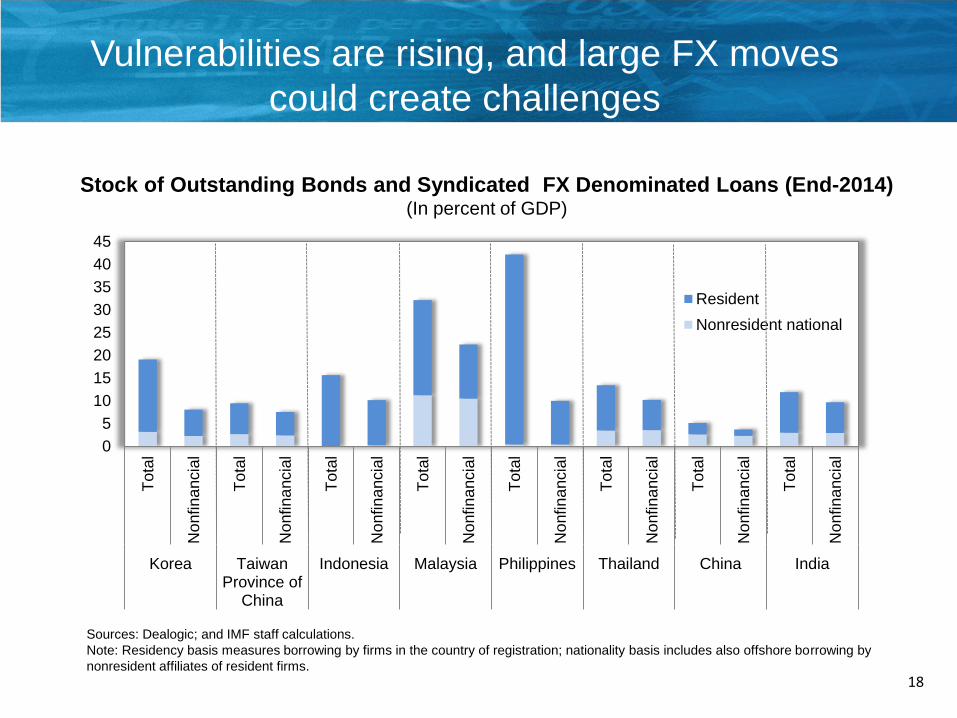
Indonesia Malaysia Philippines Thailand China India
Resident
Nonresident national
Stock of Outstanding Bonds and Syndicated FX Denominated Loans (End-2014)(In percent of GDP)
Vulnerabilities are rising, and large FX moves
could create challenges
Sources: Dealogic; and IMF staff calculations.
Note: Residency basis measures borrowing by firms in the country of registration; nationality basis includes also offshore borrowing by
nonresident affiliates of resident firms.
18
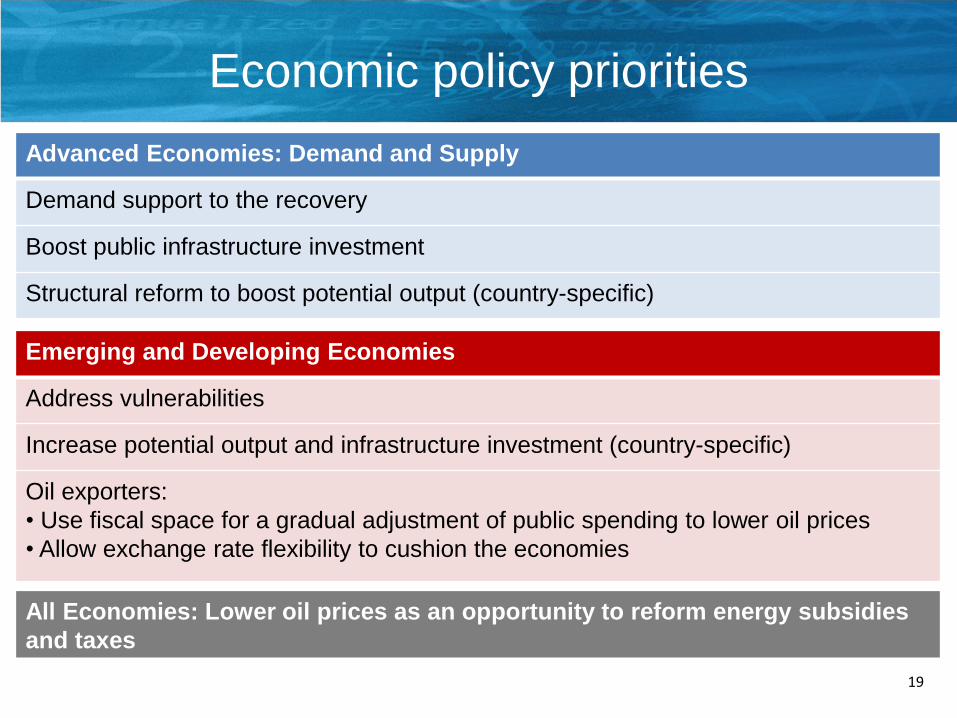
Economic policy priorities
Advanced Economies: Demand and Supply
Demand support to the recovery
Boost public infrastructure investment
Structural reform to boost potential output (country-specific)
All Economies: Lower oil prices as an opportunity to reform energy subsidies
and taxes
Emerging and Developing Economies
Address vulnerabilities
Increase potential output and infrastructure investment (country-specific)
Oil exporters:
• Use fiscal space for a gradual adjustment of public spending to lower oil prices
• Allow exchange rate flexibility to cushion the economies
19

Thank you!