the german elections in the 1870s: why germany turned from ... · why germany turned from...
TRANSCRIPT

MAX PLANCK SOC IETY
Preprints of theMax Planck Institute for
Research on Collective GoodsBonn 2009/34
The German elections in the 1870s: why Germany turned from liberalism to protectionism
Sibylle H. Lehmann

Preprints of the Max Planck Institute for Research on Collective Goods Bonn 2009/34
The German elections in the 1870s: why Germany turned from liberalism to protectionism
Sibylle H. Lehmann
October 2009
Max Planck Institute for Research on Collective Goods, Kurt-Schumacher-Str. 10, D-53113 Bonn http://www.coll.mpg.de

1
The German elections in the 1870s: why Germany turned from liberalism to protectionism1
Sibylle H. Lehmann
In 1878 the liberal parties lost enough votes to loose the majority in the parliament which they had defended in the general election just one year before. In this paper, the question of where the voters came from and why the voting changed so crucially within one year are re-examined. The analysis uses a new set of data aggregated at a lower level than those examined by previous stud-ies and makes use of King’s Algorithm, a tool provided by modern political science. The main finding of this paper is that the change towards protectionism was not caused by new, but by floating voters from the agricultural sector.
JEL classification: C11, D78, H83, N43
1 A shorter version of this working paper is forthcoming in The Journal of Economic History, Vol. 70, No. 1
(March 2010). © The Economic History Association. All rights reserved. ISSN 0022-0507. This article is a revised version of the first chapter of my Ph.D. dissertation (Trinity College Dublin, 2007). I am very grate-ful to my graduate advisor, Kevin O'Rourke. I would also like to thank Ken Benoit, Albrecht Ritschl, Cheryl Schonhardt-Bailey, Kamilah Khatib and Oliver Volckart for their help and critical comments. Furthermore I want to thank Philip Hoffmann and two anonymous referees for their very helpful comments.

2
1. Introduction
Scholars have always seen the years 1878 and 1879 as ‘the greatest internal revolution in the modern history of Imperial Germany’ (Oncken, 1910, 302). During these years, Otto von Bis-marck, Prime Minister of Prussia and Chancellor of the newly founded Reich, dismissed his former liberal partners and forged a new alliance with the conservative forces in the imperial parliament. While this move has occasionally been overrated, with some historians calling it a ‘second foundation of the Reich’ (Böhme 1968; 1972; Barkin 1987), there is no doubt that it set a new strategic direction (Nipperdey 1992/98, 382 ff.; Wehler 1995, 934). From the point of view of commercial policy, the shift from free trade to protection for agricultural and industrial products, which was part of Bismarck’s change of policies, is most important: while it con-formed to a general trend in European commercial policies, Germany was one of the first coun-tries to implement it in practice. The empire was at the forefront of what would become a large-scale set-back for globalisation in the period before World War I.
The question as to why this fundamental change occurred has been viewed from diverse angles (they are surveyed by Gourevitch 1977/98, 707-716). Hans-Ulrich Wehler (1973/85) and Otto Pflanze (1990, 449-488) have pointed out that in contrast to the member states of the Reich, whose finances were based on tax revenues, the Reich itself had a relatively small income from taxes. They suggest that Bismarck intended to introduce tariffs in order to increase his financial leeway by netting profits from customs revenues. That way he could improve the Reich’s Fi-nances, increase its independence from the states, and get rid of the liberals, whom he detested. Regardless of which motive dominated the Chancellor’s decision, to pursue his plans he first needed a co-operative majority in parliament. Given his well-known political preferences, this had to be a conservative majority.
Bismarck took advantage of two attempts on the Kaiser’s life and concentrated his electoral campaign on attacking the Social Democrats, thereby trying to draw attention away from the tar-iff issue. Bismarck’s antisocialist campaign failed, however, and the tariff issue remained the first point on the agenda for the election of 1878.. Helmut Böhme’s (1972, 446-8) terming that election ‘protectionist election’ seems appropriate. Trade policy was the issue which polarised the political parties of the Reich, with free-traders forming one bloc and protectionists another.
The 1878 election brought Bismarck the changes he desired and allowed him to introduce high tariffs on agricultural and industrial products: The free trade liberals, who had a majority in the Reichstag (the German parliament), in 1877, lost 45 seats in 1878 to the advantage of protection-ist parties.
The questions which this paper seeks to answer are: Where did the votes for protection come from? Were voters who objected to free trade new voters, or did they change their political alle-giance? Which economic sectors were they in and can voting behaviour be explained by apply-ing economic theory, and thus be considered as being rational?

3
My answers to these questions will differ in several aspects from prior research, both in terms of the methodology used and the data employed in the analysis. Up to now, most research on the link between German elections and trade policies has made use of standard econometric tools, such as logistic models and multivariate regressions. But since the 1990s political scientists have begun to use a more suitable approach, King’s Algorithm (1997), to analyse modern elections. It provides estimates of the voting behaviour of different groups of voters, by first determining bounds for the distribution of votes and then by applying a Monte Carlo simulation, in order to estimate the average number of votes for particular parties among certain groups. By providing point estimates and confidence intervals for the votes of different groups of voters for every con-stituency, it extracts much more information from the available data than simpler methods and is, therefore, preferable to older approaches. King’s algorithm also provides a solution to the so-called problem of ecological inference. This problem, which I discuss more extensively below, appears when one tries to draw inferences about the motives of individuals – such as voters – on the basis of aggregate data that apply to whole populations – such as election results.2As for the data, it is striking that most previous research is based on data aggregated not at the level of con-stituencies, but of larger administrative units: the ‘Regierungsbezirke’. The implicit or explicit assumption is that the necessary data do not exist at the level of constituencies. In fact, however, most data from the census of 1882, published in the Statistik des Deutschen Reichs, new series vol. 2, were compiled at the ‘Kreise’ level (the basic administrative unit above the level of parish or township, and a component of constituencies, which were larger than ‘Kreise’). This makes it possible either to aggregate data or to approximate the values at the level of constituencies. Thus, with minor adjustments, the census data can be used to analyse the elections at the end of the 1870s. In the process, the the number of observations rises from 68 (based on larger administra-tive units) to 397 (based on constituencies).
The rest of the paper proceeds as follows. After briefly discussing the tariff debate and the exist-ing literature, I will summarize the voting system of Imperial Germany and thenexamine the in-terests of different groups of voters . Next I explain the problem of ecological inference, discuss the data and present the results of an analysis using King’s Algorithm. The next step is to probe the motives of the critical agricultural voters by using the estimated votes for protection as a de-pendent variable in a second stage regression. The paper concludes by summarizing the implica-tions of the results for German history and the growth of protectionism in the late nineteenth-century Europe.
2. The Politics of Tariff Reform
At the end of the 1870s, parties in Germany formed two blocs: the conservatives and the Centre being protectionist, and the others being in favour of free trade. Several liberal parties (German
2 King (2008) uses his own technique, somewhat modified, in order to analyse the last election in the Weimar
republic before Hitler took over.

4
People’s Party, National Liberals, Liberals and Progressives) existed side by side, all supporting free trade. (Nipperdey 1992/98, 326). The Social Democrats, whose position on free trade was somewhat ambiguous during the first decade of the Empire. Toward the end of the 1870s, how-ever, the party press warned workers not to vote for protectionist parties (Schröder 1910, 570 f.). The Catholic Centre Party , having been branded as ‘anti-national’ by Bismarck during the so-called ‘Kulturkampf’-period from 1871-78 (when the Chancellor tried to strengthen the secular state and to reduce the influence of the Catholic Church by imposing sanctions on Catholics), saw a chance to gain influence by supporting the Chancellor on issues of commercial policy. When the ‘Kulturkampf’ abated, the Centre accordingly came out in favour of protectionism (Nipperdey 1992/98, 401). The conservatives, although split between two parties, Conservatives and Free Conservatives, were closely linked with agrarian protectionist pressure groups and ad-vocated protective tariffs (Nipperdey 1992/98, 333 f.). Finally, there were a number of parties that represented ethnic minorities, among which the Poles were the most important. In parlia-ment, the Polish Party, whose stronghold was the Prussian province of Posen, regularly voted in favour of free trade (Schonhardt-Bailey 1998, 308).
Table 1 shows the results of the general elections in 1877 and 1878. In 1877, the free trade liber-als still had a majority, which they lost to protectionist in 1878: The free trade supporting parties lost 10.9 percentage points of seats, while the parties that promoted protectionism gained 9.9 percentage points. With 53 percent of the seats, the protectionists now constituted the majority.
Table 1: German general election results 1877 and 1878
Reichstag 1877 Reichstag 1878
Parties
Number of seats
Percent of seats
Number of seats
Percent of seats
Conservatives 40 10.1 59 14.9
Free Conservatives 38 9.6 57 14.4
Prot
ectio
nist
Centre 93 23.4 94 23.7
Total Protectionists 171 43.1 210 53.0
German People’s Party 4 1.0 3 0.8
National Liberals 128 32.2 99 24.9
Liberals 13 3.3 10 2.5
Progressives 35 8.8 26 6.6
Social Democrats 12 3.0 9 2.3
Free
Tra
ders
Poles 14 3.5 14 3.8
Total Free Traders 206 51.8 161 40.9 Others 20 5.1 26 6.6 Total 397 100 397 100
Source: Ritter and Niehuss (1980).

5
Figure 1 shows the geographical distribution of free traders and protectionists after the general election in 1878. The darker shaded areas show the protectionist majority and the lighter areas the ones with a free trade majority. It also shows the constituencies that changed from a protec-tionist majority to a free trade majority and vice versa. Free-traders lost votes all over Germany, although they suffered the greatest losses in East Prussia, which in 1877 had been fairly evenly divided between free-traders and protectionists.
Figure 1: Results of the General Elections
71
77
General elections 1878Protectionist majority
Free trade majority
Protectionist majority, liberal in 1877
Free trade majority, protectionist in 1877
Note: the map shows the results of the general election for all constituencies of the German Kaiserreich in 1878 and 1877. The darker shaded areas show the protectionist majority and the lighter areas the ones with a free trade majority. It also shows the constituencies that changed from protectionist majority to a free trade majority and vice versa.
Alexander Gerschenkron (1943) and James Sheehan (1983) believe that the collapse of the liber-als occurred because of the antisocialist government campaign in conjunction with the efforts of the conservatively inclined Junkers, who brought masses of rural labourers, who had not voted before, to the polls. Agriculture certainly played a significant role in changing the majority in the parliament, but it is not clear in which way. Scholars do not even agree about whether the inter-ests of agriculture were homogeneous. Did peasants, Junkers and agricultural labourers have the same interest and vote in the same way? In other words, did all men working in the agricultural
6
sector vote for the same policy, independent of their status or farm size or the production mix of the farms on which they worked? Did it make a difference where labourers worked, and did Junkers motivate their labourers so much that the increased turnout among them caused the change in parliament? While the interest of large landowners, who mainly produced grain, can be clearly identified as ‘pro-tariff’, the interest of small farm owners and peasants, who domi-nated in South-West-Germany, is harder to determine, as I will discuss in more detail in sec-tion 4.
Apart from the hypothesis that the mobilisation of farm hands caused the power shift, there are other explanations that focus on the motives of voters, which may have changed between 1877 and 1878. Ronald Rogowski (1989), for example, applies the Heckscher-Ohlin-Samuelson model to a world with three factors of production: land, labour and capital. According to Rogoswki, Germany was relatively abundant in labour and land, but relatively scarce in capital until about the mid-1870s. A decline in transportation costs allowed a massive entry of producers from countries abundant in land, such as the United States and Russia, into the international grain market, making Germany relatively scarce in both capital and land. Agriculture reacted to these changes by joining industry in support of protection, the two sectors concluding the notorious ‘marriage of iron and rye’ in 1879. Yet, if Rogowski is right and one takes into account the fact that most voters were workers, the majority of voters should have voted for free trade. Further-more, it seems implausible that such a major realignment could have occurred within one year.
Peter Gourevitch (1977/98), by contrast, assumes that certain factors of production are ‘specific’ to a particular industry. For example, one could assume that labour is specific and workers would then be immobile between sectors and see their fate tied to the sector in which they work. The change in 1878 could then perhaps be explained by changes in trade balances. Some sectors be-came more import-competing, while others, like agriculture, turned from being export-orientated to import-competing. Most workers ended up in import-competing sectors; they therefore would have voted for protection. The Junkers, who were motivated by a decline in grain prices, led this protectionist coalition, along with the producers of iron and steel. That, in a nutshell, is the ra-tionale behind Gourevitch’s (1977/98) argument. He focuses, however, not particularly on the change of politics in Germany but rather on explaining trade policies on a worldwide level.
Adam Klug (2001) also applies a specific factors model in order to determine whether workers voted according to their sectoral interests in the elections in 1877 and 1878. He finds that most sectors did not significantly vote according to their sectoral interests, and is therefore unable to explain the shift in interest in 1878. The reasons is that he uses data on a very high level of ag-gregation and applies a too simple methodology, that is, a simple logit regression with too few observations. He therefore ignores the problem of ecological inference, which will be explained later in detail. Cheryl Schonhardt-Bailey (1998) studies roll-call votes about tariffs in the Parlia-ment. She analyses whether the interests of the constituency determine the vote of its member of parliament. One main focus in the paper is the agricultural sector and whether constituencies in which grain producers constituted the majority voted differently from ones in which animal hus-bandry was the dominant production. She finds that there is indeed evidence for a split between
7
grain producers and animal producers in the voting behaviour for the conservative parties, but does not find clear patterns for liberal parties. Mark Brawley (1997) uses a model in which la-bour is neither stuck in a sector, nor completely mobile. Like Schonhardt-Bailey (1998), he fo-cuses more on explaining German trade policy over a longer period, rather than on the problem of why voters moved towards parties that supported protectionism in 1878. As this brief synopsis of the research shows, the question of why voters turned from supporting free trade to protection has not yet been satisfactorily answered.
3. The Constitutional Background
From 1871 until 1912 elections were held directly in single member constituencies with repre-sentatives elected by a majority. The constitution determined that general elections – that is, those at the level of the Reich – were to be held according to the principle of ‘one man, one vote’. The suffrage extended to men aged 25 and over with the exception of persons under tute-lage, bankrupts and persons on poor relief. At that time, this was Europe’s most democratic fran-chise (the electoral laws of the member states of the Reich, in particular Prussia, were less de-mocratic). Constitutional reality, however, was different. For one thing, constituencies, which were originally based on the results of the census of 1864, remained largely unchanged between 1871 and 1918 despite rapid urbanisation and intra German migrations (Ritter and Niehuss 1980, 28; Wehler 1995, 1044). As a consequence, in 1912 the slightly more than 10,000 inhabitants of the constituency of Schaumburg-Lippe, a small state in North-Western Germany, had the same number of parliamentary delegates as the almost 340,000 inhabitants of the constituency of Tel-tow, on the southern outskirts of Berlin (Ritter and Niehuss 1980, 28). In the long run, therefore, rural constituencies had an advantage over urban constituencies.
Furthermore, the parliament did not elect the head of the government and his fellow ministers. Instead, they were chosen by the Kaiser, who usually appointed the Prussian Prime Minister as the Reich’s Chancellor. The Reichstag did have some right of legislative initiative, being able to propose laws or to refuse to agree to laws proposed by the executive, but its rights were quite limited, because the emperor had the right to dissolve the parliament and call new elections at any time. In practice, however, the Kaiser left all decisions to his Chancellor, who needed the majority of the parliament to pass a law. The composition of the parliament therefore did clearly matter.
4. Commercial Policy Interests
The majority of voters were not the owners of farms or large estates, factories or smaller work-shops, but rather workers, clerks or other employees (Statistisches Jahrbuch für das Deutsche Reich 7, 1886, 6 ff). Hence, electoral results mainly represent the votes of ‘labour’.
8
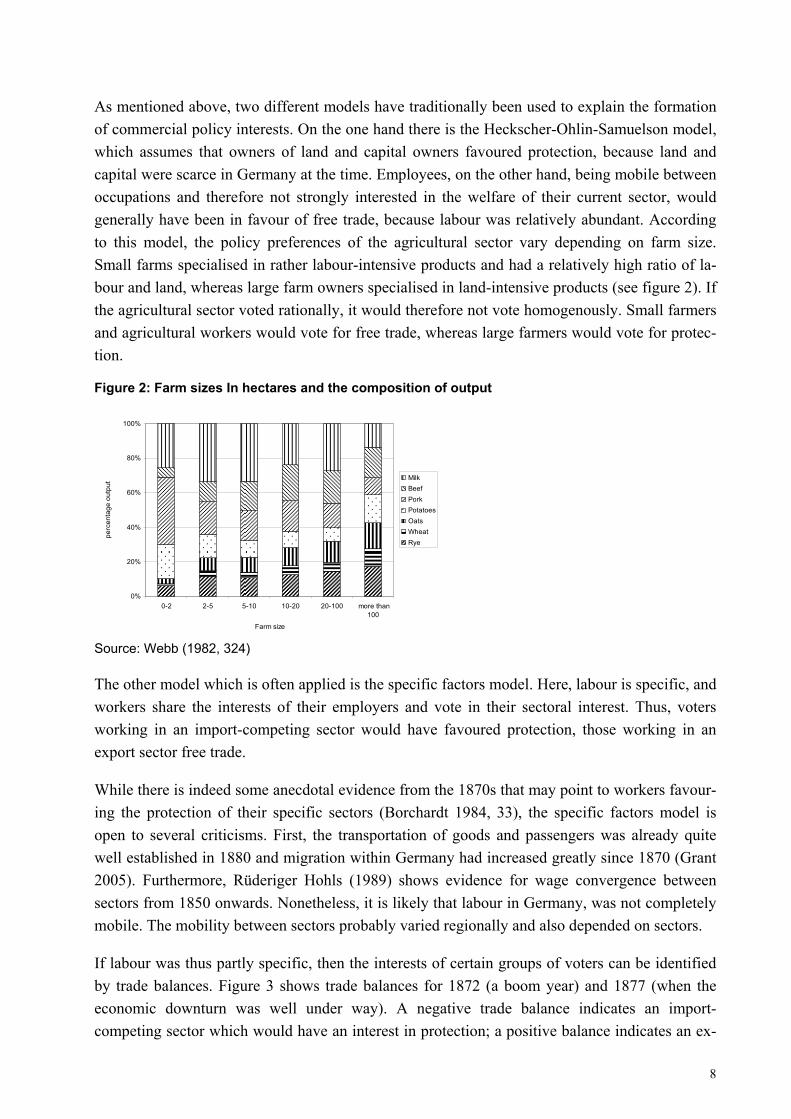
As mentioned above, two different models have traditionally been used to explain the formation of commercial policy interests. On the one hand there is the Heckscher-Ohlin-Samuelson model, which assumes that owners of land and capital owners favoured protection, because land and capital were scarce in Germany at the time. Employees, on the other hand, being mobile between occupations and therefore not strongly interested in the welfare of their current sector, would generally have been in favour of free trade, because labour was relatively abundant. According to this model, the policy preferences of the agricultural sector vary depending on farm size. Small farms specialised in rather labour-intensive products and had a relatively high ratio of la-bour and land, whereas large farm owners specialised in land-intensive products (see figure 2). If the agricultural sector voted rationally, it would therefore not vote homogenously. Small farmers and agricultural workers would vote for free trade, whereas large farmers would vote for protec-tion.
Figure 2: Farm sizes In hectares and the composition of output
0%
20%
40%
60%
80%
100%
0-2 2-5 5-10 10-20 20-100 more than100
Farm size
perc
enta
ge o
utpu
t MilkBeefPorkPotatoesOatsWheatRye
Source: Webb (1982, 324) The other model which is often applied is the specific factors model. Here, labour is specific, and workers share the interests of their employers and vote in their sectoral interest. Thus, voters working in an import-competing sector would have favoured protection, those working in an export sector free trade.
While there is indeed some anecdotal evidence from the 1870s that may point to workers favour-ing the protection of their specific sectors (Borchardt 1984, 33), the specific factors model is open to several criticisms. First, the transportation of goods and passengers was already quite well established in 1880 and migration within Germany had increased greatly since 1870 (Grant 2005). Furthermore, Rüderiger Hohls (1989) shows evidence for wage convergence between sectors from 1850 onwards. Nonetheless, it is likely that labour in Germany, was not completely mobile. The mobility between sectors probably varied regionally and also depended on sectors.
If labour was thus partly specific, then the interests of certain groups of voters can be identified by trade balances. Figure 3 shows trade balances for 1872 (a boom year) and 1877 (when the economic downturn was well under way). A negative trade balance indicates an import-competing sector which would have an interest in protection; a positive balance indicates an ex-

9
port sector in which workers would prefer a free trade policy. Most sectors were affected by the cyclical downturn in the late 1870s. As figure 3 shows, the sector that was hit hardest was agri-culture (especially rye and wheat).
Figure 3: German trade balances by sector In 1000 'Reichsmark', 1872 and 1877
-250
0-2
000
-150
0-1
000
-500
050
0
Whe
at
Met
al w
are
Mac
hine
ry
Rub
ber p
rodu
cts
Bla
ck C
oal
Iron
ore
Bro
wn
Coa
l
See
ds a
nd c
rops
Live
stoc
k
Ferti
lizer
s
Leat
her
Rye
Woo
d
Che
mic
als
Text
iles
Woo
l and
cot
ton
Who
le e
cono
my
18721877
Source: Calculated from Statistisches Jahrbuch für das Deutsche Reich 7 (1886, 81-90) and Statistik des deutschen Reichs, Band IV (1872, 189-224).
The grain invasion of the late nineteenth century mainly affected owners of the large estates in the eastern provinces of Prussia: particularly the Junkers, who had specialised in growing rye. The trade deficit for rye rose from 253.9 to 1720.4 million Marks within five years. The same development can be observed for all other kinds of grain. If the policy preferences of the agri-cultural sector can be determined by the production mix of farms of different sizes, then owners of large farms, which specialised in rye and wheat production, had a clear interest in protection. The interests of peasants, however, are not so clear in this framework. If Steven Webb (1982) was right, then peasants also benefited from the protection of animal products which outweighed the impact of protection on the price of fodder.
Diverging interests crop up in other sectors as well. In the mining, for example, interests de-pended on the kind of coal or ore that was produced. Brown coal mines, as were import-competing in 1877 with a trade balance of -52 million Marks, whereas black coal and iron ore were export goods with trade balances of 78 and 16 million Marks (Figure 3), respectively. As for the construction industry, it did not produce tradable goods and it did not yet depend on im-ported raw materials or require much factory-produced machinery or similar capital goods. Hence, the owners of construction firms were primarily interested in cheap labour. They there-

10
fore should have opposed measures which might force them to raise wages, such as tariffs on imported food. 3
To summarize, if workers were not completely mobile between sectors, they should have voted according to their sectoral interests. Thus, trade balances should predict voting behaviour. Work-ers employed in import-competing sectors should have voted for protection and voters in export sectors for free trade. For the agricultural sector we would expect owners of large estates and their workers to have voted for protection. Owners of smaller farms for free trade, although they might also have voted if Webb (1982) is correct in arguing that protection was on balance to their benefit.
By contrast, if workers were mobile between sectors, a Heckscher Ohlin model would be more appropriate. On the basis of such a model, we would expect workers to have voted for free trade, independent of sectoral interests, while owners of capital and landowners would favour protec-tion. In that case the majority of voters should have voted for free trade, since most voters re-ceived the greater part of their income through wages, rather than as rent or capital rewards. Thus we would not observe voting according to trade balances. In agriculture, workers and peas-ants would have voted for free trade, since peasant farms had a high ratio of labour to land; own-ers of large estates, by contrast, would have voted for protection.
5. Analysis
King’s solution to the Ecological Inference Problem
As mentioned in the introduction, Gary King’s (1997) solution to the problem of ecological in-ference makes it possible to estimate for each constituency how different occupations voted.
The nature of ecological inference problems can best be explained with the help of an example. Suppose that in a certain election, we know how many votes were cast for free-trade-supporting parties and how many for protectionists, and we know how many voters were farmers and how many worked in other sectors. This information is available for every constituency. What we are interested in is the voting behaviour of individuals, or at least of sub-aggregates, for example how many farmers voted for free trade in a particular constituency. Why is answering such ques-tions a problem? Assume that in one constituency 30 percent of the electorate consists of farmers and that 30 percent of the votes are for parties that support free trade. In a second constituency 40 percent of the electorate consists of farmers and 40 percent of votes were cast for free-trade-supporting parties. It thus seems that there is a perfect positive correlation between farmers and votes for free trade. Yet no matter how intuitive this relationship may seem to be farmers might
3 Another question that arises here is whether definitions of sectors as provided by national statistics are too
broad, and whether the reported sectors consisted of sub-sectors with different interests. Furthermore, not all firms subsumed in an ‘export sector’ were necessarily exporters. Melitz (2003) provides a theoretical model that shows how exposure to trade can encourage more productive firms to export, while simultaneously harming the least productive firms in a sector which is generally considered as exporting.

11
not actually have voted for free trade at all. The votes for free trade might come from industrial workers, who could conceivably favour free-trade-supporting parties in districts dominated by agriculture. Hypothesising about the behaviour of individuals by using aggregate data can there-fore be misleading- the problem of ecological inference. The problem is well known in political science: William Ogburn and Inez Goltra (1919) introduced it in the very first multivariate statis-tical analysis ever to have been published in a political science journal, and it has been among the longest-standing unsolved problems in quantitative social science (King 1997).
Precisely this problem rears its ugly head if we try to determine which occupations caused the shift in parliament in 1878, if new voters or floating voters were primarily responsible, and why these groups voted the way they did. We have only aggregate data: election results, shares of specific occupations in specific regions and so forth.
Table 2 shows how the problem can be illustrated in a formal manner. Suppose we want to find out whether or not workers in a specific sector voted for parties that supported free trade. The table shows the problem for one constituency and for two groups of voters, i.e. for those favour-ing free trade and protection, respectively. Here the workers employed in sector J are the voters of interest.
Table 2: The ecological inference problem for constituency i and occupation J
Voting decision
Share of votesfor free trade
Share of votes for protection
Turnout in percent
Abstention in percent
Share of workers in sector J
Jiλ
Jiλ−1 J
iβJ
iβ−1 Jix
1-Share of workers in sector J
Ji−λ J
i−− λ1 J
i−β j
i−− β1 J
ix−1
iV 1- iV iT iT−1 iN
Source: see text Note: J
ix is the share of the workforce in constituency i employed in sector J. This could be, for example, the share of farmers. iV is the share of votes for free-trade-supporting parties in the constituency i and 1-
iV the share of votes for parties that support protection. iT is the percentage turnout. These values are known. The unknown quantities of interest are: J
iλ , which is the share of workers in sector J in the con-stituency i that voted for free ; J
i−λ , which is the share of workers of sectors outside J that voted for free
trade; Jiβ , which is the turnout of the workers in sector J in the constituency i; and J
i−β , which is the
turnout of workers in other sectors.
For every constituency, national statistics provide the values in the margins of the table, where index i indicates constituency i, and J indicates sector J. J
ix is the share of the workforce in con-stituency i employed in sector J. This could be, for example, the share of farmers in constituency i. iV is the share of votes for free-trade-supporting parties in constituency i and 1- iV the share of

12
votes for parties that support protection. iT is the percentage turnout for constituency i. Data on voting shares and turnout per constituency for Germany are provided by Danièle Caramani (2000). What these national statistics do not show, however, are the values in the inner cells of the table, such as the shares of various occupations in a particular constituency that voted for free trade, for protection, or abstained; that is the iλ ’s and iβ ’s, which are not directly observed. J
iλ is the share of workers in sector J in constituency I, who voted for free trade and J
iλ−1 is the share of workers of sector J who voted for protection. For example, assuming that J is the agri-cultural sector, J
iλ is the share of farmers who voted for free trade and Jiλ−1 the share of farm-
ers who voted for protection. Similarly, Ji−λ is the share of non-agricultural workers who voted
for free trade, and Ji−− λ1 is the share of non-agricultural workers who voted for protection.
Jiβ is the turnout of the workers in sector J in the constituency. Clearly these parameters are the
really relevant ones if we are interested in why the protectionists won the 1878 election in Ger-many. Estimating these values not only provides far more and better information about the vot-ing behaviour of different sectors than other methodological approaches, but also creates new dependent variables that can then be used to study influences on voters’ decisions.
King begins by observing that we can deterministically put some limits on individual behaviour from the available aggregate data. Assume that we observe two types of voters (farmers and non-farmers) and two voting options (voting or not voting). The turnout in constituency i ( iT ) is just the proportion of farmers who voted in this district ( J
iβ ) times the share of farmers in constitu-ency i ( iX ), plus the proportion of non-farmers who voted multiplied by the share of non-farmers in this constituency:
)1( iJ
iiJ
ii XXT −+= −ββ (1)
Since the turnout is known, the true proportions of voters among farmers and non-farmers must fall somewhere on a downward sloping line, whose slope is determined by the ratio of farmers to non-farmers, and whose intercepts will depend on the turnout as well:
i
iJi
i
iJi X
XXT −
−= − 1ββ (2)
i
iJi
i
iJi X
XX
T−
−−
=−
11ββ (3)
If we had only one set of aggregate data, for example, information on turnout and the share of farmers for the whole of Germany, this would be as far as we could go, but we have aggregate data for every constituency. Each set of aggregate data, that is, every constituency, gives us such a line, and King illustrates those lines by creating a ‘tomography plot’ (cf. the Appendix I). This is informative, but does not provide enough information to get a clear solution. There is no exact way of recovering the values in the inner cells of table 2. The simplest assumption to start with is that the true proportions for each constituency are picked at random from some distribution, but that all constituencies are drawn from the same population. King focuses on the case where that distribution fits the joint probabilities to a truncated bivariate normal distribution so that all pro-portions are between 0 and 1. In order to get the parameters from the truncated bivariate normal distribution, King uses the lines from the tomography plot. The normality assumption helps de-

13
tect the mode on the tomography plot (see Appendix I), where most of the lines cross, and im-proves estimates by ‘borrowing strength’ from other constituencies. Intuitively, the most likely values for J
iβ and Ji−β are nearest the mode. Adding a couple of modest assumptions, five in-
termediate parameters that define the truncated bivariate distribution are estimated via a maxi-mum likelihood function. The parameters are then transformed and rescaled. The means of the distribution of J
iβ and Ji−β are used as point estimates, and standard errors are based upon the
variation in the simulated values. Thus King’s Algorithm provides sub-estimates for every con-stituency and thereby extracts much more information from the available data than simpler econometric tools.
Furthermore one can use additional information as control variables to ensure the quality of the estimation. If chosen correctly, these variables will control for ‘aggregation bias’. Aggregation bias occurs if the variation of the parameters J
iβ and Ji−β or J
iλ and Ji−λ in specific areas differs
from the general pattern of the aggregated constituency. The idea is that this variation can be systematically explained by other variables (see Appendix I for an example). Here, the assump-tion that no aggregation bias exists is replaced with the assumption that the truncated normal means depend on external covariates (see King 1997, 288). I include covariates in the estimation of the agricultural sector, since I use the point estimates of the J
iλ in a second stage regression. Therefore I need to include all independent variables from this regression as covariates in the first estimation (see Herron and Shotts, 2004). For the other sectors I also tried covariates, but the results did not perceptibly vary. This also suggests that there was little aggregation bias in the first place.
As a description of the methods used to estimate these parameters is beyond the scope of this paper, the reader is referred to King (1997) for full details.4 Appendix II gives some more de-tailed information about the method.
Results
Figure 4 shows the occupational categories in Germany for males over the age of 14. Although males were allowed to vote only from the age of 25, national statistics do not provide more de-tailed information about the ages of different occupational groups. I assume that the share of oc-cupations shown in Figure 4 equals the distribution of the electorate among different sectors, although I am aware some of the shares might be slightly over- or under estimated.
4 I estimated the quantities of interest applying Benoit’s and King’s (2003) Ezi software.

14
Figure 4: Occupational categories, Germany 1882
Textiles
Metal workingIron, steel
Peat
Mining
Paper, leather
Unemployed
Wood working
Construction
Industrial workers
Agricultural workers
Trade and transport
others
Farm owners
Note: Data on the employment of women were removed for those industries which constituted more than 1 percent of the workforce. Source: Calculated from the Occupational Census 1882 (Statistik des Deutschen Reiches (1884, 214-429) )
New Voters
I will first present the results for the betas (the turnout among occupations) to determine whether it was new or floating voters who made the difference. The estimation provides separate point estimates for every one of the 396 constituencies. Rather than presenting all 396 point estimates separately, I broke down the constituencies into different regions, and present the average of these point estimates across constituencies in each region.
Table 3 provides the average estimation results for all 396 constituencies. The overall turnout increased slightly from 60.6 percent in 1877 to 62.3 percent in 1878 (Ritter and Niehuss, 1980, 38f). Since I estimated turnout for each sector separately I also provide the estimated overall turnout, i.e. the weighted sum of the turnout for each sector, where the weights are the number of voters from each sector. As one can see, the result is close to the turnout provided from national statistics, which lends credence to the estimation process. Overall the diagnostics, i.e. the tomo-graphy plots for all sectors do not show signs of aggregation bias. Appendix I provides the to-mography plot for the estimation of the turnout in the agricultural sector in 1878.
The first notable result achieved with the help of King’s method is that in 1878 turnout in agri-culture increased only slightly, by about 0.5 percent, which is approximately 1660 votes more than in 1877. Thus it seems that it was not increased turnout in the agricultural sector which made the difference in the election in 1878. The turnout of voters employed in the iron industry, the other party in the ‘Marriage of Rye and Iron’, even decreased slightly from 53.6 to 53.1 per-

15
cent of votes. Most of the new voters, it turns out, actually came from mining, textiles and ‘other industries’.
Table 3: Results for Germany, turnout (betas) among occupations
1877 1878 Germany Turnout
(beta) Standard
error Turnout (beta)
standard error
Change in turnout
in percent Agriculture 0.629 0.035 0.632 0.061 0.48 Chemicals 0.525 0.090 0.551 0.058 4.95 Construction 0.537 0.078 0.567 0.040 5.59 Iron 0.536 0.079 0.531 0.087 -0.93 Metal working 0.539 0.079 0.559 0.055 3.71 Mining 0.551 0.065 0.950 0.098 72.41 Other Industry 0.393 0.068 0.546 0.080 38.93 Others 0.308 0.059 0.535 0.254 73.70 Stones 0.414 0.026 0.536 0.079 29.47 Textiles 0.451 0.019 0.629 0.107 39.47 Trade 0.547 0.078 0.540 0.079 -1.28 Unemployed 0.395 0.053 0.167 0.026 -57.72 Overall turn-out*
0.606 0.131 0.623 0.111
Estimated Overall turnout
0.521 0.084 0.629 0.089
Constituencies 397 Source: see text Note: Figures are mean quantities by occupation ‘Other Industries’ covers the production of machines and scientific apparatus, leather and paper, wood working, food and clothing ‘others’ covers the remaining sectors: forestry, fishing, peat-cuttering, printing, arts, insurance, lodging, servants and public servants *(Ritter and Niehuss, 1980)
Using King’s Algorithm, we can estimate the turnout by occupation for specific regions. Table 4 provides the results for East-Elbia.5 Here, the turnout in the agricultural sector increased by 10.5 percent, from 56 to 61.9. The agricultural sector in this area was dominated by large estates, which specialised to a large extent in grain production and can therefore be expected to have been protectionist. There might therefore be some truth to Gerschenkron’s (1943) hypothesis that parliament changed because rural workers in East Prussia who had not voted in 1877 suddenly ran to the polls in 1878. However, this hypothesis can only be confirmed by looking at those constituencies where the liberals lost the majority.
5 That is, for the Prussian provinces of Brandenburg, Silesia, Pomerania, Posen and West-and East-Prussia,
which were east of the river Elbe.

16
Table 4: Results for East-Elbian Prussia, turnout (betas) among occupations
1877 1878 East Elbian
Prussia Turnout (beta)
Standard error
Turnout
(beta)
standard error
Change in turnout in percent
Agriculture 0.560 0.030 0.619 0.051 10.54 Chemicals 0.330 0.077 0.280 0.043 -15.15 Construction 0.310 0.064 0.263 0.028 -15.16 Iron 0.308 0.065 0.327 0.074 6.17 Metal working 0.316 0.067 0.279 0.042 -11.71 Mining 0.718 0.056 0.940 0.082 30.92 Other Industry 0.429 0.071 0.323 0.069 -24.71 Others 0.337 0.060 0.561 0.266 66.47 Stones 0.737 0.018 0.312 0.065 -57.67 Textiles 0.289 0.018 0.755 0.082 161.25 Trade 0.318 0.067 0.314 0.065 -1.26 Unemployed 0.490 0.054 0.202 0.027 -58.78 Overall turn-out*
0.564 0.622
Constituencies 114 Source: see text Note: Figures are mean quantities by occupation ‘Other Industries’ covers the production of machines and scientific apparatus, leather and paper, wood working, food and clothing ‘others’ covers the remaining sectors: forestry, fishing, peat-cuttering, printing, arts, insurance, lodging, servants and public servants *(Ritter and Niehuss, 1980)
In 1878 the liberals lost 50 seats and won 4 (see figure 1). In the constituencies where the liberals lost the turnout estimates still support Gerschenkron’s (1943) hypothesis (Table 5). Turnout among people employed in the agricultural sector increased by 9.6 percent. The other two sectors which experienced a significant increase in votes were mining and textiles. The category ‘oth-ers’, which includes the remaining sectors forestry, fishing, peat-cutting, printing, arts, insurance, lodging, public servants and servants, also seems to have had a huge rise in turnout. All of these sectors, however, have only a very small absolute number of voters and can therefore be ignored.

17
Table 5: Results for the constituencies in which the liberals lost the vote, turnout (betas) among occupations
1877 1878 Turnout
(beta) Standard
error Turnout (beta)
standard error
Change in turn-out in percent
Agriculture 0.593 0.033 0.650 0.063 9.61 Chemicals 0.468 0.076 0.489 0.046 4.49 Construction 0.479 0.065 0.510 0.031 6.47 Iron 0.484 0.066 0.477 0.075 -1.45 Metal working 0.472 0.067 0.496 0.042 5.08 Mining 0.601 0.058 0.942 0.064 56.74 Other Industry 0.429 0.071 0.486 0.069 13.29 Others 0.323 0.059 0.532 0.282 64.71 Stones 0.470 0.021 0.476 0.064 1.28 Textiles 0.388 0.017 0.682 0.092 75.77 Trade 0.486 0.066 0.484 0.065 -0.41 Unemployed 0.459 0.052 0.186 0.028 -59.48 Overall turn-out*
0.579 0.631
Constituencies 50 Note: Figures mean quantities by occupation ‘Other Industries’ covers the production of machines and scientific apparatus, leather and paper, wood working, food and clothing ‘others’ covers the remaining sectors: forestry, fishing, peat-cuttering, printing, arts, insurance, lodging, servants and public servants *(Ritter and Niehuss, 1980)
Floating Voters
Tables 6 and 7 provide the average values of the estimates of the lambdas of table 2, i.e. the share of votes for free trade, for both the 1877 and 1878 elections, by sector and for different geographical areas. The sectors are classified according to their trade balances in order to see whether the specific factors model can predict voting behaviour. All other sectors, i.e. those which have an interest that cannot clearly be defined, such as mining, and non-traded sectors, such as construction, are not classified.
The results for Germany as a whole (table 6) explain why Klug (2001) found that most occupa-tions had no significant preference for a certain trade policy: In 1877, the shares of votes for free trade and protectionism were fairly similar in each sector: In agriculture, for example, 50.7 per-cent of voters voted for free trade and 49.3 percent for protection . However, the important elec-tion was the one in 1878 and here the picture changed.
The majority of voters employed in agriculture, textiles, stones and metal working now tended to vote according to their sectoral interests as defined by sectoral trade balances. The largest shift towards protection was in the agricultural sector. Here the share of votes for free trade dropped by 13.8 percent. Support for free trade also fell off sharply in the iron industry (Table 6). It

18
seems that the famous ‘marriage of rye and iron’, the coalition between heavy industry and large landowners, dominated the change in votes in the election in 1878. But voters in the textile sec-tor also rallied for protectionism, 52 percent of them in 1878, as opposed to only 46.7 percent in 1877.
Table 6: Results for Germany, share of votes for free trade by sector (lambda)
1877 1878
Germany Votes for free trade
(lambda)
standard error
Votes for free trade
(lambda)
standard error
percentage change in votes for free trade
Agriculture 0.507 0.018 0.437 0.065 -13.81 Chemicals* 0.530 0.151 0.552 0.071 4.15 Stones 0.501 0.052 0.478 0.078 -4.59
Negative trade balance Textiles 0.533 0.034 0.480 0.075 -9.94
Iron 0.536 0.036 0.475 0.073 -11.38 Positive trade balance
Metal working 0.545 0.041 0.578 0.072 6.06
Construction 0.533 0.033 0.505 0.085 -5.25 Mining 0.586 0.083 0.530 0.071 -9.56 Other Industry 0.456 0.073 0.456 0.073 0.00 Trade 0.533 0.032 0.466 0.081 -12.57 Others 0.528 0.036 0.465 0.068 -11.93
Others
Unemployed 0.527 0.037 0.490 0.074 -7.02 Constituencies 397 Note: Figures mean quantities by occupation ‘Other Industries’ covers the production of machines and scientific apparatus, leather and paper, wood working, food and clothing ‘others’ covers the remaining sectors: forestry, fishing, peat-cuttering, printing, arts, insurance, lodging, servants and public servants Again, it is possible to make estimates for different regions. In East-Elbia (table 7), nearly all sectors seem relatively indifferent between free trade and protection in 1877, but in 1878 protec-tionist parties gained support across all sectors. The slight lead of protectionist became a clear protectionist majority. Although turnout in this sector increased by 10.53 percent, quite a large number of voters rejected free trade, since the share of votes for free trade decreased by 27.9 percent.
As we have seen in table 4, a large number of new votes were cast in the mining and textiles sec-tors. In both sectors, votes for free trade plummeted with shares dropping 24.83 and 38.93 per-cent, respectively. In East Prussia, the mining sector mainly focused on brown coal, which was import-competing (see figure 3). Miners in East Prussia would thus have had an interest in pro-tection, and indeed voters from this sector voted for protection in both years. This result supports the hypothesis that the specific factors model can predict voting behaviour to a certain degree. The main point of the table, however, is that the entire region shifted towards protectionism, ex-cept for ‘other industries’, and not just the agricultural sector.

19
Table 7: Results for East-Elbia, share of votes for free trade by sector (lambda)
1877 1878 Votes
for free trade
(lambda)
standard error
Votes for free trade
(lambda)
standard error
percentage change in votes for free trade
Agriculture 0.493 0.017 0.355 0.055 -27.99 Chemicals 0.476 0.190 0.402 0.056 -15.55 Stones 0.520 0.050 0.313 0.055 -39.81 Mining 0.439 0.068 0.330 0.050 -24.83
Negative trade balance
Textiles 0.506 0.034 0.309 0.053 -38.93 Iron 0.510 0.035 0.313 0.056 -38.63 Positive
trade balance
Metal work-ing
0.476 0.039 0.432 0.057 -9.24
Construction 0.506 0.033 0.364 0.075 -28.06 Other Indus-try
0.305 0.057 0.305 0.057 0.00
Others 0.503 0.034 0.304 0.054 -39.56 Trade 0.505 0.032 0.318 0.064 -37.03
Others
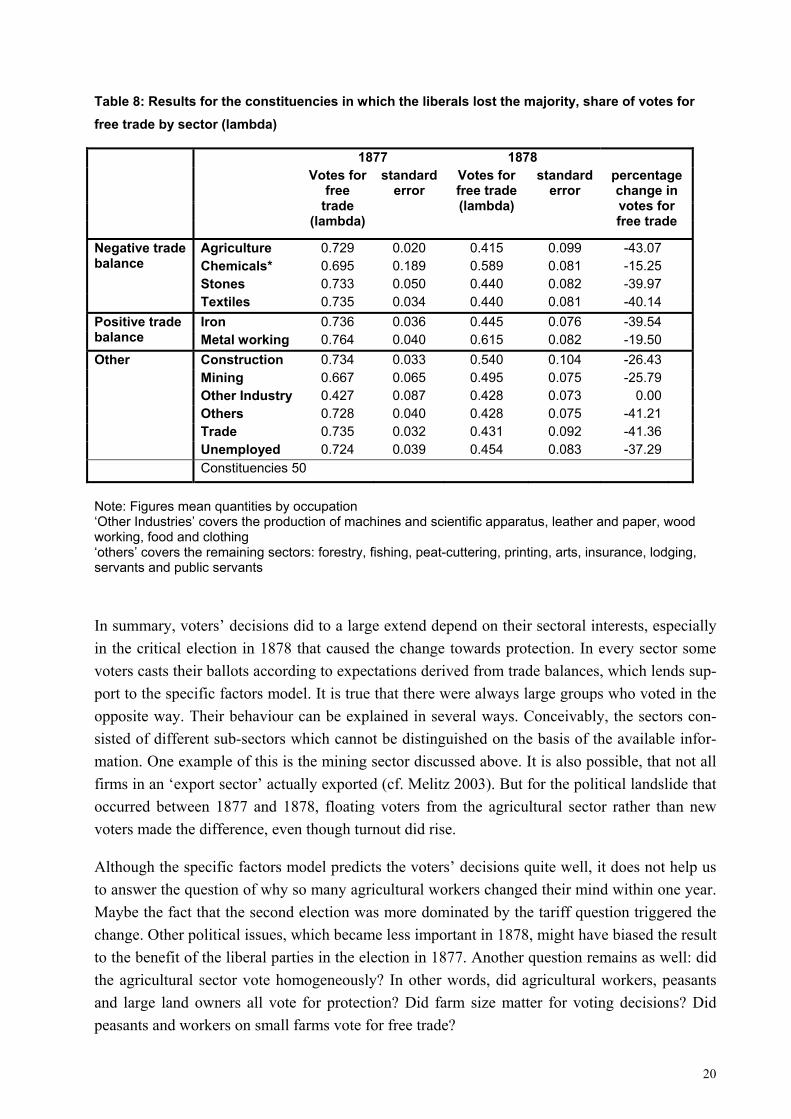
Unemployed 0.499 0.036 0.313 0.056 -37.27 114 constituencies Note: Figures mean quantities by occupation ‘Other Industries’ covers the production of machines and scientific apparatus, leather and paper, wood working, food and clothing ‘others’ covers the remaining sectors: forestry, fishing, peat-cuttering, printing, arts, insurance, lodging, servants and public servants The results for the constituencies where the liberals lost the majority are shown in table 8. All sectors except ‘other industries’ voted for free trade in 1877. In 1878 voters employed in agricul-ture and textiles changed their voting behaviour, which eventually changed the electoral result.
In these constituencies, the free trade votes from agriculture collapsed and fell by 43.07 percent, which was far more than the increase in turnout (from 0.593 to 0.65, from Table 5). More than new voters, it was floating voters in the agricultural sector, who caused the change in favour of protectionists. Other sectors such as textiles and iron also rallied to protectionism, but in absolute votes the agricultural sector had much more influence, since it constituted the biggest part of the electorate.
While in 1877 most sectors did not vote in the way that trade balances would predict, the picture changed in 1878. Most sectors now voted in a predictable manner. The exceptions were chemi-cals, which were still in favour of free trade, but less so than in 1877, and the iron sector which was now in favour of protection. The latter can be explained by the more complex structure of the iron industry. The iron industry needed semi-finished products, which were imported. Firms that specialised in the production of semi-finished products therefore demanded protection (Webb 1980). The interest in protection might also be explained from a Heckscher Ohlin per-spective, since heavy industry is capital intensive. Capital was scarce in Germany at the time and thus heavy industry would have had an interest in protection rather than in free trade.
20
Table 8: Results for the constituencies in which the liberals lost the majority, share of votes for free trade by sector (lambda)
1877 1878
Votes for free
trade (lambda)
standard error
Votes for free trade (lambda)
standard error
percentage change in votes for free trade
Agriculture 0.729 0.020 0.415 0.099 -43.07 Chemicals* 0.695 0.189 0.589 0.081 -15.25 Stones 0.733 0.050 0.440 0.082 -39.97
Negative trade balance
Textiles 0.735 0.034 0.440 0.081 -40.14 Iron 0.736 0.036 0.445 0.076 -39.54 Positive trade
balance Metal working 0.764 0.040 0.615 0.082 -19.50 Construction 0.734 0.033 0.540 0.104 -26.43 Mining 0.667 0.065 0.495 0.075 -25.79 Other Industry 0.427 0.087 0.428 0.073 0.00 Others 0.728 0.040 0.428 0.075 -41.21 Trade 0.735 0.032 0.431 0.092 -41.36
Other
Unemployed 0.724 0.039 0.454 0.083 -37.29 Constituencies 50
Note: Figures mean quantities by occupation ‘Other Industries’ covers the production of machines and scientific apparatus, leather and paper, wood working, food and clothing ‘others’ covers the remaining sectors: forestry, fishing, peat-cuttering, printing, arts, insurance, lodging, servants and public servants
In summary, voters’ decisions did to a large extend depend on their sectoral interests, especially in the critical election in 1878 that caused the change towards protection. In every sector some voters casts their ballots according to expectations derived from trade balances, which lends sup-port to the specific factors model. It is true that there were always large groups who voted in the opposite way. Their behaviour can be explained in several ways. Conceivably, the sectors con-sisted of different sub-sectors which cannot be distinguished on the basis of the available infor-mation. One example of this is the mining sector discussed above. It is also possible, that not all firms in an ‘export sector’ actually exported (cf. Melitz 2003). But for the political landslide that occurred between 1877 and 1878, floating voters from the agricultural sector rather than new voters made the difference, even though turnout did rise.
Although the specific factors model predicts the voters’ decisions quite well, it does not help us to answer the question of why so many agricultural workers changed their mind within one year. Maybe the fact that the second election was more dominated by the tariff question triggered the change. Other political issues, which became less important in 1878, might have biased the result to the benefit of the liberal parties in the election in 1877. Another question remains as well: did the agricultural sector vote homogeneously? In other words, did agricultural workers, peasants and large land owners all vote for protection? Did farm size matter for voting decisions? Did peasants and workers on small farms vote for free trade?

21
Behind the Curtain of the Polling Booth
To answer these questions and determine what motivated voters in the agricultural sector we can take the estimate of the share of votes, for free trade and use it as the dependent variable in a second stage regression. The practice of using quantities generated by applying King’s Algo-rithm as dependent variables is known in the methodological literature as ‘EI-R’. Hence, I use the following equation for the second-stage analysis, which can be estimated by weighted least squares6.
i
n
kkik
FTi x εααλ ++= ∑
=10
The dependent variable FTiλ is the point estimate of the share of voters working in the agricul-
tural sector who voted for free trade in district i. 0α is the constant term and the explanatory variables kix cover possible influences on voting behaviour across districts. iε is the error term. I use the share of immigrants per constituency as a right-hand side variable: the data on immi-grants were taken from Statistik des deutschen Reichs 1888. Regions with a larger share of im-migrants were probably wealthier than others, offering more and better jobs and therefore attract-ing more workers than others. They also had higher economic growth rates and were probably more favourable to free trade. A larger share of immigrants might also indicate higher sectoral mobility, which would increase the support for free trade, on the assumption that labour was the abundant factor in Germany. This share differs largely among regions, as shown in figure 5.
Figure 5: Migrants in percent of the population
0
10
20
30
40
50
60
City
of B
erlin
Ham
burg
Lübe
ck
Bre
men
Anh
alt
Bru
nsw
ick
Sch
aum
burg
-Lip
pe
Bra
nden
burg
Old
enbu
rg
Pro
vinc
e of
Sax
ony
Wes
tpha
lia
Sch
lesw
ig-H
olst
ein
Mec
klen
burg
-Stre
litz
Als
ace-
Lorra
ine
Hes
se-N
assa
u
Hoh
enzo
llern
- Sig
mar
inge
n
Wes
t Pru
ssia
Han
over
Wal
deck
Thur
ingi
a[1]
Hes
se
Mec
klen
burg
-Sch
wer
in
Kin
gdom
of S
axon
y
Pom
eran
ia
Lipp
e
Pos
en
Rhi
nela
nd
Bad
en
Sile
sia
Wür
ttem
berg
Eas
t Pru
ssia
Bav
aria
perc
ent
Source: Calculated from Statistik des Deutschen Reichs N.F. 32, Berlin (1888), 212-35.
6 I am aware of the problems involved in using these variables in a second-stage analysis and have carefully
followed the recommendations made by Adolph, King et al. (2003). First, I exclude any quantities not origi-nally included as covariates in the first-stage estimation as independent variables in EI-R. Second, I apply weighted least squares using the estimated standard errors from the first-stage estimation as weights, as rec-ommended by Herron and Shotts (2004).

22
As shown above, in every region there was a group of agricultural voters who in both elections voted for free trade, but previous research does not agree on whether all agricultural producers, or only the owners of large estates, benefited from tariffs. While information about specific groups of farmers is lacking at the level of ‘Kreise’, there are data on the sizes of the farms. Since larger farms generally specialised in grain production and would therefore benefit from protection and smaller farms typically specialised in animal husbandry and might therefore have been harmed by protection, the farm size can be used to analyse whether the voters from the ag-ricultural sector voted in their own interest. Hence I include variables on the size in hectares of farms from the Statistik des Deutschen Reichs 112: Berufs- und Gewerbezählung vom 14. Juni 1895. Die Landwirthschaft im Deutschen Reich.
Apart from political questions such as the tariff issue, there were other, social influences on the voters’ decisions, such as tradition and religion. Catholic priests tended to encourage their pa-rishioners to vote for the Centre party; their influence is therefore expected to have a negative influence on the share of free trade votes. The population census of 1880 provides the share of Catholics at the level of ‘Regierungsbezirke’ . I assume that this share was equal in all constitu-encies belonging to a certain ‘Regierungsbezirk’. Table 9 gives an overview of all variables.
Table 9: Overview of variables
Variable Obs Mean Std. Dev. Min MaxShare of votes for free trade 1877 388 0.507 0.335 0 1Share of votes for free trade 1878 388 0.437 0.326 0 1Share of immigrants 388 0.004 0.006 0 0.026Turnout77 388 0.607 0.132 0.230 0.906Turnout78 388 0.625 0.111 0.179 0.910Share of Catholics 388 0.367 0.340 0.003 0.992Farm size: less than 1 ha 388 0.067 0.053 0.008 0.406Farm size: 20 to 50 ha 388 0.014 0.006 0.001 0.030Farm size: more than 100 ha 388 0.000 0.000 0.000 0.001 Source: see text.
Table 10 provides the results for the elections in 1877 and 1878. The dependent variables are the shares of votes for free trade in 1877 and 1878, respectively. The share of immigrants has a posi-tive impact on voting for free trade, which suggests that richer and better-developed regions tended to attract people and were also more free trade orientated, although not significantly so. It might also indicate that increased mobility had a positive impact on voting for free trade.
For the question of how the agricultural sector voted, let us consider the impact of farm size on voting behaviour is most interesting.
Voters from regions with smaller farms (under 1 hectare) favoured free trade, although only sig-nificantly in 1877. Middle-sized farms seem to have been quite indifferent, as the very low t-statistics show. The large estates with more than 100 hectares have a negative sign, which is highly significant in 1878. According to the regression results, it thus seems that Gerschenkron

23
(1943) was wrong for small farmers tended to vote for free trade. Whether that was rational or not depends, however, on whether one believes the Heckscher-Ohlin and specific factors model arguments that small farmers were harmed by protection, or Webb’s (1982) claim that peasants also gained from protection.
Another result worth mentioning is the strong impact of the share of Catholics on the decision to vote for protection in both elections. The result is driven by the votes for the Centre Party, the political arm of Catholicism, and is not surprising considering the ‘Kulturkampf’ between Bis-marck and the Catholic Church. When the conflict threatened to turn into a defeat for the Chan-cellor, he decided to follow a more moderate course and, in 1878, lifted most sanctions he had imposed in the early 1870s.7 In the ‘Kulturkampf’-period, the Centre Party actually gained power, doubling the number of its voters in 1874. It remained strong until the mid 1880s (Ritter and Niehuss 1980) and attracted Catholics who expressed their support for the Church by voting Centre. Margaret Anderson (1993) found a number of cases where the elections were strongly influenced by the agitation of Catholic priests and she argued that not just priests, but all of Germany’s elites - the mayors of the cities as well as the ‘Landräte’ (district officials) and Junk-ers in the countryside - tried to influence voters and could do so because the imperial election system was not sufficiently protected by secrecy. Gerschenkron (1943) made a similar argument about Junkers forcing agricultural workers to vote for protection. It is likely that Junkers and priests tried to influence voters and that they were successful in some constituencies.
Table 10: Results second stage estimation
(1) (2) Dependent variable Lambda 1877= Share of
voters from the agricul-tural sector that voted for free trade support-
ing parties in 1877
Lambda 1878= Share of voters from the agricul-tural sector that voted for free trade support-
ing parties in 1878 Immigrants 6.413 4.014 (1.94) (1.83) Turnout 0.208 0.411 (2.00)* (3.92)** Share of Catholics -0.276 -0.323 (6.42)** (9.04)** Farm size: less than 1 ha 0.657 0.267 (2.26)* (1.14) Farm size: 20 to 50 ha -0.322 -1.330 (0.12) (0.60) Farm size: more than 100 ha -44.486 -104.283 (0.87) (2.64)** Constant 0.400 0.358 (4.32)** (4.22)** Observations 290 303 R-squared 0.21 0.28
Absolute value of t statistics in parentheses * significant at 5%; ** significant at 1% Source of variables: see text
7 (See for instance Evans 1981)

24
Nonetheless, in the 1878 election voting was by and large consistent with self-interest in that sectoral votes do by and large confirm the prediction of trade models. It is clear, too, that non-economic factors such as religion mattered for a voter’s decision. Even today, it is not unusual for non-economic factors to influence trade policy preferences with variables like patriotism and chauvinism influencing trade policy preferences (O’Rourke and Sinnott 2001; Mayda and Rodrik 2005).
6. Conclusion
Toward the end of the 1870s, Europe began to turn away from the free trade policies which had characterised the middle decades of the century. Germany was one of the first countries to change course, and German tariff policies affected the whole continent. Not surprisingly, there-fore, research has paid considerable attention to political decision-making in Germany, and there is a broad literature that seeks to explain the country’s about-turn in commercial policies, which occurred after 1878.
While this political landslide has been repeatedly studied from a quantitative perspective, prior research, especially on the tariff elections in Germany, suffers from a number of defects. First, it applies methods such as simple logistic regressions, which are not sufficient to explain voting behaviour in general elections. Second, it is exclusively based on data aggregated at a relatively high level.
In this paper I use much more detailed data on the level of constituencies. I further apply King’s (1997) Algorithm with which I generate shares of voters from different occupations that voted for protection or free trade for every constituency, which makes it possible to break down the results for district regions. That allows us to focus on constituencies where the liberals lost their seats in 1878 and to analyse them separately. The analysis changes our picture of what went on between the two elections of 1877 and 1878. In particular, the results contradict Gerschenkron’s (1943) view that change was solely due to new voters from the agricultural sector. He was right that there were large numbers of new voters (around ten percent more) from the agricultural sec-tor, especially in East-Elbian Prussia. But the losses that free-traders suffered to the benefit of protectionists were much higher (around 27 percent). Thus, it was floating voters rather than new voters from the agricultural sector who caused the change.
King’s Algorithm also makes it possible to analyse more closely the characteristics of those agri-cultural voters who turned towards protection. The existing literature has not yet revealed whether agriculture voted as a single block. Schonhardt-Bailey (1998) did provide some evi-dence that the agricultural sector did not vote homogeneously, but she showed this only for con-servative parties. My analysis did yield evidence that small farmers preferred free trade, while farmers owning large estates and workers on these estates favoured protection. This fits well the expectations of both the Heckscher-Ohlin and specific factors models.

25
But a complete answer for why voters in the agricultural sector changed their behaviour in just one year remains elusive and is left to future research. It seems likely that the fact that the second election was more dominated by the tariff question caused the change. Maybe other political di-mensions, which became less important in 1878, biased the result in favour of liberal parties in the election in 1877.
Explaining the political shift in 1878 is all the more important because it provided Bismarck with the conservative majority that he needed in order to diminish the influence of his former liberal allies and to prevent the liberalisation – and ultimately democratisation – of Imperial Germany. Protective tariffs for industry and agriculture were the price the Chancellor paid. The price paid by the country as a whole ultimately proved to be much higher. Behind the protective walls of new tariffs, agriculture retained its huge share in the economy, and this did not bode well for Germany’s development in the later 19th and 20th centuries (Temin 2002).
7. References
Adolph, Christopher, Gary King, Michael C. Herron and Kenneth W. Schott. “A Consensus on Second Stage Analyses in Ecological Inference Models.” Political Analysis 11 no.1 (2003), 86-94.
Anderson, Margaret. L. “Voters. Junker, Landrat, Priest: The Old Authorities and the New Franchise in Imperial Germany.” The American Historical Review 98 no.5 (1993): 1448-1474.
Barkin, Kenneth. D. “The Second Founding of the Reich.” German Studies Review 10 no.2 (1987/79), 219-235.
Benoit, Kenneth., Daniela Giannetti, Michael Laver: “Voters Strategies with Restricted Choice Menus.” In British Journal of Political Science 36 no.3 (2001): 459-485.
Böhme, Helmut. Probleme der Reichsgründungszeit 1848-1879. Cologne, Berlin: Kiepenheuer & Witsch, 1968.
Böhme, Helmut. Deutschlands Weg zur Großmacht: Studien zum Verhältnis von Wirtschaft und Staat während der Reichsgründungszeit 1848-1881. Cologne, Berlin: Kiepenheuer & Witsch, 1972.
Borchardt, Knut. Protektionismus im historischen Rückblick. In Der neue Protektionismus, ed-ited by Armin Gutowski, 17-47. Hamburg: Verlag Weltarchiv, 1984.
Brawley, Michael. R. “Factoral or Sectoral Conflict? Partially Mobile Factors and the Politics of Trade in Imperial Germany.” International Studies Quarterly 41 no.4 (1997): 633-654.

26
Caramani, Daniele. Elections in Western Europe since 1815, The Societies of Europe. New York: Grove, 2000.
Cohen, Jacob and Patricia. Cohen. Applied Multiple Regression/Correlation Analysis for the Be-havioural Sciences. New York: Lawrence Erlbaum Associates 2003.
Dovring, Folke. The Transformation of European Agriculture. In The Cambridge Economic His-tory of Europe, VI, pt. 11: The Industrial Revolution and after, edited by H. J. Habakkuk and Michael Postan (ed.), 604-72, Cambridge: Cambridge University Press, 1965
Evans, Ellen.L. The German Center Party 1870-1933. A Study in Political Catholicism. Carbon-dale: Southern Illinois University Press, 1981
Feree, Karen. “Iterative Approaches to R x C Ecological Inference Problems: Where they can go wrong and one quick Fix.” Political Analysis, 12 no.2 (2004): 143-159.
Freedman, David A., S. Klein, S.A., M. Ostland and M.R. Roberts. “Review of A Solution to the Ecological Inference Problem by Gary King.” Journal of the American Statistical Associa-tion 93 no. 444 1998, 1518-22.
Freedman, David A., S.KLEIN, S.A., M. OSTLAND and M.R.ROBERTS “Response to King’s Comment.” Journal of the American Statistical Association, 94 no. 445 (1999), 355-57.
Gerschenkron, Alexander. Bread and Democracy in Germany, Berkeley: University of Califor-nia Press, 1943.
Gourevitch, P.A. International Trade, Domestic Coalitions, and Liberty: Comparative Responses to the Crisis of 1873-1896. In Historical Foundations of Globalization, edited by James Foreman-Peck, 703-735, Cheltenham, Northampton/MA: Edward Elgar, 1977/98.
Grant, Oliver. Migration and Inequality in Germany 1870-1913. Oxford: Clarendon Press, 2005.
Herron, Michael.C. and Kenneth.W. SHOTTS. “Logical Inconsistency in EI-Based Second Stage Regressions.” American Journal of Political Science 49 no.1 (2004), 690-706.
Hohls, Rüdiger. Der Wandel der regionalen Disparitäten in der Erwerbsstruktur Deutschlands 1895-1970. In Regionen im historischen Vergleich: Studien zu Deutschland im 19. und 20. Jahrhundert, edited by Jürgen Bergmann, 288-413, Opladen: Westdeutscher Verlag, 1989.
Huber, Ernst R. Dokumente zur deutschen Verfassungsgeschichte, Vol. 2: Deutsche Verfas-sungsdokumente 1851-1900. Cologne, Mainz: Kohlhammer, 1986.
Irwin, Douglas. “The Political Economy of Free Trade: Voting in the British General Election of 1906.” Journal of Law and Economics 37 no.1 (1994), 75-108.

27
King, Gary. A Solution to the Ecological Inference Problem. Princeton: Princeton University Press, 1997
King, Gary, Ori Rosen, Martin Tanner, and Alexander F. Wagner. “Ordinary Economic Voting Behavior in the Extraordinary Election of Adolf Hitler.” Journal of Economic History 68 no.4, (2008), 951--996
Klug, Adam. “Why Chamberlain failed and Bismarck succeeded: The Political Economy of Trade Tariffs in British and German Elections.” European Review of Economic History 5 no.2 (2001), 219-250.
Mayda, Anna M. and Dani Rodrick. “Why are some People (and Countries) more protective than Others?” European Economic Review 49 no.6 (2005), 1393-1430.
Melitz, Marc J. “The Impact of Trade on Intra-Industry Reallocation and Aggregate Industry Productivity.” Econometrica 71 no.6 (2003), 1695-1725.
Nipperdey, Thomas. Deutsche Geschichte 1866-1918, vol. 2: Machtstaat vor der Demokratie. München: Beck. 1992/98.
Oncken, Herman. Rudolf von Bennigsen: Ein deutscher liberaler Politiker. Nach seinen Briefen und hinterlassenen Papieren. Stuttgart, Leipzig: Deutsche Verlags-Anstalt, 1910.
O’Rourke, Kevin H and Richard Sinnotts. “The Determinants of Individual Trade Policy Prefer-ences: International Survey Evidence.” Brookings Trade Forum, (2001), 157-206.
Pflanze, Otto. Bismarck and the Development of Germany: The Period of Consolidation. Prince-ton, New York: Princeton University Press, 1990.
Puhle, Hans-Jürgen. Lords and Peasant in the Kaiserreich. In Peasants and Lords in Modern Germany, edited by Robert Moeller, 81-109, Boston: Allen and Unwin, 1981.
Ritter, Gerhard A. and Merith. Niehuss. Wahlgeschichtliches Arbeitsbuch: Materialien zur Sta-tistik des Kaiserreichs 1871-1918. Munich: Beck, 1980.
Rogowski, Ronald. Commerce and Coalitions: How Trade Affects Domestic Political Align-ments. Princeton: Princeton University Press, 1989.
Rosen, Ori, Wenxin Jiang, Gary King and Martin A. Tanner. “Bayesian and Frequentist Infer-ence for Ecological Inference: the R x C case.” Statistica Neerlandica 55 no.1 (2001), 134-156.
Schonhardt-Bailey, Cheryl. “Parties and Interests in the ‘Marriage of Iron and Rye’.” British Journal of Political Science 28 no.2 (1998), 291-332.
28
Schröder, Wilhelm. Handbuch der sozialdemokratischen Parteitage von 1863 bis 1909. Munich: G. Birk & Co, 1910.
Sheehan, James J. Klasse und Partei im Kaiserreich: Einige Gedanken zur Sozialgeschichte der deutschen Politik, In Innenpolitische Probleme des Bismarck-Reiches, edited by Otto Pflanze, 1-24, Munich, Vienna: Oldenbourg, 1983.
Steinbach, Peter. Die Zähmung des politischen Massenmarktes: Wahlen und Wahlkämpfe im Bismarckreich im Spiegel der Hauptstadt- und Gesinnungspresse. Passau: Rothe, 1990.
Temin, Peter. “The Golden Age of European Growth reconsidered.” European Review of Eco-nomic History 6 no.1 (2002), 3-22.
Van Zanden, Jan L. “The First Green Revolution: The Growth of Production and Productivity in European Agriculture, 1870-1914.” The Economic History Review 44 no.2 (1991), 215-239.
Webb, Steven B. “Tariffs, Cartels, Technology, and Growth in the German Steel Industry, 1879 to 1914.” The Journal of Economic History 40 no. 2 (1980), 309-330
Webb, Steven B. “Agricultural Protection in Wilhelminian Germany: Forging an Empire with Pork and Rye.” Journal of Economic History 42 no.2 (1982), 309-326.
Wehler, Hans-Ulrich. Das Deutsche Kaiserreich 1871-1918. In Deutsche Geschichte, Vol. 3: 19. und 20. Jahrhundert 1815-1945, edited by Gerhard Schulz,. 203-404, Göttingen: Vanden-hoeck & Ruprecht, 1973/85.
Wehler, Hans-Ulrich. Deutsche Gesellschaftsgeschichte, Vol. 3: Von der deutschen "Doppel-revolution" bis zum Beginn des Ersten Weltkrieges 1849-1914. Munich: Beck, 1995.

29
Appendix I
This appendix provides some basic goodness of fit diagnostics for the turnout of the agricultural sector.
One major problem that might arise is the ‘aggregation bias’. Aggregation bias occurs if the variation of the parameters J
iβ and Ji−β or J
iλ and Ji−λ in specific areas differ from the general
pattern of the aggregated constituency.
One simple example will clarify this. Assume that on the individual level, turnout of non-farmers systematically exceeds turnout of farmers. Further assume that one can observe a positive corre-lation between the turnout and the share of farmers, if plotted for all constituencies. This implies that, if the proportion of farmers increases, the turnout increases as well. The mistaken ecological inference is that farmers vote at higher levels than non-farmers. If this problem occurs one can use additional variables, which explain the rise in turnout. However, in the data I use I could not observe a systematic relationship between the overall turnout and the share of workers from a specific sector. Figures 1 and 2 show this for the turnout of the agricultural sector in 1878.
Figure 1: Tomography plot for the estimation of beta in the agricultural sector in 1878.
Note: Tomography plot with 95% (outside circle) and 50% (circle inside) maximum likelihood contours superimposed on the deterministic information from the bounds. Each contour represents possible out-comes for Jβ and J−β . The peak of the probability surface is anchored above the highest density of line intersections and represents the point estimate.
Jβ
J−β

30
Figure 2: Relationship between the share of people working in the agricultural sector (x) and overall turnout for every constituency.
The results would be biased if there was a systematic relationship between turnout and x, i.e. Jβ and J
iβ and X. The bias caused is called “aggregation bias”.
There is no observable relationship between the share of people working in the agricultural sec-tor (x) and overall turnout for every constituency, and hence no aggregation bias.
Appendix II
King’s Algorithm is based on Goodman’s regression, which is often used to account for ecologi-cal inference8. Goodman’s regression is loosely based on the following accounting identity:
Equation 1: )1( iJ
iiJ
ii XXT −+= −ββ ,
where iT is the proportion of the voting-age population turning out to vote in constituency i and
iX the proportion of workers employed in sector J working in district i. Jiβ and J
i−β are then
the estimated coefficients for the turnout of the two sectors. Naturally, the differences between the left and right hand sides of Equation 1 should result from purely random effects iε , so that Goodman’s model can be written as:
8 For example, Sperber (1997) used this approach to estimate voting behaviour in nineteenth century Germany
for all parties and groups, in order to provide a general overview about voting behaviour. However, he did not consider trade policy in order to identify or explain the change in 1878.

31
Equation 2: iiJ
iJ XXT εββ +−+= − )1(
The regression is estimated with no constant term and may be estimated with ordinary least squares.
However, Goodman’s regression does not produce estimates of Jiβ and J
i−β unless they are the
same for all constituencies, which presumably they are not. It also does not include information from the method of bounds, which accounts for the basic information that the parameters of in-terest are proportions and thus can only range between zero and one. This is the problem that can lead to unrealistic results, such as where more than a hundred percent of a certain group of voters are estimated to have voted for a certain party.
King’s algorithm overcomes the limitations of Goodman’s regression. For the purpose of this paper, I just give a brief outline of its main features. The interested reader is referred to King (1997) where the algorithm is discussed in full.
King’s solution has two central characteristics. The first is the probability model used to describe the disaggregated quantities of interest. In this model, J
iβ and Ji−β follow a truncated bivariate
normal distribution as follows:
Equation 3: )()/,( ψββ (Ai
Ji
Ji TBNx ≈− ,
where [ ] [ ]1,01,0 xA = is the domain of truncation, meaning that the quantities of interest range between 0 and 1. The vector ψ( contains the parameters (means, variances and correlation coef-ficients) of the original, untruncated bivariate normal distribution. Note that ),....1( lixi = , which is the vector including the shares of voters from sector J in constituency i for all constituencies, is taken as given. It is assumed that J
iβ and Ji−β are independent of ix , which implies that ag-
gregation bias is absent.
The second feature of King’s approach is the strict adoption of the accounting identity shown in equation 1. King used this identity as an integral part of his model structure, which establishes a link between the disaggregate and aggregate quantities. Together with the additional assumption of spatial independence between the observations, this allowed King to derive the distribution of
iT , say )/( ψ(itp , and the likelihood function based on the aggregate data:
Equation 4: ( )∏=
==P
iii tptpL
1
/)/()( ψψψ (((
where t is a vector of observed aggregate proportions, as defined above. Given this, King was also able to derive the predictive distributions of the betas, )/( ,ψ
(i
Ji tbp for sector J and
)/( ,ψ(
iJ
i tbp − for all other sectors, each being a univariate, doubly truncated normal distribution.
The EI predictions derived with this method consist of the means of those distributions with the parameters ψ( evaluated at their maximum likelihood valuesψ̂( , as follows:
Equation 5: ∫===
bi
Wi
U
L
Ji
Ji
Jiii
Ji
Ji dbtbpbtTBEtb )ˆ;/()ˆ;/()(ˆ ψψ (( ,

32
∫ −−−−− ===
bi
Wi
U
L
Ji
Ji
Jiii
Ji
Ji dbtbpbtTBEtb )ˆ;/()ˆ;/()(ˆ ψψ ((
Equation 6 = )(11
tbx
xx
t bi
i
i
i
i
−−
−
where iU is the upper bound and iL the lower bound.
Under a Bayesian statistics perspective, a prior distribution )(ψ(p for the parameters can be used, and the predictive distributions in equations 5 and 6 have to be replaced by )/( tbp J
i and )/( tbp J
i− , respectively.
King adopted a maximum likelihood function, which is implemented in his and Benoit’s (2003) programs EI and EzI. Five intermediate parameters are estimated (i.e. two means, two standard deviations and a correlation that makes the vector ψ( ). The parameters are then transformed and rescaled. Values of these parameters are drawn from the posterior distributions using importance sampling. The means of the distributions of J
iβ and Ji−β are used as point estimates, and stan-
dard errors are based upon the variation in the simulated values. This is the intuition. See section III of King (1997) for a complete description of the method.

33
Preprints 2009
2009/33: Hakenes H., Schnabel I., Credit Risk Transfer and Bank Competition
2009/32: Jansen J., Beyond the Need to Boast: Cost Concealment Incentives and Exit in Cournot Duopoly
2009/31: Fellner G., Sausgruber R., Traxler C., Testing Enforcement Strategies in the Field: Legal Threat, Moral Appeal and Social Information
2009/30: Lüdemann J., Rechtsetzung und Interdisziplinarität in der Verwaltungsrechtswissenschaft
forthcoming in: Öffentliches Recht und Wissenschaftstheorie, Tübingen, Mohr Siebeck, pp. 125-150, In Press.
2009/29: Engel C., Rockenbach B., We Are Not Alone: The Impact of Externalities on Public Good Provision
2009/28: Gizatulina A., Hellwig M., Informational Smallness and the Scope for Limiting Information Rents
2009/27: Hahmeier M., Prices versus Quantities in Electricity Generation
2009/26: Burhop C., The Transfer of Patents in Imperial Germany
2009/25: Burhop C., Lübbers T., The Historical Market for Technology Licenses: Chemicals, Pharmaceuticals, and Electrical Engineering in Imperial Germany
2009/24: Engel C., Competition as a Socially Desirable Dilemma Theory vs. Experimental Evidence
2009/23: Morell A., Glöckner A., Towfigh E., Sticky Rebates: Rollback Rebates Induce Non-Rational Loyalty in Consumers – Experimental Evidence
2009/22: Traxler C., Majority Voting and the Welfare Implications of Tax Avoidance
2009/21: Beckenkamp M., Engel C., Glöckner A., Irlenbusch B., Hennig-Schmidt H., Kube S., Kurschilgen M., Morell A., Nicklisch A., Normann H., Towfigh E., Beware of Broken Windows! First Impressions in Public-good Experiments
2009/20: Nikiforakis N., Normann H., Wallace B., Asymmetric Enforcement of Cooperation in a Social Dilemma
forthcoming in: Southern Economic Review, In Press.
2009/19: Magen S., Rechtliche und ökonomische Rationalität im Emissionshandelsrecht
2009/18: Broadberry S.N., Burhop C., Real Wages and Labour Productivity in Britain and Germany, 1871-1938: A Unified Approach to the International Comparison of Living Standards
2009/17: Glöckner A., Hodges S.D., Parallel Constraint Satisfaction in Memory-Based Decisions
2009/16: Petersen N., Review Essay: How Rational is International Law?
forthcoming in: European Journal of International Law, vol. 20, In Press.
2009/15: Bierbrauer F., On the legitimacy of coercion for the financing of public goods
2009/14: Feri F., Irlenbusch B., Sutter M., Efficiency Gains from Team-Based Coordination – Large-Scale Experimental Evidence
2009/13: Jansen J., On Competition and the Strategic Management of Intellectual Property in Oligopoly
2009/12: Hellwig M., Utilitarian Mechanism Design for an Excludable Public Good
published in: Economic Theory, vol. 2009, no. July 14, Berlin/Heidelberg, Springer, 2009.
2009/11: Weinschenk P., Persistence of Monopoly and Research Specialization
2009/10: Horstmann N., Ahlgrimm A., Glöckner A., How Distinct are Intuition and Deliberation? An Eye-Tracking Analysis of Instruction-Induced Decision Modes
2009/09: Lübbers T., Is Cartelisation Profitable? A Case Study of the Rhenish Westphalian Coal Syndicate, 1893-1913

34
2009/08: Glöckner A., Irlenbusch B., Kube S., Nicklisch A., Normann H., Leading with(out) Sacrifice? A Public-Goods Experiment with a Super-Additive Player
forthcoming in: Economic Inquiry, In Press.
2009/07: von Weizsäcker C., Asymmetrie der Märkte und Wettbewerbsfreiheit
2009/06: Jansen J., Strategic Information Disclosure and Competition for an Imperfectly Protected Innovation
forthcoming in: Journal of Industrial Economics, In Press.
2009/05: Petersen N., Abkehr von der internationalen Gemeinschaft? – Die aktuelle Rechtsprechung des US Supreme Court zur innerstaatlichen Wirkung von völkerrechtlichen Verträgen –
forthcoming in: Völkerrecht im innerstaatlichen Bereich, Vienna, facultas.wuv, In Press.
2009/04: Rincke J., Traxler C., Deterrence Through Word of Mouth
2009/03: Traxler C., Winter J., Survey Evidence on Conditional Norm Enforcement
2009/02: Herbig B., Glöckner A., Experts and Decision Making: First Steps Towards a Unifying Theory of Decision Making in Novices, Intermediates and Experts
2009/01: Beckenkamp M., Environmental dilemmas revisited: structural consequences from the angle of institutional ergonomics, issue 2009/01
Preprints 2008
2008/49: Glöckner A., Dickert S., Base-rate Respect by Intuition: Approximating Rational Choices in Base-rate Tasks with Multiple Cues
2008/48: Glöckner A., Moritz S., A Fine-grained Analysis of the Jumping to Conclusions Bias in Schizophrenia: Data-Gathering, Response Confidence, and Information Integration
2008/47: Hellwig M., A Generalization of the Atkinson-Stiglitz (1976) Theorem on the Undesirability of Nonuniform Excise Taxation
2008/46: Burhop C., The Underpricing of Initial Public Offerings in Imperial Germany, 1870-1896
forthcoming in: German Economic Review, In Press.
2008/45: Hellwig M., A Note on Deaton's Theorem on the Undesirability of Nonuniform Excise Taxation
forthcoming in: Economics Letters, In Press.
2008/44: Hellwig M., Zur Problematik staatlicher Beschränkungen der Beteiligung und der Einflussnahme von Investoren bei großen Unternehmen
published in: Zeitschrift für das gesamte Handelsrecht und Wirtschaftsrecht, vol. 172, pp. 768-787, 2008.
2008/43: Hellwig M., Systemic Risk in the Financial Sector: An Analysis of the Subprime-Mortgage Financial Crisis
published in: De Economist, no. 16.07.2009: Springer US, 2009.
published in: Jelle Zijlstra Lecture, no. 2008/5, Wassenaar, NL, Netherlands Institute for Advanced Study in the Humanities and Social Sciences, Institute of the Royal Netherlands Academy of Arts and Sciences, pp. 100, 2008.
2008/42: Glöckner A., Herbold A., Information Processing in Decisions under Risk: Evidence for Compensatory Strategies based on Automatic Processes
2008/41: Lüdemann J., Magen S., Effizienz statt Gerechtigkeit
forthcoming in: Zeitschrift für Rechtsphilosophie, In Press.
2008/40: Engel C., Die Bedeutung der Verhaltensökonomie für das Kartellrecht