the future of the higher education enterprise: william
TRANSCRIPT

THE FUTURE OF THE HIGHER EDUCATION ENTERPRISE:
RESEARCH UNIVERSITIES TODAY AND TOMORROW, A COMPUTATIONAL APPROACH
William Rouse, John V. Lombardi, and Diane D. Craig
INTRODUCTION
Since at least the second world war, the top American research universities, both public and private,
have enjoyed remarkable success, not only in capturing significant shares of the federal dollars
available to support research but also in expanding their influence and significance within the context
of American higher education. This success is reflected today in multiple ways from the growing
undergraduate population seeking admission to these institutions to the prestige conferred by multiple
ranking publications of varying methodological quality.
Yet over the past decades, as the financial circumstances of all colleges and universities have changed,
with declining public tax-based support, increased tuition and fee structures, complex tuition
discounting programs, sophisticated need-based financial aid mechanisms at the state and federal
levels, accelerating costs of institutional operations, and competition for fee-paying international
students, some worry that the research enterprises of these institutions may be at risk.
In addressing these issues, it is important to emphasize that American higher education is composed of
quite distinct sectors. While they may have fuzzy boundaries, they are nonetheless substantially
different in their organization, personnel composition, financial structures, opportunities, and
expectations. Each of these sectors will respond to the current and likely future financial and
demographic constraints by readjusting their operational models to meet changing public and private
expectations in significantly different ways. Some will reconfigure their activities to acquire the
efficiencies of sophisticated technologies and generate revenue by capturing currently under-served
populations with low cost high volume enterprises. The traditional model of tenured professors
defining the substance of the academic enterprise is already seriously modified at many institutions
below the most prestigious and the ability of many universities to sustain a significant research
presence will decline. Demographic trends will also have an impact although the National Center for
Education Statistics (NCES, 2017) projects continued stability and growth in the college age population
through 2025.
In any event, over time, the current higher education marketplace will continue to evolve into distinct
operational sectors following different priorities (whatever their public relations rhetoric), with
considerable turmoil at the boundaries. A wide range of quantitative indicators illustrate how much of
that transformation is already well underway, even though the process is obscured by a media focus on
elite institutions competing for small advantages among themselves.
THE CURRENT UNIVERSITY CONTEXT
Within this context, and over the past twenty years or so, the top American research universities have
continued their dominance of the upper end of the higher education spectrum. The current model as
described here is likely sustainable in the short term. Those already among the top 150 to 200
institutions, and especially those in the top 50 or so, will continue to prosper although those below the
top members of this group may find it increasingly difficult to continue to keep pace with the highest
producers. The successful research institutions' faculty will remain highly tenured and predominately
full-time although we may see various types of rolling term contracts for faculty in some fields.
Moreover, it is possible that the context for major fund raising, a critical element in the financial
structure of all major research universities, will encounter political difficulties as state and national
legislators seek revenue by eliminating various tax deductions that have benefited research universities.
Although not the focus of this essay, another group of primarily public, comprehensive universities
with some significant research presence will survive by diversifying into a wide range of occupational,
masters, and technology enabled programs. They will have substantial undergraduate programs,
extensive masters and certificate programs, and many professional programs. They will sponsor
research in some areas but not at the intensity of the top universities. Their faculty will become more
heavily contingent with the development of a variety of term contract faculty arrangements, in most
cases developed through extensive negotiations with unions. We have modeled the future options for
these and other institutional groups elsewhere. (Rouse, 2016)
A group of smaller public and private institutions will struggle to maintain sufficient enrollment to
prosper. They will expand into masters and certificate programs, seek economies with extensive
outsourcing of a wide range of university services, and continue the trend to increasingly contingent
faculty. They will experiment with various tuition/fee arrangements with discounting and financial aid
processes. Some private institutions in this group may fail and close or be absorbed by competitors, but
the public institutions on the margin will more likely be consolidated into larger system entities rather
than disappear, as they remain protected by the local political requirements of their states.
A special category of small prestigious and heavily endowed private colleges will continue to prosper
with an emphasis on highly qualified tenured faculty, elaborate programs and facilities, and high
demand from students. These elite institutions will also continue to compete with the top research
universities (public and private) for the most qualified undergraduate students. Many will also develop
masters programs in many areas to increase the yield from tuition dollars.
These categories will be very confusing at the boundaries, and many institutions will compete partially
in one category and partially in another. However, in every case, the American higher education
marketplace is likely to continue the trend that emphasizes the spread between elite institutions and
non-elite institutions, between primarily academically and primarily occupationally centered
institutions. Throughout, the controversies over elitism, diversity, inclusion, employability, and cost
will remain a constant subtext in all discussions about the US higher education industry. The continued
improvement in the quality and operational integrity of online educational systems will also siphon off
a significant population and the revenue associated with the education of adult students, individuals
seeking employment-related post baccalaureate skill certifications, and international students pursuing
American content without the necessity of travel and residence abroad.
Most of our work on university behavior is based on two perspectives. The first uses historical data to
identify long-standing trends in the performance of institutions, anticipating that past behavior will be
the best predictor of future behavior. This has been the underlying perspective of the Center for
Measuring University Performance (MUP) project and is reflected in the paper provided the Sackler
Colloquium of the National Academy of Sciences (Lombardi, et al., MUP, 2000-2016; Lombardi,
Craig, 2017) The second, recognizing recent trends in marketplace behavior, the shifts in institutional
finance and staffing, and the critical commentary of many observers, projects dramatic transformations
that will radically restructure the academic marketplace over a period of no less than twenty years. This
is the perspective of the dynamic mathematical models presented in Rouse (2016).
By connecting these perspectives within the same frame (a historical view contributing to the
prospective mathematical model) we can offer a systematic exploration of the possible impact of
changes in fundamental university behavior using a multivariable simulation that demonstrates the
links between the various elements in the financial and operational model of universities. We can
speculate about the impact of tuition increases, rising cost of pursuing first rank research faculty and
the grants that sustain them, and other elements associated with the teaching and research activities of
these institutions. With a multivariable model, we can test some of our assumptions about how
universities can respond to the changes anticipated in the higher education marketplace and assess the
consequences of one or another or many changes in the elements that drive the costs, revenue, and
results of institutional activity. Elsewhere, we have developed this model in a generalized form to
address the entire higher education marketplace from occupationally oriented institutions through
research centric institutions and projected the likely results of a twenty-year forward look.
MODELING THE COMPETITION AMONG TOP RESEARCH UNIVERSITIES
Here, however, we focus on the top level of research universities, those institutions that in many ways
establish the quality and prestige markers that define a university brand emulated in one form or
another by other higher education enterprises. While there is always risk in projecting out twenty years,
our historical perspective has demonstrated the remarkable stability of the current research university
environment over the two decades, leading us to have some confidence that the elements that sustain
the research university model are likely to remain more or less the same over time even if the rates of
change in these elements and the impact of anticipated changes will surely vary.
To frame this exercise, we need to emphasize that today and twenty years from now, university
research, and especially scientific research, with few exceptions, will remain an institutional loss
leader. The revenue generated by research grants and contracts does not pay for the costs of producing
the research. Indirect costs exceed any external reimbursement, and a wide variety of other research
support provided by the university, whether for released time from teaching, unfunded facility,
equipment and personnel costs, or institutionally supported research work, receives no external
funding. In a resource-constrained environment, some observers worry that the financial model that has
supported the current scale of America's dynamic and productive research university environment
cannot continue.
However, even if the data may indicate that research generates an increasing net cost to institutions, it
may not follow that all current research universities will reduce their commitment to research in pursuit
of a more economically rational model of institutional finance. The most successful research
universities, moreover, compete not to get rich but rather to generate the funds needed to accumulate
the highest level of quality elements within their institutional boundaries as possible. This, in our
model, translates into brand value. These institutions are relatively less interested in the external
marketplace for their goods and services except as a venue for acquiring the resources to continue
expanding their internal quality and sustaining their brand.
Indeed, this pursuit of brand value within the research university model deserves more attention than it
usually receives. These institutions function as quality engines, that is they operate to capture the
largest amount of nationally competitive quality elements within their institutional boundaries. These
quality elements include students, faculty, staff, facilities, and programs, but above all they seek to

acquire research faculty and associated personnel. Research capable faculty bring with them or attract a
wide range of other quality assets, whether graduate students, competitive grants, research publications,
post-docs, or high-level scientific staff. Because these high performing faculty are in short supply
relative to the demand from many research-competitive institutions for their services, they can
command a significant university investment. This investment is less about salaries or individual
faculty compensation and more about the facilities, the support personnel, the institutional research
infrastructure, and the availability of related high quality faculty and programs. The prestige and
significance, the brand value, of any research university is the result of the cumulative impact of these
high performing people supported by the infrastructure and research-related personnel of the
institution. (Lombardi et al., MUP, 2000-2016)
INDICATORS OF RESEARCH UNIVERSITY SUCCESS
For this reason, a primary indicator of research university success has generally been the annual
federally sponsored science and engineering research expenditures. This number is useful for this
purpose not because it reflects a monetary accounting unit but because it reflects the cumulative
research activity funded through the national peer review process of the various federal funding
agencies. Annual federal expenditure data is a particularly useful indicator, as opposed to federal
research awards, because it reflects one year of direct and indirect billed activity on a federal research
grant. It is also something of a general proxy for the scale of institutional investment required to sustain
that level of federal research activity. This funding model for American research activity has some
consequences for the way research institutions operate.
The model is based, in simplified terms, on a competition that pits individual faculty research proposals
against each other in a peer reviewed context. These proposals are not institutional proposals but
individual faculty proposals (although of course they all carry a substantial component of institutional
support that underlies the quality and strength of the proposal). The awards when they come are
primarily faculty awards, although they may have a wide range of linked institutional commitments. In
practice of course, many individual proposals have multiple faculty participants, may well involve
individuals from a number of institutions in a collaborative framework, and can include linkages to
corporations or other outside entities. Nonetheless, the core competencies that drive the success of the
research university are the high performing faculty whose records of achievement and whose
reputations validate the likelihood of a successful research result from the funding proposed.
This model places a significant burden on the research university that must recruit and retain nationally
significant faculty in order to build the capacity to compete successfully in the peer review process for
the national grants that define research university success. The institution's investment is, in many
cases, a high-risk investment because while it may be advantageous to recruit faculty who already have
federally-funded research grants, the marketplace does not offer a sufficient number of these
individuals to meet the demand, and as a result institutions must also recruit younger promising faculty
whose work offers the expectation of a successful research career. Sometimes the promise is fulfilled,
and sometimes it is not, so the institutional investment in promising high performing faculty carries a
significant risk.
Research universities cover this risk in a number of ways. The most obvious is through the tenure
process that attempts over a relatively short window of time to identify which newly hired faculty
members will have the greatest likelihood of continued long-term future research success. Those that
pass this review are deemed to be more likely to have a significant long-term competitive research
career than those who do not pass. While this process lowers somewhat the risk associated with hiring
and supporting a particular faculty member, the time for decision is short, perhaps five years, so some
significant risk remains. This risk is covered in a variety of ways by institutions, depending on their
circumstances.
In institutions with substantial undergraduate populations, teaching and other functions associated with
extensive undergraduate and masters or certificate programs provide a useful occupational niche for
faculty whose research potential may not have reached or no longer can be sustained at the anticipated
level of productivity. By shifting faculty effort from research to teaching and other institutional support
activities, high quality faculty whose competitive research strengths are not quite up to the national
level, remain productive and their cost compensated by the work done on behalf of the undergraduate,
masters, or certificate programs. Moreover, once removed from the external research competition, the
institutional research support costs associated with a former research faculty member now focused on
teaching or some other task can be reallocated elsewhere.
This model is particularly relevant for the large public research universities whose research
accomplishments have elevated many of them into the top levels of national and international
competition. The size of the undergraduate student body and the growth of profitable masters and
certificate programs serve public universities as a buffer against the risk associated with providing
tenure to faculty candidates early in their research careers. Large undergraduate and pre-doctoral
student populations in public universities also provide other advantages. While tuition and fee revenue
for undergraduates generally do not pay for the full cost of their education, in most states, public
funding tends to be driven by calculations closely related to student credit hours or their derivatives. In
addition, since institutions rarely discount master’s or certificate tuition and fees, these programs more
than pay their own way. Some infrastructure and other operating costs of the institution, subsidized by
the undergraduate and non-PhD graduate student economy, also subsidize research infrastructure,
whether related to buildings, core support of energy costs, basic accounting and other business services,
security, legal, technology, and the like. The larger the university budget from all sources, the better
able the institution will be to support the special costs of sustaining highly competitive research faculty.
In short, the current research model seeks out all types of revenue to create a financial base capable of
sustaining the substantial unfunded costs of highly competitive research faculty, staff, and facilities.
This university quality engine, fueled by this financial base, seeks to acquire the highest level and
volume of quality within its boundaries to define its brand value. It uses this brand to attract students,
faculty, alumni, donors, granting agencies, foundations, and others to participate in and with the
accumulated quality. These people engage primarily to participate in various ways with the quality
assembled inside the boundaries of the institution. They individually receive various intellectual, social,
or personal benefits derived from the institutional brand unique to each participant's needs and
interests, and they use these primarily intangible benefits to enhance their own marketability or
significance outside the university.
CONCENTRATION OF RESEARCH PERFORMANCE
Recognizing the many changes and much innovation taking place throughout American higher
education, a retrospective review of the performance of highly competitive research universities
nevertheless shows a remarkably stable profile. In our paper for the National Academy Modeling and
Visualizing Science and Technology Developments (Lombardi, Craig, 2017) we identified 160
universities (public and private) with over $40 million in federal science and engineering expenditures
in 2014. This group, represents about 19% of the academic institutions spending federal research funds
and captures about 92% of the federal research expenditures reported by all these institutions (Table 1).

This relationship with minor variations has remained stable for over a decade and a half. However, it is
important to recognize that this definition of the top institutions is broad, the elite in this sector, some
50 perhaps, would show even more concentrated performance characteristics.
Institutions
Reporting Any
Federal Research
in Past Five Years 2014
(in 000s)
Percent
Share 2010
(in 000s)
Percent
Share 2006
(in 000s)
Percent
Share 2002
(in 000s)
Percent
Share
Total Federal
Research $36,882,439 $36,385,772 $29,971,148 $21,730,593
Over $40M
Group $33,750,559 92% $32,942,353 91% $27,123,421 90% $19,699,893 91%
Number of
Institutions with
Federal Research 856 735 658 623
Over $40M
Group 160 19% 158 21% 150 23% 125 20%
Note: Over $40M Group based on 2014 federal research expenditures.
Table 1. Federal Research
This stability is all the more remarkable given the many innovations and changes that have
characterized the instructional and financial context of all of American higher education. Research
universities constitute a special category among the many components of the American post-secondary
marketplace. Their significance and visibility sometimes appears much greater than their participation
levels in many parts of the higher education marketplace. For example, out of the 2,285 four-year
higher education institutions (excluding for-profit enterprises), the top group of 160 research
universities in our data used for this discussion constitutes only 7% of the institutions and enrolls
roughly 3.5 million students, representing only about 18% of the 20.2 million students enrolled at all
levels of public and private, nonprofit 4-year institutions. However, because they represent a highly
visible and exceptionally prestigious cluster of universities, many capturing exceptional visibility
through their intercollegiate sports programs, and because their doctoral programs produce a constant
stream of instructors and faculty throughout the higher education industry, what takes place on these
campuses often dominates the public conversation about higher education. (Lombardi, Craig, 2016)
There are many ways to highlight the historical stability of these research universities, and to recognize
their long-standing significance within the postsecondary marketplace. The model of research
university success that focuses on the capture of federal and other research dollars, the acquisition of
highly qualified and productive faculty, and the development of other related assets, encouraged us to
review the performance of the top research institutions over time to illustrate their success in
maintaining their preeminence and brand value.
For this illustration we have taken our top group of academic research institutions in 2014 (defined by
MUP as those with over $40M in annual federal research expenditures) and looked back in time to see
if their dominant position remained stable over the last decade or so when much of the current
conversation about institutional transformations and the restructuring of the academic marketplace has

taken place. We compare the performance of these 160 institutions, tracked back at intervals through
2002 on our measures, to the 968 institutions that spent any federal research funds within a five-year
period between 2014 and 2010.
In our data we start with federal research expenditures as reported by NSF and adjusted by the MUP
staff to ensure a single-campus comparison. In recent years, NSF guidelines have more closely matched
our definition of single campus institutions for reporting purposes, thereby reducing the number of
adjustments we needed to make.
Total research expenditures include both federal and non-federal funds (state and local and other
sourced expenditures reported by institutions, some of which are peer reviewed and some of which are
not). These resources reflect a larger pool of funds and their distribution offers a profile similar to the
more competitive federal research expenditures. However, over time, the percent share of total research
expenditures captured by the top institutions has declined from 25% in 2002 to 18% in 2014, likely the
result in part of intense competition from less research-intensive institutions with good access to local
and state funds and an increase in the number of institutions from which data are collected.
Because a strong institutional financial base is necessary for the support of highly competitive research
universities, we have used endowment assets as a proxy for institutional wealth. This is of course only
an indicator since a number for the true wealth of institutions is exceptionally difficult to acquire in any
consistent or comparable fashion. Nonetheless, this indicator offers an illustration of the ability of these
institutions to capture a strong position within the domain of private fund raising for endowment at a
steady 75% of all endowment assets recorded for institutions that participate in the research
marketplace despite making up only about one-fourth of the research university population (Table 2).
Not surprisingly, the data on annual giving shows a similar pattern.

Institutions
Reporting
Any Federal
Research in
Past Five
Years 2014
(in 000s)
Percent
Share 2010
(in 000s)
Percent
Share 2006
(in 000s)
Percent
Share 2002
(in 000s)
Percent
Share
Total
Endowment $483,957,113 $328,020,065 $318,622,750 $208,412,844
Over $40M
Group $363,771,585 75% $245,603,049 75% $238,511,192 75% $152,042,508 73%
Number of
Institutions
Reporting
Endowment 697 687 661 644
Over $40M
Group 155 22% 155 23% 150 23% 152 24%
Total Annual
Giving $30,109,989 $22,665,967 $22,021,068 $18,736,552
Over $40M
Group $23,274,769 77% $16,940,366 75% $16,014,245 73% $13,875,345 74%
Number of
Institutions
Reporting
Annual Giving 621 639 630 615
Over $40M
Group 153 25% 153 24% 144 23% 148 24%
Table 2. Endowment and Annual Giving
Faculty quality is another indicator of research university competitive success. While it is difficult to
identify fully reliable measures of the achievements of university faculty in a comparative context, we
have two indicators that serve to highlight the concentration of nationally recognized faculty in
research institutions. One is the number of National Academy members in each institution. National
Academy members are heavily concentrated in the top research group as we might expect. A steady
proportion of 97% of the National Academy members are in the over $40M group, although only 69%
of the institutions in this group have faculty with these distinctions. This is a reflection of the
concentration of National Academy members in a small number of institutions. About half of these
individuals are in the 14 institutions that have more than 100 National Academy members.
A second faculty indicator includes faculty who have received a variety of scholarly awards, outlined in
detail on the MUP website and in the annual publication (Lombardi, et al., 2000-2016). These awards
are for distinction in a wide range of fields, not just those in the sciences and engineering. Again, the
over $40M institutions capture around 80% of the faculty awards even though they represent only 38%
of all institutions having faculty with these awards. Of particular note here, 259 institutions not in the
over $40M group nonetheless have high quality faculty who win these awards, an indicator of the
common recognition of faculty quality as a brand value enhancer at all levels of university education.

These indicators of quality concentration within the top research institutions focus primarily on
elements associated with what we could call the published research enterprise. That is, the activities of
the university's people that end up as published books and articles contributing to the advancement of
knowledge. Much of that is identified by the proxy of federal research and other elements associated
with the faculty who are the primary drivers of this work. At the same time, however, these institutions
sustain undergraduate enterprises, often of large size, and compete with other research institutions as
well as liberal arts colleges for outstanding students. Again, data on the quality of students is elusive,
but the selectivity of colleges is often linked to the scores on the SAT or its equivalent. While of course
the SAT has many defects as an indicator of likely undergraduate student success it does serve as a
surrogate indicator of institutional undergraduate selectivity, in its own way another reflection of brand
value.
In our observation of research universities it appears likely that many high performing research faculty
and staff not only seek institutions that can support their research ambitions but likely prefer to
participate in the life of institutions with high quality students. A review of the differential
attractiveness of research universities for high SAT students demonstrates that the research university
brand advantage for recruiting high quality students is relatively less impressive, as many colleges with
minimal research profiles but high brand value based on faculty quality and undergraduate elite
characteristics nonetheless capture a significant number of high SAT applicants. The over $40M group
has an SAT advantage of only 140 points over institutions outside this group, a premium of around
13%. Not all universities that fall into our group of research institutions require or provide SAT data, so
these numbers should only be taken as general indicators.
Scale is an important element underlying research university success, in large part because sufficient
scale helps spread the costs of research support and infrastructure over a larger number of projects,
faculty, and research programs. Many research institutions have significant undergraduate student
bodies whose numbers through tuition, fees, state support, and alumni commitment drive resources and
support the teaching and other work associated with instruction that often provide an employment
buffer for faculty whose research productivity may have declined but whose intellectual vitality
remains strong. In many cases, as well, research faculty with highly successful programs and full
funding nonetheless teach students at the undergraduate and graduate level, and offset some costs
associated with their faculty salaries.
The top research universities have over a third of the undergraduate and graduate students enrolled in
all the institutions with any federal research expenditures. These top institutions have a somewhat
lower percentage of undergraduates than the entire group, but a higher percentage of graduate students.
However, the top research universities have about three times the median size of undergraduate
population and about four times the median size of graduate population than the group as a whole.
Reflecting this emphasis on graduate education, the top institutions in the over $40M group produce the
smallest percentage of associate degrees, over a third of the bachelor's degrees, almost half the master's
degrees, just over half the professional degrees, and over three quarters of the doctorate degrees. Since
the over $40M group is just under one-fifth of the institutions included in this illustration, it is clear that
they make a major impact on the degree production of all institutions with any participation in the
federal research competition.
MODELING THE RESEARCH UNIVERSITY INTO THE FUTURE

These illustrations highlight the distinctiveness of the top American research universities within the
context of the US higher education marketplace. They help us understand that general concerns about
the trends and transformations affecting postsecondary schooling do not necessarily affect all
institutions in the same way. Some vulnerabilities highlighted in the popular press do not apply to these
institutions while other concerns have a much larger impact.
Major research institutions, while at little risk of failure, and operating stable competitive enterprises,
struggle constantly with the challenge of maintaining the scale of their operations through continuous
adjustments on the margin. They engage in constant innovation, pursue opportunities of every kind
made available by expanding technological capabilities, seek economies in operation through
outsourcing, pursue revenue opportunities wherever they can be found, and constantly adjust their
undergraduate programs to continue to capture the best possible students while expanding the diversity
of their student bodies.
Taken as productive organizations, research universities manage a wide range of product lines of
dramatically varying profitability. Some generate net costs to the institution such as research and, for
most institutions, intercollegiate sports. Some generate profits for the college such as undergraduate
enrollment for public institutions with state funding and significant alumni support, stock market
returns for public and private universities, and private fund raising for all institutions. Of the
characteristics that define these institutions, their resiliency over the years in the face of financial
challenges is perhaps one of the most interesting. A rational model of university operation that focused
on return on investment or some other measurable utility function derived from commercial business
enterprises would surely underestimate the value of the intangible products of the institutions that help
explain their long-term behavior. This intangible element is captured by what we call brand value. It is
possible that the stress of the current financial condition of American higher education will change the
commitment to research that currently characterizes many institutions, but how these changes will
produce a major re-framing of the American higher education marketplace is not yet clear.1
A COMPUTATIONAL MODEL FOR RESEARCH UNIVERSITIES
Even though we can be reasonably confident that our retrospective model of research university
behavior and success is a stable and effective representation of the competitive context, no one is
certain that what has worked so well for the past twenty years will continue, with only minor
variations, for the next twenty years. To test some assumptions about the interrelationship of many
elements in the research university model, we offer (summarized in Figure 1) a computation model for
research universities elaborated in great detail in a recent book (Rouse, 2016).
This model is based on a thorough analysis of a wealth of data pertaining to the various aspects of a
university enterprise. This includes sources of funding, alternative publication outlets, predictors of
brand value (and hence rankings), workforce structure, administrative practices, and the like.
In this model, student applications are driven by tuition and brand value2. Accepted students who
enroll, as well as continuing students, determine needs for classes and faculty members to teach these
1 This discussion is based on a paper presented by Lombardi and Craig to the Sackler Colloquium of the
National Academy of Sciences in 2017, which contains extensive notes and references related to these topics. 2 The various assertions in this section are fully supported by many sources cited and data compilations presented in Rouse (2016).

classes, which drives the costs of teaching. Tenure track (TT) faculty members need to pursue research
to achieve tenure and promotion. They need to write proposals to attract funding for their research.
Figure 1. Computational Model of a Research University
The research activities of TT faculty members result in publishing research articles, which are
eventually cited and, over time, increase faculty members’ h-index, that is the number of articles cited
at least h times. The combination of articles published, citations of these articles, and h-index, over
time, provides an estimate of brand value, which correlates closely with an institution’s rankings. This
estimate is not a monetary value, but rather a composite performance indicator.
This is all complicated by several phenomena (Rouse, 2016). Research funding is increasingly
competitive, with funding decreasing relative to a steadily increasing number of proposals. Publication
is increasingly competitive, with opportunities very constrained relative to a steadily increasing number
of submissions. The result is faculty members have to work harder to achieve less success.
The tsunami of competitors is willing to do almost anything to succeed. They will serve long
appointments in poorly paid postdoctoral positions with a 15% chance of securing tenure track
positions. They will work diligently to produce 10, 15 or 20 journal articles before applying for a
tenure track position. In contrast, when the current senior generation was at that stage of their careers,
they had few if any publications.
Revenue in this model comes from tuition, research grants, and endowment earnings. Costs include
those for teaching, research, administration, and overhead. Projections of revenues and costs yield
model outputs including various financial metrics plus number of students and brand value. Users of
the model are interested in the impacts of various inputs on these model outputs.
Inputs include number of schools and departments per university, which have a strong impact on
administrative costs. Endowments and tuition strongly affect revenues. Overhead rates affect the
portion of grants that can be used for general expenses rather than direct support of research. The
discount rate that reflects the cost of money affects projections of the net present value3 (NPV) of the
3
Costs• Teaching• Research• Admin• Overhead
Revenue• Tui on• Research• Endowment
Students• Undergrad• Graduate
Outputs• TotalRevenue• TotalCosts• Surplus/Deficit• TotalStudents• CostPerStudent• Brandvalue
Faculty• TotalClasses• TTFaculty• NTTFaulty• FacultyCosts
Inputs• No.Schools• No.Depts.• Endowment• Tui on• PercentTT• Overhead• DiscountRate
Research• Proposals• Ar cles• Cita ons• h-index
Applica ons• Undergrad• Graduate• Enrollment
Tui on
BrandValue

projected surplus/deficit (S/D). Within this model, the goal is operate the model so that the NPV is
driven to the point where the projected surplus or deficit is zero, that is, the institution breaks even.
Percent tenure track (TT) faculty has an enormous impact. Non-tenure track faculty members teach
twice as many classes as tenure track faculty members, which substantially reduces costs, especially
because they are usually paid much less. Tenure track faculty members spend half their time doing
research, which may or may not be paid for from research grants. The publications resulting from this
research strongly impacts brand value over time.
The tradeoff is very clear. Reducing percent TT lowers costs and, in principle at least, decreases
tuition. Increasing percent TT increases costs and tuition, but enhances brand value. Prospective
students seek lower net tuition and higher brand value. Leaders of research universities have to decide
where to position themselves relative to this tradeoff.
There are many other parameters to the model beyond those shown in Figure 1. Endowment growth
rate and tuition growth rate are also inputs on the “dashboard” for the model. Embedded variables
include, for example, administrative salaries and growth rate; initial number of undergraduate and
graduate students; growth rates of these populations; and class sizes for both types of students. Such
variables are not included on the dashboard. Once they are set for a particular university, they are
seldom varied.
There are several sub-models within the overall computational model. These sub-models relate to
finance, administration, research, education, workforce, and brand. The research model projects
proposals written, projects funded, articles submitted, and articles published. The workforce model
projects decisions about hiring, promotion, tenure, and retirement. The overall model and all the sub-
models are explained in detail in Rouse (2016).
SCENARIOS OF FUTURE PERFORMANCE
There are three forces of particular interest that work independently but have a combined effect on the
results of the model:
Scenario 1: Competition for federal dollars and publication in top journals is steadily increasing.
The current success model at most research universities requires faculty members to work harder
and harder to achieve less and less success, proposal writing consuming increasing time and
publication preparation receiving decreasing attention
Scenario 2: Foreign student enrollment in graduate programs has decreased in recent years due to
competition from other countries and, more recently, concerns about US immigration policies.
These professional masters degrees are typically “cash cows” for research universities, subsidizing
many other aspects of the enterprise.
Scenario 3: Highly polished, well-done MOOCs will increasingly succeed. Once the credentials
associated with success in these online courses are acceptable to employers, it is easy to imagine a
massive shift away from traditional classrooms for some categories of students, especially those
seeking professional credentials and masters degrees where distance learning is already recognized
and increasing common.
We have used the computational model to explore the implications of these forces for research
universities. Well-resourced universities, such as the most successful among the top 160, perhaps the
3 Net present value is the current value of projected future cash flows, discounted by the interest rate one must forgo or pay due to cash flows being delayed.
top 50, will likely cope in different ways. Institutions almost totally dependent on tuition dollars, which
likely fall outside the top group, will struggle and those who cannot keep tuition competitive while
avoiding large deficits are likely to fail or require dramatic restructuring.
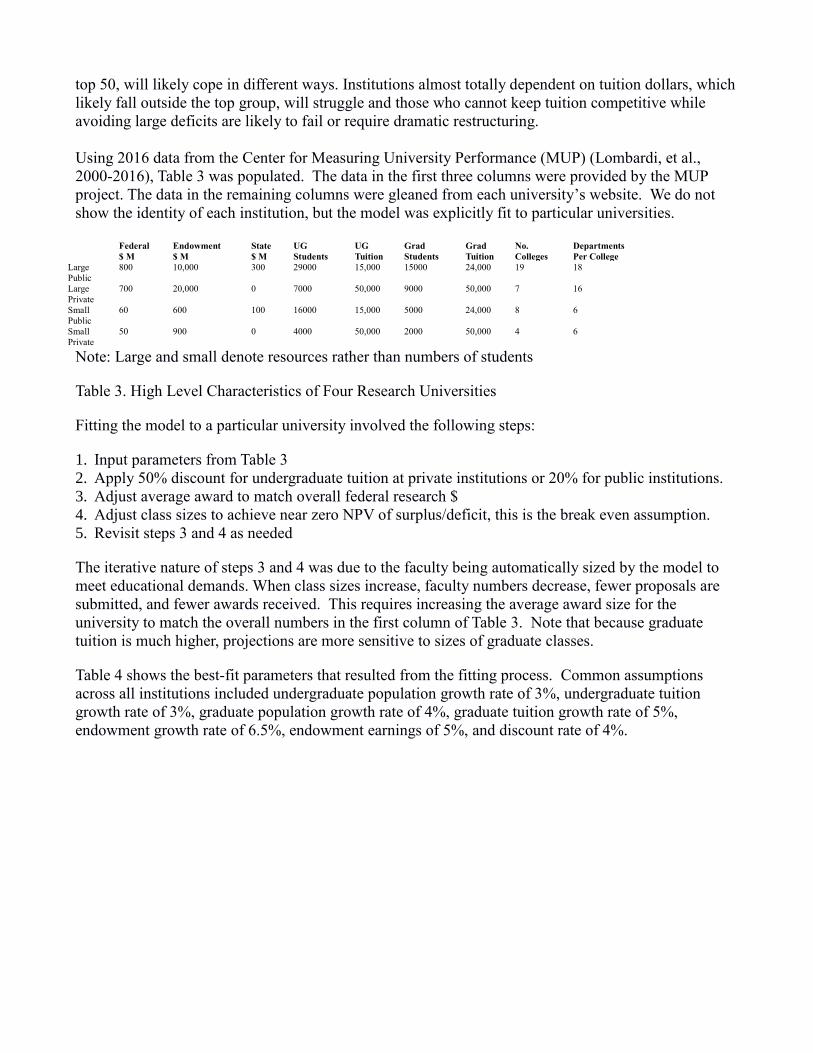
Using 2016 data from the Center for Measuring University Performance (MUP) (Lombardi, et al.,
2000-2016), Table 3 was populated. The data in the first three columns were provided by the MUP
project. The data in the remaining columns were gleaned from each university’s website. We do not
show the identity of each institution, but the model was explicitly fit to particular universities.
Federal
$ M
Endowment
$ M
State
$ M
UG
Students
UG
Tuition
Grad
Students
Grad
Tuition
No.
Colleges
Departments
Per College
Large
Public
800 10,000 300 29000 15,000 15000 24,000 19 18
Large
Private
700 20,000 0 7000 50,000 9000 50,000 7 16
Small
Public
60 600 100 16000 15,000 5000 24,000 8 6
Small
Private
50 900 0 4000 50,000 2000 50,000 4 6
Note: Large and small denote resources rather than numbers of students
Table 3. High Level Characteristics of Four Research Universities
Fitting the model to a particular university involved the following steps:
1. Input parameters from Table 3
2. Apply 50% discount for undergraduate tuition at private institutions or 20% for public institutions.
3. Adjust average award to match overall federal research $
4. Adjust class sizes to achieve near zero NPV of surplus/deficit, this is the break even assumption.
5. Revisit steps 3 and 4 as needed
The iterative nature of steps 3 and 4 was due to the faculty being automatically sized by the model to
meet educational demands. When class sizes increase, faculty numbers decrease, fewer proposals are
submitted, and fewer awards received. This requires increasing the average award size for the
university to match the overall numbers in the first column of Table 3. Note that because graduate
tuition is much higher, projections are more sensitive to sizes of graduate classes.
Table 4 shows the best-fit parameters that resulted from the fitting process. Common assumptions
across all institutions included undergraduate population growth rate of 3%, undergraduate tuition
growth rate of 3%, graduate population growth rate of 4%, graduate tuition growth rate of 5%,
endowment growth rate of 6.5%, endowment earnings of 5%, and discount rate of 4%.

State
Funding
Growth %
% Tenure
Track
Faculty
Overhead
Rate on
Funded
Research
Average
Undergrad
Class Size
Average
Graduate
Class Size
Average
Award
Size4
Large
Public
2% 70% 60% 80 28 $330K
Large
Private
NA 80% 60% 16 8 $260K
Small
Public
2% 30% 50% 65 45 $210K
Small
Private
NA 70% 50% 40 29 $150K
Table 4. Model Parameters Fit to Four Institutions
UNDERSTANDING THE MODEL RESULTS
Three scenarios were explored:
S1: Status Quo
S2: Graduate Student Population Declines by 5% Annually
S3: Graduate Tuition Declines to $10,000 Due to Online Offerings
The results are summarized in Table 5.
4 Note that the average award is adjusted so that federal monies received matches Table 3. The model
assumes that only TT faculty generate proposals – obviously research staff members can and do generate proposals, but modeling the activities of research staff would really complicate things. The number of total faculty is driven by educational demands; number of TT faculty is determined by %TT in dashboard. The model also assumes one person-month per proposal, regardless of whether it is a $150K or $330K proposal, which does not seem unreasonable.
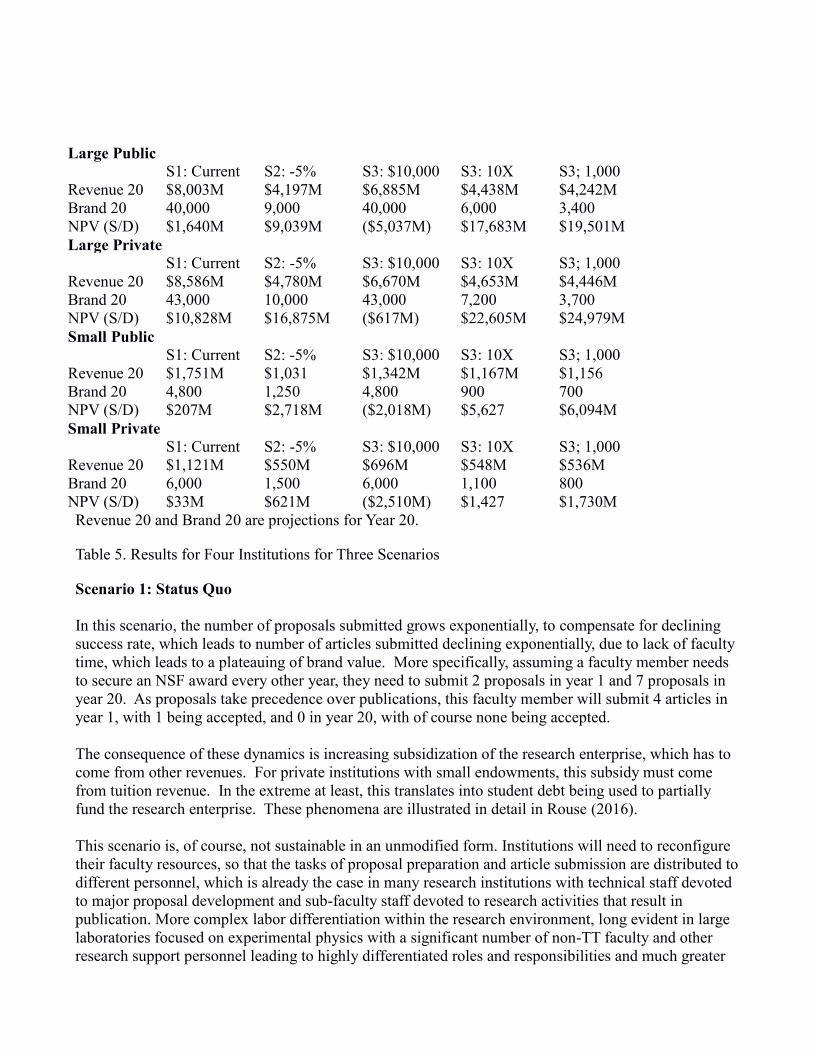
Large Public
S1: Current S2: -5% S3: $10,000 S3: 10X S3; 1,000
Revenue 20 $8,003M $4,197M $6,885M $4,438M $4,242M
Brand 20 40,000 9,000 40,000 6,000 3,400
NPV (S/D) $1,640M $9,039M ($5,037M) $17,683M $19,501M
Large Private
S1: Current S2: -5% S3: $10,000 S3: 10X S3; 1,000
Revenue 20 $8,586M $4,780M $6,670M $4,653M $4,446M
Brand 20 43,000 10,000 43,000 7,200 3,700
NPV (S/D) $10,828M $16,875M ($617M) $22,605M $24,979M
Small Public
S1: Current S2: -5% S3: $10,000 S3: 10X S3; 1,000
Revenue 20 $1,751M $1,031 $1,342M $1,167M $1,156
Brand 20 4,800 1,250 4,800 900 700
NPV (S/D) $207M $2,718M ($2,018M) $5,627 $6,094M
Small Private
S1: Current S2: -5% S3: $10,000 S3: 10X S3; 1,000
Revenue 20 $1,121M $550M $696M $548M $536M
Brand 20 6,000 1,500 6,000 1,100 800
NPV (S/D) $33M $621M ($2,510M) $1,427 $1,730M
Revenue 20 and Brand 20 are projections for Year 20.
Table 5. Results for Four Institutions for Three Scenarios
Scenario 1: Status Quo
In this scenario, the number of proposals submitted grows exponentially, to compensate for declining
success rate, which leads to number of articles submitted declining exponentially, due to lack of faculty
time, which leads to a plateauing of brand value. More specifically, assuming a faculty member needs
to secure an NSF award every other year, they need to submit 2 proposals in year 1 and 7 proposals in
year 20. As proposals take precedence over publications, this faculty member will submit 4 articles in
year 1, with 1 being accepted, and 0 in year 20, with of course none being accepted.
The consequence of these dynamics is increasing subsidization of the research enterprise, which has to
come from other revenues. For private institutions with small endowments, this subsidy must come
from tuition revenue. In the extreme at least, this translates into student debt being used to partially
fund the research enterprise. These phenomena are illustrated in detail in Rouse (2016).
This scenario is, of course, not sustainable in an unmodified form. Institutions will need to reconfigure
their faculty resources, so that the tasks of proposal preparation and article submission are distributed to
different personnel, which is already the case in many research institutions with technical staff devoted
to major proposal development and sub-faculty staff devoted to research activities that result in
publication. More complex labor differentiation within the research environment, long evident in large
laboratories focused on experimental physics with a significant number of non-TT faculty and other
research support personnel leading to highly differentiated roles and responsibilities and much greater

efficiency in the process of proposal preparation and submission and article preparation and
publication. It may be difficult for institutions with fewer resources to afford such organizational
infrastructure.
Universities could also help themselves by broadening their success models beyond NIH and NSF. The
idea that a junior faculty member has to secure a grant from one of these agencies to gain tenure results
in their submitting large numbers of unsuccessful proposals to, hopefully, finally have one success.
Intellectual outcomes are what really matter, not the source of the funds to create these outcomes. The
model for brand value considers publications, citations, and h-index, not the sources of funding.
Universities are paying dearly, in terms of increasing subsidies, by clinging to such outmoded thinking.
Beyond such changes within universities, research-sponsoring agencies could lower the cost of
research by changing procurement processes. For example they could, and several do, require brief
white papers with initial articulation of an idea. For ideas that have a high probability of being funded,
investigators would be encouraged to submit proposals. This could substantially reduce the costs of
preparing proposals with little chance of funding. These high “costs of sales” are not tracked, but are
bundled with release time.
Agencies could broaden the proposal review process to include more than just academics. Current peer
review processes at agencies such as NIH and NSF tend to reinforce reigning academic paradigms and
discourage proposals outside the norm. Including reviewers who could judge the likely benefits of an
idea, beyond refining and tuning the academic status quo, could foster increased innovation, especially
when combined with the notion of screening ideas with initial white papers.
Scenario 2: Declining Graduate Enrollments
In this scenario, we see that declining enrollment results in declining size of faculty, which leads to
fewer faculty members’ research having to be subsidized, which leads to fewer publications and
significantly decreased brand value. However, the key element for institutions of any size is not
necessarily the total number of faculty but the number of research effective faculty. So an institution of
small size with 200 research effective faculty and 50 teaching faculty can have the same research brand
value as an institution of large size with 200 research faculty and 200 teaching faculty. Moreover, as the
price of teaching faculty is less than research faculty, constructing the balance between enrollment,
teaching faculty, and research faculty will become an increasing critical analytical issue for many
institutions.
This scenario involved 5% annual decreases of graduate enrollments, reflecting an observed trend over
the past few years, as well as recent turmoil over immigration. Realistically, the top players will not
experience such decline, while the lower players will see greater declines. The top institutions will
retain their abilities to pick the best foreign applicants. Fewer applicants overall will mean that the top
institutions will consume a greater portion of the pool.
Scenario 3: Declining Graduate Tuitions
In this scenario, limits on graduate tuition, due to high-quality online offerings, results in substantial
deficits, but brand value is sustained if class sizes are maintained at S1 levels. Deficits are highly
affected by attempts to maintain the research enterprise. The utility of graduate and post-baccalaureate
certificate tuition as a key support of tuition driven institutions and a profit center for all institutions
will surely decline with the continued improvement in technology enabled instruction, although the
enhanced quality of technology driven solutions will not come cheap. Scale here will be critical as
institutions increasingly outsource distance education offerings to professional organizations that can
leverage the scale needed for cost effective operations. A key element in this and the other S3
alternatives will be the ability to brand distance programs with high value brands. This is an
increasingly evident trend in the field as commercial providers offer institutionally branded
course/degree/certificate programs on a common technology platform and most likely many other
common elements.
A modification of scenario 3 that captures the effects of increasing graduate class sizes by 10X yields
very positive results that differ across institutions due to baseline S1 class sizes; declining size of
faculty, due to larger classes increases surplus but erodes brand value. Whether brand value will suffer
as a result of changes in the scale of graduate education will depend much on the mix of programs.
Some in the health related fields have key markers for quality linked to small class size. Others in
business or technology fields may not have such issues with class size.
An additional modification to scenario 3 which estimates the impact of increasing graduate class sizes
to 1,000 per class yields increasingly positive results, although the further decline of the size of faculty,
due to yet larger classes, which increases the surplus, but further erodes brand value. A hybrid model
would have such large classes for introductory course, but shrink class size to more traditional levels
for advanced courses.
It is of particular note that the top institutions are driving all variations of scenario 3, with Coursera,
edX and Udacity being prime examples. These institutions have the resources to enable large
experiments. In addition, they can attract major commitments from industry to underwrite these
experiments and seed enrollments. AT&T and Accenture’s large commitment to Georgia Tech for high
quality MS degrees is computer science and data analytics illustrates how $10,000 MS degrees can be
possible. Lower level players, where tuitions from professional graduate degrees are their only “cash
cow,” are at substantial risk.
Assuming class sizes of 1,000 raises the prospect of there not being enough students to fill these
classes. However, $10,000 professional MS degrees are likely to spur dramatic increases in demand, in
part because this price point will easily fit within many large corporations’ education budgets.
Nevertheless, the higher brand value institutions may dominate this market, to the significant detriment
of the lower brand value institutions.
Overall, all these scenarios result in decreased research productivity due to diminishing returns for S1,
and declining faculty sizes for S2 and S3. All four institutions that illustrate these scenarios benefit
financially by decreasing subsidies of research, but the dramatic decrease of research output is certainly
a national concern. Using student debt, at least in part, to subsidize the research enterprises is not in the
national interest. Some rethinking seems definitely warranted.
CONCLUSION
This paper has brought together many of the pieces of the puzzle associated with the higher education
challenges. The elements of the education and research enterprise have been integrated to enable
projecting the likely consequences of several scenarios for the future of the academic enterprise. We
cannot predict what mix of these scenarios will actually emerge. However, universities need strategies
and investments that enable robust responses to whatever mix emerges. Tools such as the one

illustrated here and more fully explored in Rouse (2016) provide institutional leaders a method of
testing the impact of various policy changes within their institutions, as well as the results of changes in
the external environment.
Fundamental change is in the offing. Higher education cannot sustain its current cost structures. The
limits of revenue increases will inevitably be reached, significantly facilitated by increasingly powerful
and sophisticated technology platforms, likely offered by institutions with high brand values. Many
educational institutions will need to reconfigure their operations, restructure their financial models, or
disappear amidst what can be called “creative destruction” (Schumpeter, 1942).
Nevertheless, we need a healthy, educated and productive population that is competitive in the global
marketplace. If the population is not educated, it will not be healthy. If the population is not
productive, it will not be competitive. The pieces all fit together. We have to foster the right portfolio
of investments in the hedges that will assure success despite the inevitable restructuring of higher
education finance illustrated by the examples in this paper and documented elsewhere.
REFERENCES
(Lombardi, et al., 2000-2016) Lombardi, et al. The Top American Research Universities: Annual
Report, 2000-2016. Arizona State University and University of Massachusetts Amherst
(http://mup.asu.edu).
(Lombardi, Craig, 2017) Lombardi, John V. and Diane D. Craig. America's research universities: Is the
enterprise model sustainable? Paper presented to the National Academy of Science, Sackler Colloquia,
Modeling and Visualizing Science and Technology Developments, December 3-4, 2017, Beckman
Center, Irving, California.
(NCES, 2017) McFarland, J. The Condition of Education 2017, Institute of Education Sciences,
National Center for Education Statistics, Washington, DC: 2017.
(Rouse, 2016) Rouse, William B. Universities as complex enterprises: How academia works, why it
works these ways, and where the university enterprise is headed. New York: Wiley.
(Schumpeter, 1942). Capitalism, socialism and democracy. New York: Harper & Brothers.