the fluidized bed reduction of zinc calcinedigitool.library.mcgill.ca/thesisfile47768.pdf · the...
TRANSCRIPT

THE FLUIDIZED BED REDUCTION OF ZINC CALCINE
by
William James Middleton

ABSTRACT
An experimental study has shown that it is possible to produce
zinc Metal by hydrogen reduction of roasted zinc sulphide concentrates
in a fluidized bed at temperatures in the range of 800 -900oC •
Increases in temperature and increases in hydrogen flowrate in
the range of space velocities from 3.77 to 7.54 cm. sec -1 have a
marked beneficial effect on zinc reduction rates. The reduction pro
cess is apparenUy controlled by gas phase mass transport.
Calculations based on an industrial scale integrated roaster bed
reduction bed combination indicates that under ideal conditions (operation
at 1000oC) a) the process is autogenous when oxygen enriched air (37%02)
is used for roasting and b) the maximum attainable hydrogen reducing
efficiency is 20%.
A suggestion for a possible industrial design is presented and
industrial projections for the use of hydrogen and Methane as gaseous
reducing agents are made.
Name: William James Middleton.
TiUe of Thesis: The Fluidized Bed Reduction of Zinc Calcine.
Department:
Degree:
Metallurgical Engineering.
Master of Engineering.

THE FLUIDIZED BED REDUCTION
OF ZINC CALCINE
by
William James Middleton
A thesis submitted to the Faculty of Graduate Studies
and Research in partial fulfilment of the
requirements for the degree of
Master of Engineering
Department of Metallurgical Engineering
McGill University
Montreal, Canada. March, 1971.
® _il.liaa Jaaee Midd.let.on 1971
Chapter
One
Two
Three
TABLE OF CONTENTS
INTRODUCTION. . . . . . . . . . . . .
1.0 Purpose of the Present Investigation .
1. 1 Objectives of the Present Work. . .
1. 2 Thesis Arrangement. . . . . .
CURRENT INDUSTRIAL USES OF FLUIDIZED BEDS
2.0 Definition. • . . . . . . • . .
2.1 Survey of Industrial Applications in the Chemical Industry. . . • . .
2.2 Survey of Fluidized Bed Processes in Metallu"rgy . .. ...... .
ZINC TECHNOLOGY.
3.0 Current Zinc Production Figures. .
3.1 The Uniqueness of Zinc Smelting .
3.2 Retort Smelting . . . .
3.2-1 Chemistry of Retort Smelting-Reduction of
Page
1
1
2
3
5
5
5
7
12
12
12
13
Zinc Oxide by Carbon. . 13
3.2-2 Horizontal Retort Smelting. . . . . . 14
3.2-3 Continuous Vertical Retort Smelting. 16
3.2-4 The Electrothermie Zinc Smelting Process . 18
3.3 Blast Furnace Smelting 21
3.4 Experimental Studies on Zinc Production 25
3.5 Rate Studies on the Gaseous Reduction of Zinc Cbdde. 28
3.6 Summary . . . . 30

Chapter Four OTHER EXPERIMENTAL WORK INVOLVING THE
REDUCTION OF METAL OXIDES IN FLUIDIZED BEIlS. . • . . • . . • . . . . . • . . . . 31
4. 0 Fluidized Bed Reduction of Iron Oxides. . . 31
..;. 1 Summary and Comments. . . . . . . . . 35
Fi ve THEORETICAL CONSIDERATIONS OF FLUIDIZA TION 36
Six
Seven
5.0 The Behaviour of Gas Fluidized Beds.
5. 1 The Minimum Fluidizing Velocity.
5. 2 The Terminal Veloci ty. .
5. 3 Summary . . . . . . . • .
ROASTING OF ZINC CONCENTRA TES
6.0 The Physical Chemistry of Zinc Concentrate
36
37
48
48
49
Roasting . . .. .. . . 49
6. 1 The Fe-S-o System . . . 57
6.2 The Zn-Fe-S-o System 61
6.3 Analysis of Roasting Zinc Concentrates to Retard Zinc Ferrite Formation . . . . . . . . . .. 64
6.3-1 Effect of Temperature on Zinc Oxide Recovery. 64
6.3-2 Effect of Gas Composition on Zinc Oxide Recovery • • . . • . . . • . . . 65
6.4 Summary of Zinc Concentrate Roasting for the Recovery of Free Zinc Oxide. . • . 66
THE ZINC OXIDE - BYDROGEN SYSTEM AT ELEVATED TEMPERATURES .•.•. 67
7. 0 Reduction of Zinc Oxide by Hydrogen. . 68
7. 1 Reactions with Other Components of the Zinc Calcine. . • . . . . . . . . . . . . . . 70
7. 2 The Choice of Hydrogen as a Fluidizing and Reducing Gas . • • . • . • • . • . . . • 71

t
Chapter Page
Eight APPARATUS AND EXPERIMENTAL TECHNIQUE. 72
Nine
Ten
8.0 General Approach to the Experimental Technique ..
8. 1 Apparatus. . .
8.2 Raw Material - Zinc Calcine ..
8.3 Preliminary Tests. . .
8.4 Experimental Procedure .
8. 5 Chemical Analysis. . .
8.5-1 Determination of Zinc .
8. 5 -2 Determination of Iron .
RESULTS. . • • • . . • •
9. 0 Results and Experimental Observations General. • . . . •
9. 1 Caking and Clinkering .
72
72
84
85
86
88
88
89
91
91
91
9. 2 Reaction Kinetics and Zinc Elimination . 97
9.2-1 The Effect of Temperature on Zinc Elimina-tion and the Apparent Reaction Rate. . .. 97
9.2-2 The Effect of the Hydrogen Flowrate on Zinc Elimination and the Apparent Reaction Rate 100
9. 3 Hydrogen Efficiency . . . . . . . . . . . •. 106
DISCUSSION. 111
10.0 Feasibility Considerations - Clinkering and Particle Agglomerations. . . . . . . 111
10.1 Feasibility Considerations - Hydrogen Effici-ency. . . . . . . . . • . 117
10.2 Reaction Kinetics. . . • . 120
10.2-1 Variation of the Reaction Rate with Tempera-ture. . . 120
10.2-2 Variation of the Reaction Rate with Gas Flow-rate. . . • . • . . . • . . . . . . 122

Chapter
10.3 Variation of the Reaction Rate with Time.
10.4 Postulation of Reaction Mechanisms . .
10.4-1 Reaction Rate as a Function of Time
~
123
127
127
10.4-2 Interpretation of the Reaction Rate .... 127
10.4 -3A Parti cie Size and Interfacial Area 129
10.4-3B The Product KA as a Function of Tempera-ture and Flowrate. . . . . . . 132
10.4-4 Variation of KA with Gas Flowrate. . 132
10.4-5 Reaction Mechanism. • . 135
10.5 Predictions for Full Scale Reactors . 139
10.5-1 Basis of the Design Calculations. 142
10.5-2 Calculation of the Plan Area Requirements for ZnO Reduction. . . . . . . . . . .. 144
10.5-3 Beat Calculations Based on a Roast-Reduction Integrated Process for the Production of Zinc . . . . . . .. ....... 145
10.6 Summary and Critique of the Present Work.. 155
10.7 Suggestions for Future Work. 160
10.8 Conclusions. . . . . . . . . 162
APPENDIX 1 . 164
ACKNOWLEDGEMENTS 167
LIST OF SYMBOLS • 168
LIST OF TABLES 171
LIST OF FIGURES 173
REFERENCES . . 176
CHAPTER ONE
INTRODUCTION
1. 0 Purpose of the Present Investigation
With present day technology, the only viable pyrometallurgical
methods of producing zinc from roasted zinc concentrates are either
1) the heating of a mixture c1 zinc oxide and carbonaceous reducing
agent in sealed retorts using an external source of heat or 2) the re
duction of zinc oxide by carbon monoxide in a blast furnace. The
retort method suffers from a very slow rate of zinc production while
the blast furnace technique must employ expensive coke as the princi
pal reducing agent.
The purpose of this work, therefore, has been to explore the
technical feasibility of producing zinc by the gaseous reduction of roasted
zinc concentrates in a fluidized bed. Many existing zinc producing
plants are increasingly turning to the use of fluidized beds for the
roasting of zinc sulphide concentrates to zinc oxide and hence this
investigation is but a part of an overall zinc production scheme whereby
roasted zi'lc concentrates from a fluidized bed roasting step would sub
sequently be reduced in a fluidized bed. The· resulting zinc vapours
from the reduction would be condensed in a lead or zinc splash con
denser.
It ls only since World Wu Two that soUds fluidization has come
to be exploited as a reduction technique. Selected examples of the
industrial uses of fluidized beds are described in Chapter 2.

' ..
2
Beat and mass transfer rates are usually significantly greater in
fiuidized beds than in conventional contacting processes, the high rates
being largely due to the fact that the reacting particles are surrounded
by agitated gas. Fluidized beds, therefore, are generally well suited
for reactions which require or evolve large quantities of heat. The
agitated motion of the particles and gas results in high transfer rates
particularly at the bed-wall surfaces. Beat is, therefore, quickly moved
from the surfaces to the interior of the bed. High rates between the
particles and the fiuid also account for the near isothermal conditions
observed in fiuidized beds. Bence localized hot and cold spots, ob-
served frequently in fixed bed processes, are minimized in fiuidized beds.
The Many advantages of a fiuidized bed reactor suggested, there-
fore, the potential usefulness of an investigation into the gaseous reduction
of zinc oxi.de in a fiuidized bed. It would seem to be particularly useful
to determine if the observed superiority of fiuidized beds for other re-
actors can be used to advantage for the production of zinc.
1. 1 Objectives of the Present Work
The behaviour and reaction kinetics of the fiuidized bed roasting
of zinc concentrates have been established through industrial experience
with the process (3 - 6) and through experimental studies (7). The bulk
of the future work will have to be concerned with the fiuidized bed
reduction process.
The main objectives of this study were:
1) to determine if it ls technically possible to produce zinc
Metal in a fiuidized bed by the gaseous reduction of
zinc calcine.
2) to study the effect of tempe rature and gas fiowrate on
the rates of zinc calcine reduction in a fiuidized bed.
3
It was hoped that if promising results were obtained, the experi
mental data would be sufficient to lead to a larger scale investigation,
perhaps on a pilot plant scale.
A concluding section of this thesis suggests some ideas which
might form the basis for future work.
1. 2 Thesis Arrangement
The arrangement of this thesis has been planned with the under
lying theme of ultimately suggesting a new method of producing zinc
Metal. A brief explanation of the progression of the thesis follows.
Chapter 2 surveys the current industrial uses of fluidized beds
in an attempt to demonstrate their versatility and as a partial justifica
tion for considering fluidized beds as a logical step in any new attempt
to produce zinc.
Chapter 3 gi ves a detailed account of the existing state of zinc
technology and, in particular, discusses the problems of zinc smelting.
The current high temperature solutions to these problems are discussed
as well as previous experimental investigations aimed at studying new
methods of zinc production. A section on rate studies i8 also included
in thi8 chapter.

4
Chapter 4 deals with experimental studies directed at the use of
fiuidized beds to reduce other Metal oxides, in particular, iron oxide.
These results show that the idea of Metal oxide reduction in fiuidized
beds is not new but that the notion to attempt zinc oxide reduction in
fiuidized beds is novel to the field of zinc technology.
Chapter 5 discusses the overall behaviour of gas-solid fiuidized
beds and elucidates some of the nomenclature used in fiuidization tech-
nology. Calculations of some of the variables important in the experi-
mental fiuidization studies of this work are also discussed.
Chapter 6 discusses methods which May be employed during the
roasting of iron bearing zinc concentrates to produce an optimum feed
material for a subsequent fiuidized bed reduction step, i. e., methods
which will lead to a maximum amount of free zinc oxide in the roast
product.
Chapter 7 deals with the thermodynamic equilibria for the reduc-
tion of zinc oxide with hydrogen. Reasons for the use of hydrogen in ",."-, -."
• 1.'" :--, < this investigation are cited.
Chapters 8, 9, and 10 describe the experimental part of the in
vestigation. Chapter 8 describes the experimental procedure. Chapter 9
comments on the experimental results with sorne emphasis on the features
of the reduction results which are potential drawbacks to an industrial
process, namely charge agglomeration and caking. The results of the
rate studies are also given. Chapter 10 conclu des the work with a dis-
cussion on tIe experimental results, a proposal for reaction mechanisms,
some industrial design calculations and suggestions for future work.

5
CHAPTER TWO
CURRENT INDUSTRIAL USES OF FLUIDIZED BEDS
2.0 Definition
The term "fluidization" refers to the method of contacting solids
with fluids whereby finely divided solids are transformed into a fluidlike
state by passing an upward stream of gas or liquid through the particles.
Fluid-solid contact is excellent in fluidized beds and hence mass transfer
and heat transfer rates are very high. In addition, because of the excel
lent heat transfer characteristics, localized temperature variations are
minimal in fluidized beds. Table 2.0-1 shows a comparison between
different types of gas -solid contacting systems.
2.1 Survey of Industrial Applications in the Chemical Industry
Although applications of fluidization techniques can be traced back
to the sixteenth century, it has only been within recent years that solids
fluidization has recei ved widespread attention as a chemical and metal
lurgical engineering too1. The chief application to date has been in the
catalytic cracking of petroleum, using fluidized catalyst particles, which
was developed due to a heightened demand for large quantities of high
octane aviation fuel during World War Two. The success of the se cata
lytic cracking units bas led to a large number of basic and applied
studies in the field.
The bulk of the quantitative experimental work on fluidization has
been concerned with the mechanics of fiuidization, 1. e., correlations be
tween the pressure drops across fluidized beds and the fluid and solid
properties of the bed. Considerable study of the heat and mass transfer
characteristics and mixing characteristics in fluidized beds (8-19) has
also been carried out.

) TABLE 2.0-1
Comparlson of Types of Contacting for Reacting Gas-SoUd Systems, nlustrated by Metallurgical Examples
Mode of Gas -SoUd Contact Efflclency of Gas -SoUd Contact Temperature Distribution Required Particle Size Distribution
Flxed Bed Uniform particle size required. (e. g. Upper Shaft of Blast Particles are stationary lead - Poor. Localized temper - Small parUcles are frequenUy
Furnace) Ing to much channelling and ature gradients are fre- blown out. short clrcuiting of gas. Con- quenUy encountered
Moving Bed (e. g. Slnterlng Machines
Wedge Roasters (e. g. HerreshoU type)
Rotary Kilns
Flash Roasters (e. g. Comlnco Roaster)
Fluldized Bad
verslon of soUd ls poor.
Same as for Flxed Beds Large temperature gradients are obtained in the direction of the gas flow due to localized zones of reacUon.
Incomplete gas -soUd contact. Poor for roaster as a However, better than fixed who le but relatively unl-beds due to rabbUng of soUds form on each hearth. by mechanical rakes.
As for Wedge Roasters
Good Contact.
Good contact.
Uniforme Heating ls genUe and slow. Low production rates.
Poor tempo distribution because of short contact Urnes during fall through roaster.
Excellent tempo distrlbution because of violent soUds agitation and contact.
Uniform pellet size is usually required for even gas flow and consistent sinter quality.
Wide range acceptable because of low gas flowrates.
Fines tend to cake and agglomerate on the surface of the kiln.
Narrow range of small particles required because of short contact Umes.
Wide range acceptable although restricted by partlcle terminal velocity.
0)

{
7
These investigations have been instrumental in furthering applied
studies on fluidization techniques. In addition to the cracking of hydro
carbons, higher order hydrocarbons are now produced in fluid bed re
actors as are ethylene glycol, alkyl chio ride , phthalic anhydride,
acrilonitrile, and vinyl acetate.
The use of fluidized beds for the calcination of li me stone , dolomite,
and phosphate rock as well as for the clinkering of cement has been
extensively evaluated. The se processes have now obtained commercial
acceptance with considerable co st savings over conventional kiln processes.
2. 2 SurVey of Fluidized Bed Processes in Metallurgy
ln 1947, the Dorr-oliver Company built the first Fluo-Solids
roaster for the roasting of arsenopyrite (FeAsS). Although this plant
proved to be unsuccessful, owing to an arsenic handling problem, it led
to the use of fluid bed roasters for the roasting of most other types of
sulphide ores. Some of the se are shown in Table 2.2-1. In addition to
the main purposes cited in the tabulation, it was found that continuous
fluidized bed operation led to average sulphur dioxide concentrations in
the product gases of 10-15%. Conventional roasting processes using
hearth or flash-type roasters obtain average sulphur dioxide concentra
tions in the product gases of 5 -10%.

8
TABLE 2.2-1
Survey of Metal Sulphide Roasting
Process Nickel Sulphide
Roasting (20)
Zinc Sulphide Roasting (3, 4,5,6)
Copper Sul phi de Roasting (21)
Sulphation Roasting of Refractory Ores.(22)
Main Purpose The production of coarse, granular nickel oxide from the fine sulphide concentrate obtained from the conventional separation of Bessemerized matte.
To produce a calcine suitable for acid leaching. The subsequent leach liquor is used as an electrolyte for the electrowinning of zinc.
To increase the recovery of smelter sulphur and to increase the throughput of copper concentrates.
To open orebodies of refractory ores to exploitation by selective sulphation roasting with 802 gas to produce water leaChable metal sulphates.
Advan!ages Eliminates difficult mechanical problems encountered in the conventional sintering process and results in a more reactive product for subsequent reduction.
Using fluid bed roasters a full 2-3% increase in the yield of leachable zinc over conventional suspension and hearth roasting has been realized, principally due to a reduction in the SJ!lPhide sulphur content.\5T
The recovery of sulphur has been increased by 20-25%. Smelter throughputs increased by up to 40%. In addition, finer control of reverberatory matte grades has been obtained.
The stability of metal sulphates is acutely temperature sensi ti ve. The near isothermal temperature conditions achieved in fluid bed reactors eliminates local "hot" spots and affords greater control over sulphating temperatures.

9
Although the bulk of the commercial applications of fiuid bed
processes in the metallurgical industry are concerned with the roasting
of metal sulphides, significant contributions have been made from other
sec tors of the industry, notably from the Iron and steel industry. The
purpose has been threefold: (1) to attempt to find an acceptable alterna
tive for the Iron blast furnace, (2) to produce iron and steel from the
fines of high grade ores, and (3) to employ the lower grade ores and
available fuels (non-coking bituminous coals, anthracite, lignite, etc.)
to produce Iron and steel. These so -called direct reduction processes
are sùmmarized in Table 2.2-2. The INCO pro cess for reducing nickel
oxide is also included in this table.
Except for a few restricted cases, improvements in blast fur
nace operation, initiated during the development stages of these new
pro cesses , gave the blast furnace a decided cost advantage and further
work on direct reduction processes was largely suspended. Only the
H-IRON and the Direct Fuel Injection processes (Table 2.2-2) are in
commercial production today, the former as a supplier of Iron powder
for powder metallurgical purposes. The latter operation is presently
used by the Montecatini Edison works in Follonica, Italy to produce
high grade Iron concentrate by converting hematite to Magnetite which
i5 removed from the gangue materials by magnetic separation. This
method reduces transportation costs and lowers blast furnace operating
costs by providing a partially reduced ore to the charge.
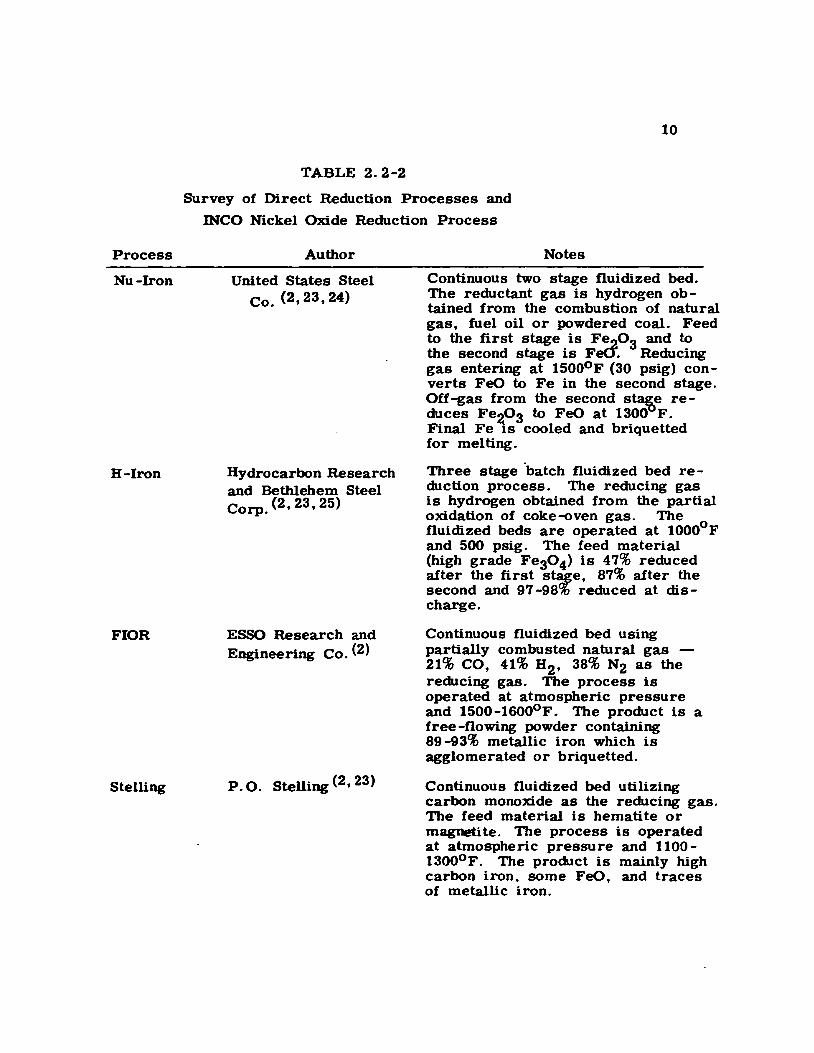
Process
Nu-Iron
H-Iron
FIOR
Stelling
10
TABLE 2.2-2
Survey of Direct Reduction Processes and
INCO Nickel Oxide Reduction Process
Author
United States Steel Co. (2,23,24)
Hydrocarbon Research and Bethlehem Steel Corp. (2, 23, 25)
ESSO Research and Engineering Co. (2)
P. O. Stelling (2,23)
Notes
Continuous two stage fluidized bed. The reductant gas is hydrogen obtained from the combustion of natural gas, fuel oïl or powdered coal. Feed to the first stage is Fe.-203 and to the second stage is Feu. Reducing gas entering at 15000 F (30 psig) converts FeO to Fe in the second stage. Off -gas from the second st~e reduces Fea03 to FeO at 1300 F. Final Fe lS cooled and briquetted for melting.
Three stage °batch fluidized bed reduction process. The reducing gas is hydrogen obtained from the partial oxidation of coke-oven gas. The fluidized beds are operated at 10000 F and 500 psig. The feed material (high grade Fe304) ls 47% reduced after the first stage, 87% after the second and 97 -98% reduced at discharge.
Continuous fluidized bed using partially combusted natural gas 21% CO, 41% H2' 38% N2 as the reducing gas. The process is operated at atmospheric pressure and 1500-1600oF. The product is a free -flowing powder containing 89 -93% metallic Iron which is agglomerated or briquetted.
Continuous fluidized bed utilizing carbon monoxide as the reducing gas. The feed material is hematite or Magnetite. The process is operated at atmospheric pressure and 1100-1300o F. The product is mainly high carbon irone some FeO, and traces of metallic irone

Process
Direct Fuel Injection
NiO Fluidized Bed Reduction Process
Il
TABLE 2.2-3 (Cont'd)
Au tho r
G. Tomasicchio (26)
International Nickel Co., Canada, Ltd. 27)
Notes
Employs a Dorr-oli ver FluoSolids Reactor. The reducing gas is partially oxidized fuel oil plus ai r and the feed material is hematite. The operating temperatures vary between 650 and 9000 C depending on the type of ore to be processed. The product is Magnetite.
Roasted nickel oxide (0.01% S) is chlorinated in a fluidized bed to lower the copper content to 0.25%. The resulting calcine is reduced to 90% Ni in a fluidized bed using hydrogen obtained from the decomposition of ammonia. The hydrogen enters the bed at 960-1000o F and flows through the bed with a space velocity of 7 fps. The bed, itself, is maintained at a temperature of 900o F. The retention time of the solids in the bed is approximately 4 hours. 70-75% of the hydrogen is recycled.

12
CHAPTER THREE
ZINC TECHNOLOGY
3. 0 Current Zinc Production Figures
Table 3.0-1 shows the contribution of the various zinc producing
processes to the total world zinc production for 1965 and 1967 (exëluding
Warsaw Pact Countries).
Horizontal Retort
Vertical Retort
Imperial Smelting Process
Electrolytic
Other
TOTAL:
TABLE 3.0-1
Current Zinc Production Figures
1965 %
1967
Metric Tons World Output Metric Tons 400,000 11.5 925,000
440,000 12.5 500,000
230,000 6.5 500,000
1,890,000 54.0 1,975,000
540,000 15.5 300,000
3,500,000 100.0 4,200,000
3. 1 The Unigueness of Zinc Smelting
% World Output
22
12
12
47
7
100
Whereas the majority of the world's major metals (iron, copper,
lead) are being produced in large blast furnaces or reverberatory fur
naces, zinc is still being produced in furnaces of relatively small size.
This fact May be attributed to two characteristics of zinc smelting,
namely that zinc oxide is reducible only with difficulty and that zinc
Metal boUs at 907oc. This latter characteristic has prevented the
direct tapping of liquid zinc from furnaces.

13
3. 2 Retort Smelting
3.2-1 Chemistry of Retort Smelting-Reduction of Zinc Oxide by Carbon
The physical chemistry of retort smelting is characterized by
the overall reaction
ZnO + C ~ Zn(g) + CO ~Go 13000 C = -17000 cal/mole (3.2-1)
which is believed to proceed in two stages according to the following
reactions:
ZnO + CO ~Zn(g) + CO2 ~Go 13000C = +8200 cal/mole (3.2-2)
CO2 + C ~2CO o ~G 13000 C = -25300 cal/mole (3.2-3)
Reaction (3.2-1) is then the sum of two endothermic reactions(3.2-2)
and(3.2-3).
Except for the Electrothermic Process where heat for these re-
actions is supplied through the electrical resistance of the charge, both
horizontal and vertical retort processes supply this heat by conduction
through the container walls from gas or coal fired furnaces. As a
result the amount of zinc smelted per unit area is small.
The main features of the retort smelting reactions is that no
oxygen ls introduced into the system. It is on this point that the retort
reaction differs from that of the blast furnace production of zinc which
is described later in this chapter.
Calculations based on the retort reactions show that the equilibrium
products of reactions (3.2-2) and (3.2-3) are such that at temperatures
above l0000C the retort gases contain approximately equimolar amounts
of carbon monoxide and zinc vapour (less than 1% carbon dioxide).

14
Unhindered condensation of gaseous zinc is usually made difficult
due to the reversibility of the smelting reactions. With retort gases
containing the componellfs Zn, CO, and CO2' both CO and CO2 can
reoxidize zinc vapour to zinc oxide according to:
Zn(g) + co-znO + C
Zn(g) + CO2- znO + CO
(3.2-4)
(3.2-5)
Fortunately, reaction (3.2-4) is slow due to the difficulty of graphite
nucleation. (28) Since the retort gases contain less than 1% CO2 the
formation of zinc oxide by slow cooling due to reaction (3. 2 -5) will
account for a maximum reoxidation of 1. 2% of the total zinc in the
gas stream. (28) In retort smelting, therefore, condensation of the
zinc vapour poses no major problems.
3. 2 -2 Horizontal Retort Smelting
Figure 3.2-2 shows a cross section of a zinc distilling furnace
using horizontal retorts. The retorts are slightly inclined from the
horizontal and are shaped something llke large test tubes. They are
about 5 feet long and 8 or 9 inches in inside diameter. They May have
circular or oval cross sections. Horizontal retorts are generally con
structed from fireclay and are manufactured at the smelter in MoSt
cases. The retorts are placed in the furnace as shown in Figure 3.2-2
and are heated by the flame gases which envelop them; the furnace itself
ls usually a gas fired regenerati ve furnace.

15
Figure 3.2-2. Zinc Distillation Furnace. (29)
Zinc calcine is mixed with the proper amount of reducing agent
(anthracite coal, noncoking bituminous coal, or coke breeze) and is
charged into the retort in batches of 100 to 150 pounds per retort.
When the retort is filled, a rod ls run through the charge at the top
to pro vide an escape channel for the vapour, the condensers are placed
in position and sealed in place with clay, and a small amount of coal is
placed in the mouth. The retorts are brought up to temperature and
distillation proceeds until aIl the zinc has been removed. After reduction
ls complete, the residue ls removed, the retort recharged with fresh
calcine and the procedure is repeated. A complete cycle usuaIly re-
qulres 24-48 hours. The residue remains as a saUd and there is no
slag formation.

16
It should be noted that each retort is provided with its own con
denser which protrudes outside the furnace walls. The zinc condenses
to liquid zinc and the CO gas passes through and burns at the condenser
mouth. Molten zinc is emptied from the condenser by scraping the zinc
into a suspended kettle usually three times during a charge cycle.
The main features to note concerning the use of horizontal retorts
is that they are simple to operate and the charge does not require
elaborate preparation. However, the units are small and the operation
is intermittent, so that considerable labour is required and the use of
automatic controls is not feasible.
Production from an indi vi du al horizontal retort is less than 25
pounds of zinc per day.
3.2-3 Continuous Vertical Retort Smelting
A continuous vertical retort was developed by the New Jersey
Zinc Company (31) which is built in the shape of a vertical channel of
rectangular cross section. The internal cross section is 6 feet by 1
foot and the heated portion bas a height of about 25 feet. Above the
heated portion is a refractory extension into which the charge is fed
through a double bell type hopper system. Below the heated portion
is an iron extension which terminates in a water seal. The retort is
heated externally in the same manner as the horizontal retorts, and
the side walls of the heated portion are made of silicon carbide tiles.
The calcine is mixed with reducing carbon and a binder, pressed
iDto briquets, dried. and then heated to a coking temperature. These
briquets are continuously hot charged to the upper extension of the
retort. The spent briquets, after passing through the heated zone,
are discharged through the water seal at the bottom of the retort.
17
As the briquets pass through the heated zone the zinc oxide is
reduced and the zinc vapour and CO gas pass out through a side opening
near the top of the heated zone. Charge preparation is extremely impor
tant in this operation as each briquet act s as a self contained miniature
retort. As the briquet is brought up to tempe rature , the components
react and the zinc and CO gases are expelled. The zinc is condensed
by passing the effluent CO + Zn(g) gases through a chamber in which
droplets of zinc are being splashed from a cooled bath of liquid zinc.
The coking process is sufficient to prevent disintegration of the
briquets and there is no slagging or fusion. The spent briquets which
are discharged are in fact skeletons of the original briquets.
Because externally heated vertical retorts are operated continu
ously, they are particularly suited to automatic controls. However. the
charge requires elaborate preparation in order to assure proper dis
charge. Although vertical retorts are much bigger than horizontal
retorts, tbey are still small units since the internal thickness is only
about 1 foot. This point exemplifies an inherent weakness of all ex
ternally heated retorts. They must be small in order to assure that
heat penetrates to the centre of the charge.
Production from a vertical retort is in the order of 5 to 8 tons
of zinc per day.

18
3. 2 -4 The Electrothermic Zinc Smelting Process
Figure 3. 2 -3 is a cross section of the furnace and auxiliary
equipment developed by the St. Joseph Lead Company (32) and Figure
3.2-4 ls a detailed view of the furnace. These furnaces are essentially
vertical retorts which are heated internally. They are cylindrical in
shape having internal diameters of 5 to 12 feet and are about 40 feet
high. Beat i8 introduced electrically, utilizing the charge itself as the
resistance which develops the heat. Carbon electrodes inserted near
the top of the furnace are connected to similar carbon electrodes at
the bottom of the furnace by a column of solid charge. The charge is
prepared in the same manner as used in the vertical retorts an~ the
reactions are identical.
The Electrothermic Process condenses zinc by drawing (under
partial vacuum) bubbles of the effluent CO plus Zn(g) through a cooled
bath of liquld zinc.
Slnce heat in the Electrothermic Process is generated within the
charge, there ls no limitation to the size of these furnaces. They have
an the advantages of the vertical retorts but, however, they make use
of a relatively expensive method of heating.
Production from an 8 foot diameter electrothermic furnace is
approximately 50 tons of zinc per day.

19
To Resenooir
ST.
JOE JOE
ST .JΠSPEl.TΠfIG
Figure 3.2-3 St. Joseph Electrothermie Furnace (From Weaton et al. (32».

20
Fig. 3.2-4 Electrothermie Zinc Metal Furnace (33).

21
3. 3 Blast Furnace Smelting
The conception and implementation of the Imperial Smelting
Process deserves special attention since it represents a major break-
through in zinc smelting technology. For the first time, zinc can now
be produced in quantity, continuously, in a single unit. In 1967 the
largest Imperial Smelting R1rnace produced 56,000 long tons of zinc
as compared with 15,000 for the large st retort.
The Imperial Smelting Furnace (Figure 3.3-1) is a blast furnace
essentially modelled after the lead blast furnace.
The charge is a mixture of sintered (oxidized) lead-zinc concen-
trate, flux and coke. The blast is preheated air or oxygen enriched
air. Zinc vapour is drawn off near the top of the furnace while lead
and a copper matte phase is collected in the hearth. A supernatant
layer of iron-lime silicate slag is also collected in the hearth.
Volatilized zinc vapour is separated from the other comJ)<>Dents
of the gas stream (CO, CO2, N2, 1000oC) by condensation in a lead
splash condenser (inlet lead temperature - 450oC, outlet temperature
_570oC).

22
Figure 3.3-1 Imperial Smelting Furnace (36).
23
In the blast furnace, reduction of the Metal oxides according to
reaction (3.2-1), (p. 13) is extremely unlikely. Rather, gaseous reduction
will predominate. The reducing gas mixture is generated in the tuyère
zone where solid carbon is oxidized by the air blast according to:
C + l/~-CO
co + 1/~-C02
(3.3-1)
(3.3-2)
Above the tuyères, in the Metal reduction zone, the three principal reac-
tions are: znO + CO-Zn(g) + CO2 (3.2-2)
PbO + CO -Pb(l) + CO2 (3.3-3)
C02 + C~2CO (3.3-4)
It can be seen, therefore, that the essential difference between
the retort processes and the blast furnace or Imperial Smelting Process
is that oxygen is introduced through the tuyères to generate a) CO re
ducing gas from the charged coke and b) heat. The introduction of oxy
gen through the tuyères results, however, in a high CO2 concentration in
the off gas. Thus the blast furnace is faced with a condensation problem
which is largely absent in the retort processes, i. e., by reaction (3.2-5),
CO2 + Zn(g)-CO + znO. Typical off gas compositions run: 5-7% Zn,
12% CO2, 18% CO, and the remainder N2.
Consideration of the above reactions largely explains the following
unique features of the Imperial Smelting Process:
(a) The charge is preheated to approximately 8000 C before entering
the furnace to prevent the condensation of zinc vapour in the
furnace on the co Id charge.
(b) The air blast is preheated to between 6000 C and lOOOoC to
ensure that sufficient, heat is supplied to the Metal reduction
zone and to ensure a bot, fluid slag.
(c) The condenser is unique, using liquid lead splashes (4500C) to rapidly cool or quench the furnace gases to minimize the

24
amount of reoxidation of zinc vapour.
(d) The addition of top air (frequently 10% of the blast volume)
is unique and is employed to rai se the temperature of the
exit gases (to 1000oC) by burning zinc vapour to zinc oxide
and CO to CO2. The resultant increased temperature
minimizes the reversai of reaction (3.2-2) in the upper
part of the furnace and in the flues leading to the condenser.
(e) Zinc and lead leaving the condenser are separated by liquation
by virtue of the immiscibility gap in the Pb-Zn system above
420oC. Figure 3.3-2 shows the Pb-Zn phase diagram and
the condenser operating temperatures.
1
41
400 ~ l 'H-o,,-
1 r:-.' .. ·1 l»'~ 11t.~ Sol ""'! 1,. Sol. Sol. *' ",
31···T}----rI----..;."-: .. :--~-~.....:.~ ~o=--~~-~~~~~~--~~--~Jo
.,%",
Figure 3.3-2 Lead-Zinc Phase Diagram (from Smithells)(37)

25
3.4 Experimental Studies on Zinc Production
Although no experimental investigations with specific reference to
the fluidized bed reduction of zinc oxide or calcined zinc concentrates
have been reported in the literature, several investigations have dealt
with the feasibility of producing zinc by:
1) the gaseous reduction of the oxide using hydrocarbon gases;
2) the direct reduction of zinc concentrates using metallic
reductants.
In addition, a number of papers have been published dealing specifically
with the mechanisms and reaction kinetics of zinc oxide and zinc calcine
reduction by different gases.
As shown in Section 3.0 (Table 3.0-1) the retort processes for
the production of zinc still account for a major portion of the world' s
zinc output. Developed by experience over a long period of time, the
state of the art had, by the 1930's, been perfected to such a degree
that no major improvements could be implemented without a radical
change in method.
Maier (38), in a thermodynamic study of zinc smelting, showed
that the limits of the reduction of zinc oxide by Methane could be pre-
dicted by the following reactions:
znO + CB4~ Zn(g) + CO + 282
.4 GO tOOOOC = -14300 cal/mOle
CB4-C + 282
.4 GO 10000 C = -1200 cal/mole
(3.4-1)
(3.4-2)

26
ZnO + CO ~ Zn(g) + CO2 (3.4-3)
~ GO 0 = + 10500 calf mole 1000 C
znO + H2 -+- Zn(g) + H20 (3.4-4)
~Go 0 = +9600 cal/mole 1000 C
Doerner (39) confirmed Maier' s predictions by reducing calcined zinc
concentrates with Methane and natural gas in electrothermically heated
vertical retorts. Above 9000 C, reaction (3.4-1) was shown to proceed
rapidly and almost to completion. In addition, an increase in temperature
above 9000 C yielded an increase in the production rate of zinc.
Thermal decomposition of methane by reaction (3. 4-2) proved
troublesome on heating to the reaction temperature, 900-10000 C, but
this effect di mini shed above 9000 C except where there were local
deficiencies of zinc oxide.
Reoxidation of zinc, due to the reversibility of reactions (3.4-3)
and (3.4-4), was found to be an important hindrance to zinc condensation.
The product of this reoxidation was yellow, crystalline zinc oxide which
deposited in those areas of the retort where the temperature fell below
850oC. Although the effect of reactions (3.4-3) and (3.4-4) were not
studied in detail in the Doerner investigation, the net contribution of
the se reactions is indicated by the CO2
and H20 content of the gaseous
products. During al1 phases of the investigation the CO2 content varied
between 0.4% (at 9250 C ; low gas velocity) and 1. 3% (tOOOoC; high gas
velocity). No water vapour was detected in any of the tests. The maxi
mum amount of reoxidation would, therefore, be quite small.

27
The direct reduction of zinc concentrates has been the subject
of a number of experimental and pilot plant scale investigations. The
governing equation is of the form
znS + X ~XS + Zn(g) (3.4-5)
where X is a suitable reducing agent. Copper and iron have been the
most extensively employed reducing agents. Imbert (40) patented a pro
cess whereby either of the above reducing agents could be used to reduce
zinc sulphide at atmospheric pressure. At the high temperatures re
quired, the system was molten and this resalted in the formation of
copper matte. The reactants dissolved in the copper matte and thus
their activities were reduced.
Peterson (41) extended the experimental work in both small and
large scale tests. Although promising results were obtained on a small
sc ale , scaling-up of the tests resulted in excessive "blue powder"
formation. nBlue powdern is condensed zinc which has not coalesced
because of a coating of zinc oxide on the surface.
By the use of vacuum, Gross and Warrington (42) were able to
reduce zinc sulphide with iron at temperatures as low as 900°C. Their
results indicated that the rate of reaction was unaffected by the con
stitution of the ore (a synthetic zinc sulphide containing 97.7% Zn and
an ore containing 79.5% Zn were used). In addition, the results indicated
that the ratio of znS to Zn in the vapour phase was very small (l0 -3 to
10-6 at 9000 C and l0000 C respectively). This result was supported by
the results of a later study by McCabe (43) who measured the equilibrium
pressure above znS in the range 680°C to 825°C.
It is doubtful if zinc reduction using metallic reducing agents will
ever attain ecooomic success.

28
3.5 Rate Studies on the Gaseous Reduction of Zinc Oxide
Truesdale and Waring (44) conducted a study of the relative rates
of the reactions involved in the reduction of zinc ores. The method
employed was to measure the weight loss against time of specially pre-
pared briquets heated in a tube furnace in a stream of reducing gas.
Studies of the systems ZnO-CO and ZnO-H2 showed that hydrogen was
a more effective reductant than carbon monoxide. For the case of
roasted zinc sulphide concentrates and willemite (ZnO· Si02) ore, the
reaction rate was seemingly controlled by the diffusion of gas through
pores in the particles. Increases in the temperature and the gas flow-
rate both resulted in significant increases in the reduction rate.
Imoto et al (45) have studied the reduction of zinc oxide by hydro
gen at reduced pressure (lO-85mm Hg and 617-7620 C) in static gas and
a moving gas stream. These workers theorized that the zinc oxide
decomposed to zinc vapour and oxygen and that the hydrogen reacted
with oxygen in the vapour phase. That is, the reaction could he repre-
sented by the following set of equations:
ZnO-Zn(g) + 1/:D2
1/:D2 + H 2-H2°(g)
(3.5-1)
(3.5-2)
They suggested that the rate determining step is the reaction hetween
hydrogen and oxygen to form water vapour.
The reactions mainly responsible for the production of zinc in
the zinc blast furnace are:
znO + CO-zn(g) + CO2
C + CO2 --+-2CO
(3.5-3)
(3.5-4)

29
as was shown by Bodenstein (46) some forty years ago. Since each of
these reactions is dependent on the other for its supply of CO and CO2'
the overall rate of production of zinc vapour is determined by the
slower of the two reactions.
Maier (38) concluded that while the zinc reduction reaction (3.5-3)
is more rapid than reaction (3.5-4) at lower temperatures (..-1100oC),
the difference diminishes with rising temperature, although at 13000 C
reaction (3.5-3) is still faster.
Truesdale and Waring (44) suggested on the basis of their experi
mental results that reaction (3. 5 -4) could he accelerated by careful
selection of the type of carbon used. Charcoal, coke, and graphite
were shown to he progressively less reactive forms of carbon.
Shkuridin (47) has 'undertaken a comprehensive study of the kinetics
of zinc oxide reduction by pure carbon monoxide. The investigation
indicated that the process is a complex one influenced by temperature,
the CO partial pressure in the gas stream, and the coarseness of the
material. The dependence of the reaction rate constant on the CO
partial pressure was gi ven by:
n K :: APCO (3.5-5)
where K is the reaction rate constant. "A" is a constant related to the
equiUbrium constant for reaction (3.5-3), and PCO is the CO partial
pressure. "n" is an empirical constant for each experimental calcine.
Jones and Davis (48) successfully accelerated reaction (3.5-3) by
lncorporating in the reduction system the nonreducible oxide, srO. The
modified reduction equation becomes:
znO + CO + SrO~Zn(g) + SrC03
Using this technique, reduction rates an order of magnitude greater
than for the unmodified reaction were realized.
30
(3.5-6)
Langenberg (49) obtained similar results using lithium cations to
alter the reduction mechanism, while Doerner (39) used nickel as a cata-
lyst in some of his reduction tests with Methane and natural gas.
3.6 Summary
New and fresh ideas in the field of zinc production metallurgy
have had a slow and rather unsuccessful emergence. After abandoning
further work on the improvement of the old retort processes, recent
attention has been aimed at gaseous and direct reduction processes, with
only partial success in each. Invariably the ultimate failure of the
design concept can, in each case, be attributed to a) excessive reoxida
tion of the distilled zinc (1. e., condensation problems), or b) production
rates which were too slow to be economically attractive (1. e., the direct
reduction processes).
Of aIl the processes investigated in these feasibility studies, only
one, the Imperial Smelting Process, discussed earlier in this chapter,
has emerged as an alternative to the retort processes. Still, this pro
cess suffers from some unattracti ve features, particularly low purity of
product and a high quantity of zinc recycling as drosses and "blue powder"
which threaten Us further adoption in North America.
Clearly. further study is required in the area of zinc production
metallurgy. Little or no reported work has considered the possibility
of producing zinc by the reduction of zinc calcine in a fluidized bed.

CHAPTER FOUR
OTHER EXPERIMENTAL WORK INVOLVING THE
REDUCTION OF METAL OXIDES IN FLUIDIZED BEDS
4.0 Fluidized Bed Reduction of Iron Oxides
31
Chapter Two has cited five specific instances where the fluidized
bed reduction technique for iron oxides has proved successful enough
to warrant the construction of semi-industrial scale pilot plants and
fully fiedged production plants. The intent has been to find a replace
ment for the Iron blast furnace.
Recent experimental investigations have centered upon the use of
fluidized beds to reduce Iron bearing materials whieh are not sui table
for eharging to the blast furnace. The most notable of these materials
is mill seale whieh is, because of its high purity, an exeeptionally good
starting material for the production of high purity iron powders.
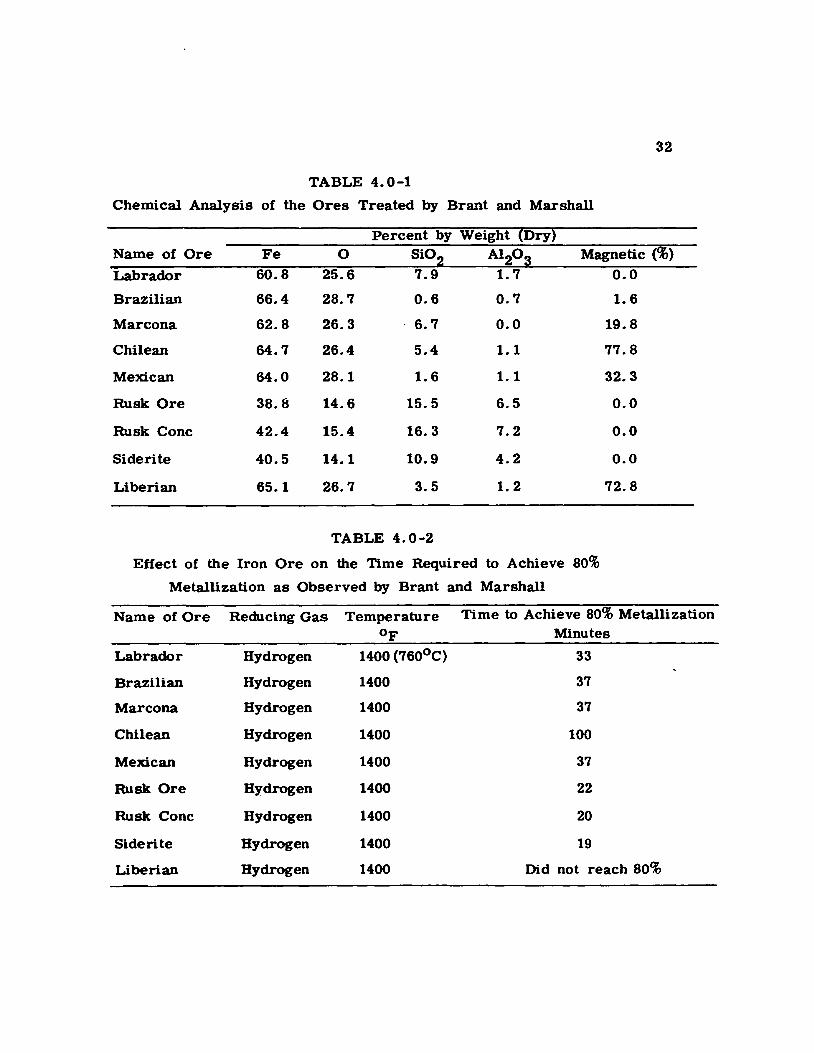
Brant and Marshall (50) conducted an extensive survey of the
redueibility of a wide range of iron ores with hydrogen and mixtures of
H2' CO, and N2 in a fluidized bed at 14000 F. Fine partiele sizes were
used (usually -20 + 100 mesh) and it was noted that large variations in
the reduetion rates resulted. Table 4.0-1 shows the ehemical analyses
of the ores studied and Table 4.0-2 shows the observed times required,
under Identical con.ditions, to achieve 80% metallization of the irone
These authors concluded that it was necessary to select ores that reduee
rapidly for use in low temperature reduetion processes.
It Is on this latter point that the Iron blast furnaee demonstrates
its versatillty Binee it will make liquid iron from any material which
eontalns irone fi the lower temperatures in the upper shaft are insuf-
32
TABLE 4.0-1
Chemical Analysis of the Ores Treated by Brant and Marshall
Percent by Weight (Dry) Name of Ore Fe 0 Si02 A120 3 Magnetic (%)
Labrador 60.8 25.6 7.9 1.7 0.0
Brazilian 66.4 28.7 0.6 0.7 1.6
Marcona 62.8 26.3 6.7 0.0 19.8
Chilean 64.7 26.4 5.4 1.1 77.8
Mexiean 64.0 28.1 1.6 1.1 32.3
Rusk Ore 38.8 14.6 15.5 6.5 0.0
Rusk Conc 42.4 15.4 16.3 7.2 0.0
Siderite 40.5 14.1 10.9 4.2 0.0
Liberian 65.1 26.7 3.5 1.2 72.8
TABLE 4.0-2
Effect of the Iron Ore on the Time Required to Achieve 80%
Metallization as Observed by Brant and Marshall
Name of Ore Redueing Gas Temperature Time to Aehieve 80% Metallization oF Minutes
Labrador Hydrogen 1400 (760oC) 33
Brazilian Hydrogen 1400 37
Mareona Hydrogen 1400 37
Chllean Hydrogen 1400 100
Mexiean Hydrogen 1400 37
Rusk Ore Hydrogen 1400 22
Rusk Cone Hydrogen 1400 20
Siderite Hydrogen 1400 19
Liberian Hydrogen 1400 Did not reaeh 80%

33
ficient to give rapid reduction of the ore, the higher temperatures in
the hearth will be more than adequate.
Masonov and co-workers (51) studied the reduction of iron ore
68.3% Fe (0.22% FeO, 97.2% Fe203) and rolling mill scale 71% Fe
(39.1% FeO, 1. 2% metallic Fe, and 56.3% Fe203) with hydrogen at
elevated pressures in a single stage fluidized bed. Batch type operation
was carried out at temperatures between 490 and 6500 C. The results
showed that the use of elevated pressures (up to 30 atm.) increased
the reduction rate of these materials for the range of variables studied
(temperature, particle size, hydrogen flowrate, and pressure). The
following table (Table 4.0-3) shows the effect of hydrogen pressure on
the reduction of the iron ore at a temperature of 4900 C and a hydrogen
fiowrate of 2. 5 li ters/ sec. TABLE 4.0-3*
Effect of Hydrogen Pressure on Iron Oxide Reduction
Time Temp. % Reduction
mins. oC 3 atm 4 atm 5 atm 6 atm
5 490 21.9 31. 2 35.1 38.5
10 490 47.4 58.6 64.0 70.8
15 490 70.8 81. 5 85.6 92.5
20 490 84.9 89.0 93.0 95.9
25 490 93.0 89.8 94.3 96.0
• Charge weight in each case was 300g.
These authors attributed the increase in the reduction rate with increas-
log hydrogen pressure to the greater concentration of reducing gas per
unit area of reactiog surface. In addition the use of high pressures had
the added advantage of allowing the use of higher hydrogen flowrates
without increasing dust losses.
Okura and Lu (52) were successful in further improving the
efficiency of utilization of reducing gas in the fluidized bed reduction
34
of hematite (-35 + 100 mesh) with hydrogen and H2 -N2 mixtures at
500-700oC by using a cyclic gas flow technique. The technique involved
interrupting the gas flow (to zero flow) 2 or 4 times per second. These
authors claim that improvements in the gas efficiency of the order of
20% resulted from an inducement towards particulate fluidization (absence
of bubbles, channels, and slugs) by preventing or curbing these abnor
malities. It was also found that the active solids circulation, an
indication of a well fluidized bed of fine particles, was maintained
even during the off-cycle.
The effect of the cyclic operation was MOSt pronounced for
cases in which poor fluidization was obtained under steady flow condi
tions. The beneficial effect of cyclic operation diminished with improved
fluidization quality but at no time was it worse than experienced under
steady gas flow conditions.

35
4. 1 Summary and Comments
Understandably, of the few Metal oxides which have been reduced
in a fluidized bed apparatus, by far the MOst time and effort has been
consumed in studying the possibility of reducing iron ores. As stated
in Chapter Two, the initial challenge was to find an acceptable alterna
tive to the iron blast furnace.
Since that time, however, blast furnace operators have succeeded
in improving the efficiency of the blast furnace to such an extent that
fluidized bed reduction schemes are only useful for special applications
such as the reduction of iron bearing minerals unsuitable for charging
to the blast furnace and for the production of high purity iron powders
from essentially pure iron oxide.
It can be seen that the potential use of fluidized beds for Metal
oxide reduction purposes has been well recognized and that the process
has been studied in detail for several systems. It is clear, however,
that commercial installations of fluidized beds for the reduction of
oxides are still restricted to rather special cases of feed materials
and products.
36
CHAPTER FIVE
THEORETICAL CONSIDERATIONS OF FLUlDIZATlON
5.0 The Behaviour of Gas Fluidized Beds
When a fluid is passed through a bed of fine solids at a low rate,
it emerges at the upper bed surface by routing itself around the station
ary particles. Such a situation is termed a fixed bed and is best
illustrated metallurgically by the upper shaft conditions in blast furnace
processes.
As the flow rate increases, there is no apparent change in the
outward appearance of the bed until a flowrate is reached at which the
pressure drop across the bed equals the buoyant weight of the particles
per unit area of the bed. Observation of the bed at this flowrate will
indicate a few vibrating particles which move about in restricted areas.
This state of particle motion is regarded as an expanded bed. In both
liquid and gas fluidized beds, an expanded bed constitutes a homogeneous
system (1. e., the solids and fluid form a continuous phase).
With progressi vely higher flowrates, the bed continues to expand.
In gas fluidized beds, however, there is a limit to this expansion, in
direct contrast to liquid fluidized beds. In both cases, a flowrate is
reached where the particles are all just suspended in the upward fluid
flow. The frictional force between the particle and the fluid counter
balances the weight of the particle. The bed is considered to be just
fluidized and this situation is referred to as an incipiently fluidized
bed or a bed at minimum fluidization.
37
In liquid fluidized beds an increase in the flowrate above mini
mum fiuidization results in a progressive, smooth expansion of the bed.
Except in very unusual cases, the bed remains homogeneous and is
described as a particulately fiuidized bed.
In contrast, the behaviour of gas fluidized beds above minimum
fluidization is markedly different. The bed becomes unstable due to the
formation of a bubble phase which is relatively solids-free. Gas in
excess of that required to pro vide incipient fluidization short circuits
through the bed via the bubbles. Such a condition has been defined as
two phase" fluidization, aggregati ve fiuidization, heterogeneous fiuidization,
or bubble fluidization. The two phases which are present in a dense
phase bubbling bed are: 1) the bubble phase, virtually free of solids and
2) the particulate phase which, evidence shows, virtually retains mini
mum fiuidization conditions irrespective of how far above the minimum
fluidization conditions the bed is.
5.1 The Minimum Fluidizing Velocity
Undoubtedly one of the most important design variables for
fiuidized beds is the minimum fluidizing velocity. Much of fiuidization
theory (i. e .• predictions of heat and mass transfer rates, solids mixing
characteristics, bubble motion, etc.) involves a knowledge of this vari
able. The minimum fiuidizing velocity sets a lower limit on the gas
input rate to a fluidized bed. The upper limit on the gas input rate
is governed by the velocity which will carry the solids from the bed.

38
Severa! methods have been proposed to determine the minimum
fluidizing velocity (Umf) or minimum mass velocity (Gmf). These include:
1) observing the gas input rate at which bubbles first appear
in the bed;
2) observing the change in the heat transfer coefficient with
increasing gas flow;
3) measuring the pressure drop through the solids in the fixed
bed state.
The pressure drop method (3) is the MOst popular and the MOst
reliable technique and it has been used throughout this investigation.
Figure 5.1-1 (p. 39) shows, for example, a typical experimental graph
of the pressure drop across a bed of zinc calcine (average particle
size 73 microns) plotted as a function of the mass gas flowrate of
hydrogen (inlet temperature, 23.50 C; average gas pressure in the bed,
1 atmosphere). This experimental curve was obtained by fluidizing
zinc calcines in a clear acrylic plastic bed (2 inch i. d. ). These
experiments were performed to determine a suitable distributor plate
for the high temperature zinc reduction studies. The distributor, in
this case, is porous fireclay insulating brick. A detailed description
of the experiments is presented in Appendix I.

31~ figure 5.1 -1 (This Work)
Average Particle Diameter -131Microns Fluidizing Gas - Hydrogen 99+%
o Inlet Gas Temperature- 23.5 C
25'"'1 Average 8ed Pressure- 1 Atmo~ ..
l 21 ., -="'0 ë:e ~ E 15 Q.~
d~ G)
'" ~ 18 ct
5
D It'V o
Solids Density - 3.1&gm cm-3
5 10 15
o
20 25
Mass Flow Rate G (Gms. Cm-2 Min-1) x 10-3 30 35 48
==

40
Figure 5. 1-1 indicates that as agas flows upwards through a
bed of finely divided particles, there is a definite pressure drop across
the bed. In the fixed bed state, this pressure drop is a direct function
of the gas flowrate and is approximately linear. Theoretically, the bed
will fluidize when the pressure drop across the bed equals the bed
weight per unit area. In practice, however, a slightly higher pressure
drop is required to overcome inertial forces.
At flowrates higher than those required for minimum fluidization
there is a relaxation in the pressure drop followed immediately by a
recovery. Under ideal conditions the pressure drop will recover and
level off to a constant value equal to the bed weight per unit area. The
pressure drop then becomes independent of the gas flowrate.
Many investigators have attempted to predict. the minimum fluid
izing velocity. Kunii and Levenspiel (2) related the pressure drop through
a fixed bed to the weight per unit area of the bed at minimum fluidiza-
tion and deri ved the following relationship:
Gmf = (.s· Dp)2. P,' (ps - Pf)' g' Emf3
150' JI' (1 - Emf)
where G mf is the minimum fluidizing gas mass velocity in
gms cm -2sec-l
'" s is the particle sphericity 0 a factor to account for
the fact that the particles are not perfect spheres.
Dp is the particle diameter in cm
Pfo ps are the fluid and particle densities in g cm -3 .
(5. 1-1)

41
E mi is the fraction of the bed at minimum fiuidization
occupied by the particles, known as the minimum voidage
fraction
Jl is the gas viscosity, gcm-1sec-1
Since the parti cIe shape and the minimum voidage fraction are generally
not known for design purposes, a great deal of work has been done to
develop expressions omitting these terms. The generalized expression
MOSt c\Jmmonly used (53) has been of the form:
abc = k· Dp . (ps - Pf) . Pf
pd
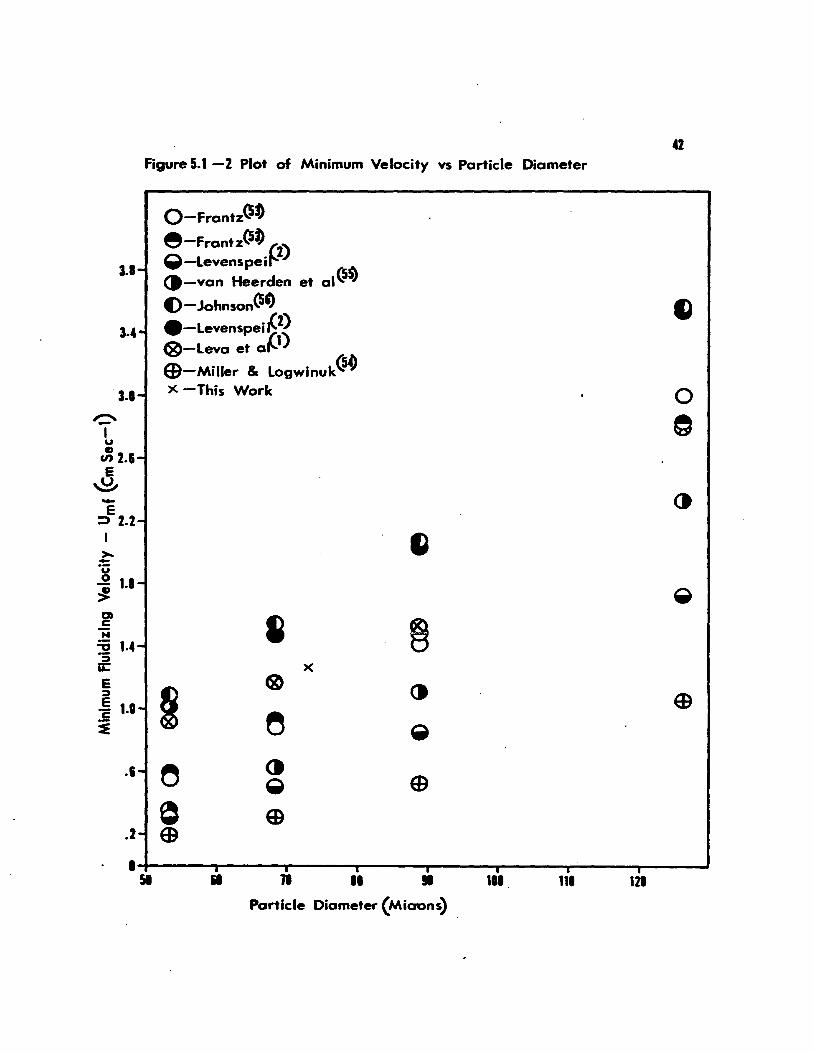
Figure 5.1-2 (p. 42) is a plot of equation 5.1-2 and several other
(5. 1-2)
theoretical expressions developed by a number of investigators. The
example shown in Figure 5. 1-2 is for the fiuidization of zinc calcines
by hydrogen "at 800oC. The expressions are given in Table 5.1-2.
Figure 5. 1-2 demonstrates the vast disagreement between
investigators.
Where a mixture of particle sizes is to be fiuidized, D is subP
stituted by the average particle size of the mixture which can be obtained
from the expression
where D is the average parti cie diameter p
Xl is the weight fraction of the i th particle size
(5.1-3)
Dpi is the particle diameter of the i th weight fraction
42 Figure 5.1 -2 Plot of Minimum Velocity vs Particle Diameter
O-Frantz(5~ e-Frantz(5~
3.1-g-Levenspei~2) (t-van Heerden et al(5~ ()-JohnsonO"
3.4- e-levenspei f:~ ®-Leva et a
ED-Miller & LOgwinuk(~ 3.1- X -This Work 0
~ ~ 1 u G
en 2.&-E ~
() -E ::l 2.2-1 ~ >. -·ü ~ loI-
=> D»
i c N :.0 1.4-"5 a:: X
e
~ ® ct :»
E 1.1-i: ~ ~ Q
.1- ~ ct ~
~ ED .2- œ • li li • • • • • 51 Il • III 111 121
Partide Diameter (Miaons)
43
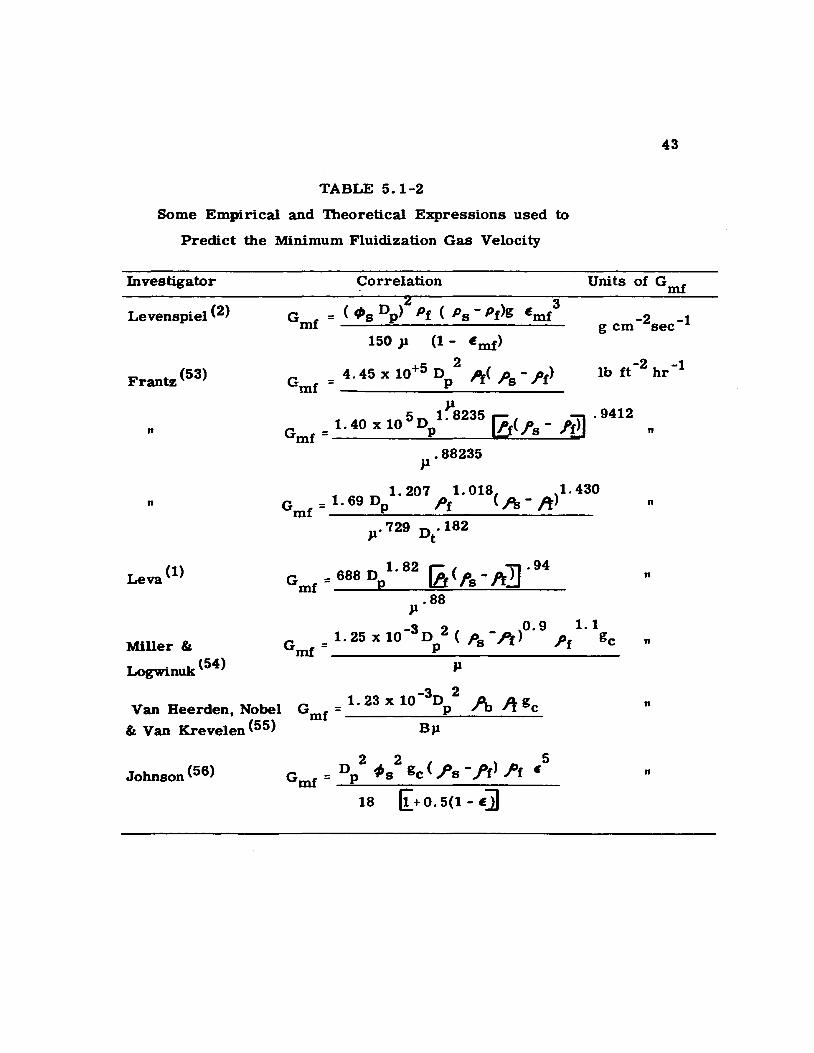
TABLE 5.1-2
Some Empirical and Theoretical Expressions used to
Predict the Minimum Fluidization Gas Velocity
Investigator
Levenspiel (2)
Frantz (53)
n
"
Leva (1)
Miller" Logwinuk (54)
Van Heerden, Nobel
" Van Krevelen (55)
Johnson (56)
Correlation Units of Gmf
2 3 = (t/Js Dp) Pf { Ps - Pf)g Emf
g cm -2sec -1 150)1 (1 - Emf)
2 G
mf = 4.45 x 10+5 Dp Pr{ Ps - .Pf)
5 1 ~8235 .9412 G
mf = 1. 40 x 10 Dp I!.r{.fs - .fi!] "
.88235 JI
1. 207 1. 018{ )1. 430 G
mf = 1. 69 Dp Pf Pa - ft n
.729 D .182 Jl t
1. 82 r: ( )1 . 94 G mf = 688 Dp III /'S -1't..:J "
Jl .88
-3 2 0.9 1.1 G mf = 1. 25 x 10 D P (Pa - Pt) Pf gc n
P
-3 2 G
1. 23 x 10 D D. 4 gc mf = p / b FI "
B)l
n

Similarly, for cases in which mixtures of gases are to be used, the
appropriate weighted average values of the gas viscosity and density
must be employed. These are given by
44
JI mix = Pmix '\Yi Pi
(5. 1-4)
L:Ji.i and
where Yi' Pi' Pi' Vi are the weight fraction, density,
viscosity and volume f radion of each gas in the
mixture.
(5.1-5)
The disagreement between the results of the theoretical equations
has made it necessary to use, in the high temperature experiments of
this work, the average of these equations to represent the minimum
fluidizing gas velocity at elevated temperatures.
The results in Figure 5.1-2 based upon the theoretical expressions
have assumed that the particle sphericity was 0.6 (i. e .• the ratio of the
volume of the particle at diameter d to the volume of a sphere of
equivalent diameter d was 0.6).
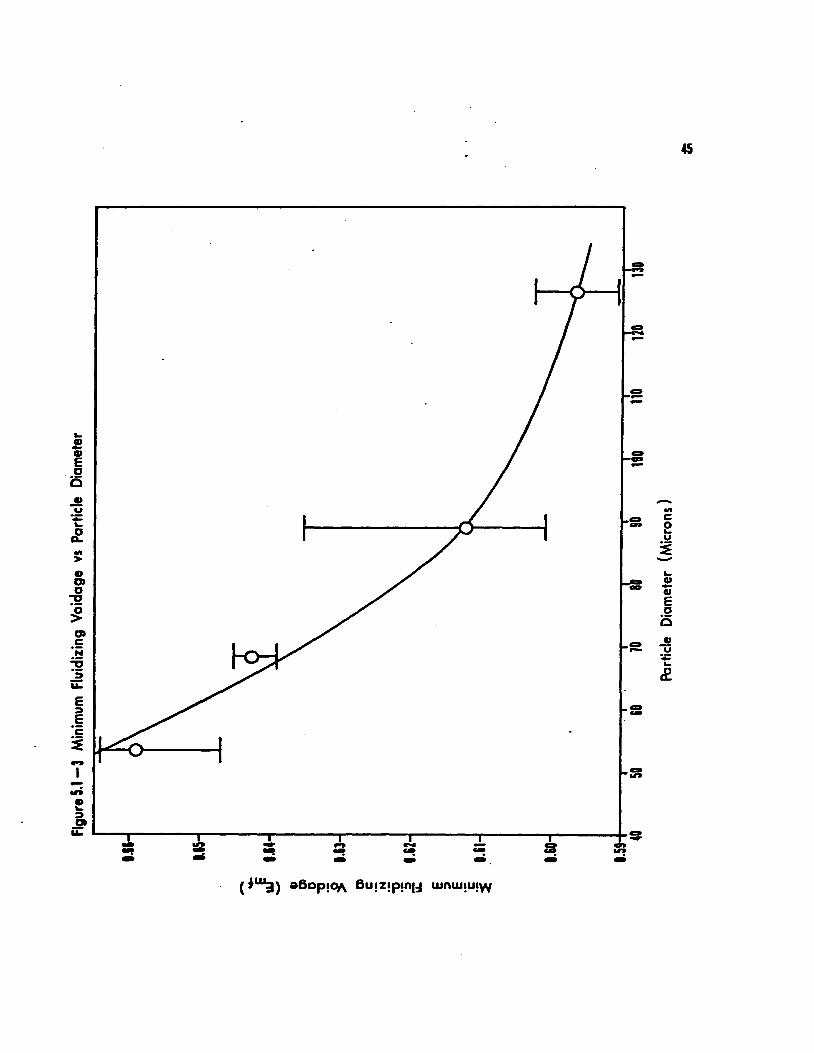
The minimum fluidization bed voidage fraction ( E mf) was based
on the values obtained for the packed bed case as described below.
(_,iS shown as a function of parti cie diameter in Figure 5.1-3 (p. 45).
... ~ CD E
.. 2 Cl
CD U '; ... ~
-1 -.ft IJ ... ~ Dt
ü: ~--~--------~------~r-------~---------r--------'---------r-------~~ ." ..
-lit c: e u ~ -... cu -cu E o i5
45
46
The particle fractions were obtained by screening a portion of
the calcine into four size fractions - -100+150 mesh, -150+200 mesh,
-200+270 mesh, and -270+325 mesh material using Tyler series screens.
The particle size corresponding 10 each size fraction was assumed 10 be
the simple average of the two limiting mesh sizes, expressed in microns.
The fixed bed voidage was determined by pouring each size frac-
tion in10 a container of known volume and by weighing. The bed voidage
was calculated as
where
w E=l--
V Ps
w is the solids weight occuping the container
V is the volume of the container
Ps is the solids density
(5.1-6)
The solids density of the zinc calcine was determined by means
of a pycnometer using Shell Canada Limited 911 Pella Oïl as a liquid
displacent and was found 10 be 3.76 g cm -3.
The procedure for finding the fixed bed voidage fraction was re
peated four times for each size fraction and an average value was ob
tained. Figure 5. 1-3 indicates the spread in values obtained. Although
Johnson (56) suggests that in the calculation of the minimum fluidization
velocity, the minimum fluidized bed voidage fraction should be considered
as 8-10% larger than the fixed bed voidage, this was not adhered to in
the present investigation and fixed bed voidage was substituted directly
into the theoretical expressions.
In this investigation, the minimum fluidizing velocity will refer to
the values given by Figure 5.1-4 for the appropriate operating conditions.

., Figure 5.1- 4 Plot of Minimum Fluidizing Gas Velocity vs Partide Size
1~--~~-------------------------------------------, 1000 e
--1 ~ en E
U 9000e --E
;:)
1 >.. o~ u 0
~ III
c3 Q c ON :g :)
ti:
E :)
E BOOoe ë i
Particle Size (Microns)

48
5.2 The Terminal VelQcity
As mentioned in Section 5.1 (p. 37), the upper allowable limit on
the gas velocity through a fluidized bed is the velocity which will trans
port the particles from the bed. For parti cie Reynolds numbers less than
0.4, Levenspiel et al (2) show that the terminal velocity, Ut (cm sec-1),
can be expressed as 2
= g( PB - .Pf) Dp
18 JI (5.2-1)
Experimentally it has been found that the terminal velocity is
50-90 times the minimum fluidizing velocity. Extremely turbulent con
ditions are experienced in most gas fluidized beds at gas velocities as
low as 6-11 times Umf' (2) The terminal velocity is, therefore, very
rarely a critical variable except in those cases where a mixture of
solid particles contains a wide range of particle sizes.
5.3 Summary
This chapter has presented a description of the behaviour of
fluidized beds particularly in terms of the minimum fluidization velocity.
A review of methods for calculating the minimum fluidization velocity
has been presented and the difficulties encountered wi th the calculations
have been discussed.
In addition. the minimum fluidizing velocity for the zinc calcine
hydrogen system being studied in this investigation has been predicted
on the basis of experimental and present knowledge.

49
CHAPTER SIX
ROASTING OF ZINC CONCENTRA TES
6. 0 The Physical Chemistry of Zinc Concentrate Roasting
The increasingly important position of the electrolytic process
for the production of high purity primary refined zinc has been noted
(Table 3.0-1, p. 12). The general practice followed to produce electro
lyte is to leach roasted zinc concentrates in dilute spent electrolyte.
However, a serious obstacle encountered in the electrolytic process
is the formation of the compound zinc ferrite, ZnO· Fe203, which is
only sparingly soluble during the normal leaching of roasted zinc con
centrates containing iron. Its formation constitutes a zinc loss in the
residue which is proportional to the iron content of the ore.
In addition, although the principal product of the roasting pro
cess is zinc onde, the formation of the normal form of zinc sulphate,
znS04 ( ex) or a basic zinc sulphate, znO· 2ZnS04 , is unavoidable.
During normal roasting the conditions of temperature and air admission
are controlled in an attempt to produce just sufficient zinc sulphate to
overcome losses in the electrolysis circuit.

50
There are very few thermodynamic data available on the forma
tion of zinc ferrite and as a result its behaviour under conditions of
gaseous reduction in a fluidized bed reactor is not predictable. Zinc
ferrite formation apparently poses no problems in retort and blast
furnace smelting where reduction is carried out at relati vely high
tempe ratures (1100-1300oC). Fluidized bed reduction units would
normally be run at 800-1000oC to prevent any fusion of calcine com
}X>nents and at these temperatures the characteristics of zinc ferrite
formation may be considerably different.
In the absence of reliable information on the formation and
reduction of zinc ferrite, it is useful to examine the roasting process
with particular emphasis on optimizing conditions to retard the forma
tion of zinc ferrite.
The approach conside red is that demonstrated by Benner and
Kenworthy (57). Because of the complexity of the problem, the se
authors first calculated the thermodynamic data for the ternary systems
Zn-S-o and Fe-S-o. They then superimposed the two ternaries to
obtain the quaternary system Zn-Fe-S-o. The reactions of the
individual systems were assumed not to be altered by the super-
imposition. The resulting diagrams for the Zn-Fe-S~ system
were di vided into fields in which iron and zinc compounds could
co -exi st in stable configurations, i. e., at uni t acti vi ty .
In this chapter the approach has been modified to include the
existence of a basic zinc sulphate as reported by Ingraham and
Kellogg (58) . The effect of roasting tempe rature , and the partial
51
pressures of 02 and 802 on the formation and stability of co-existing
compounds is examined.
The equations examined and the associated equilibrium con-
stants for the Zn-S~ system are given in Table 6.0-1. The data
used are that of Ingraham and Kellogg (58) . The fixing of a constant
value of the sulphur dioxide partial pressure, Pso ' of 0.1 atmos-2
pheres permits plotting of the fields of stability of the various
possible compounds in the Zn -S ~ system as a function of the
oxygen partial pressure and roasting temperature. A sulphur
dioxide partial pressure of O. 1 was chosen because i t represents
the sulphur dioxide levels experienced industrially (Canadian Electro-
lytic Zinc Co. Ltd .• Valleyfield, Quebec). This plot is shown in
Figure 6.0-1.

TABLE 6.0-1
Equllibrium Constants for Reactions in the Zn-So{) System Reaction
Log10K
Reaction 9000K 10000K 11000K 12000
K
(1) 3ZnS04 (a )-ZnO' 2ZnS04 + S02 + 1/~ -3.978 -2. 119
(2) 3ZnS04 (" ) .... ZnO· 2ZnS04 + S02 + 1/2~ -0.869 +0.151
'(3) 1/2(ZnO' 2ZnS04) .... 3/2ZnO + 802 + 1/2~ -5.260 -3.394 -1. 880 -0.627
(4) 3ZnS t 11/202 ..... ZnO· 2ZnS04 + S02 75.843 64.354 54.973 47.170
(5) znS + 3/202~ZnO + 802 21. 774 19.189 17.071 15.305
(6) Zn(1,g) + 1/282 ..... ZnS 10.344 8.778 7.501 6.354
(7) Zn(l,g) + 1/202-+ZnO 14.922 12.872 11.196 9.716
(8) 1/282 ... 02 ..... S02 17.196 15.094 13.376 11.943
(9) 1/ 202 t- 802 " S03 0.810 0.257 -0.190 -0.559
13000
K
+1. 008
+0.424
40.627
13.825
5.060
8.154
10.731
-0.866
Ut N

53
FIGURE 6.0-1 The Zn-S-O Sy!-tem
P : 1.1 Atmospheres S02 .
o
ZnO
-10
-20
Zns
-40
-5nJ2~5-----------2~0-----------1'.S----------~1.CO~--------~0.S 1000 --r

54
These data can be plotted as a function of the LogtOPS02 vs Log1oP02
at constant tempe rature as presented in Figure 6. 0 -2 for three
values of the roasting temperature (1100, 1200, 1300oK). The fields
in Figure 6.0-2 represent fields of unit actiyity. For example, the
field marked znS04( a) shows the temperature and P802
and P02
conditions under which pure znS04( a ) can existe
Examination of these equilibrium diagrams illustrates several
significant facts about the Zn-S-O system.
1) The field of stability of zinc Metal is bounded by extremely
low values of Po and P80 and hence roast-reduction type 2 2
reactions, common in copper and lead metallurgy, i. e. ,
reactions of the form
Cu~ + CU20 --P6Cu + 802
PhS + 2PbQ-...3Pb + 802
are not attainable in zinc metallurgy.
2) Whereas the equilibrium decomposition has long been
held to follow the reaction:
ZnS04~ZnO + 802 + 1/202
this reaction is, in fact, impossible under normal roast-
ing conditions, i. e., the diagrams indicate that the
decomposition must proceed in two stages represented
by the reactions
and 1/2ZnO· 2ZnS04-t-3/2ZnO + 802 + 1/202
The requirement of the two reaction steps is indicated
by the fact that the znO and znS04 areas are in no
case adjacent to each other at temperatures up to
1300oK.
3) Since most roasters are operated under conditions to
produce only a small amount of sulphate in the calcine,
the basic zinc sulphate (ZnO· 2ZnS04) and not the normal
zinc sulphate (znS04) should report.
4) For roasters operated at close to equilibrium condi-
tions, Figure 6.0-2 can be utilized to predict the type
of calcine which should result from the roasting of
sphalerite. For example, Figure 6.0-2 shows a roaster
operated with a roaster gas composition 6% O 2 and
10% 802 (Canadian Electrolytic Zinc Co. Ltd. practice).
At the lower temperablre, the roaster will produce a
calcine of basic sulphate. To obtain a calcine of zinc
mdde, higher roasting temperablres are required or a
gas leaner in O2 and 802.
55

1
0-~cn _ .. -C)
.9 -1
-1
T=1100oK 1
T=1200 K
ZnS
= C) 0 -'
ZnO
-25 -20 -15 -11 -5 • 5 -28 -15 -11
Log10
PO 2
LogU
P02
1 T=1300 K
ZnO
n(l,g)
-21 -15 -li -5 • 5
LogllPO 2
figure 1.1-2 Stable Equilibria in the Zn-S-O Sysfem. Areas are Regions of Stability of one Condensed Phase as Marked.
51
-5 0 5

57
6.1 The Fe-S~ System
Since there has been less interest in the roasting of FeS than znS,
there are fewer published thermodynamic data on the Fe-S~ system than
on the Zn-S-O system. Within the system the compements FeS2' FeS,
FeO. Fe304. Fe203' and Fe2(804)3 are known to exist and thermodynamic
data have been published for the se compounds. In addition there is likely
to be a number of basic sulphates and other complex compounds associated
with the system. No thermodynamic data have been published for these
compounds and hence potential reactions between the known compounds only
are included in this study. The Fe-S-O system has been studied in the
same manner employed for the Zn-S-O system. The reactions considered
and the equilibrium constants are gi ven in Table 6. 1-1.
TABLE 6.1-1
Equilibrium Constants for Reactions in the Fe - S -° System
Reaction Log10K
400 900 1000 1100 1200 1300
1) Fe203 + 3/202 + 3S02-Fe2(804)3 69.2 7.1 2.2 -1. 7 -5.0 -7.9
2) 4Fe304 + 02~6Fe203 -46.9 -13.1 -10.4 -8.2 -6.3 -4.8
3) 3FeS + 502-Fe 30 4 + 3802 208.0 81. 5 71.4 63.2 56.4 50.6
4) 2FeS + 7/202~Fe203 + 2802 199.7 78.9 69.4 61. 5 55.0 49.5
5) 2FeS + 502 + 802~Fe2(S04)3 214.8 63.6 51. 5 41. 6 33.4 26.4
6) FeS + 3/202~FeO + 802 57.7 23.2 20.4 18.2 16.6 14.7
7) 3FeO + 1/202-+-Fe304 34.9 11. 9 10.2 8.8 7.6 6.6
1500 -12.5
-2.3
41.4
40.6
15.2
12.1
5.0
The equilibrium constants for the reactions in Table 6.1-1 were
calculated from the thermodynamic data provided by Benner and
Kenworthy(57). Table 6.1-1 does not show data for the reactions
involving Fe52 because it readily decomposes at low temperature to
Fe8 and 52 (g). Equations 1 to 7 provide the boundary lines for
Figure 6.1-1 and it can readily be seen that only reactions 1 to 5
can form stable compounds at the temperature and atmospheric con-
ditions (PS02 = O. 1 atmospheres) of this figure. The two invariant
points shown in Figure 6.1-1 can be represented by the equations
10Fe~3 + 27802 ~ 7Fe2(S04)3 + 6Fe8
and 7Fe304 + 802 ---- 10Fe203 + FeS
Figure 6. 1-2 is a plot of the equations found in Table 6.1-1
as a function of the oxygen and sulphur dioxide partial pressures.
The temperatures correspond to those used in the development of
the corresponding plots in the Zn-8-0 system. Under a normal
roasting atmosphere (Log10P02 and Log1oPS02 hetween -1 and -2),
Figure 6. 1-2 indicates that he mati te (Fe203) should he the stable
form of iron oxide. As with the Zn-8-0 system the stability of
liquid or solid iron is bounded by extremely low partial pressures
of oxygen and sulphur dioxide.
58

-1
-3
15
Figure 1.1-1 The Fe-S-O System
PSO
: 1.1 Atmospheres 2
11 1.5
59
FeS
tl 1.5

1°-------~~----------------T=l100oK
-20 -15 -10 -5
L09,0PO 2
o
-20 -15
5 10 -20 -15
-10 -5
Log,0'O 2
o 5 10
Figure U-2 Stable Equilibria in the Fe-S -0 System.
Areas are Regions of Stability of One
Condensed Phase as Marked.
&8
o 5 10

6.2 The Zn-Fe-S-Q System
Benner and Kenworthy(57) found that by superimposing the
Zn-S-Q system on the Fe-S-Q system, a good qualitative repre
sentation of the Zn- Fe-S-Q system cou Id be achieved which agreed
within reasonable limits with experimental observation. Figures
6.2-1 and 6.2-2 are the results of the superimposition.
61
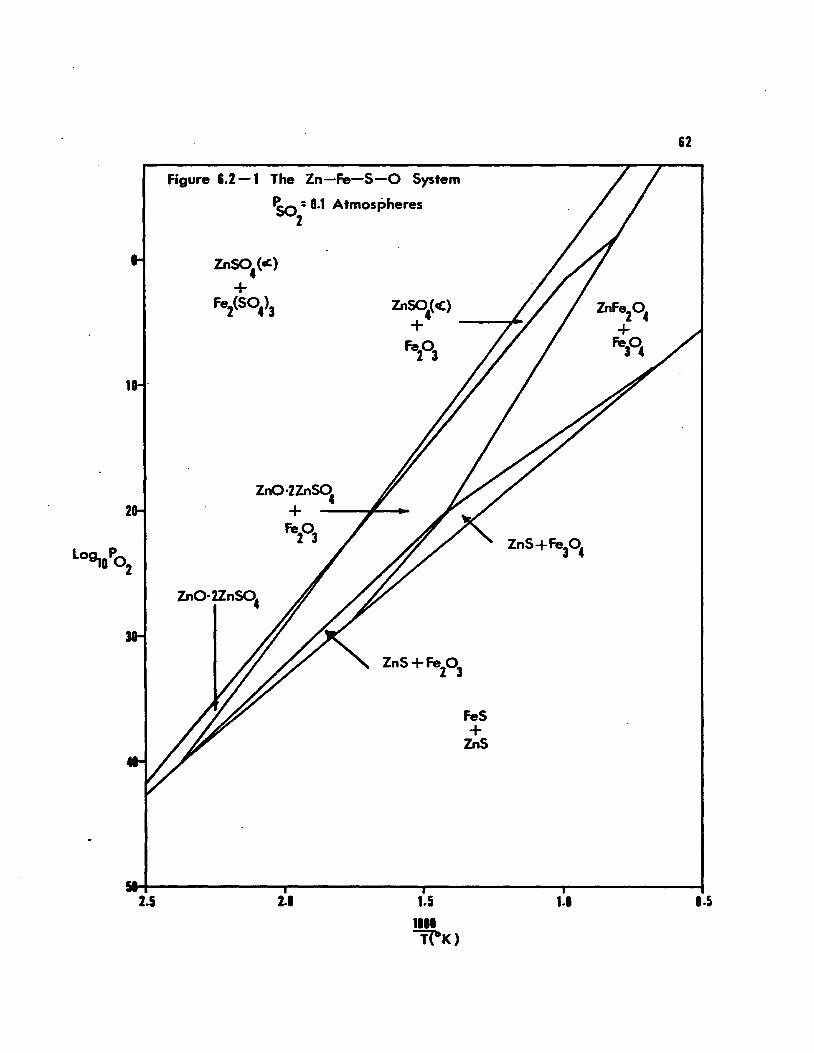
1 .
Z
2.5
Figure I.! -1 The Zn-Fe-S-O System
150: 0.1 Atmospheres Z
ZnS04
(.c)
+ Fe!(S04)3 Znso
4(cC)
+ ---.,-Fa
Z0
3
ZnO·zZnsq + ---#-~ Fe
Z0
3
2.1 1.5 1111 ftbK)
FeS + Zns
&2
1.1 1.5

cr en ~
0
W-i ~
-1
-2
Zns +
FeS
Zn Fe20. +
F;0. -f ZnFe20. + Fe3O.
-2 -25 -21 -15 -18 -5 D 5 -25 -20 -15 -10 -5
LOgtf°2
Log1
Pa o 2
1 T=1300 K
ZnS +
FeS
~-A.:o -
~ -1 ~
-1 + Fe3O.
-25 -21 -15 -li -5 1 5 Logp.
10)°2
Figure 1.2-2 Stable Equilibria in the Zn-Fe-S -0 System. Areas are Regions of Stability of Two
Condensecl Phases as Marked.
13
• 5

64
6.3 Analysis of Roasting Zinc Concentrates to Retard Zinc Ferrite Formation
Figures 6.2-1 and 6.2-2 offer a simple thermodynamic picture
explaining why the existence of zinc ferrite is more prevalent at higher
roasting temperatures. It is only at these elevated temperatures that
ZnO and Fe203 can coexi.st with oxygen and sulphur dioxi.de in the atmos
phere and consequenUy it is the omy condition under which they can
combine to form zinc ferrite. Note, for example, point X in Figures
6.2-1 and 6.2-2 which represents the typical (Canadian Electrolytic Zinc
Co. Ltd.) effluent gas of 6% 02 and 10% 802 , remainder N2 of an indus-
trial roaster. It can be seen that at temperatures above 11000 K this
gas is in the ZnFe204 field while at temperatures below 11000 K basic
zinc sulphate formation is favoured.
Hopkins (59) and Kato and Takei (60) have also reported experi-
mental evidence to show that the kinetics of zinc ferrite formation become
extremely rapid at normal roasting temperatures (800-1100oC). Roggero (4)
confirmed that any iron associated with zinc concentrates reported as
zinc ferrite in the roasted product.
By considering the roasting process in terms of Figures 6.2-1
and 6.2-2, one can make a number of proposais with regard to the
effects of temperature, the oxygen partial pressure, and the sulphur
dionde partial pressure on potentiaI zinc ferrite elimination.
6.3-1 Effect of Temperature on Zinc Oxide Recovery
Figure 6.2-1 shows that as the temperature of roasting is lowered
point X will move closer to the znO· 2ZnS04 + Fe2Ü3 region and ulti
mately into the znS04( CI ) + Fe203 or the znS04( CI ) + Fe2(804)3 fields.
In all cases the formation of ZnFe204 will no longer be favoured.
65
Unfortunately the lowering of temperature will also reduce the
rate of the roasting reaction and some znS will not be completely oxidized.
Benner and Kenworthy (57) suggest that at very high temperatures
(1500-2000oK) the zinc ferrite contains less than the stoichiometric
amount of zinc and hence more free znO will be produced during roast-
ing. No industrial confirmation of this suggestion has been obtained
and a lowering of temperature still seems to be the best way to avoid
zinc ferrite formation.
6.3-2 Effect of Gas Composition on Zinc Oxide Recovery
The oxygen pressure in a fluidized bed roasting operation can be
controlled to some extent by varying the amount of excess oxygen (above
the stoichiometric quantity) fed into the bed. An increase in oxygen pres-
sure by an increase in excess oxygen will tend to move point X in Fig-
ures 6.2-1 and 6.2-2 into the ZnO· 2ZnS04 + Fe203 or the znS04(a) +
Fe203 region thus reducing the possibility of ZnFe20 4 formation.
Figure 6.2-2 shows, however, that at 11000 K even a slight in-
crease in the sulphur dioxide partial pressure will render the formation
of ZnFe20 4 thermodyJ;lamically unfavourable. Snurnikov et al(61), on
the other hand, have shown experimentally that increasing the sulphur
dioxide partial pressure is ineffective in decomposing zinc ferrite.
They found, rather, that sulphatization of free zinc oxide resulted
with no appreciable reduction in the ferrite content because free znO
sulphatizes more actively than that combined in ferrite.

6.4 Summary of Zinc Concentrate Haasting for the Recovery of Free
Zinc Oxide
66
The compound stability diagrams, constructed from the available
thermodynamic data, have been useful in a) predicting the compounds
present in roasted zinc concentrate under various roasting condi tions
and b) predicting under what conditions to operate a roasting operation
in order to recover a maximum yield of free zinc oxide.
It has been shown that the most important variable in maximizing
free zinc oxide formation (minimizing zinc ferrite formation) is tempera
ture. Control of the oxygen and sulphur dioxide partial pressures can
also contribute to the maximizing of free zinc oxide production.
CHAPTER SEVEN
THE ZINC OXIDE-HYDROGEN SYSTEM
AT ELEVATED TEMPERATURES
7.0 Reduction of Zinc Oxide by Hydrogen
The principal reaction invol ved in the hydrogen reduction of
zinc oxide is
67
(7.0-1)
for which extensive thermodynamic data are available (62). The reduc
tion of zinc oxide to metallic zinc differs from the reduction of other
base metals in two ways. In the first instance zinc oxide exhibits a
relati vely high degree of stabili ty . Secondly, the Metal is highly vola
tUe. The boiling point of zinc is relatively low (9070 C) and zinc has
an appreciable vapour pressure at lower temperatures. The first step
in studying zinc oxide reduction has been to formulate a thermodynamic
model of the system, particularly from the point of view of the equi
librium conditions that the system tends to approach.
In the thermodynamic presentation, the problem is studied by
considering a bed of finely di vided zinc oxide particles fluidized by the
reducing gas, hydrogen. The hydrogen is assumed to reach an equi
librium state with the zinc oxide and consequenUy the equilibrium gas
composition of the effluent gas mixture can be calculated. The extent
of the reaction and the zinc content of the effluent gas stream will ulti
mately depend upon kinetic factors (reaction rate, rate of gas flow,
the surface area of gas-solid contact) but under the Most favourable con
ditions equilibrium will be attained and the zinc content in the gas will

68
be a maximum. At equiUbrium, the partial pressures of Zn, H2' and
H20 will satisfy the relationship
(PZn) (PH 0) 2
Keq = ------PH
2
(7. 0-2~
The stoichiometry of the process shows that one mole of water vapour
is produced for each mole of zinc. Therefore, in the effluent gas,
(7.0-3)
Since the total pressure in the bed is very nearly atmospheric and
since the total pressure is equi valent to the sum of the partial pres-
sures of the three gas constituents:
PZn + PH2 + %20 = 1 (7.0-4)
The partial pressure of oxyg~n has not been included in the total pres-
sure relationship because, in the system, it is of the order of 10 -19
atmospheres and is so small in comparison to the other components of
the gas stream that it can be neglected in the calculations.
Simultaneous solution of these equations for a total pressure of
1 atmosphere yields
From the free energy relationship for equation 7.0-1, the value of
Keq can be calculated for any temperature. The results are shown
in Figure 7.0-1.
(7.0-5)

69
I~--------~----------------------------------------~
1
1
&
lit
SC
~ - 5 c ., ;:)
15 .5
°_4 ~
~N
c'" N - 3 c
4D ~ d!
1
•• •
Effect of Temperature on the
Hydrogen Reduction of Zinc Oxida
0 ~~*\, ~
1,,(' ~
1811 1111 1218 Temperature (OC)

70
It must be remembered that the equilibrium zinc content in
the effluent gas represents a maximum and that with unfavourable
kinetics the maximum may not be realized. Examination of Figure
7.0-1 yields instructive information on the possible use of hydrogen
as a reducing agent for zinc oxide wi th regard to the reoxidation and
condensation of gaseous zinc.
Point B on Figure 7.0-1 represents an effluent gas with less
zinc and H20 than the equilibrium amount, i. e., the reaction has not
been able to proceed to equilibrium. The cooling of a gas of this
composition in order to condense the zinc is represented by the line Be.
Where Be intersects the equilibrium curve, the gaseous mixture will
just be at equilibrium with solid znO. To the left of the curve, the
ratio (PH20)(PZn)/PH2 will be greater than the equilibrium constant
for the gaseous reduction reaction 7.0-1 and the water vapour will
oxidize the zinc vapour to precipitate znO. As the gas is cooled
further, ever increasing amounts of znO will be deposi ted as the gas
composition readjusts to follow the equilibrium curve (point D).
To attain a maximum yield of condensed zinc, the effluent gases
must he maintained as near as possible to the reaction temperature
prior to condensing the zinc and any cooling must be very rapid, i. e. ,
the vapour must be shock cooled to condense liquid zinc.
7. 1 Reactions With Other Components of the Zinc Calcine
The zinc calcine employed in this investigation is composed
almost entirely of zinc in the form of zinc onde, basic zinc sulphate,
71
and zinc ferrite.
While the acti vi ty of the zinc oxide can be taken as uni ty, the
activity of the zinc oxide associated with the sulphate and zinc ferrite
will be lower. It is unlikely, therefore, that either of the se com
pounds will be reduced until virtually all of the pure zinc oxide has
been reduced.
The reduction of the zinc calcine, then, can be regarded essen
tially as a process involving the reduction of pure zinc oxide.
7. 2 The Choice of Hydrogen as a Fluidizing and Reducing Gas
Fluidization and reduction of the zinc calcine in this study was
accomplished using hydrogen. Although economically a poor choice,
hydrogen was employed because:
(1) hydrogen exhibits a high thermal conductivity for agas
which would aid carrying heat into the bed;
(2) hydrogen has a high diffusi vity leading to high rates of
mass transfer;
(3) the chemical interaction of hydrogen with zinc oxide pro
vides only one mechanism for the reoxidation of zinc, i. e. ,
reversal of the zinc producing reaction, 7.0-1. The
HV'H20 system was, therefore, the simplest for the
fiuidized bed investigation.
72
CHAPTER EIGHT
APPARA TUS AND EXPERIMENTAL TECHNIQUE
8.0 General Approach to the Experimental Technique
In simple terms, the reduction experiments of this investigation
consisted of heating roasted Zinc concentrates to the reduction tempera
ture while fiuidizing with nitrogen, followed by reduction with hydrogen
for a predetermined period of time.
The progress of the reduction was followed by calculating the
amount of zinc removed from the bed based on the analysis of the
partially reduced calcine.
The reduction rate was studied by determining the effect of
the hydrogen fiowrate and the reduction temperature on the progress
of reduction with time.
8. 1 Apparatus
Figure 8.1-1 shows the schematic presentation of the essential
parts of the experimental apparatus. Identification of the components
appears in Table 8. 1-1. A detailed drawing of the fluidized ~ed is
shown in Figure 8.1-2. Table 8. 1-2 identifies the component parts.
Figure 8.1-3 shows two photographs of the experimental apparatus.

73
TABLE 8.1-1
Identification of the Comp<>Dents of Figure 8.1-1
(l) - Fluidized Bed
(2) - Marshall Split Furnace, model 2234
(3) - Gas Preheater
(4) - Gas Flowmeters
(5) - Gas Cylinders
(6) - Off-Gas Transport Line
(7) - Thermocouples - Pt/Pt 13% Rh type
(8) - Automatic (ON -OFF) Temperature Controllers
(9) - Variable Power Transformers
(10) - Condenser Tube
(11) - Condenser Furnace
(12) - Beat Exchanger
(l3) - Water Trap
(l4) - Oust Filter
(l5) - Transport Tube Insulation

14
Figure 1.1-1 The Experimental Apparatus
in
®

75
TABLE 8.1-2
Identification of Parts of the Fluidized Bed Reactor
(A) Reactor Shell
(B) Off -Gas Transport Line
(C) "Reactor Hood"
(D) Tube for the Insertion of Thermocouples etc.
(E) Porous Firebrick Distributor Plate
(F) Gas Calming Section
(G) Fluidizing Gas Inlet Tube
(H) Double Flange to Enable Separation of the Hood and
Transport Line From Reactor for Charging etc.

1& Figure 1.1-2 Diagram of the fluidized Bed Reador
J.-15.{M ----.-1" t
T c"
l:b:zz:zzS ~l

77
Figure 8. 1-3(a)
Photograph of the experimental apparatus. Console on
the left of the photograph contains the control circuitry
and recording equipment. The "Marshall Split" furnace
has been opened to expose the fluidized bed reactor
shell (to the immediate right of the control console).
The condenser and heat exchanger appear to the right
of the fluidized bed reactor.
Figure 8. 1-3(b)
Photograph of the experimental apparatus. In this
configuration (Marshall Split furnace closed) the
apparatuS appears as i t would during an experi
mental run.

78
Figure 8.1-3{a)
Figure 8. 1-3{b)

78
Figure 8. 1-3(a)
Figure 8.1-3(b)
· -'.- .... ,~ .. , .. >.,~.~""."' •.. " .• ...,.~I""'.:"\.~':"<""'ç'~.,,.
79
The fluidized bed reactor, excluding the distributor plate, the
hood and off -gas transport line, and the zinc condenser were con-
structed of type 304 stainless steel. AIl parts of the construction
which required joining were welded.
Streamlining the gas fiow and equalization of the gas pressure
across the fluidized bed distributor plate was aceomplished by situating
a calming vane 1 1/4 inches above the bottom of the reactor. This
calming vane consisted of a eireular stainless steel disc perforated
with 168 one-sixteenth inch diameter holes extending radially every
15 degrees. The centre portion of the dise (1/2 inch diameter) was
free of holes and thus the gas jet was deflected laterally, assuring
that above the calming vanes there was no disproportionate flow of
gas impinging on any one part of the distributor plate.
The distributor plate was made by cutting a 1/4 inch thick
disc from insulating firebrick. This type of distributor was selected
on the basis of studies conducted on a perspex model as deseribed
in Appendix 1.
The nreactor hoodn (C, Fig. 8.1-2) and off-gas transport
Une (B, Fig. 8.1-2) to the condenser were welded to form a single
unit. Thus the hood could be separated from the reactor to facilltate
charging and cleaning. A dust fUter, made of Fiberfrax bulk alumina
fiber, wu packed into the hood. The hood and transport Une were
insulated against heat losses by pa.cldng the exterior of the assembly
with approximately 1/2n of Fiberfrax bulk, subsequenUy bound with

asbestos tape, and finally coated with about 1/4" of asbestos cement.
The entire assembly was sealed in place with asbestos cement which
set into a hard, non-porous mass.
The condenser was constructed from a piece of 2.635 inch
inside diameter (2.875 inch o. d.) type 304 stainless steel tubing,
80'
18 inches long with a welded steel bottom. The upper end of the
condenser was closed with a stainless steel disc welded to the reactor
off -gas transport Une such that when the entire assembly was in place,
the transport Une extended to within two inches of the bottom of the
condenser tube. The condenser was sealed with asbestos cement.
An off-gas Une (9/16"0.d., 5/16"i.d.) made of ordinary black
iron pipe led from a point one inch from the top of the condenser tube
to a water cooled heat exchanger. During operation, the condenser
was filled with nine inches of molten lead controlled at a temperature
of 5000C. The bath was held under vacuum to afford passage of the
reactor off -gases through the lead meU and to minimize back pressure
on the fiuidized bed.
A 3.0 KVA Marshall SpUt furnace, Model 2234, 3" diameter
core, (Norton Vacuum Equipment Co., Sunnydale, Calif.) was employed
to heat the fiuidized bed. The furnace was split vertically and could
be opened to permit removal of the reactor tube. Power was fed to the
furnace through three separate circuits. 'lbebottom of the fiuldized bed
reactor was suspended three lnches above the bottom of the furnace sa
that the lower heatiog elements, extendiog below the bed, could serve as
a gas preheater. The leogth of the heating zone was twenty four inches.
The condenser was heated usiog spare elements from the
Marshall furnace. Application of full Une voltage (110 VAC) produced
500 watts of power for condenser heating purposes. The condenser

\ .. ~' :..:'
81
tube (10, Fig. 8.1-1) was heated over its lower Dine inches. The
entire condenser assembly was surrounded by a 12n diameter insulating
jacket filled with vermiculite insulation.
In aIl cases, temperatures were recorded using Pt/Pt-13% Rh
thermocouples. Three thermocouples were used to control temperatures
ln the fluidized bed reactor and one in the condenser. The fluidized
bed reactor incorp>rated two internai thermocouples, one extending
·12 3/4 inches from the top of the hood to control the off-gas tempera
ture and another extending into the bed itself to control the bed tempera
ture. The third thermocouple was situated in the· centre of the middle
bank of heating elements of the furnace.
The condenser thermocouple was inserted into the lead bath
through the top of the condenser with the tip 4n from the bottom of
the condenser tube.
AlI thermocouples were sheathed in alumina insulators and
enclosed in stainless steel tubing (type 304, 0.10n 1. d.) sealed at
the bead end by Mullite cement.
Temperature control was accomplished by means of nThermovoUn
(Model P21HAZR, Thermovolt Instruments, Toronto, Ontario) ON-OFF
type controllers whlch consist of a measuring circuit and a separate
saUd state control circuit. The controllers acti vated a mercury relay
which was used ta interrupt the main current load. Swings of tempera
ture experienced œriDg the ON-OFF cycle were minimized by the paraIlel
connection of an external reslstance wire winding, the resistance of which
was sufficient to reduce the power to the furnace coils by one-half. A
schematic drawiDg of the control circuit is shown in Figure 8.1-4.
Power to the furnace coUs was controlled by a n Powerstatn
variable transformer (O-110VAC or 0-220VAC).
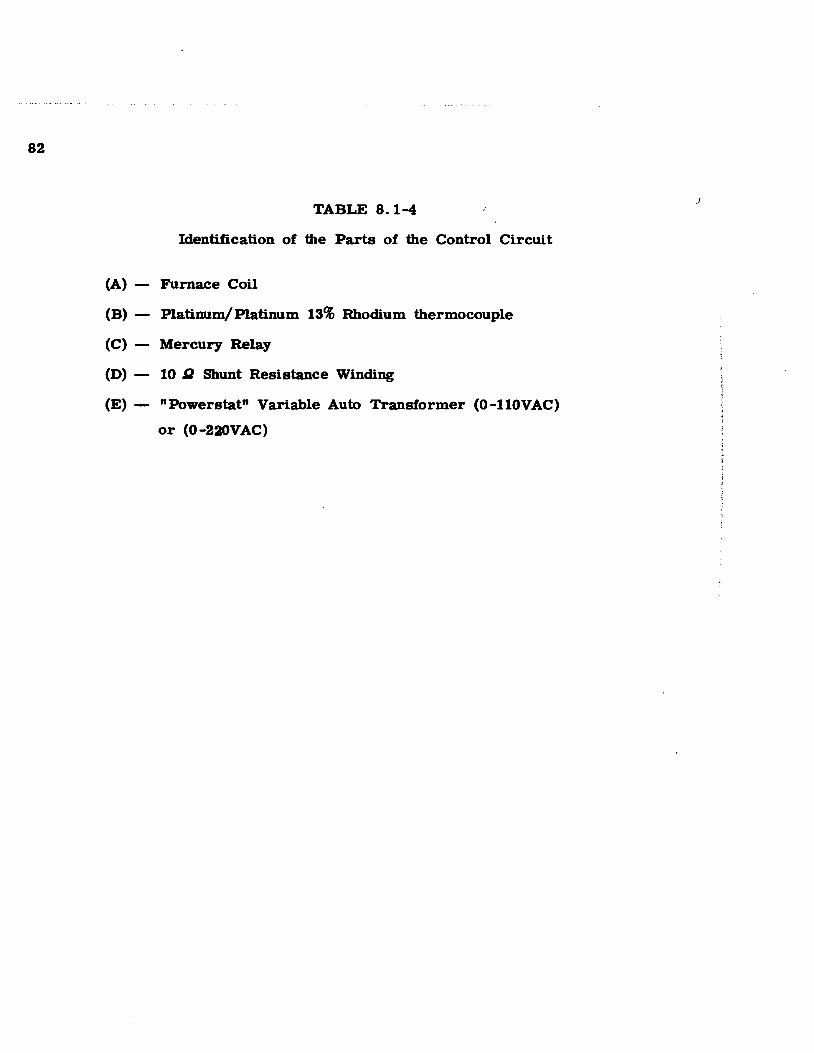
82
TABLE 8.1-4
Identification of the Parts of the Control Circuit
(A) - Furnace Coil
(B) - Platinum/Platinum 13% Rhodium thermocouple
(C) - Mercury Relay
(D) - 10 S2 Shunt Resistance Winding
(E) - "Powerstat" Variable Auto Transformer (0-110VAC)
or (0-220VAC)
-'
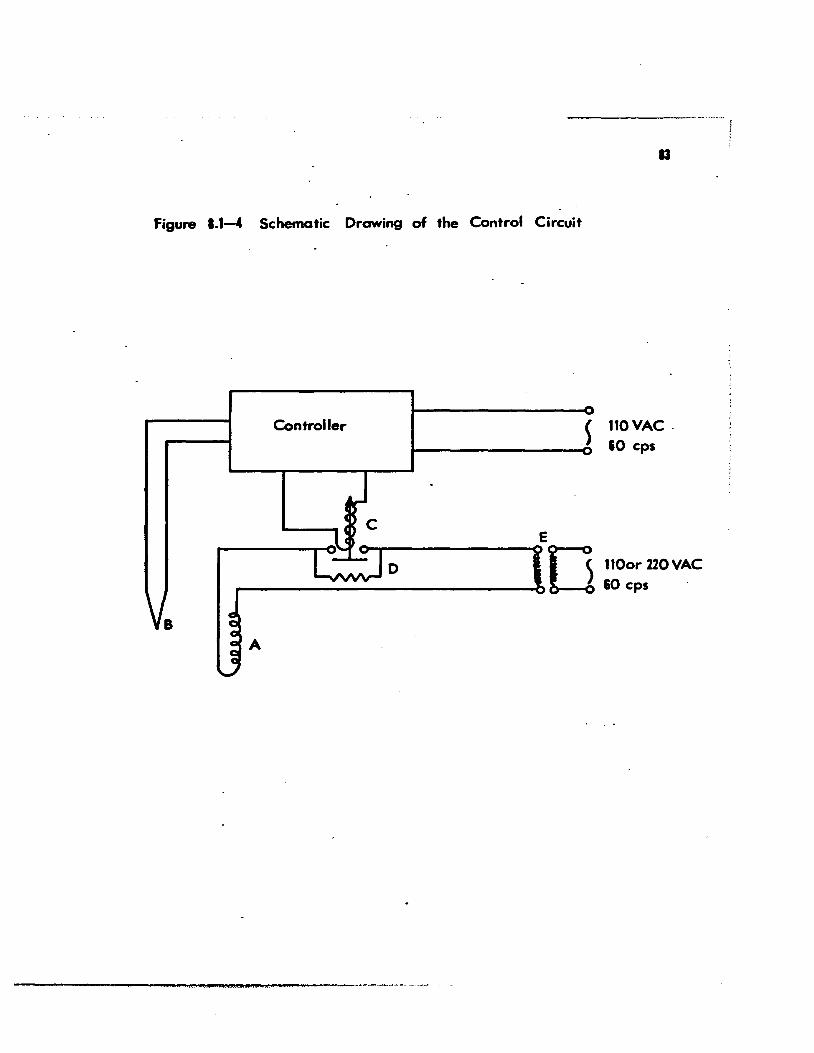
13
Figure 1.1-4 Sc hema tic Drawing of the Control Circuit
B A
Control 1er ~ 110VAC.
1----------06 60 cps
E
~D---OO 1100r 220 VAC 60 cps

84
8. 2 Raw Material - Zinc Calcine
The roasted zinc concentrate or zinc calcine used in the
course of this investigation was obtained from the fiuidized bed
roasting circuit at Canadian Electrolytic Zinc, Ltd., Valleyfield,
Quebec. The cbemical analysis, performed by Canadian Electrolytic
Zinc, Ltd. laboratory,is given in Table 8.2-1.
TABLE 8.2-1
Cbemical Analysis of Canadian Electrolytic Zinc Calcine
Compement
Total Zinc
Copper
Cadmium
Lead
Iron
Sulphide sulphur
Sulphate sulphur
Cobalt
Nickel
Water Soluble Zinc
Acid Soluble Zinc
Percen!age
59.9
0.41
0.11
0.13
11. 7
0.50
1. 51
0.023
0.0008
1.57
54.4

85
The main feature of this calcine is its low lead content. Oxides
of lead are easily reduced and gaseous reduction will yield liquid lead.
If the lead content of the calcine lS significant, liquid lead would wet
the surface of the particles and cause agglomeration, leading, possibly,
to poor fluidization or even defluidization of the bed.
8. 3 Preliminary Tests
Prior to the start of the reduction experiments, tests were
performed to determine:
(1) the particle size distribution of the calcine
(2) the density of the calcine
The particle size distribution was obtained by sieving the calcine
on Tyler Standard Sieve Series Screens using a mechanical vibrator
for agitation. The distribution plotted as weight percent of a particular
micron size against the parti cie diameter is shown in Figure 8. 3 -1.
The material of a particle size which represents the major portion of
the mixture (-150+200 mesh, q, = 89.5 JI) was extracted and used in
the experimental rons.
The den si ty was determined by the method outlined previously
(Chapter Fi ve, p. 46 ) for the calculation of minimum fluidization gas
rates.

::
l ". &
::< e
-:E 'ô e 0 -.: ::::.
..a :E lit
0
B en .J!
U
t R-
-1 .., .-e ~ ::::. a ii:
e e U 0 e u u e N
•
0 0 -
0 0 ..,
0 0 -
o o -
~-----r----------------------P----------------------r--------------------~~O - - -
- , lit e 0 ~ u
~ -lU "~ CI)
lU U ~ ~
If

8.4 Experimental Procedure
735 grams of -150+200 mesh zinc calcine were carefully
charged ta the fluidized bed reactar avoiding excessive dust losses.
The off-gas transport Une was sealed in place and all the thermo
couple leads were connected. After sufficient time had elapsed ta
allow for the hardening of the asbestas sealant, cooling water ta the 1
87
heat excbanger (12, Fig. 8.~-1) and the vacuum ta the condenser were
turned on.
The ni trogen ta the fluidized bed was set at a flowrate of
3000 cm3 min-1 and was adjusted periodically during beat up to this
value, at temperature. Power ta the recording instruments and the
furnace coils was turned on and beat up proceeded until the desired
operating temperature was reached. 3 ta 5 hours were generally
required for heat up to operating temperatures in the range of 800
ta 900oC.
Prior ta switching to bydrogen, the temperature was checked
with a Leeds-Northrup potentiometer. Periodic temperature checks
were also carried out by potentiometer during the course of the run.
At temperature, the nitrogen flow was stopped and the hydrogen
was ÏDtroduced into the reactar at a predetermined flowrate. The
start of the reduction run, 1. e., zero time, was taken to be at hydro-
gen switcb -on. The run was allowed to proceed for the predetermined
length of time, followtng whicb the gas flow was reverted to nitrogen
and electrical power to the fluidized bed was sbut off.

When the reactor had cooled, the off-gas transport line was
disengaged and the reactor was emptied of its contents. A sample
88
of the spent calcine was extracted and analysed by wet chemical tech
niques for total zinc and total iron.
Initia11y, attempts were made to extract samples periodically
from the bed duriDg the course of an extended run by means of a
vacuum tube extending to a point 1" above the expanded bed. Unfor
tunately this sampling technique had to be abandoned because water
vapour condensation in the line inevitably caused blocking.
Each experimental run, therefore, represented one point on
the curve of percent zinc eliminated from the bed vs time.
8. 5 Chemical Analysis
8. 5 -1 Determination of Zinc
The analytical technique employed to determine total zinc in
the residues was adopted from the current practice used at Cominco
Ltd., Trail, B. C. A residue sample weighing between 0.1 and 0.2
grams was accurately weighed and was placed in a 400 ml beaker.
After moistening with 10 ml of distilled water, 5 ml of concentrated
BN03 were added and the mixture was allowed to digest. 5 ml of
HOI and a few ml of HF were added and digestion was continued.
3 to 5 ml of 1:1 HiK>4 were added and the solution was taken to
dryness over a low beat.

89
After dryness was attained, the beaker and contents were cooled,
5 ml HCI and 15 ml distilled water were added and the contents were
heated to take up the soluble salts. The beaker was again cooled and
the si des washed with 15 ta 20 ml H20. 1/2 gram of NH4CI and 2 to
3 ml of a 1% solution of H202 were then added and the Iron was pre
cipitated using concentrated NH40H (10 ml excess using a Utmus
indicatar). The precipitate was boiled for a few minutes and subse
quently filtered into a 400 ml beaker, washing three times with a hot
1% NH40H, NH4Cl wash.
The precipitate was washed back inta the original beaker by
dissolviDg it with a 10% HCI wasb, and reprecipitated as before with
H202' NH40H etc. The precipÎtate was filtered through the original
filter paper and wasbed three times. The two combined filtrates,
containing all the zinc, were neutralized using HCI. 2 ta 5 grams of
lead sbot was added and the solution was boiled for twenty minutes.
The zinc content was determined by titrating with a solution of
potassium ferrocyanide (1 ml = 0.010 gm Zn) using ammonium molybdate
as an outside indicator until one drop gave a brown colour with the
indicator.
8.5-2 Determination of Iron
The Iron content of the residues was determined by the Dichromate
Method described in the ASTM Standards. The Iron precipitate from the
zinc determination was dlssolved from the filter paper using a hot 10%

Hel solution and the filtrate was collected in a 400 ml beaker. The
filter paper was washed with copious amounts of hot distilled H20
before discarding. The resultant iron solution was boiled slowly for
a few minutes and was then reduced with a solution of stannous
chloride (50 gpl) until colourless, taking precautions ta avoid an
excess of stannous chloride.
The assay was diluted ta 100 ml with a saturated solution of
mercuric chloride. ~ ml of 85% phosphoric acid were added and
the assay was titrated with potassium dichromate using 1 ml of
o. 2% sodium diphenylaminesulphonic acid as an internaI indicatar.
The endpoint wu reached when the assay turned from green ta dark
purple.
90

91
CHAPTER NINE
RESULTS
9. 0 Results and Experimental Observations
The results and experimental observations obtained from this
experimental investigation will be commented on from an experimental
and industrial viewpoint, and in particular the process will be analysed
with respect to three general areas of study, namely (1) Caking and
clinkering, (2) Reduction kinetics and (3) Efficiency of reducing gas.
9.1 Caking and Clinkering
Visual observations of the partially reduced calcine indicated that
clinkers of agglomerated calcine were formed during all tests irrespec-
tive of the operating conditions. The word "clinker" is a misnomer, in
this case, as the observed agglomerations were essentially a loose mass
which, in MOSt cases, crumbled easily on touching. In reduction runs
of up to six hours du ration , clinker formation had little detrimental
effect on zinc elimination. To investigate further the effect of clinker
formation on the ultimate performance of the fiuidized bed, an extended
run (17 hours at 8500 C and a hydrogen space velocity of 7.54 cm sec-1)
was carried out. The results of this run indicate that even at high zinc
ellmination clinkering was no worse than in shorter runs.
Over the entire range of temperatures (800-900oC) and hydrogen
space velocities (3.77 cm sec -1 to 7.54 cm sec -1) used in the present
work, cllnkers tied up between 8% and 28% of the initial charge weight.
'J 1 J r
92
Taking into account the different operating conditions used, clinkering
tied up an average of 19% of the initial charge weight.
While the overall effect of the se clinkers on the quality of the
fiuidization obtained and on the zinc elimination rates cannot be absolute-
Iy ascertained, the very porous and crumbly nature of the observed
clinkers lead to the assumption that clinkering did not adversely affect
the rate of zinc elimination from the charge. It is also felt that the
clinkering did not have any appreciably adverse effect on the quality
of fiuidization obtained.
Qualitati ve observations show that clinker formation is promoted
by temperature increases but that the maximum clinker dimensions seem
to be independent of temperature. In addition, the onset of clinker forma-
tion did not, in any way, seem to be influenced by any specific degree of
reduction. Although only two hydrogen flowrates were employed in this
investigation, an Increase in the fiowrate resulted in a decreased tendency
to form clinkers and also helped to reduce the average clinker size formed.
Figure 9.1-1 shows photographs of some of the clinkers and also
gives the experimental conditions at which they formed.
Caking, as it ls used in this study, refers to the tendency for the
spent calcine to stick or cake in hard masses to the waHs of the reaction
vessel, because of the generally higher temperatures experienced at the
walls. Caking was DOt observed in any of the experiments and no wall
scraping was necessary. This would not, therefore, appear to be a
problem in an industrial sc ale reactor.
1 1 1 i ,

93
Figure 9. 1-1 Photographs of Some of the Clinkers Obtained During
the Reduction of Zinc Calcine.
a)
b)
c)
Clinkers extracted from the fiuidized bed reactor after 2 hours redu1tion at 9000 C ~d a hydrogen fiowrate of 8 litres min- (3.77 cm sec-). Approximate % Zinc ElimInation = 9%.
Clinkers extracted from the fiuidized bed reactor after 2 hours redu1tion at 8500 C ~d a hydrogen fiowrate of 8 litres min- (3.77 cm sec-). Approximate % Zinc Elimination = 7. 5%.
Clinkers e..1dracted from the fiuidized bed reactor after 2 hours reduction at 8000 C ~d a hydrogen fiowrate of 8 litres min-1 (3.77 cm sec-). Approximate % Zinc ElimInation = 5%.

94
a)
b)
c)
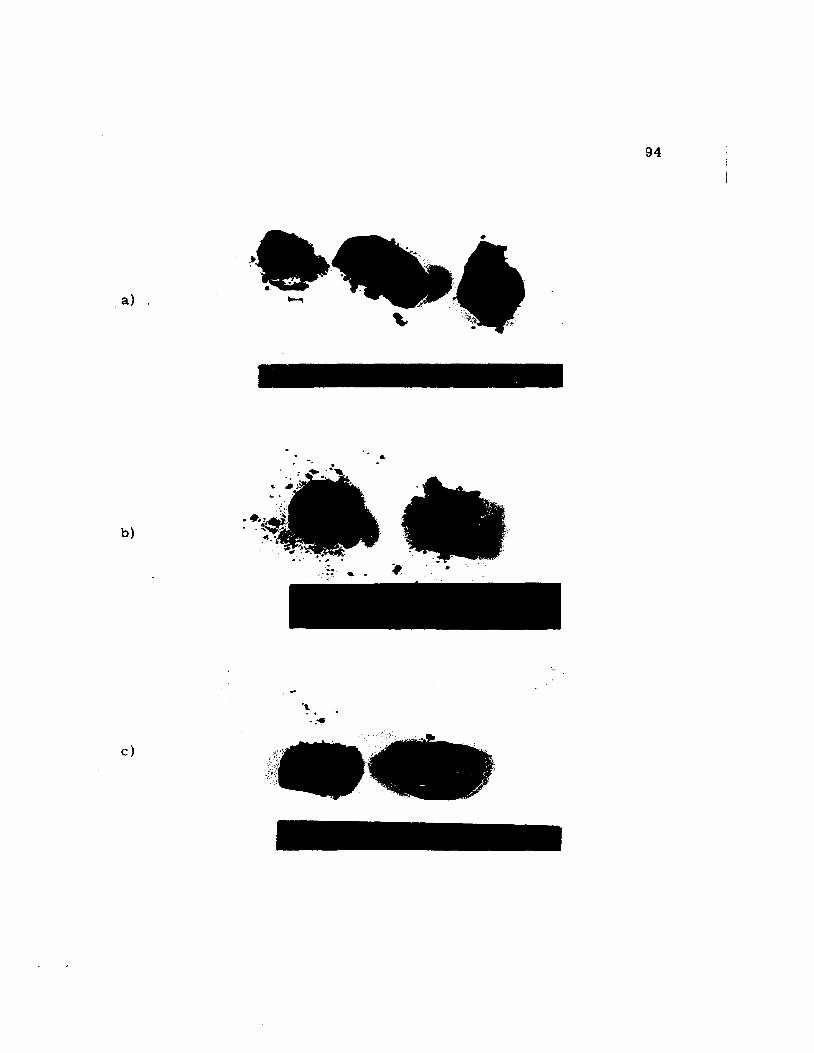
94
a)
b)
.~ . .... c)

95
d)
e)
f)
g)
CUnkers extracted from the fiuidized bed reactor after 3 hours redu~tion at 9000 C and a hydrogen fiowrate of 8 litres min- (3.77 cm sec-1). Approximate % Zinc Elimjnation = 16%.
CUnkers extracted from the fiuidized bed reactor after 6 hours redu1tion at 900°C ~d a hydrogen fiowrate of 8 litres min- (3.77 cm sec- ). Approximate % Zinc Elimination = 30.5%.
CUnkers extracted from the fiuidized bed reactor after 2 hours redu~tion at 850°C ~d a hydrogen fiowrate of 8 litres min- (3.77 cm sec- ). Approximate % Zinc Elimination = 7.5%.
CUnkers extracted from the fiuidized bed reactor after 2 hours reduc,on at 850°C anf a hydrogen fiowrate of 16 litres min- (7.54 cm sec-). Approximate % Zinc Elimination = 12%.
)
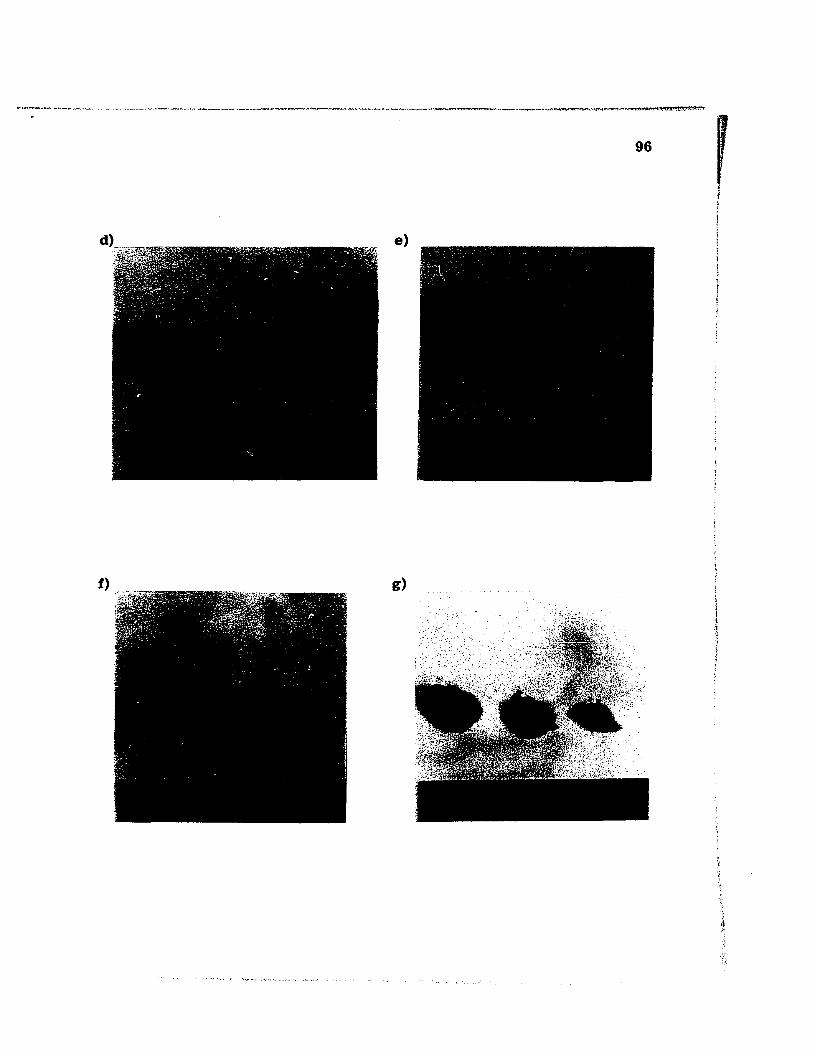
e)
f) g)
96 , 1 i j j

96
d) e)
f) g)

97
9. 2 Reaction Kinetics and Zinc Elimination
One of' the Most important objects of the study was ta determine
the effect of temperature and hydrogen flowrate on the reduction kinetics
of the fluidized bed system. The experiments were, therefore, carried
out at three temperatures, 800oC, 8500 C, and 9000 C, and two hydrogen
flowrates, 8 liters min-1 bed space velocity (3.77 cm sec-1) * and
16 liters min -1 (7.54 cm sec -1), measured at one atmosphere pressure
and the reaction temperature. Attempts ta reach higher tempe ratures
were unsuccessful because of the power limitations of the furnace and
the difficulties encountered in using a gas preheater.
9.2-1 The Effect of Temperature on Zinc Elimination and the Apparent
Reaction Rate
Table 9.2-1 lists the experimental conditions for the study of
the influence of the reaction temperature on the percentage zinc
elimination from the bed and Table 9.2-2 lists the calculated apparent
reaction rates. It will be noted that all conditions except temperature
were held constant during this series of tests.
Figure 90 2-1 shows a plot of the percentage zinc elimination
from the charge against Ume for the three temperatures studied and a
constant hydrogen flowrate of 8 liters min-1 (3.77 cm sec-1). The
results show clearly that temperature increases have a beneficial effect
on the rate of zinc elimination.
* Gas velocity in an area equivalent to the cross sectional area of the bed.

98
In this investigation, calculations of the percent zinc elimination,
i. e., the weight of zinc expelled from the bed divided by the initial
weight of zinc in the bed, were based on the' assumption that the weight
of iron in the bed remains constant. .The percentage zinc elimination,
based on the total zinc and iron analyses of the spent calcines, can be
expressed as
(100)
or
= i ..c(cx, Zn final) (wt. final) :l (100) ~ Zn initial) (wt. initialU
A constant weight of iron in the system gi ves the equation
(% Fe initial) (wt. initial) = (% Fe final) (wt. final)
(wt. final)
(wt. initial) =
(% Fe initial)
(% Fe final)
which leads to the equation used in the calculations
% Zinc Elim. = 1 _ Ji.% Zn final) (% Fe initialll (100) ll% Zn initial) (% Fe finall.J
(9.2-1)
The linearity of the plots in Figure 9.2-1 over the first six
hours greatly faciUtated the calculation of apparent reaction rates
based on a knowledge of the slope of the curves and the initial weights
of zinc in the charge. Figure 9. 2 -2 shows a plot of the apparent re
action rate (gm moles min - ~) against the reaction temperature. As
expected, the reaction rate increases significantly with increasing
temperature.

• ~'-:-' R~' .. ~ •• " • _"" .. ." -~_. _ .... _ .. ~"'-'--'" - ._.- .. .... _ .... _-- . ,.-........ .' - - -'_.- .. - ~ --_ ....... _ .... __ .. _- .. .. ........ __ ... __ ...... . -.- --_ .. _-_.\~ ..... .,.. .. "'.-
99
TABLE 9.2-1
Experimental Conditions for the Study of the Effect of Reaction Temperature on the Rate of Zinc Elimination From the Fluidized Bed
Reaction Space Reaction Particle Residue Pet.
Temperature Velocity* Time Size Analysis Zinc Oc cm sec-1 min Fraction %Zn %Fe Elimination
800 3.77 60 -150+200 66.43 13.36 2.88
800 3.77 120 -150+200 65.50 13.47 5.01
800 3.77 240 -150+200 63.07 13.68 9.95
800 3.77 360 -150+200 61.12 14.40 17.11
800 3.77 390 -150+200 60.78 14.66 19.02
850 3.77 60 -150+200 63 .. 98 13.06 4. 29
850 3.77 120 -150+200 64.18 13.54 7.42
850 3.77 180 -150+200 64.11 14.17 11.61
850 3.77 240 -150+200 63.75 14.71 15.35
850 3.77 300 -150+200 61.34 14.91 19.64
850 3.77 360 -150+200 60.06 15.20 22.79
900 3.77 60 -150+200 64.75 13.31 5.34
900 3.77 120 -150+200 63.03 13.56 9.21
900 3.77 180 -150+200 61.31 14.28 16.14
900 3.77 240 -150+200 61.31 15.15 20.96
900 3.77 300 -150+200 60.84 15.14 21.51
900 3.77 360 -150+200 59.99 16.89 30.65
• Gas velocity in the empty bed.

100
TABLE 9.2-2
Calculated Apparent Reaction Rates for the Reduction of
Zinc Calcines by Hydrogen in a Fluidized Bed
Reaction Space Calculated Slope * Calculated Temperature Velocity From Expt'l Curves Apparent Reaction
Oc cm min-1 % Zn Elim hr-1 Rate (moles min-1)
8_ 3.77 2.85 3.199 x 10⁻³
850 3.77 3.87 4.343 x 10⁻³
900 3.77 5.20 5.836 x 10⁻³
*Constant charged bed weight of 735 grams
9. 2 -2 Effect of the Hydrogen Flowrate on Zinc Elimination and the
Apparent Reaction Rate
Table 9.2-3 shows the experimental conditions employed in study-
ing the effect of hydrogen fiowrate on the rate of zinc elimination from
the charge. This aspect of the investigation was studied at constant
conditions but for fiowrate (temperature 850oC). The percentage of
zinc eliminated from the bed is plotted (Fig. 9. 2 -4 and Fig. 9. 2 -5)
against the reaction time as before.
These experimental results indicate that increases in the hydrogen
fiowrate result in increases in the rate of zinc elimination and in the
apparent overall reaction rate. This study has been limited to two
relatively low fiowrates and any future work should encompass a
wider range of fiowrates for a detailed study of the effect of this
variable.
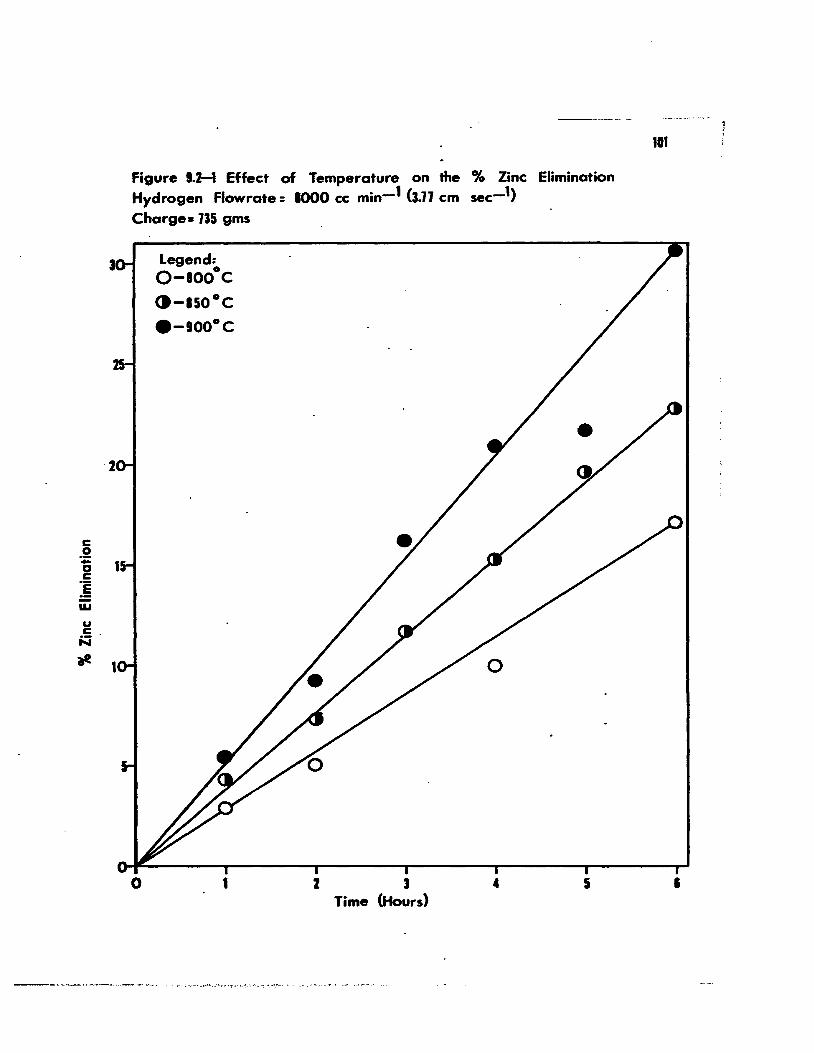
3
2
c 0 .= 1 0 c :~ w u .5 . N
.... 1
Figure I.H Effect of Temperature on the % Zinc Elimination Hydrogen Flowrate: 1000 cc min-I Cl.11 cm sec-I) Chargea 135 gms
o
Legend: O-IOOoC
(t-150oC
e-900oC
1
0
2 3 4 5 Time <Hours)
III
1
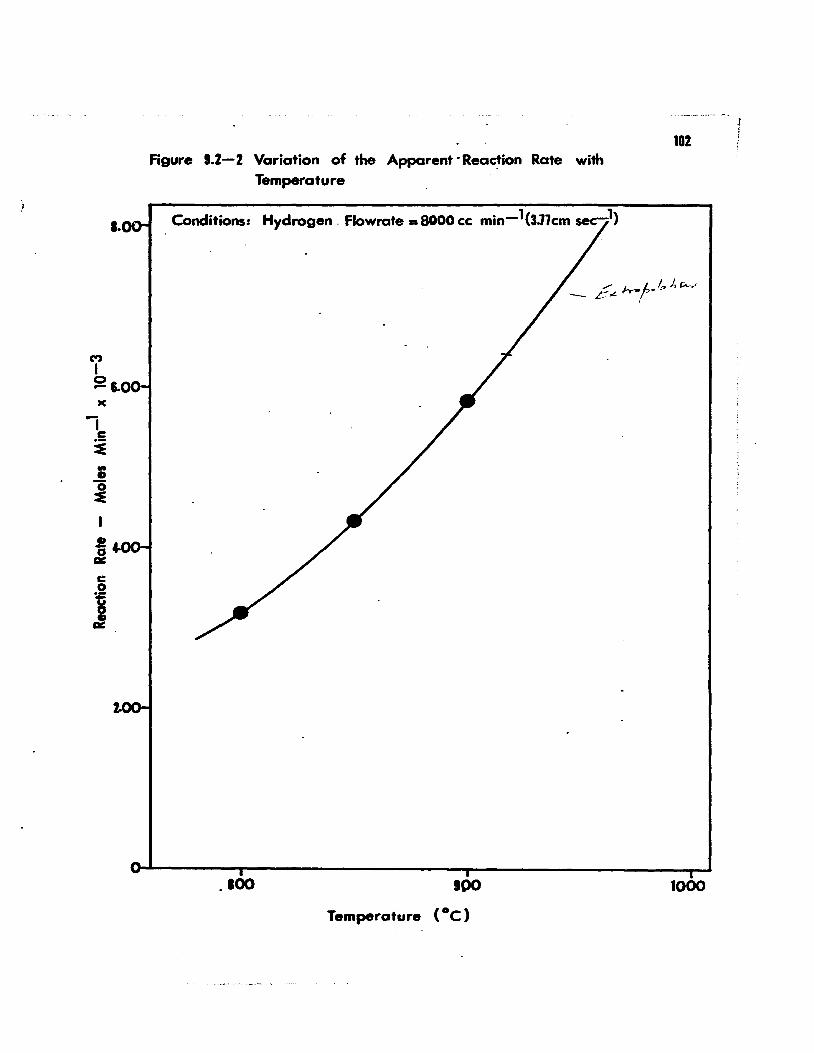
1.
C"')
1 o -&.0 K
ï c i
c o li ci
Figure 1.%-% Variation of the Apparent 'Rea~ion Rate with Temperature
Conditions: Hydrogen. Flowrate _8GOOee min-1(3.11em secl1)
10%
,,/ h-afJ·/,~' -wL . ~_.
.100 100 1000
Ti t ( OC) empera ure
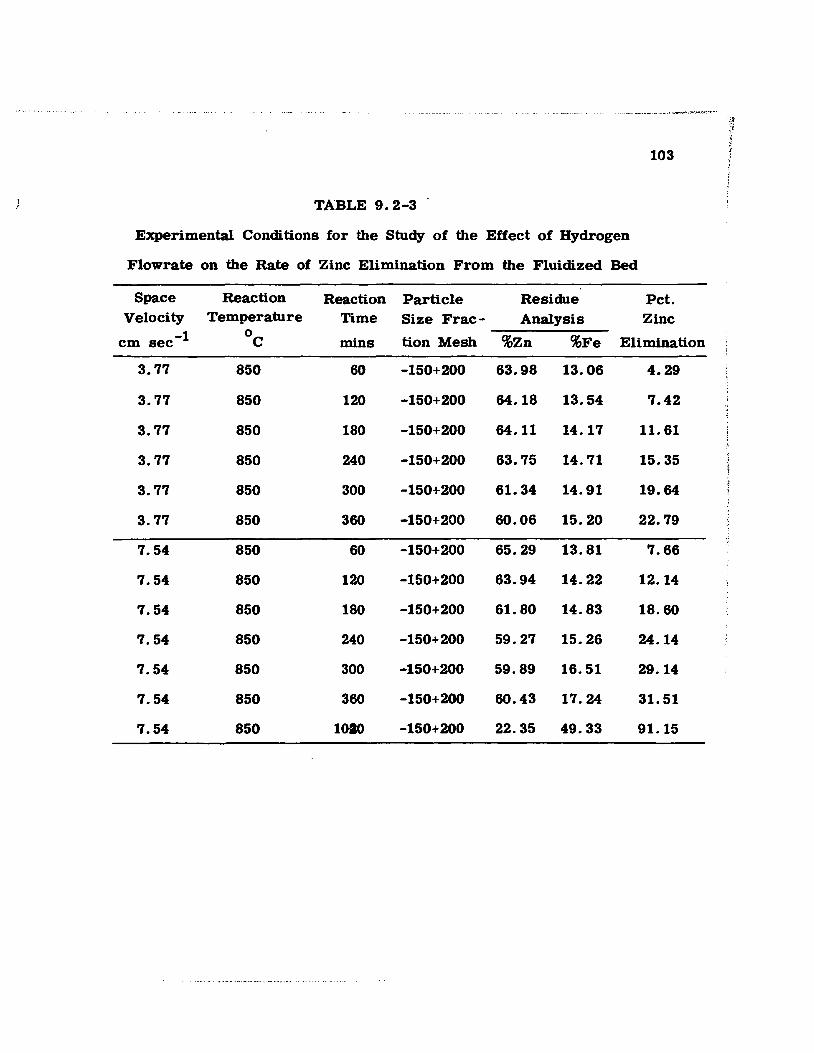
._~ _____ ... _~ ..... ~ .. _ ....... .,.~ .... n~~··· ,~
.:!
103
TABLE 9.2-3
Experimental Conditions for the Study of the Effect of Hydrogen
Flowrate on the Rate of Zinc Elimination From the Fluidized Bed
Space Reaction Reaction Particle Residue Pet. Velo city Temperature Time Size Frac- Analysis Zinc
cm sec-1 Oc mins tion Mesh %Zn %Fe Elimination
3.77 850 60 -150+200 63.98 13.06 4.29
3.77 850 120 -150+200 64.18 13.54 7.42
3.77 850 180 -150+200 64.11 14.17 11.61
3.77 850 240 -150+200 63.75 14.71 15.35
3.77 850 300 -150+200 61.34 14.91 19.64
3.77 850 360 -150+200 60.06 15.20 22.79
7.54 850 60 -150+200 65.29 13.81 7.66
7.54 850 120 -150+200 63.94 14.22 12.14
7.54 850 180 -150+200 61.80 14.83 18.60
7.54 850 240 -150+200 59.27 15.26 24.14
7.54 850 300 -150+200 59.89 16.51 29.14
7.54 850 360 -150+200 60.43 17.24 31.51
7.54 850 1010 -150+200 22.35 49.33 91.15

c 0
; 0 c :~ 1 w u c N
ae
1
104
Figure 1.2 - 4 Effect of Hydrogen Flowrate on the % Zinc Elimination
1
Reaction Temperature: 150°C Charge - 135 gms Partide Size Fraction - -150+200 mesh
16 L Min-1 = 1.54 cm sec-1
1
o
--8 L Min -1 = 3.11 cm sec-1
4 5 1

c o i c :~ w ~ N
~
Figure U-5 Plot of Pereenlage Zinc Elimination vs TIme for an Extended Run
o
Temperature - 150 Oc Hydrogen Flowrate - Il L Min- I
Particle Size Fraction - -150 + 200 Mesh
Weight of Charge - 135 Gms
5 TIme (Hours)
10
.-.-......... - .. "" ... -............. ' .. ~ .,..:. ..... '--
o
15 -=

106
9.3 Hydrogen Efiaciency
The bydrogen efficiency in this work bas been calcuIated in two
ways. The first determination can be termed a thermodynamic effici-
ency and it is a measure of the approach to equilibrium conditions in
the fiuidized bed, i. e., it is a measure of how close the system bas
come to yielding the maximum zinc atiainable under the experimental
conditions. In symbols, this thermodynamic efficiency can be expressed
as Partial Pressure of Zinc in Effiuent Gases x 100
Thermodynamic Efficiency = Equilibrium partial pressure of zinc
or Thermodynamic Efficiency = Pzn/~~ x 100 (9.3-1)
In the calculation of thermodynamic efficiencies, the equilibrium
zinc partial pressures have been taken from Figure 7.0-1, p. 69.
The second type of hydrogen efficiency (the Most important from
an economic viewpoint) is defined as
E · . H drag Effi· N __ u_m_be_r_o_f_m_o_l_e...;..s_o_f_z_i_nc~p~r_o;....du--..;c....;e....:.d_ (9. 3 -2) canomlc y en clency = Number of moles of hydrogen fed
Table 9. 3 -1 shows the experi mental candi tions and the calculated
hydrogen efficiencies obtained in this study. The results are plotted
in Figures 9.3-1 (thermodynamic efficiency) and 9.3-2 (economic effici
ency) at a constant gas space velocity of 3.77 cm sec -1.

107
TABLE 9.3-1
Experimental Conditions and Calculated Values of the Hydrogen
Efficiencies Obtained in This Study
Temp. Space Reaction Equil. Observed Thermodynamic Econ.
Oc Velocity Rate PZn PZn Eff. Eff.
cm sec-l moles min-1 Atmos. Atmos. % %
800 3.77 3. 199xl0-3 .050 .034 68.00 3.51
850 3.77 4. 343xl0-3 .065 .048 73.23 5.00
900 3.77 5. 836xl0 -3 .087 .066 75.84 7.00
850 7.54 6. 954xl0-3 .065 .039 59.23 4.55
Each point on Figures 9.3-1 and 9.3-2 is the average of a
minimum of fi ve experimental runs.
The results clearly indicate that there is a noticeable decrease
in the thermodynamic hydrogen efficiency with increasing temperature.
Table 9.3-1 also indicates that increasing the hydrogen flowrate results
in a further decrease in the thermodynamic efficiency.
The economic efficiency, on the other hand, shows a tendency
to increase with temperature due 10 the overbalancing effect of increased
PZn equilibrium with increasing temperature. Increasing the fiowrate
results in a decrease in the economic efficiency.
'"7 ~ f

- . e :::t
i ~ :::t o o.-~ ~ E :::t 0i: ~ 1 --os $
ô
Figure U -1 Effect of Temperature on the Thennodynamic Efficiency
Hydrogen Flowrate: • L Min-l
•• 151 Tempelature (oC)
101
111

Il )(
-~-tJ
'0 ~ -c N .-!
>.. u
01 u
iti u °ë
J
. figure IJ -2 Effect of Temperature on the Economie Efficiency
. Hydrogen Flowrafe = • L Min-1
•• ISI Temperature (OC)
...
119

110
In both cases the results tend to indicate that better efficiencies
would have been obtained had the experiments been carried out at
somewhat lower flowrates, i. e., the system would come closer to
equilibrium conditions. Thus the same amount of zinc couId be pro
duced by a lesser amount of hydrogen.
In a problem of this nature, however, one is tom between
three opposing forces, namely,
1) maintaining a minimum hydrogen flowrate to sustain good
fluidizing conditions at the possible expense of poor hydrogen
efficiencies;
2) stri ving to attain maximum hydrogen efficiencies for reduc
ing purposes;
3) obtaining a maximum rate of zinc production even if poor
hydrogen efficiencies are obtained.

111
CHAPTER TEN
DISCUSSION
10.0 Feasibility Considerations - Clinkering and Particle Agglomerations
When chemical reactions are carried out in fluidized beds, nor
mally good fluidizing conditions May be disrupted by the agglomeration
or clinkering of fine particles into larger masses. This tendency towards
defluidization of an otherwise weIl fluidized bed is almost exclu si vely
restricted to fluidization with a reducing gas. (50)
The MoSt frequent references to this phenomenon have been re
ported by researchers working on the fluidized bed reduction of iron
oxides and ores of iron oxides. Although this characteristic has not
been studied in great detail, it is credited to the formation of a sticky
surface on the particles by the reduction of a low melting point compound
or element which subsequently coats the parti cie surface and promotes
agglomeration by frequent collisions with adjacent particles.
No detalled study of the problem was attempted in this investiga
tion. It seems likely, however, that the clinkering experienced was
caused by the reduction of a compound whose product is liquld at the
reduction temperatures used.
The analysis of the calcine shows traces of lead (0.13%). 'Ibermo
dynamic considerations (Fig. 10.0-1) show that the reduction of lead
oxide is favourable at these temperatures and that the vapour pressure
of lead ls low. Figure 10.0-1 also shows that lead oxide is more easily
reduced than zinc oxide in a mixture of the two. Bence it can be ex-
pected that ln the system studied, lead oxide would be reduced simul
taneously with the production of zinc vapour and that the product would be
substantially liquid lead.
J
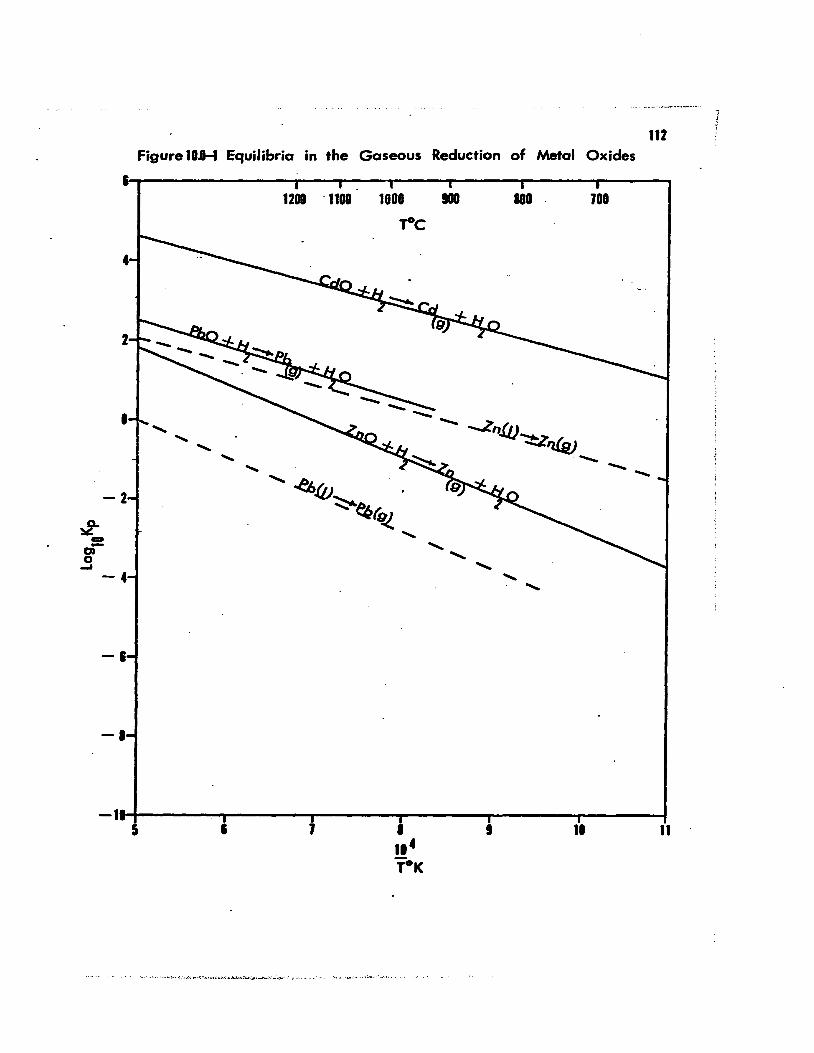
112 Figure lD.tI--f Equilibria in the Gaseous Reduction of Metal Oxides
I~---------------r---'----~----~------~------r------' 1200 . 1108 1000 900 800 . 100
,-oC
1 -.zn.lJJ~tz4v '" " '" . ---'" ---....... "/!/'to '"
-2 ~eQ ,2- ~ - " - ....... Q ....... 0 .... .......
-4 " "
-1
-1
-1~--------~--------~-------,--------~--------~------~ 5 1 1 1 li 11

./
113
The zinc blast furnace gives some indication of the behaviour of
lead and zinc oxides under reducing conditions. While zinc is readily
volatilized and passes out of the furnace with the effluent gas stream,
Most of the lead is collected in the hearth. This behaviour indicates
that the lead vaporization rate is slow even at 1200-1300oC and hence
i t can be expected to be even slower at the lower temperatures used
in the present investigation.
Because the vapour pressure of lead over liquid lead is very low
in the range 800-900oC (Fig. 10.0-1) it would not be reasonable to
expect the problem to be alleviated with time as would be expected if
the vapour pressure or the vaporization rate were greater. Although this
was borne out in tests of up to 17 hours duration, the tendency towards
a less stable clinker was definitely noticeable with increased reaction
time.
The bellef that the presence of liquid lead in the system is respon
sible for the observed tendency to clinker is substantiated by the fact
that the dimensions of the cllnkers remained relati vely constant both
with reaction time and temperature. If another component, present in
greater quantities, were to blame for the cllnkering, more serious
clinkering problems would be expected with increased production of the
component.
Unfortunately, lead was only a trace element in the calcine and
hence was indistinguishable on X-ray patterns. It would be of great
interest to perform similar reduction tests on pure zinc oxide to deter
mine if clinkering still persists.
r

~",-,"",,,, .... .,..., .... ,~ .... ,- ....... - •• "-"-"'''' .... -., • - - -----".- ----.-~ ••••• __ •• ~ ___ •• __ • ____ .~._ • ___ •• _ •••••• _4 .. ___ ... _.~ __
114
CliDker formation in the fiuidized bed reduction of other metal
oxides, particularly of iron and nickel oxides, has been avoided by
carrying out the reduction at weIl below the melting point of either the
Metal or the Metal oxide. Table 10.0-1 draws a comparison between
the temperatures at which different fiuidized bed reduction processes
were carried out and the melting points of the reaction products.
TABLE 10.0-1
Comparison of the Reduction Temperatures and Melting
Points of the Reaction Products for the Reduction
of Metal Oxides in Fluidized Beds
Investigators System Reduction Melting Point
Temperature of Reaction Products
Brant & Marshall (50) Fe-H2 750-770oC FeO - 13770 C
Fe 15300 C
Okura & Lu (52) Fe-H2 500-700oC same
Vavilov et al (63) Fe-H2 900-1000oC same
Masonov et al (51) Fe-H2 490-650oC same
Kivnick & Hixson(64) Ni-H2 180-400oC Ni - 10000 C
Lewis et al (65) Cu-CH4
6500 C Cu - 10830 C
The universal use of low reduction temperatures points to the serious-
ness of the problem.
Unfortunately the reduction of zinc oxide at below the melting
point of zinc is made impractical for the following reasons:
1) The melting point of zinc is relatively low, 419°C.
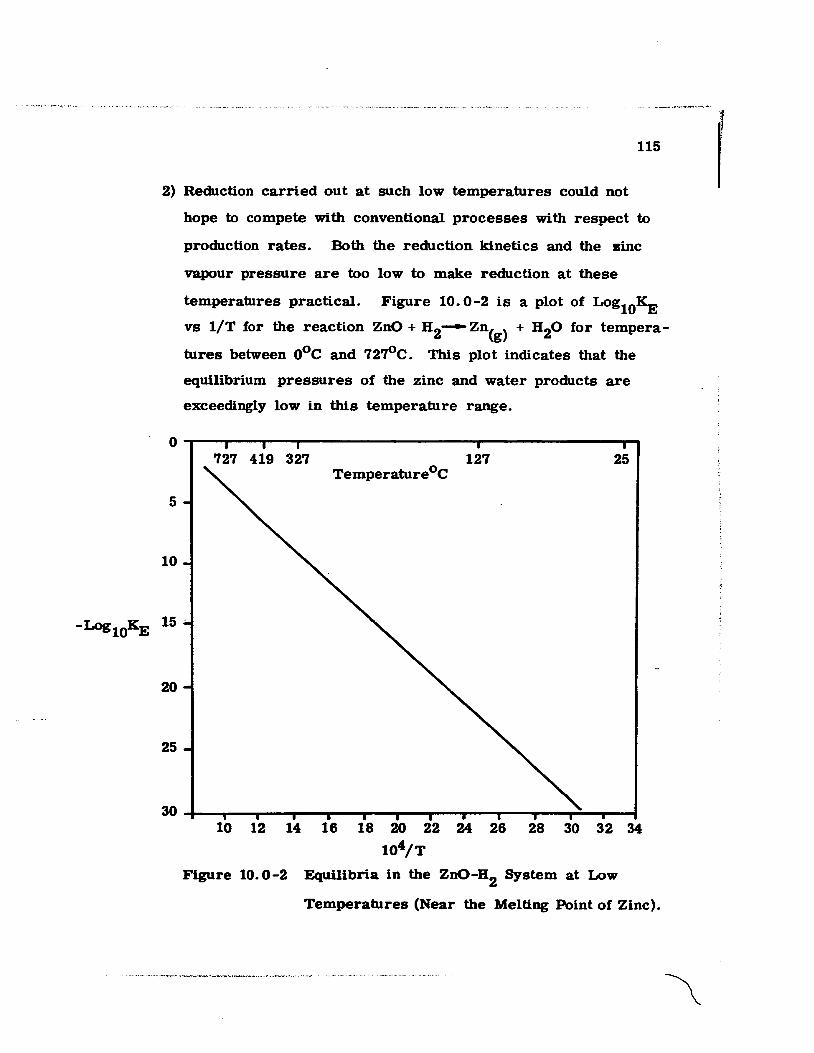
115
2) Reduction carried out at such low temperatures could not
hope to compete with conventional processes with respect to
production rates. Both the reduction kinetics and the sine
vapour pressure are too low to make reduction at these
temperatures practical. Figure 10.0-2 is a plot of LogI0~
vs liT for the reaction ZnO + H2~Zn(g) + H20 for tempera
tures between oOe and 727oe. This plot indicates that the
equilibrium pressures of the zinc and water products are
exceedingly low in this temperature range.
o ~--~--~--~------------------~--------------~
5
10
20
25
727 419 327 127 25 TemperatureOe
10 12 14 16 18 20 22 24 26 28 30 32 34
104fT
Figure 10.0-2 Equilibria in the ZnO-H2 System at Low
Temperatures (Near the Melting Point of Zinc).
Another interesting result which sheds light on the clinkering
problem was obtained from additional experimentation to explain the
rate studies. In these tests the calcines were screened on Tyler
Standard Sieve Screens at various stages of reduction.
116
The results (Table 10.4-1, p.130, Figure 10.4-2, p.131 ) show
that there is an early build-up of the large st size particles (-100+150
mesh) at the expense of the smallest particles as a result of agglomera
tion. After this initial build-up the parti cIe sizes maintain constant
fractions wi th time even though reduction is taking place and the par
ticles might be expected to become smaller.
A more detailed explanation of the significance of this work is
gi ven in Section 10. 4.
The relative constancy in the fraction of -100+ 150 mesh mate rial
with time (Fig. 10.4-1) indicates that clinkering or agglomeration must
have been caused by the reduction of a component of the calcine which
does not accumulate with time. If this were not the case, it would be
expected that the tendency to clinker would increase with time. Since
lead is present only in small quantities, it wouÏd s"eem that the initially
reduced lead is sufficient to cause agglomeration but that subsequent
lead formation does not increase the tendency to agglomerate. Lead
reduced later in the reduction run May in fact coat the more porous
structure of the particles.
It will be noted tbat the amount of clinkered material (-100+150
mesh) decreases slightly during the course of the run. Although lead

117
has a low vapour pressure at the reaction temperatures, there will be
some lead evaporation and this may reduce the amount of clinkering
as observed.
10. 1 Feasibility Considerations - Hydrogen Efficiency
The hydrogen efficiency has been calculated in two ways; one,
the thermodynamic efficiency, was defined as the ratio of the observed
partial pressure of zinc in the effluent gas stream ta the equilibrium
zinc partial pressure at the operating temperature. Thus the thermo-
dynamic efficiency represents how close the system approached ta equi-
librium which, in turn, represents the best possible situation attainable.
The second efficiency calculation which was called an economic efficiency
was defined as the ratio of the number of moles of zinc produced ta the
number of moles of hydrogen fed in during the same time interval.
Figure 9.3-1 shows that thereis~' definite increase in thermo
dynamic efficiency with increasing temperature but that the rate of
efficiency increase falls off at the higher temperatures (alI other vari-
ables constant).
Figure 7.0-1 yields a possible explanation. For the reaction
between pure zinc OJade and hydrogen at the se temperatures, the equi
librium zinc partial pressure rises exponentialIy with increasing tempera-
ture. Although the overall reaction rate for the process shows an
hlcrease with rising temperatures, it is likely that the increase in
reaction rate is insufficient ta keep pace with the rate of rise of the
equillbrium zinc vapour pressure at these elevated temperatures. This
1 r
J f

118
aspect is discussed in detail in Section 10.4, RReduction Mechanisms. R
The results also show that by increasing the hydrogen flowrate
a significant increase in the zinc elimination rate can be obtained at
the expense of a decrease in the thermodynamic and economic effici
encies. Again, for kinetic reasons, the result is to move the system
farther from equilibrium.
Figure 9.3-2 shows that the Reconomic efficiencyR rises with
temperature aided by both an increase in the reaction rafe and an
increase in P~: with increasing temperature. Consequently, if the
molar influx of hydrogen into the bed is held constant, the effecti veness
of the hydrogen wiL. increase with increasing temperature.
It must be noted that even under equilibrium conditions the
economic efficiency of hydrogen utilization is low (Fig. 10.1-1) even
at the attainment of equilibrium conditions. Even at 10000 C the poten
tial maximum economic efficiency is 20% (1 mole of zinc produced
per 5 moles of hydrogen introduced).
It is clear, therefore, that any commercial operation will have
to remove the product B20 from the gases by condensation and that
the B2 Will have to be recycled.
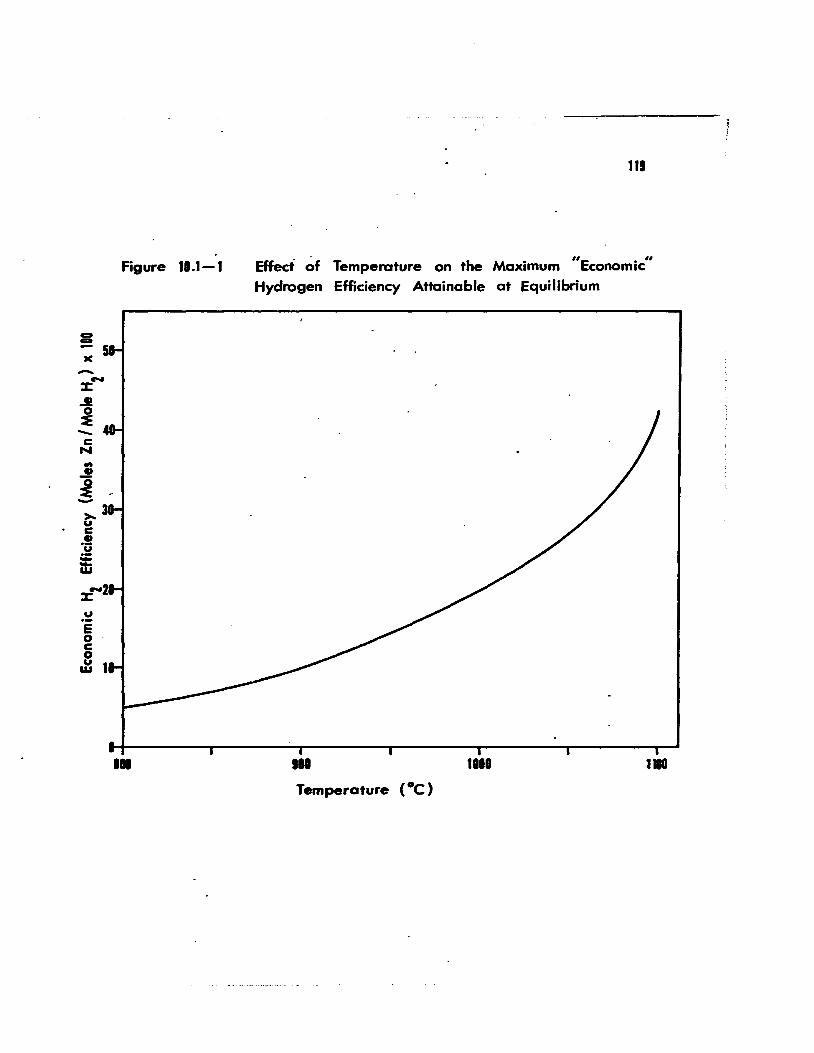
-7:,-
.J!
~ -c N
;: ~ -~3 u c G ·ü
ffi
.~ E o c o ~ 1
Figure 18.1-1
••
111
Effect of Temperature on the Maximum "Economie" Hydrogen Efficieney Attainable at Equilibrium
lU 118.
Temperature (OC)

120
10. 2 Reaction Kinetics
10.2-1 Variation of the Reaction Rate with Temperature
The variation of the overall reaction rate, calculated from the
percentage zinc elimination curves, with reaction temperature was
shown in Figure 9.2-2. For co mpari son , Figure 10.2-1 includes
the same plot obtained by Truesdale and Waring (44) for the reduction
of briquets of zinc oxide with hydrogen.
The Truesdale and Waring single parti cie studies are more
typical of the type of results expected for the reduction of zinc oxide
in a fixed bed since the hydrogen velocity used (1. 50-1. 95 cm sec-1)
would be insufficient to fluidize a bed of particles of this size (0.25-
1. 00 inches diameter). This comparison thus confirms that substantial
increases in the reaction rate can be realized by conducting the reduc
tion with smaller particles. A further discussion of the effect of
temperature on the reaction rate appears in Section 10.4 "Postulation
of Reaction Mechanisms. n

121
Figure Il.2 -1 Variation of the Apparent Reaction Rate with Temperature
1.1 0 - This Investigation
-1 --~ 1.1
-ï c ~ ;:
-0 ~ 1
~ - 4. ~ & c o
; ~ u
a=
2.'
800
--l'ruesdale & Waring
900
Temperature (OC)
1000

122
10.2-2 Variation of the Reaction Rate with Gas Flowrate
The effect of hydrogen fiowrate on the reduction of zinc calcines
has been illustrated in Figure 9.2-4 in which it was shown that the
rate of zinc elimination increases markedly with increased flowrate.
No quantitative correlation between the overall reaction rate and the
gas fiowrate has been attempted because of an insufficient number of
data points.
The dynamic behaviour of fiuidized beds have been commented
on previously (Chapter Five) and it was noted that at gu velocities
above minimum fiuidization excess gas passed through the bed in the
form of bubbles. In such cases a fiuidized bed consists of two regions:
one, the regioD of smooth fiuidization in which the gas flowing through
the solid was in viscous fiow and the solid particles were close to each
other, the second consisting of gas bubbles moving erratically up
through the otherwise smooth bed. This general type of behaviour
was witnessed in a low t emperature model in this work.
Toomey and Johnstone (66) attributed the violent mixing presest
in fiuidized beds to the action of bubbles and noted that the region ad
jacent to the rising blbbles was in a state of high turbulence. They
also indicated that by far the greater portion of the solid in the bed
is present in the region of smooth fiuidization.
If this is an accurate representation, it is likely that the bulk
of the mass transfer and hence the bulk of the reaction takes place
in the highly turbulent region adjacent to the blbbles passing up through

__ •.• _ .'_ ~ , .... _.~ .... ' •••••• ,,~ .. Il' " ...... .,' ,~.
';! p
123)
the smoothly fluidized part of the bed. Therefore the effect of increased
hydrogen flowrate might stem from three causes. Firstly, a greater
flowrate of hydrogen more rapidly supplies hydrogen to the neighbour
hood of the znO surface and more rapidly draws off the -H20 and Zn(g)
products. Secondly, the increase in flowrate is accompanied by an
increase in turbulence and therefore an increase in the area for mass
transfer, i. e., there are more bubbles and hence a greater amount of
turbulen~ region. Thirdly, the increase in turbulence would he expected
to increase the mass transfer coefficient in the turbulent region adjacent
to the rising bubbles since the mass transfer coefficient increases with
increasing parti cie Reynolds Number (10).
10.3 Variation of the Reaction Rate with Time
Calculations based on Figures 9.2-1 and 9.2-4 show that for
runs of six hours duration, the reaction rate is constant wi th time for
any set of constant operating conditions (see Fig. 10.4-1). Figure 9.2-5
indicates that this linearity continues until approximately 85% of the
zinc has been expelled from the bed. Calculations based on the chemical
analysis of the "as received" zinc calcine and the considerations of Chap-
ter Six show that initially' the hed contains about 63%ZnO, 25%ZnFe204'
and 3%ZnO' 2ZnS04. X-ray diffraction patterns of the calcine and
partially reduced calcine (Figs. 10.3-1, 2, 3) substantiate the view that
initially there are no !ines present to denote the existence of free iron
oxides.
1 r
124
The apparent decrease in the zinc elimination rate at about 85%
zinc elimination (Fig. 9.2-5) May be due, in part, ta the virtual dis-
appearance of free znO at this elimination level.
It should be noted that in this particular calcine (composition:
11. 7% Fe, 59.9% Zn) the iron will tie up 12% of the available zinc as
zinc ferrite. After 88% zinc elimination, therefore, there should be
no zinc oxide present in the reduced calcine.
It would be expected that the zinc elimination rate would fall
off under these conditions due ta the much lower activity of znO in
the ferrite and the consequently much lower equilibrium concentration
of zinc in the effluent gases.

125
Figure 10.3-1
Debye-Scherrer X-ray pattern of nAs Receivedn zinc calcine. Diffracted lines denote the presence of the following compounds: ZnO, ZnFe204, and ZnO· 2ZnS04. Lines for other ,compounds are not present. Radiation used: FeKa ( À = 1.9375 AO).
Figure 10.3-2
Debye-Scherrer X-ray pattern of partially reduced calcine after reduction for 6 hrs ~ 9000 C and a hydrogen fiowrate of 8 litres min- (3.77 cm sec-1). Lines for znO, ZnFe204' and ZnO· 2ZnS04 are still present and there are no new lines denoting the formation of additional compounds through reduction. Radiation used: FeKa ( À = 1. 9375 A 0).
Figure 10.3-3
Debye-Scherrer X-ray pattern of partially reduced calcine after reduction for 17 hours
1 at 8500 C and a
hydrogen fiowrate of 16 litres min- (7.54 cm sec-1). The diffrac.tion Unes indicate the presence, still, of ZnO, ZnFe204' and ZnO· 2ZnS04 and there are no lines for compounds of iron indicating that zinc ferrite has not been appreciably reduced even though the zinc elimlnaHon 18 91%. Lines for iron and mo.des of iron are probably too weak to be detected at this point. Radiation used: FeKa ( ~ = 1. 9375 AO).

- ._ .... -- ----_.-...... _" --'-"-.-'_"'_--,,-... ,.-. _ ...... _._--------
126
Figure 10.3-1
Figure 10.3-2
Figure 10.3-3

126
Figure 10.3-1
Figure 10.3-2
Figure 10.3-3
127
10.4 Postulation of Reaction Mechanisms
10.4-1 Reaction Rate as a Fonction of Reaction Time
The reaction rate, calculated from Figure 9.2-1 has been plotted
as a fwiction of the reaction time and is shown in Figure 10.4-1.
The constancy of the reaction rate wi th time, at least until the
latter stages of reduction, suggests that the reduction of zinc oxide
is not controlled by diffusion through a growing solid layer as in the
case for iron and nickel reduction. (66-70, 64)
10.4-2 Interpretation of the Reaction Rate
The invariance of the reaction rate with time has lead to the
Interpretation of the process as one controned by a mass transfer
step. The reduction rate has been represented by
where N ls the number of moles of Zn vaporized min-1
K ls the reaction rate constant, cm min-1
A ls the total exposed interfacial area
B CZn ls the calculated off gas zinc content in the bulk
of the gas, moles cm-3
C~~ ls the equilibrium zinc content of the gas for any
given temperature, moles cm -3 = P~~/RT
(10.4-1)

121
Figure 18:4-1 Variatjon of Reduction Rate With lime
I~------r-.-----T-.----~.------~.~-----r-.-----T-.----~ 1 1 234 5 1
rime (Hours)

129
The factor C~n / 2 is employed in the bracketed term of equation
10. 4 -1 because, while ini tially the hydrogen entering the bed contains
no zinc, the gas leaving the bed contains C~n moles cm -3 of zinc. The
average zinc content of the gases in the bed is, therefore, C~n/2 moles
cm -3 . This assumption leads to an average rate of zinc elimination
from the bed. An incoming "packet" cf hydrogen will, of course, react
very quickly with the first znO particles it meets as C~n will initially
be zero. Gas leaving the bed will have more nearly the equilibrium
concentration ofZn(g) and H20, hence the final rate will be low.
Equation 10.4-1 can only give a constant reaction rate with time
if the mass transfer coefficient is constant, if P~: is constant, and if
the total area available for mass transfer remains constant. ~: can
be considered to remain constant while pure zinc onde continues to be
present in the particle.
P~: being constant, it can be seen that a constant :Fi with time
requires a constant value of F.::.A with time, i. e. : . N
KA =----~--(C~~ - C~n/2)
(10.4-2)
Any proposal for a reaction mechanism must, therefore, take this factor
into account.
10. 4 -3A Particle Size and Interfacial Area
Table 10.4-1 shows the screen analysis of the partially reduced
calcine from the experimental reduction runs. Figure 10.4-2 shows a
plot of the weight fraction of calcine appearing in the size ranges as a
function of reduction time. Each point represents the average for all
experiments.
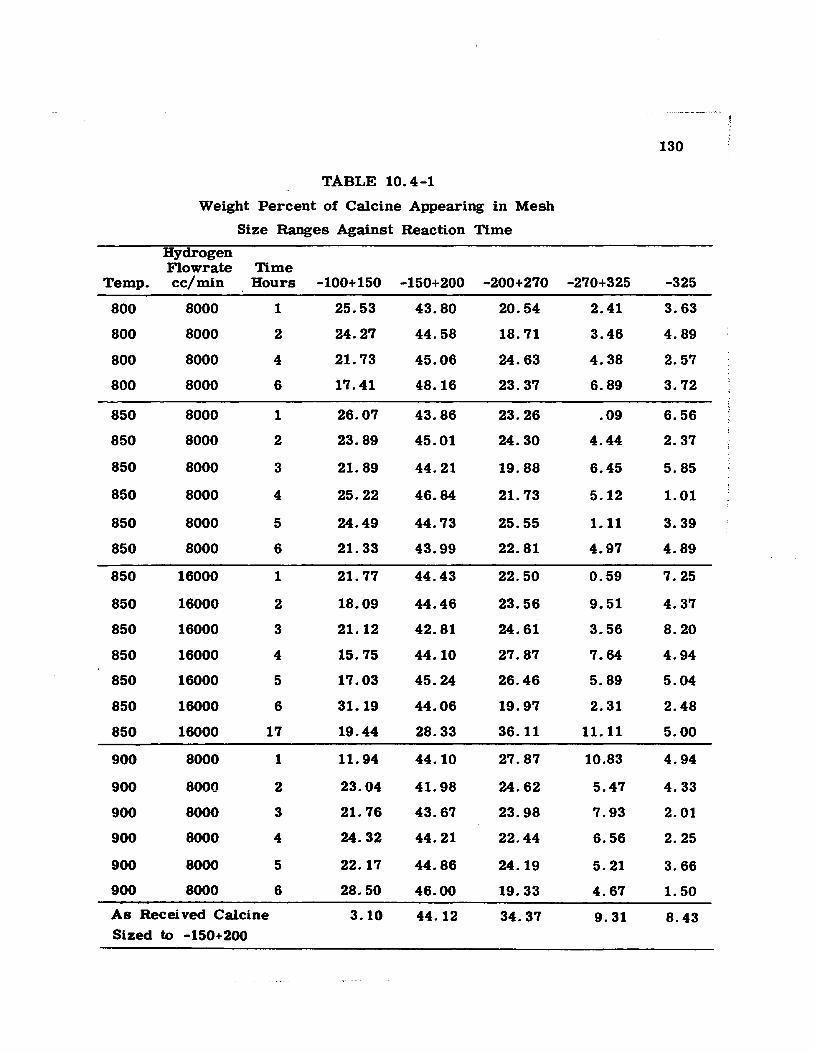
---~- -.. - '--'-
130
TABLE 10.4-1
Weight Percent of Calcine Appearing in Mesh
Size Ranges Against Reaction Time
Hydrogen Flowrate Time
Temp. cc/min Hours -100+150 -150+200 -200+270 -270+325 -325
800 8000 1 25.53 43.80 20.54 2.41 3.63
800 8000 2 24.27 44.58 18.71 3.46 4.89
800 8000 4 21. 73 45.06 24.63 4.38 2.57
800 8000 6 17.41 48.16 23.37 6.89 3.72
850 8000 1 26.07 43.86 23.26 .09 6.56
850 8000 2 23.89 45.01 24.30 4.44 2.37
850 8000 3 21. 89 44.21 19.88 6.45 5.85
850 8000 4 25.22 46.84 21. 73 5.12 1.01
850 8000 5 24.49 44.73 25.55 1.11 3.39
850 8000 6 21. 33 43.99 22.81 4.97 4.89
850 16000 1 21. 77 44.43 22.50 0.59 7.25
850 16000 2 18.09 44.46 23.56 9.51 4.37
850 16000 3 21.12 42.81 24.61 3.56 8.20
850 16000 4 15.75 44.10 27.87 7.64 4.94
850 16000 5 17.03 45.24 26.46 5.89 5.04
850 16000 6 31.19 44.06 19.97 2.31 2.48
850 16000 17 19.44 28.33 36.11 11.11 5.00
900 8000 1 Il.94 44.10 27.87 10.83 4.94
900 8000 2 23.04 41.98 24.62 5.47 4.33
900 8000 3 21.76 43.67 23.98 7.93 2.01
900 8000 4 24.32 44.21 22.44 6.56 2.25
900 8000 5 22.17 44.86 24.19 5.21 3.66
900 8000 6 28.50 46.00 19.33 4.67 1. 50
As Recei ved Calcine 3.10 44.12 34.37 9.31 8.43 Sized to -150+200

D E i= c 02 -u ~
"'D D
GI:
~ -~ c 0 '; 0 o~
~ D N
CI)
D 'ü '; ... R. -• -.--D ... ~ CD ü:
CI 0
•
III C o ... u °ë --Il 10
-III ... ~ o :a: -
131

132
Figure 10.4-2 shows that the amount of calcine appearing within
each size range remains essentially constant with time until all or nearly
all of the free zinc oxide has been depleted. Bence it appears that the
ini tial dimensions of the particles are preserved as a parti cie skeleton
as the reduction time progresses.
This situation can be explained in terms of the composition of the
initial feed mateIial. Since, as stated in Chapter 6, all of the iron
reports in the roasted product as zinc ferrite, approximately 25% of
the original calcine, is zinc ferrite. This zinc ferrite is not reduced by
hydrogen until the latter stages of reduction and so it seems likely that
the zinc ferrite forms a shell or matrix which binds the free zinc oxide
within the particle. Thus, as the reduction proceeds and zinc is vola
tilized, a skeleton of the original particle remains which retains the
original dimensions of the particles.
10.4-3B The Product KA as a Function of Temperature and Flowrate
Table 10.4-2 shows the calculated values of the product KA for
the three temperatures studied in the investigation. Figure 10.4-3 shows
an Arrhenius plot of Log10(KA) against lIT. The activation energy cal
culated from the plot is 12t 2 K calI mole which is representati ve of gas
diffusion processes rather than chemically controlled reactions.
TABLE 10.4-2
Calculated KA Products for the Reduction Temperatures Studied
Space Velocity
Temperature
Oc 800
850
900
of Gas Through Bed
cm sec-1
3.77 3.77
3.77
KA
208
234
254

133
Figure 1'.4-3 Arrhenius Plot of Log" KA vs l/r
2.
2.~~--------------~--------------~--------------~ • .1 1.5 I.D 1.5

j l
134 !
The mass transfer coefficient, K, is a function of the diffusion co-
efficient, D. Support for a gas phase diffusion controlled process would
require a temperature dependency of the mass transfer coefficient com-
parable to the temperature dependency of the diffusion coefficient.
The temperature dependence of the gas diffusion coefficient can be
approximated by
(10.4-3)
where T is the absolute tempe rature , oK
n varies beVween 1.5 and 2.0
Taking n = 2.0, the ratios of the diffusion coefficients have been calculated
for the three temperatures studied and are compared with the corresponding
ratios of the product KA in Table 10.4-3.
TABLE 10.4-3
Comparison of DT /DT and (KA)T / (KA)T (Temperatures in oC) 1 2 1 2
~o~oo (KA\lool(KAlaoo ~5o/IlJOO (KA\J501(KAlaoo D90ol~00 (KA~ool(KA)800 1.00 1.00 1.10 1.12 1. 20 1. 22
The excellent agreement beVween the activation energy considerations and the
results shown in Table 10.4-3 supports the view of a process controlled by
a gas phase transport mechanism.
10.4-4 Variation of KA with Gas Flowrate
Kettenring et al(10) have shown that for mass transfer controlled
processes ln fluidized beds. the mass transfer coefficient, K, increases
by approximately 20% for a doubling of the parti cie Reynolds number in

~:
135 ;
the range corresponding to this work. Table 10.4-4 shows the variation
of KA with space velocity obtained in the present work.
Temperature oC
850
850
TABLE 10.4-4
Velocity Dependence of KA
Space Velo city , cm sec-1
3.77
3.77
234
278
The observed increase in the value of KA for a doubling of the space
velocity is 19% which shows good agreement with the Kettenring et al
suggestion.
10.4-5 Reaction Mechanism
While Sections 10.4-1, 2, 3, and 4 present evidence to indicate
that the rate controlling step for the fluidized bed reduction of zinc
calcine by hydrogen is gas phase diffusion, the postulation of a mechan
ism requires an explanation for the observation of a constant product
KA with time. As a first step a mechanism which explains a constant
area for mass transfer must be suggested.
Figures 10.4-4, 5, and 6 show photomicrographs of the calcine
particles at various stages of reduction.
Figure 10.4-4 shows the calcine as received. The photograph
shows ~at the outer surface of the particles are mainly zinc oxide and
that there are pockets of zinc oxide within the structure. The particles
appear to be supported on a skeleton of zinc ferrite (ZnFe204).
Figure 10.4-5 shows that as reduction proceeds the outer layer
of zinc oxide bas been reduced and a honeycomb structure of zinc made
within the ferrite skeleton remains.

136
The final photomicrograph (Fig. 10.4-6) shows that at 91% elim-
ination of zinc there are still discrete pockets of zinc oxide within the
honeycomb structure. The existence of these pockets of free zinc oxide
at this level of elimination (theoretical depletion of free zinc oxide
occurs at 88% elimination) indicates that hydrogen attack of the outer
zinc ferrite skeleton must have occurred. The X-ray diffraction patterns
(Figs. 10.3-1, 2, and 3), however, do not conclusively substantiate this
c1aim.
Figure 10.4-5 corresponds to particles that have undergone 6 hrs.
reduction at 9000 C and a hydrogen space velocity of 3.77 cm sec-1. At
this point approximately 30% of the zinc has been reduced.
Calculations based on perfect spheres" indicate that a 30% reduction
in volume has associated with it a 23% reduction in surface area.
The photomicrographs indicate, however, that the reduced calcine
is porous in nature and it is likely that new surfaces of zinc oxide are
being exposed as reduction proceeds. It is likely, therefore, that the
area of exposed zinc oxide does not decrease significantly at least during
the first 30% of reduction. It is notable, however, that even at 85%
reduction (Fig. 9.2-5), the zinc elimination rate has not fallen off
significantly.
The photographic evidence also indicates that the pores are large
enough to allow free access of hydrogen to the reaction sites and to
allow diffusion of the reaction products away from the reaction sites to
the bulk gases.
It would seem, therefore, that the constant zinc elimination rate
can be tentati vely explained by the creation of new zinc oxide surface
area and the opening of pores in the parti cIe structure.
,

137
Figure 10.4-4
Photomicrograph of "As Received" zinc calcine. Light coloured areas are concentrations of zinc oxide. Dark grey area is zinc ferrite. As the photograph indicates, zinc oxide concentrates as a layer around the particle with local concentrations within the particles themselves. The entire particle appears to be bound together by a network of predominantly zinc ferrite. (Magn. 600 X.)
Figure 10.4-5
Photomicrograph of a zinc calcine particle after six hours reduction at 9qOoC and a hydrogen fiowrate of 8 litres min-1 (3.77 cm sec-). The approximate degree of reduction is 30%. This photograph indicates that the outer layer of zinc oxide bas been reduced, leaving localized "pockets" of zinc oxide within the particle. (Magn. 500 X.)
Figure 10.4-6
Photomicrograph of zinc calcine particles after seventeen hours reduction at 8500 C and a hydrogen fiowrate of 16 litres min -1. The approximate degree of reduction is 91%. This photograph indicates that most of the zinc oxide has been reduced leaving a skeleton of the original. particle composed entirely of zinc ferrite. (Magn. 200 X. )
)

138
Figure 10.4-4
1
Figure 10.4-5 1
Figure 10.4-6 ____ .'

138
Figure 10.4-4
Figure 10.4-5
FkUl"(' 1O.4-f)
............ _ "--"'~'''-''''''·L-'·-:'~·~··
139
10.5 Predictions for Full Scale Reactors
Figure 10.5-1 shows, schematically, the general flow pat
tern of materials and the equipment requirements for the zinc production
scheme outlined briefly in Chapter One, Section 1. O.
The potential technical and economic advantages of such a
process are outlined briefly as follows:
1) Fluidized beds have very few moving parts and hence,
maintenance costs should be low.
2) Through continuous operation and a high degree of auto-
mation, labour requirements should be reduced appreciably.
3) Fuel requirements should be lowered since the .exothermic
heat of the roasting reactions can be recovered by:
a) hot charging the roasted calcine to the reduction
fluidized bed;
b) preheating the reducing gases with the hot effiuent
gases from the roasters;
c) combining the roasting fluidized beds and the reduc-
ing fluidized beds within a single container to make
use of the roasting heat of reaction for the endo-
thermie reduction reaction.
4) Alternative reducing gases, e. g., Methane, propane,
natura! gas, May he used to provide heat by combustion.
The combustion products of the se gases would he used
for the reduction of the zinc calcine.
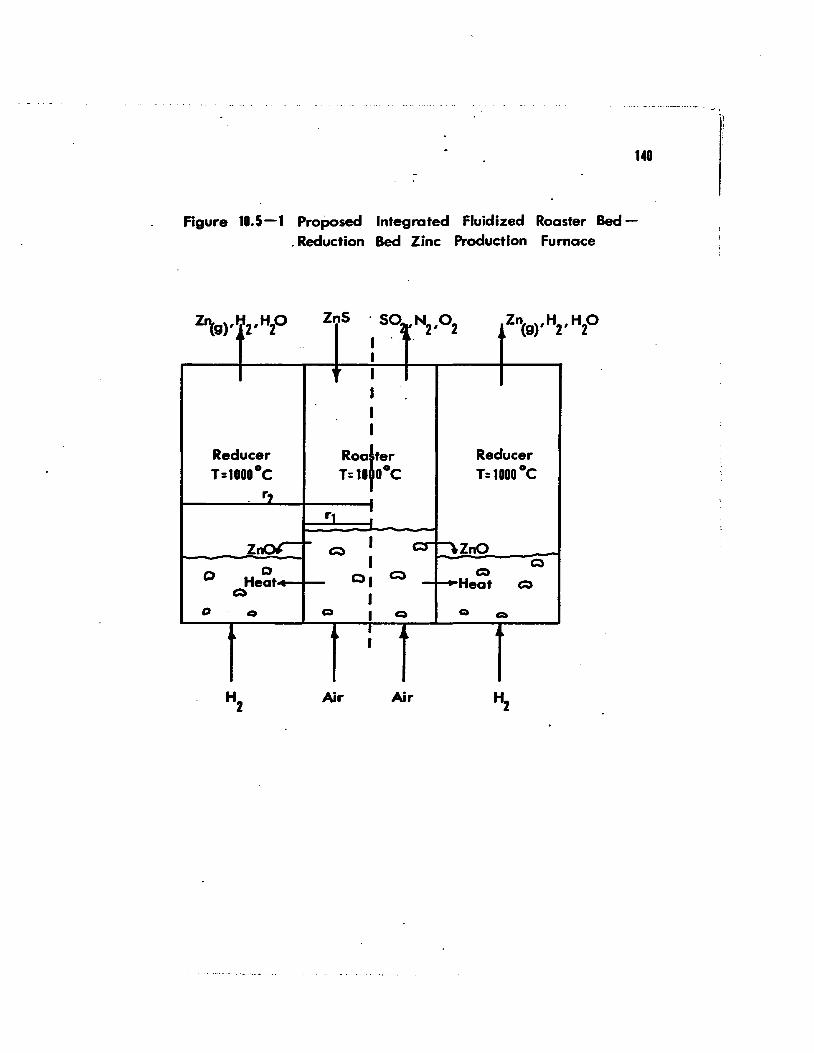
~ . - .. _.~. - .. _--,.... --... ' -
148
Figure 10.5-1 Proposed Integrated Fluidized Roaster Bed. Reduction Bed Zinc Production Furnace
~ li HO ZnS 'SONO g)' 2' 2 .. ~ " 2' 2 (g)' 2
4~ 1 ~
1 ~ .. 1
1 1 1
Reducer R1rer Reducer T:1000oC T=ll ooc T= 1000 Oc
r, . rl 1 .
~~ ~ 1
c:;:) """ \ZnO
C 1 Q
Q QI c:::;) ~ Heat - f-t-Heat Q
Q 1 D 0 Q 1 Q 0 Q
1 jr- , 1
Air Air
......

141
This section of the thesis will deal with the calculation of two
important parameters for an industrial scale plant based on the dia
gram in Figure 10.5-1. These two calculations have been:
a) prediction of the requirements for total reduction
vessel area, i. e., the plan area required for the
reduction beds;
b) prediction of the potential fuel savings to be gained
from the hot feeding of calcine, of preheating the
reducing gas fed to the reduction fluidized bed, and
of combining the roasting and reduction beds in one
container.
The calculations have been made for a) reduction with hydrogen and
for b) reduction with methane. The data for the roasting step has
been taken from the current practice at Canadian Electrolytic Zinc
Ltd., while the data for the reduction step has been taken from the
present experimental data.
In the calculations, the assumption has been made that the
roaster feed material is pure sphalerite (znS).
Table 10.5-1 shows the pertinent operating data from the
Canadian Electrolytic Zinc Lurgi turbulent layer fluidized bed roasters.

TABLE 10.5-1
Operating Data for the Lurgi Turbulent Layer Fluidized Bed
Roasters at Canadian Electrolytic Zinc Limited
Feed Rate
Air Blowing Rate
Bed Grate Area
Bed Temperature
Average Space Velocity
Boiler I:n1et Temperature
BoUer Outlet Temperature
SoUd Product Distribution
A ver age Zinc Content in
Concentrate
Roaster Off-Gas Composition
10 tph (wet) = 9.5 tph (dry)
15,700-17,300 Nm3
hr-1
(10,000-12,000 SC FM)
34 m 2 (366 ft2)
9500 C
146 ft. min-1
9700 C
3500 C
12.5% to Roaster Overfiow
87. 5% to Waste Beat Boilers
52% (dry basis)
10-11% 802
5-6 % O2
9-11% B20
73-76% N 2
tO.5-1 Basis of the Design Calculations
142
The plan area of the reactor for the reduction of zinc oxide has
been based on a plant capable of producing 50 tons of zinc per day. To
achieve this, the operating data of the C. E. Z. roasters (Table 10.5-1)

143
were scaled down while preserving similarity in space velocity and air
ta concentrate ratio. The scaled down parameters are shown in
Table 10.5-2.
TABLE 10.5-2
Scaled Down Parameters for a Fluidized Bed Roaster Capable
of Producing 50 tpd of Zinc Oxide
Concentrate Feedrate
Zinc Production Rate
Air Blowing Rate
Roaster Grate Area
(calculated ta give a
space velocity of 146 ft.
min. -1 as in the C. E. Z.
beds (Table 10.6-1»
4..0 tph
-2 -1 3. 28 gm moles ft. min.
4,000 SCFM
146.5 ft. -2
The reduction rates estimated for ZnO reduction with a) hydrogen n
and b) Methane at 10000 c were based on operation with a 40 deep bed
(10 times the bed height used in the experimental study) and the higher
experimental gas space velocity of 7.54 cm. sec. -1. Operating under
these conditions, it was assumed that the equilibrium zinc content was
established in the effiuent gases. The equilibrium assumption seems
justified as the residence time in the full sc ale bed will be 10 times
that in the present experimental bed.
To facilltate subsequent heat balance calculatioDS, all calculations
have been based on the production of 1 gm. mole of zinc.

144
10. 5 -2 Calculation of the Plan Area Requirements for ZnO Reduction
Table 10.5-3 shows the data for the estimation of the plan area
required for ZIlO reduction in a fluidized bed.
TABLE 10.5-3
Estimation Data of the Plan Area Required
for znO Reduction in a Fluidized Bed
Depth of bed
Gas Space Velocity
Gas Residence Time in
the bed (calculated)
Equilibrium PZn (10000C)
Moles of Zinc produced
per mole of gas fed in
Plan area Expt'l bed
Zinc Production Rate
(calculated)
For Hydrogen Reduction
Hydrogen Reduction
40 inches
7.54 cm. sec. -1
13.5 secs.
0.166 atmos.
0.2
2 0.0378 ft.
-2 0.82 gm. moles ft.
min. -1
Methane Reduction
40 inches
7.54 cm. sec. -1
13.5 secs.
0.315 atmos.
1. 37
2 0.0378 ft.
5.55 gm. moles ft.-2
min. -1
The plan area of the reduction fluidized bed can now be calculated
based on a designed zinc production rate of 3.28 gm. moles Zn ft. -2 min. -1
and a roaster grate area of 146.5 ft. +2 (Table 10.5-1).
It can readily be seen that the reduction bed grate area required
is -2 -1 3.28 gm. moles ft. min. x 146.5 ft. 2 = 590 ft. 2 0.82 gm. moles ft. -2min. -1

145
Using the annulus design of Figure 10.5-1, the radius of the
reduction fluidized bed is 15.3(r2) feet as compared with the radius
of the internaL roaster of 6.8(rl) feet. The dimensions of the device
are shown in Figure 10.5-1.
For Methane Reduction
For methane reduction of ZnO, on the other hand, the required
plan area is
3.28 gm. moles ft. -2 min. -1 x 146.5 = 87 ft. 2
5 55 gm. moles ft. -2 min. -1
and the radius of the reduction bed will be 8.6 feet around the central
roaster of 6.8 feet radius (Fig~ 10 .. 5-1).
10.5-3 Beat Calculations Based on a Roast-Reduction Integrated Process
For the Production of Zinc
Chapter One, Section 1. 0, and Chapter Ten, Section 10. 5 have
projected an idea for a novel method of smelting zinc ores and have
commented on the potential advantages to be deri ved from an integrated
zinc production scheme.
Energy requirements, in particular the conservation and efficient
utiUzation of energy, are extremely important items in determining the
economic feasibility of a new process, particularly where a process
demands bigh temperatures for operation.
The pyrometallurgical production of zinc requires high temperatures
ta yield zinc at perceptible rates by conventional reduction methods. Large
heat requirements are needed because a) the reduction is highly endo-
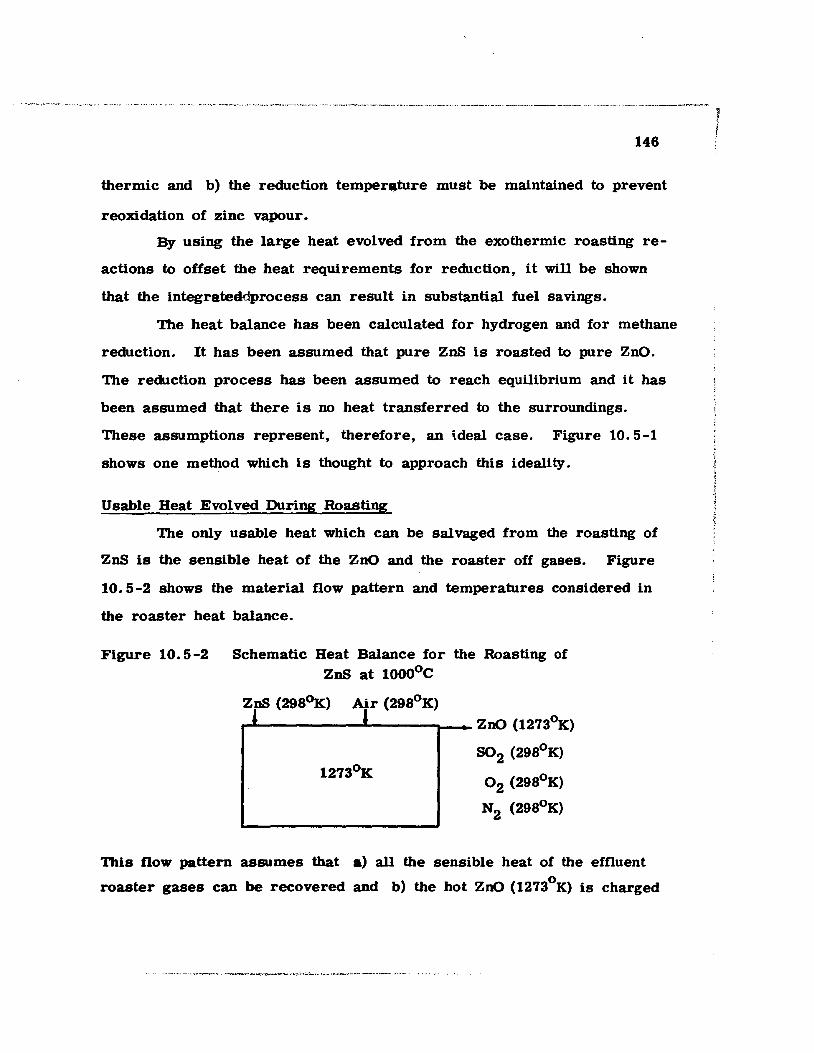
146
thermic and b) the reduction temper.ture must be maintained ta prevent
reoxidation of zinc va pour •
By using the large heat evolved from the exothermic roasting re
actions ta offset the heat requirements for reduction, it will be shown
that the integrateddprocess can result in substantial fuel sa vings.
The heat balance has been calculated for hydrogen and for Methane
reduction. It has been assumed that pure znS is roasted ta pure ZnO.
The reduction process bas been assumed ta reach equilibrium and it has
been assumed that there is no heat transferred ta the surroundings.
The se assumptions represent, therefore, an i.deal case. Figure 10.5-1
shows one method which is thought ta approach this ideality.
Usable Beat Eval ved During Roasting
The only usable heat which can be sal vaged from the roasting of
znS is the sensible heat of the znO and the roaster off gases. Figure
10.5-2 shows the material flow pattern and temperatures considered in
the roaster heat balance.
Figure 10.5-2 Schematic Beat Balance for the Roasting of znS at 10000 C
zr (29SOX:) ~r (29So
K) ,..... _____ .L-_______ znO (12730 K)
S02 (29SoK)
O2 (29SoK)
N2 (29SoK)
This flow pattern assumes that a) aIl the sensible heat of the emuent o roaster gases can be recovered and b) the hot znO (1273 K) is charged
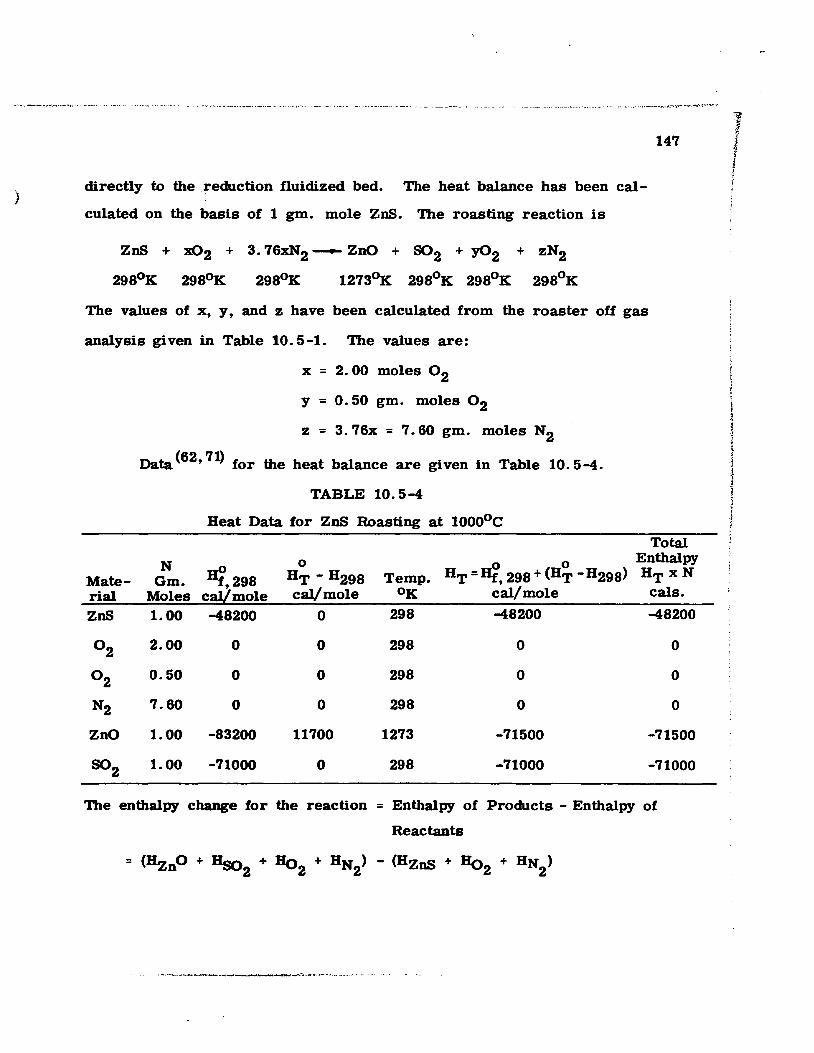
~"~' .. _-_.'.~"""""''''.,,"., --~._, .,.,_ .•... ,." •• " " ••.. _ ..•. ~ ..... _ •. __ .... ,_ .... ~ ... ~., ___ ,~ _ .•• · ..• "_'r ~_ •.••..... _ .•• ~ ....• _._._, __ .. _._.~ .• __ ._ .. __ ._ ••. _ .•.. _._. __ •...•....•. _ ... _ .. _ •. .,_,.. __ ~ ••• ~_. __ '.'_' __ ._, ••..••• _ .... _'VT~;·" ........ 'V·,...,f.·!"'· .... .,··
) directly to the reduction fluidized bed. The heat balance has been cal
culated on the basis of 1 gm. mole znS. The roasting reaction is
znS + x02 + 3. 76xN2 - ZnO + S02 + y02 + zN2
2980 K 2980 K 2980 K 12730 K 2980 K 2980 K 2980 K
147
The values of x, y, and z have been calculated from the roaster off gas
analysis given in Table 10.5-1. The values are:
Material znS
°2
°2
N2
znO
S02
x = 2. 00 moles 02
y = 0.50 gm. moles 02
z = 3.76x = 7.60 gm. moles N2
Data (62,71) for the heat balance are given in Table 10.5-4.
TABLE 10.5-4
Heat Data for znS Roasting at 10000 C
tm. ~,298 Moles caI/ mole 1.00 -48200
2.00 0
0.50 0
7.60 0
1.00 -83200
1.00 -71000
o HT - H298 cal/mole
o
0
0
0
11700
0
Total o 0 Entluùpy
HT = Hf, 298 + (HT - H298) HT x N Temp. OK cal/mole cals.
298 -48200 -48200
298 0 0
298 0 0
298 0 0
1273 -71500 -71500
298 -71000 -71000
The enthalpy change for the reaction = Enthalpy of Products - Enthalpy of
ReactantB
i \ l , \ 1 l 1 ,i
ï
1 "
1 ! i

= (-71500 - 71000 + 0 + 0) - (-48200 + 0 + 0)
= -94300 caL (gm. mole)-lZnO
That is, the roasting process can ideally deliver 94300 cal
(gm. mole) -lof znO to the reduction bed.
Heat Required for the Reduction of Zinc Oxide by Hydrogen
Figure 10.5-3 shows a schematic representation of the heat
balance for the reduction of zinc oxide by hydrogen.
Figure 10.5-3 Schematic Heat Balance for the Reduction of Zinc
Oxide by Hydrogen at 10000 C
ZnO(12730 K) H (298oK)
n(g) (12730K)
H2 (12730 K)
H20(12730 K)
148
Assuming that the effluent gas stream contains the equilibrium
amount of zinc vapour (~~ = 0.166 atmos., 1000oC), it can be shown that
N Zn = 0.166 (10.5-1) NZn + N
H2 + NH20
wbere N is the number of moles of each gaseous component.
From the stoicbiometric equation, znO + H2-Zn(g) + H20. it can he
seen that NZn = NH20. 'lberefore, solving equation 10.5-1 for the pro-
duction of one gm. mole of Zn, U can be seen that there will be 4.0 gm.
moles of H2 per gm. mole of Zn produced in the effiuent gases. The
required amount of ÏDplt hydrogen is. then, 5.0 gm. moles H2 per gm.
/

149
mole of Zn produced. The defining reduction equation is, therefore,
znO + 5H2 - Zn(g) + 4H2 + H 20
1273 298 1273 1273 1273
Table 10.5-5 contains the enthalpy data (28, 62) for the solution
of the reduction heat balance.
TABLE 10.5-5
Heat Data for znO Reduction by Hydrogen at 10000C
N ~273-H298
0 H = Hf 298 + (~ -H298)
Mate- Gm. Hf, 298 T , rial Moles cal/mole cal/mole Cal/mole
Input H 2 5.0 0 0
OutputH2 4.0 6900 0 6900
Zn(g) 1.0 36000 0 36000
znO 1.0 11700 -83300 -71500
H20 1.0 19500 -68300 -48800
The enthalpy change = (HH 0 + HH + HZn) - (HZnO + HH ) 222
1273 1273 1273 1273 298
= (-48800 + 27600 + 36000) - (-71500 + 0)
= 86300 cal. (gm. mole znO)-l
Unrecoverable Roaster Heat
Total Enthalpy HTxN cals.
0
27600
36000
-71500
-48800
Comparison of the total usable roaster heat (94300 cal per mole
znO) evolved during the roasting of znO with the heat required to reduce
1 mole znO (86600 cal per mole znO) shows that the integrated process
ls autogellOus provided that al1 the roaster heat can be utilized. However,
since the roaster gases are at 10000C and the reduction occurs at the
same temperature, the sensible heat of the roaster gases can only he
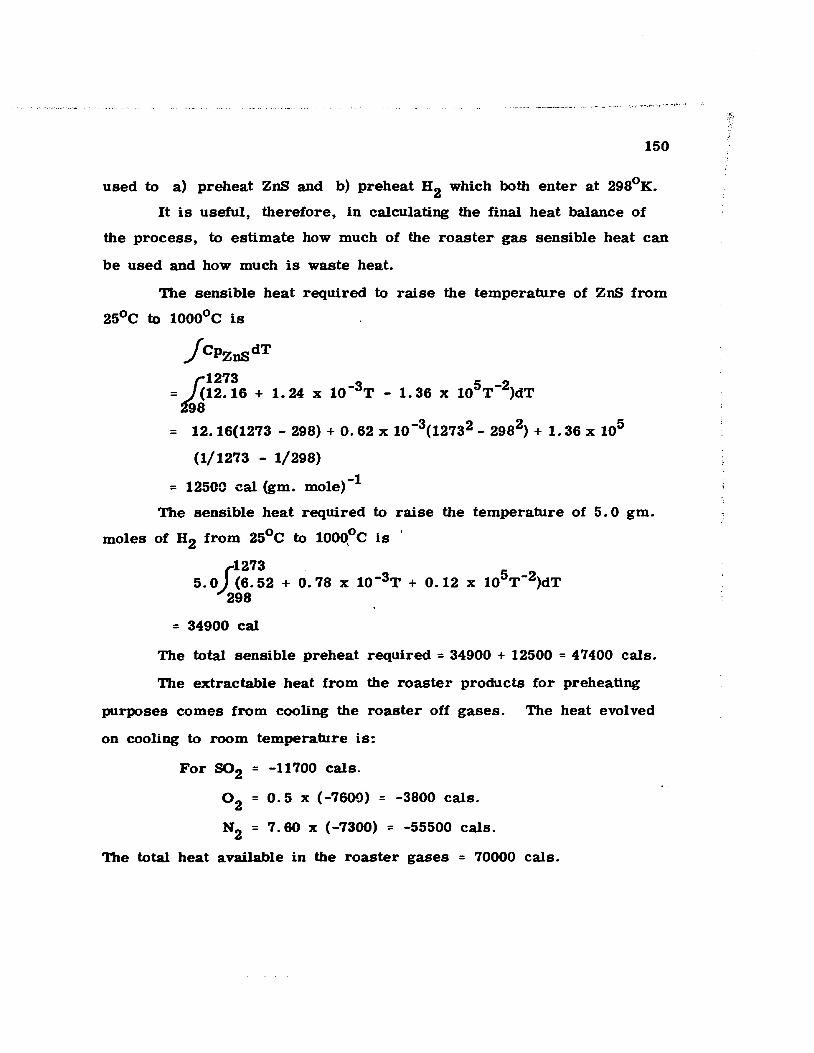
150
used to a) preheat znS and b) preheat H2 which both enter at 2980 K.
It is useful, therefore, in calculating the final heat balance of
the process, to estimate how much of the roaster gas sensible heat can
be used and how much is waste heat.
The sensible heat required to raise the temperature of znS from
250 C to 10000 C is
fCPZnS dT
~1273
= (12.16 + 1. 24 x 10 -3T - 1. 36 x 105T-2)dT 98
= 12. 16(1273 - 298) + 0.62 x 10 -3(12732 - 2982) + 1. 36 x 105
(1/1273 - 1/298)
= 12500 cal (gm. mole)-l
The sensible heat required to raise the temperature of 5.0 gm.
moles of H2 from 250 C to 100Q~C is .
. (1273 5.0)_ (6.52 + 0.78 x 10⁻³T + 0.12 x 10⁵T-2)dT
298
= 34900 cal
The total sensible preheat required = 34900 + 12500 = 47400 cals.
The extractable heat from the roaster products for preheating
purposes comes from cooling the roaster off gases. The heat evolved
on cooling to room temperature is:
For 802 = -11700 cals.
02 = 0.5 x (-7600) = -3800 cals.
N2 = 7.60 x (-7300) = -55500 cals.
The total heat available in the roaster gases = 70000 cals.

151
Therefore it can be seen that not all of this available heat can be used.
In fact, the total unusable heat
Total Unusable Beat = Beat A vailable by Cooling Roaster Gases - Beat
to Raise Temperature of Feed Materials.
= 70000 - 47400 = 22600 cals.
This is equi valent to saying that the roaster gases will leave the system
at a temperature higher than room temperature.
Thus, the net thermal deficiency for the overall process = the
reduction heat required -(oxidation heat - unusable roaster off gas heat).
= 86300 - (94300 - 22600)
= 14600 cals.
Even under ideal conditions, therefore, the process using air is
not completely autogenous with the result that heat will have to be added
to the system.
It can be shown, however, that by using air enriched to 37% 02'
the process can be made to run autogenously under ideal conditions.
Beat Required for the Reduction of Zinc Oxide by Methane
Assuming that conditions in the fluidized bed reduction vessel are
such that equilibrium ls acbieved in the effluent gases, the composition
of the off gases at l0000 C can be shown to be 31. 5% Zn, 2.0% CO2 ,
a a (28) 6.5% B20, 39.5"" B2' and 21. 0"" CO. By performing a mass balance
on carbon or hydrogen it can be shown that 0.73 gm moles of CB4 are
required to produce 1 gm mole of zinc vapour.
Figure 10.5-4 shows scbematically the heat balance for the reduc
tion of zinc made by methane.
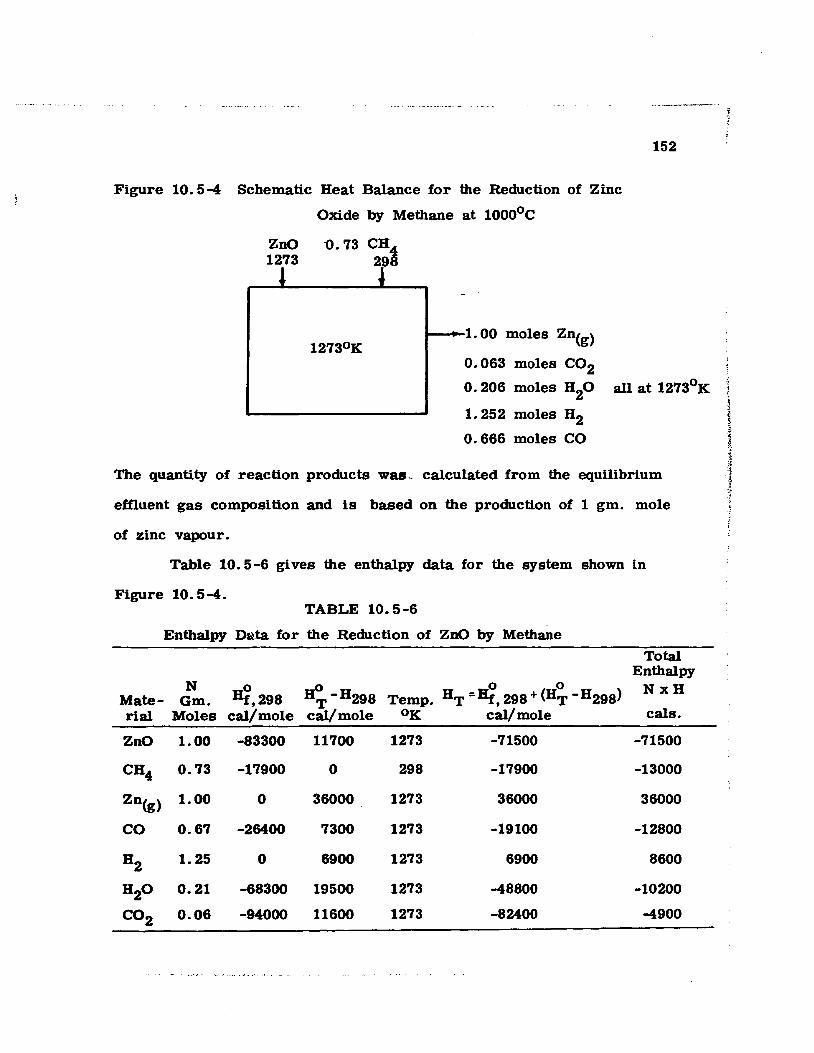
Figure 10.5-4 Schematic Heat Balance for the Reduction of Zinc
Oxide by Methane at 10000 C
znO "0.73 CH4 1i73 2(8
............. 1. 00 moles Zn(g)
0.063 moles CO2 0.206 moles H20
1.252 moles H2 O. 666 moles CO
152
The quantity of reaction products was~ calculated from the equilibrium
effluent gas composition and is based on the production of 1 gm. mole
of zinc vapour.
Table 10.5-6 gives the enthalpy data for the system shown in
Figure 10.5-4. TABLE 10.5-6
Enthalpy D~.ta for the Reduction of znO by Methane
Total Enthalpy
N 0 0 o 0 NxH Mate- Gm. Hf, 298 HT -H298 Temp. HT = Hf, 298 + (HT - H298) rial Moles cal/mole cal/mole oK cal/mole cals.
ZnO 1.00 -83300 11700 1273 -71500 -71500
CH4 0.73 -17900 0 298 -17900 -13000
Zn(g) 1.00 0 36000 1273 36000 36000
CO 0.67 -26400 7300 1273 -19100 -12800
H2 1.25 0 6900 1273 6900 8600
H20 0.21 -68300 19500 1273 -48800 -10200
C02 0.06 -94000 11600 1273 -82400 -4900

153
The enthalpy change for the reaction depicted in Figure 10. 5 -4 is
(Enthalpy of Products - Enthalpy of Reactants)
= (BZIi(g) + BCO + BB2
+ BB20 + BC02
) - (BZnO + BCB4 )
1273 1273 1273 1273 1273 1273 298
= (36000 -12800 +8600 -10800 -4900) -(-71500 -13000)
= 100, 600 calories
Unusable Beat, Methane Case
As for the case of hydrogen reduction, the enthalpy of the roaster
gases can only be used to preheat the incoming znS and Methane. The
sensible heat required to raise the tempe rature of 1 gm mole of znS
from 298~ to 12730 K is 12500 cals., as calculated previously. Like-
wise, the sensible heat required to raise the temperature of Methane
from 298~ to 12730 K is
~1273
0.73 (5.65 + 11.44 x 10⁻³T -0.46 x 10⁵T-2)dT 298
= 0.73 [!. 65(1273-298) + 5. 72 x 10-3(12732 - 2982) + o. 46 x 10SCt/1273-1/29ij
= 10300 cals.
The total sensible heat required to raise the feed materials to the
reacting temperature is, therefore, 22,800 cals. The total waste or
unusable heat is
70,000 - 22,800 = 47,200 cals.
Calculating as before, the net overall thermal deficiency for
Methane reduction is
100,600 - (94,300 - 47,200) = 53,500 cals.
154
Thus, this process is very endothermic even under Ideal reactor
conditions.
Comments
The calculations for the heat requirements of an integrated roast
reduction process for the production of zinc have been made for a) hydro-
gen reduction and b) Methane reduction. The calculations presented apply
for a process operated under the best possible conditions, i. e., no heat
losses and the attainment of thermodynamic equilibrium during reduction.
The comparative merits of the two reduction systems show that
from a thermal viewpoint, reduction by hydrogen is a better process
.(thermal deficit 15 Kcal vs 54 Kcal per gm mole of zinc produced). In
fact the roasting-hydrogen reduction process can be made largely auto
genous by enriching the roaster air to approximately 37% 02.
Although the kinetics of Methane reduction have not been studied
in the present work, Mathewson (28) indicates that Methane reduction is
rapid at 1000oC. Therefore, it seems likely that Methane reduction of
zinc oxide is a more attractive process in terms of the absolute reduction
rates obtained. '!bus the size of reduction fluidized beds required per
unit of zinc produced will be much more favourable using Methane as a
reductant.

155
10. 6 Summary and Critique gf' the Present Work
ln Chapter Three of this work a review of the current pyrometal
lurgical solutions ta the problem of zinc smelting has been presented
with due consideration gi ven to bath the advantages and disadvantages of
each process. In addition, a fairly comprehensive review of previous
attempts to seek alternatives to the conventional processes has been
given.
The main purpose of this work has been, therefore, ta give the
reader another alternative for consideration, i. e., the production of
zinc by an integrated fiuidized roaster bed-reduction bed technique. A
number of experiments and calculations, constituting the initial develop
ment stages of the process, have been conducted with certain goals in
mind. These included:
1) proof of the technical feasibility of the envisioned process;
2) attempts to optimize some of the important operating
parameters of the process, i. e., operating temperature
and reducing gas flowrate;
3) elucidation of some, if not all, of the most important
potential problem areas which could prove troublesome
to a commercial installation of the process.
The constructed experimental apparatus and technique has proved
successful in showing that zinc metal can be produced by the gaseous
reduction of zinc oxide based calcines in a fluidized bed. However, the
lack of a suitable sampling technique and power limitations of the heating

156
furnace greatly limited the scope and range of the variables studied. An
effort was made to develop a sampling technique that would have made
possible the completion of a reduction curve in a single run. However,
practical problems arose and i t was decided that time spent on perfecting
this technique might have been counter-productive. A less sophisticated
technique which provided only one data point per run was therefore used.
In retro spect , while this decision appeared to be the correct one at the
time, taking all the factors then apparent into consideration, it May not
in fact have been the wisest decision from the point of view of the over
all results obtained. It is feU, however, that the consistency of the
results that were obtained supported the use of the sampling technique
and experimental procedure to confirm the reproductibility of the results.
The use of a heating furnace with a higher output power rating or
a more suitable method of preheating the incoming reducing gas to the
fluidized bed would have permitted reduction runs to be carried out at
temperatures above 900oC. Ideally the temperature dependence of the
reduction rate should have been evaluated up to approximately 1100oC.
Although the experimental apparatus included a condenser to
recover the zinc vapour from the effluent gases, zinc condensation
studies were not undertaken in this investigation.
It can be said without a doubt that the experimental observations
indicate that clinkering and particle agglomerations could pose serious
problems to an industrial process of this type. Since no detailed experi
mental tests were undertaken to investigate this problem more fully,

assumptions that the reported observations will apply to large scale
reactors must be made with caution.
As an integral part of the development of this process, two
theoretical calculations (one an overall heat balance for the process;
the other a calculation of the plan area of the equipment) have been
157
made based on the best possible operating conditions, i. e., the attain-
ment of chemical equilibrium during reduction and the assumption that
there are negligible heat losses from the process. Using hydrogen as
a gaseous reducing agent and air enriched to 37% °2, i t has been
shown that the process can be run autogenously. Although the experi-
mental results do not show conclusi vely what conditions of temperature
and hydrogen fiowrate will lead to chemical equilibrium in the bed, i t
was felt that by using a deep bed (i. e., increasing the gas residence
time in the bed) and a moderate gas fiowrate, equilibrium could be
achieved at say l000oC.
Operation under non-ideal conditions will, of course, result in
diminished reduction rates and the need for a larger reduction bed
grate area. Consequently, there will be higher heat losses due to
the larger physical size of the reactor. In such cases, additional
fuel would have to be burned to compensate for the additional heat losses.
No attempt has been made during the course of titis work to sug-
gest or speculate on construction details or materials which would be
suitable for a commercial installation of the process. This aspect still
must he evaluated and gi ven much thought. Most certainly, materials

Lea!' 158 cud tted
in page mmbering.

159
capable of withstanding high temperatures (up to 1100oC) during continuous
operation and attack by gaseous zinc must be used. While the outer waHs
of the integrated reactor must be w~ll insulated to reduce heat losses to
the outside, the wail of the internai roaster fluidized bed, on the other
hand, must be as thin as expedience will aIlow to provide maximum
transfer of roasting heat to the reduction fluidized bed.
Notwithstanding the limited scope of the results obtained in this
experimental investigation, it can be stated conclu si vely that the primary
objective has been successfully met, i. e., that zinc can be produced by
gaseous reduction in a fluidized bed. It is hoped that the success of
this work will spur others to continue and that ultimately the process
will achieve commercial realization.
160
10.7 Suggestions for Future Work
The present work has led to the proposal of a novel and previously
unexplored technique for the production of zinc.
Some suggestions for future work to further exploit the results
presented in this thesis and to widen the scope of this technique include:
1) Further exploration into the effect of temperature on the zinc
production rate. The fluidized bed reduction technique should
be investigated at temperatures above the boiling point of zinc,
say up to 1100oC. Condensation of the vapours should be
included.
2) A further study of the effect of the hydrogen flowrate on zinc
production rates. The present work suggests that the gas
flowrate has a marked effect on zinc production rates and,
therefore, this variable should be investigated further, both
for a wider range of hydrogen flowrates and for different
temperatures. Other workers, particularly Kivnick and
Hixson(64), have suggested that, for nickel oxide reduction
with hydrogen, increases in the gas flowrate have a greater
beneficial effect on nickel production with increasing tempera-
ture.
3) A study of the effect of particle size on zinc production rates.
4) A study of the effect of the bed depth or length to diameter
ratio of the bed on zinc production rates and hydrogen effi-
ciencies.

161
5) The use of other reducing agents. Suggested reducing agents
include methane or natural gas and a mixed bed of coke and
zinc calcine fluidized with air or oxygen enriched air. Both
these techniques have the advantage that heat can be supplied
internally by combustion. By selecting the proper air rate,
both methane or natural gas and coke can be burned under
reducing conditions to produce 1) heat and 2) sufficient
unburned fuel to carry out the reduction process.
6) A pilot sc ale roaster-reduction bed device should be built to
determine the most suitable method to optimize heat recovery.

10.8 Conclusions
1) The results of the present work have shown that it is
technically feasible to produce zinc metal by the reduction
of oxidized zinc sulphide concentrate by hydrogen in a
fluidized bed.
2) The rate of zinc production increases with increasing
temperature in the range 8000 C to 900oC.
162
3) The rate of zinc production increases with increasing hydro
gen flowrate in the range of space velocities 3.77 cm sec-1
to 7. 54 cm sec -1 .
4) Particle agglomeration due to the presence of lead in the
charge was observed. Agglomeration might be a problem
in an industrial scale plant.
5) It has been shown that the rate of zinc elimination is almost
constant up to 88% zinc elimination. The rate controlling
step appears to be gas phase mass transport.
6) The maximum attainable "economic efficiency" of hydrogen
utilization (lOOOoC) is 1 mole of zinc produced per 5 moles
of hydrogen introduced. The unused hydrogen will have to
be dehydrated and recycled to the reduction process.
7) Calculations have shown that under ideal conditions a com
bined roaster bed-hydrogen reduction bed is not quite auto
genous employing air as the roaster gas feed. Enrichment
of the roaster feed gas to 37% 02 makes the ideal roaster-

reducer bed combination autogenous. Fuel must be com
busted in the reduction bed to compensate for non -ideal
heat losses.
8) Preliminary calculations suggest that the reducing bed
163
grate area will be 3 to 4 times that required for the roast
ing bed.
9) The use of methane or natural gas as a reductant greatly
favours reduction rates but will require a greater heat of
combustion in the reducing bed.

APPENDICES
164
APPENDIX 1
WW TEMPERA TURE FLUIDIZED BED INVESTIGATION
Prior to the initiation of the high temperature investigation, a
room temperature model of the fluidized bed was constructed to find
and test a suitable distributor plate for the high temperature work.
The suitability of the distributor plate was judged by tts ability
to withstand high temperatures and its ability to give an evenly dis
tributed gas flow through the bed, i. e., an avoidance of slugging and
channelling. Wire gauze (200 mesh) , perforated stainless steel plate,
and insulating firebrick were the materials tested with the firebrick
giving the best results. Thus insulating firebrick dises were used
in the high temperature study.
The low temperature fluidized bed was constructed entirely of
clear acrylic plastic and it conformed exactly to the design of the high
tempe rature fluidized bed reactor. The only differences were that the
reactor diameter was 2 inches i. d. vs 2.635 inches for the high tempera
ture reactor and two pressure taps for observing the pressure drop
across the bed were inserted through the reactor wall. The lower tap
was situated directly above the distributor plate and the upper was
located above the bed. Both were flush with the reactor wall. Figure A 1
shows a detailed drawing of the low temperature fluidized bed.

Figure Al Diagram of the Law Temperature Fluidized Bed
n , 1/4 Il eapillary tubing .~~~~~~ (pressure tap)
t
1/4 " h kIl t ie e ear acry ic plastic cylinder
2"i.d. _
- ~ 'f',.: ,:.' '.'.'-:','.,:, : .•..... -:.::.; :.
4"
iV4"~Ir'-__ insulating firebrick distributar plate
b====~~;:tl--- ac:rylic plastic calming vane 1 2" ,., ~~
~ : 3 4" ...... _-of' 1 _1...- ____ ~ 11--__ ..-1
_ ~ :1-- 3/1" a.d. E: 1 • d - acrylie plastic gas -.c 1/4" 1 • • i nlet tube
1&5

166
The fluidization quality was judged from the pressure drop against
mass flowrate or gas velocity curve. This curve is presented in Fig
ure 5.1-1, p. 39 for the insulating firebrick distributor. Any tendency
towards channelling or slugging in the bed is usually quite evident from
the se plots.
Channelling is characterized by the pressure drop across the bed
never quite recovering after the minimum fluidization flowrate to the
theoretical flowrate defined by the bed weight per unit cross sectional
area.
Slugging, on the other hand, is generally not observed until very
high flowrates are reached, at which time slugging is observed by either
a) violent fluctuations in the pressure drop or b) a greater than theoret
ical pressure drop.

167
ACKNOWLEDGEMENTS
Sincere appreciation is extended to Professor W. G. Davenport
for supervision and assistance gi ven during the course of this work.
Thanks are due to Professor W. M. Williams, Chairman,
Department of Metallurgical Engineering, McGill University, and to
Professors R.I. L. Guthrie and W. T. Thompson for their interest and
encouragement.
The author wishes to extend his thanks to Mr. M. Knoepfel
for his invaluable technical assistance.
The author is indebted to the National Research Council of
Canada for providing generous financial assistance.
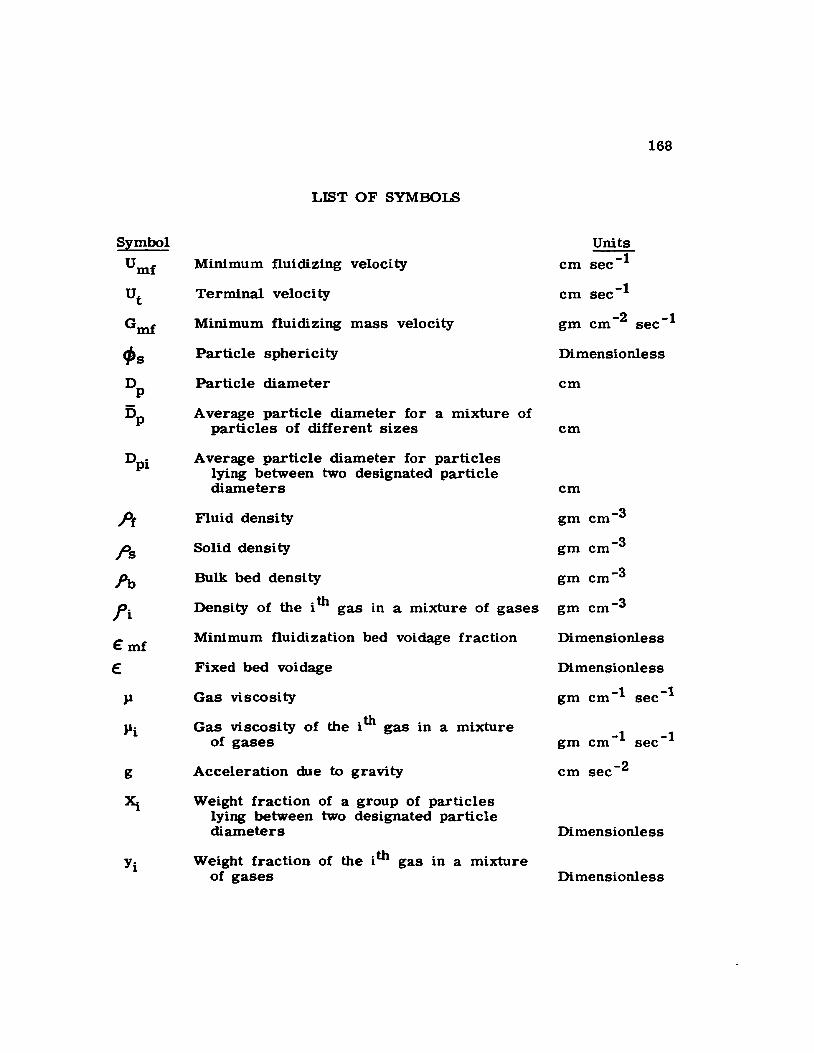
Symbol
Umf
Ut
Gmf
CPs Dp
Dp
Pt
~s
Pb
~i
€mf
€
g
LIST OF SYMBOLS
Minimum fluidizing veloci ty
Terminal veloci ty
Minimum fluidizing mass velocity
Particle sphericity
Particle diameter
Average particle diameter for a mixture of particles of different sizes
Average parti cIe diameter for particles lying between two designated particle diameters
Fluid densi ty
Solid densi ty
Bulk bed densi ty
Density of the i th gas in a mixture of gases
Minimum fluidization bed voidage fraction
Fixed bed voidage
Gas viscosity
Gas viscosity of the i th gas in a mixture of gases
Acceleration due to gravity
Weight fraction of a group of particles lying between two designated particle diameters
Weight fraction of the ith gas in a mixture of gases
Units
cm sec-1
cm sec-1
168
gm cm-2 sec-1
Dimensionless
cm
cm
cm
gm cm-3
gm cm-3
gm cm-3
gm cm-3
Dimensionless
Dimensionless
gm cm-1 sec-1
gm cm-1 sec-1
cm sec-2
Dimensionless
Di mensionless

Symbol
Vi
V
w
N
K
D
T
o H f ,298
Volume fraction of the i th gas in a mixture of gases
Volume
Solids weight
Thermodynamic equilibrium constant
Equilibrium partial pressure of agas (subscript denotes the gas 10 which partial pressure applies)
Partial pressure of a gas in the bulk gas (subscript denotes the gas 10 which partial pressure applies)
Reaction rate
Maas transfer coefficient
Total parti cie area
Bulk concentration of agas (subscript denotes gas 10 which concentration applies)
Equilibrium concentration of agas (subscript denotes gas 10 which concentration term applies)
Gaseous diffusion coefficient
Absolute temperature
Number of moles of a substance (subscript denotes substance)
Standard enthalpy of formation of a substance
Enthalpy of a substance at some temperature other than 2980 K
169
Units
Dimensionless
3 cm
gms
Suitable uni ts
Atmospheres
Atmospheres
gm -moles min-1
cm min-1
gm -moles cm-3
gm -moles cm-3
cmZ sec-1
OK
gm-moles
cal (gm-mole)-1
cal (gm -mole) -1
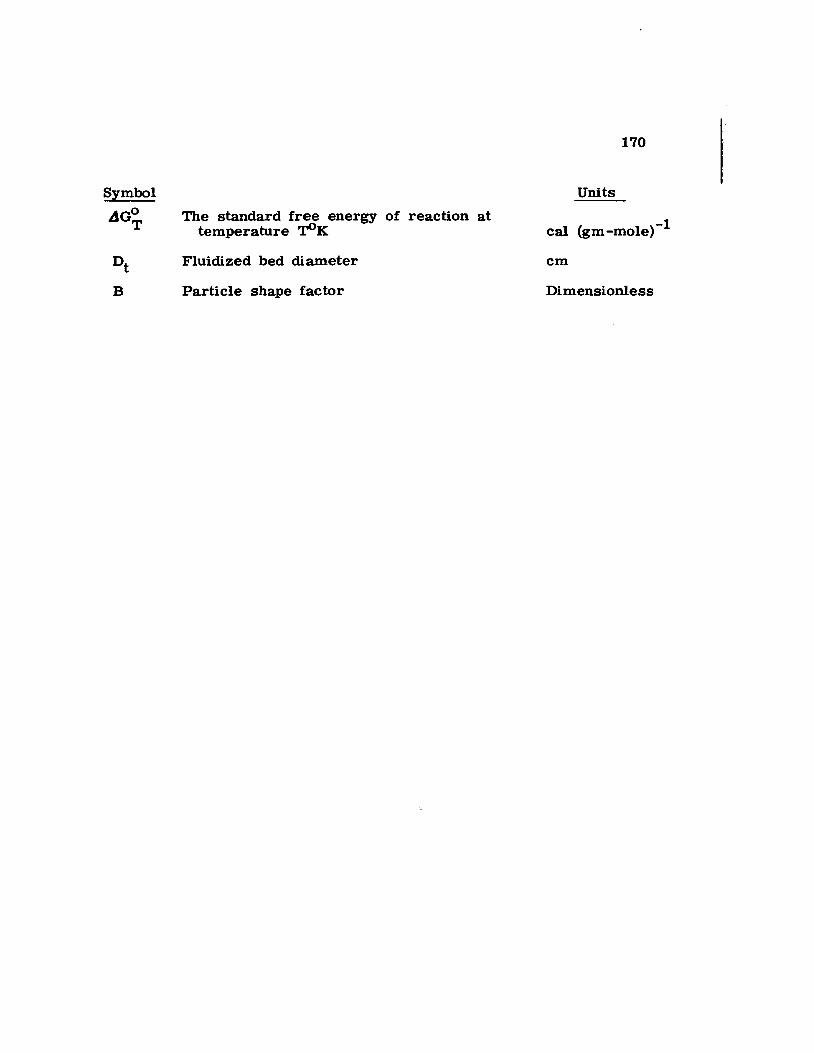
Symbai
~Go T
The standard free energy of reaction at temperature T>K
Fluidized bed diameter
Particie shape factor
170
Units
cal (gm-naoIe)-1
cna
Dinaensionless
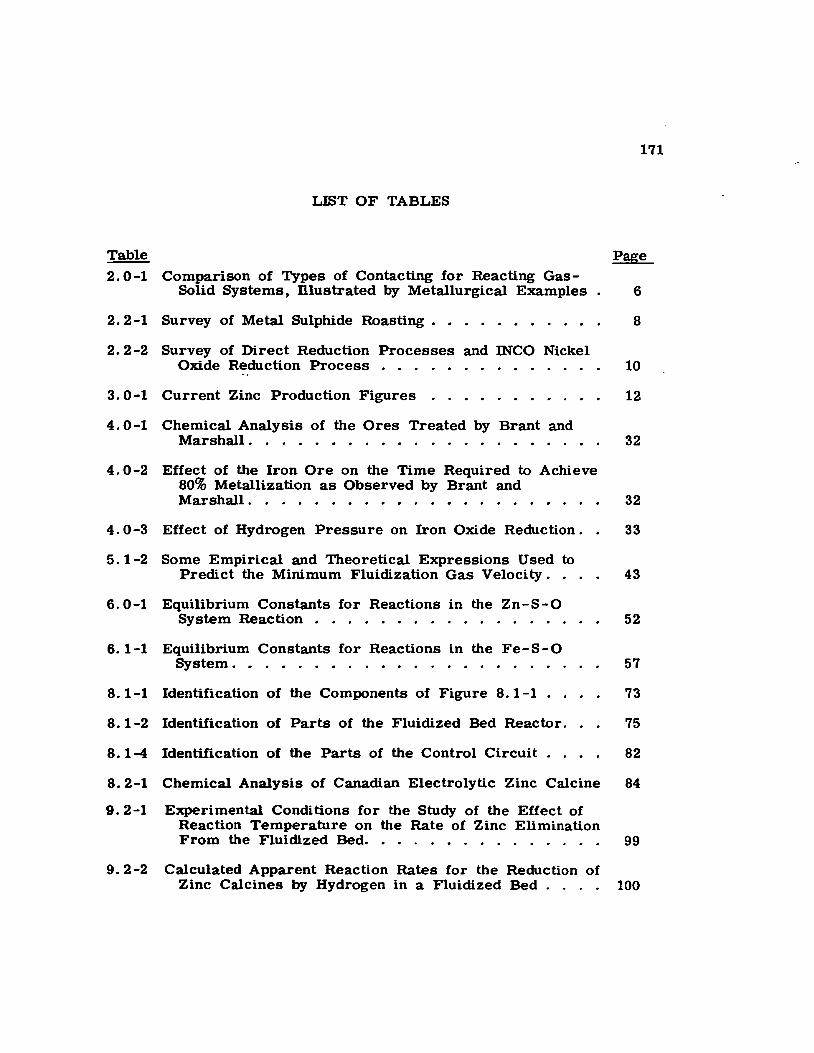
171
LIST OF TABLES
Table Page
2.0-1 Comparison of Types of Contacting for Reacting Gas-Solid Systems, nlustrated by Metallurgical Examples. 6
2.2-1 Survey of Metal Sulphide Roasting. • 8
2.2-2 Survey of Direct Reduction Processes and INCO Nickel Oxide Reduction Process . . . 10
3.0-1 Current Zinc Production Figures 12
4.0-1 Chemical Analysis of the Ores Treated by Brant and Marshall. . . . . . . . . . . . . . . . . . . . .. 32
4.0-2 Effect of the Iron Ore on the Time Required to Achieve 80% Metallization as Observed by Brant and Marshall. . . . . . . . . . . . . . . . . . . . .. 32
4.0-3 Effect of Hydrogen Pressure on Iron Oxide Reduction.. 33
5.1-2 Some Empirical and Theoretical Expressions Used to Predict the Minimum Fluidization Gas Velocity. . 43
6.0-1 Equilibrium Constants for Reactions in the Zn-S-Q System Reaction . . . . . . . . . . . . . . . . 52
6.1-1 Equilibrium Constants for Reactions in the Fe-S-Q System. • . . . . • . . . . . . . . . . . . . . 57
8.1-1 Identification of the Components of Figure 8.1-1 . . 73
8.1-2 Identüication of Parts of the Fluidized Bed Reactor. 75
8.1-4 Identification of the Parts of the Control Circuit 82
8.2-1 Chemical Analysis of Canadian Electrolytic Zinc Calcine 84
9.2-1 Experimental Conditions for the Study of the Effect of Reaction Temperature on the Rate of Zinc Elimination From the Fluidized Bed. . . . . . . . . . . . . .. 99
9.2-2 Calculated Apparent Reaction Rates for the Reduction of Zinc Calcines by Hydrogen in a Fluidized Bed. . . . 100

172
Table Page
9.2-3 Experimental Conditions for the Study of the Effect of Hydrogen Flowrate on the Rate of Zinc Elimina-tion From the Fluidized Bed. . . . . . . . . 103
9.3-1 Experimental Conditions and Calculated Values of the Hydrogen Efficiencies Obtained in This Study . . . 107
10.0-1 Comparison of the Reduction Temperatures and Melting Points of the Reaction Products for the Reduction of Metal Oxides in Fluidized Beds . . . . . . . . 114
10.4-1 Weight Percent of Calcine Appearing in Mesh Size Ranges Against Reaction Time. . . . . . . . . 130
10.4-2 Calculated KA Products for the Reduction Tempera-tures Studied . . . . . . . . . . . . . . . . . . 132
10.4-3 Comparison of DT1/DT2 and (KA)T1/(KA)T2
(Temperatures in oC) . . . . . .
10.4-4 Velocity Dependence of KA.
10.5-1 Operating Data for the Lurgi Turbulent Layer Fluidized
134
135
Bed Roasters at Canadian Electrolytic Zinc Limited 142
10. 5 -2 Scaled Down Parameters for a Fluidized Bed Roaster Capable of Producing 50 tpd of Zinc Oxide . 143
10.5-3 Estimation Data of the Plan Area Required for ZnO Reduction in a Fluidized Bed. . . . 144
10.5-4 Heat Data for znS Roasting at 10000C . . . . 147
10.5-5 Heat Data for Zn<> Reduction by Hydrogen at 10000C 149
10.5-6 Enthalpy Data for the Reduction of znO by Methane. 152

Figure
3.2-2
3.2-3
3.2-4
3.3-1
3.3-2
5.1-1
5.1-2
5.1-3
5.1-4
6.0-1
6.0-2
6.1-1
6.1-2
6.2-1
6.2-2
7.0-1
8.1-1
8.1-2
8.1-3
8.1-4
8.3-1
LIST OF FIGURES
Zinc Distillation Furnace. . . . . .
St. Joseph Electrothermie Furnace
Electrothermie Zinc Metal Furnace .
Imperial Smelti.ng Furnace . .
Lead-Zinc Phase Diagram
Typical Pressure Drop - Mass Flowrate Plot for a Fluidized Bed . . . . . . . • . . • . . . . .
Plot of Minimum Velocity vs Particle Diameter
Minimum Fluidizing Voidage vs Particle Diameter .
Plot of Minimum Fluidizing Gas Velocity vs Particle Size. . . . . . . . . . .
The Zn-S-O System
Stable Equilibria in the Zn-S-O System. .
The Fe-S-O System . . . . . . . . . . .
Stable Equilibria in the Fe-S-O System.
The Zn- Fe-S-O System . . . . . . . . .
Stable Equilibria in the Zn- Fe- S-O System .
Effect of Temperature on the Hydrogen Reduction of Zinc Oxide. . . . . . . . .
The Experimental Apparatus
Diagram of the Fluidized Bed Reactor.
Photographs of the Experimental Apparatus
Schematic Drawing of the Control Circuit .
Partic1e Size Distribution of the "As Recei ved" Zinc Calcine . . . . . . . . . . . . . . .
173
Page
15
19
20
22
24
39
42
45
47
53
56
59
60
62
63
69
74
76
78
83
86

Figure
9.1-1
9.2-1
9.2-2
9.2-4
9.2-5
9.3-1
9.3-2
10.0-1
10.41-2
10.1-1
10.2-1
10.3-1
10.3-2
10.3-3
10.4-1
10.4-2
10.4-3
10.4-4
174
Page
Photographs of Some of the Clinkers Obtained During the Reduction of Zinc Calcine . . . 93 to 96
Effect of Temperature on the % Zinc Elimination 101
Variation of the Apparent Reaction Rate with Temperature. . • . . . . . . . . . . . 102
Effect of Hydrogen Flowrate on the % Zinc Elimination. . . . . . . . . 104
Plot of Percentage Z.inc Elimination vs T ime for an Extended RuÎl . . . . • . . . . . . . . 105
Effect of Temperature on the Thermodynamic Efficiency . . . . . . . . . . . . . 108
Effect of Temperature on the Economic Efficiency 109
Equilibria in the Gaseous Reduction of Metal Oxides. • . . . . . . . . . • • . . • • • 112
Equilibria in the ZnO-H2 System at Low Tempera-tures (near the Melting Point of Zinc). . . .. 115
Effect of Temperature on the Maximum "Economic" HYdrogen Efficiency Attainable at Equilibrium. 119
Variation of the Apparent Rate with Temperature. 121
Debye-Scherrer X-Ray Pattern of "As Received" Zinc Calcine. . . . . . . • • . . . . . 126
Debye-Scherrer X-Ray Pattern of Partially Reduced Zinc Calcine. . . . . . . . . . 126
Debye-Scherrer X-Ray Pattern of Partially Reduced Zinc Calcine. . . . . . . . .
Variation of Reduction Rate with Time
Particle Size Variation with Time. . . .
Arrhenius Plot of LogI0 (KA) vs lIT.
Photomicrograph of a particle of the "As Received" Zinc Calcine. . • • • . . . . . . • • . . . .
126
128
131
133
138

Figure
10.4-5
10.4-6
10.5-1
10.5-2
10.5-3
10.5-4
Al
Photomicrograph of Zinc Calcine Particle after Six Hours' Reduction at 900oC. . . • . • • . •
Photomicrograph of Zinc Calcine Particles after Seventeen Hours' reduction at 8500 C . . • . • .
Proposed Integrated Fluidized Roaster BedReduction Bed Zinc Production Furnace. • .
Schematic Heat Balance for the Roasting of znS at 10000 C . . • . • . . . • . . . . • .
Schematic Heat Balance for the Reduction of Zinc Oxide by Hydrogen at 1000oC. . . .
Schematic Beat Balance for the Reduction of Zinc Oxide by Methane at 1000oC. . . . . . .
Diagram of the Low Temperature Fluidized Bed. .
175
Page
138
138
140
146
148
152
165

REFERENCES
1. Leva, M.: "Fluidization, n McGraw-Hill Book Company, Inc., New York, 1959.
2. Kunii, D., and Levenspiel, O.: "Fluidization Engineering," John Wiley & Sons, New York, 1969.
176
3. Heino, K. H., McAndrew, R. T., Ghatas, N. E., and Morrison, B. H. : paper presented to the A. 1. M. E. World Lead-Zinc Symposium, St. Louis, Mo., October 1970.
4. Roggero, C. E.: Trans. A. I. M. E., 227, pp. 105-11, 1963.
5. Newman, R. 1., LaVine, A. J.: paper presented at the First Operating Metallurgy Conference of the Metallurgical Society of the A. 1. M. E. , Pittsburgh, Pa., November 29 - December 3, 1q65.
6. Coolbaugh, W. E., and Neider, R. F.: paper presented at the First Operating Metallurgy Conference of the Metallurgical Society of the A. I. M. E., Pittsburgh, Pa., November 29 - December 3, 1965.
7. Natesan, K., and Philbrook, W.O.: Trans. A.I.M.E., Vol. 1, pp. 1353-1360, May 1970.
8. Mickley, H.S., and Trilling, C.A.: Ind. Eng. Chem., 41(6), pp. 1135-47, 1949.
9. Leva, M., Weintraub, M., and Grummer, M.: Chem. Eng. Prog., 45(9), pp. 563-72, 1949.
10. Kettenring, K. N., Manderfield, E. L., and Smith, J. M.: Chem. Eng. Prog., 46(3), pp. 139-45, 1950.
11. Mickley, H.S., and Fairbanks, D.F.: A.I. Ch.E. J., 1,374,1955.
12. Wamsley, W. W., and Johanson, L. N.: Chem. Eng. Prog., 50(7), pp. 347-55, 1954.
13. Wen, C., and Leva, M.: A. 1. Ch. E. J., 2(4), 482, 1956.
14. Wender, L., and Cooper, G. T. : A. I. Ch. E. J., 4(1), 15, 1958.
15. Frantz, J. F.: Chem. Eng. Prog., 57(7), pp. 35-42, 1961.

16. Lewis, W.K., Gilliland, E.R., and Girouard, H.: Chem. Eng. Prog. Symposium Series on Fluidization, Vol. 58, No. 38, pp. 87-97, 1962.
17. Resnick, W., and White, R. R.: Chem. Eng. Prog., 45(6), pp. 377-90, 1949.
18. McCune, L. K., and Wilhelm, R. H.: Ind. Eng. Chem., 41(6), pp. 1124-34, 1949.
19. Gilliland, E. R., and Mason, E. A.: Ind. Eng. Chem., 41(6), pp. 1191-96, 1949.
177
20. Curlook, W., and Roorda, H. J.: Trans. A. I. M. E., 64, pp. 122-26, 1961.
21. Blair, J. C.: paper presented to the First Operating Metallurgy Conference of the Metallurgical Society of the A. I. M. E. , Pittsburgh, Pa., November 29 - December 3, 1965.
22. Stephens, F. M. : Chem. Eng. Prog., 49(9), pp. 455 -58, 1953.
23. McGannon, H. E., Ed.: "Making, Shaping, and Treating of Steel, fi 8th edition, 1964, publication of the United States Steel Corporation.
24. Cronan, C. S.: Chem. Engrg., Vol. 67, pp. 64-5, April 1960.
25. Labine, R.A.: Chem. Engrg., Vol. 67, p. 96, February 1960.
26. Tomasicchio, G.: Proc. Intern. Symp. on Fluidization, Netherlands University Press, Amsterdam, 1967.
27. The International Nickel Company of Canada, Ltd.: private communication.
28. Mathewson, C.H.: "Zinc, the Science and Technology of the Metal, its A1loys and Compounds," Reinhold Publishing Corporation, New York.
29. Bray, J. L.: "Non-Ferrous Production Metallurgy," second edition, p. 486, John Wiley & Sons, Inc., New York, 1947.
30. Newton, J.: "Extractive Metallurgy," John Wiley & Sons, Inc., New York, 1963.
31. Bunce, E.H., and Handwerk, E.C.: Trans. A.I.M.E., 121, pp. 427-40, 1936.
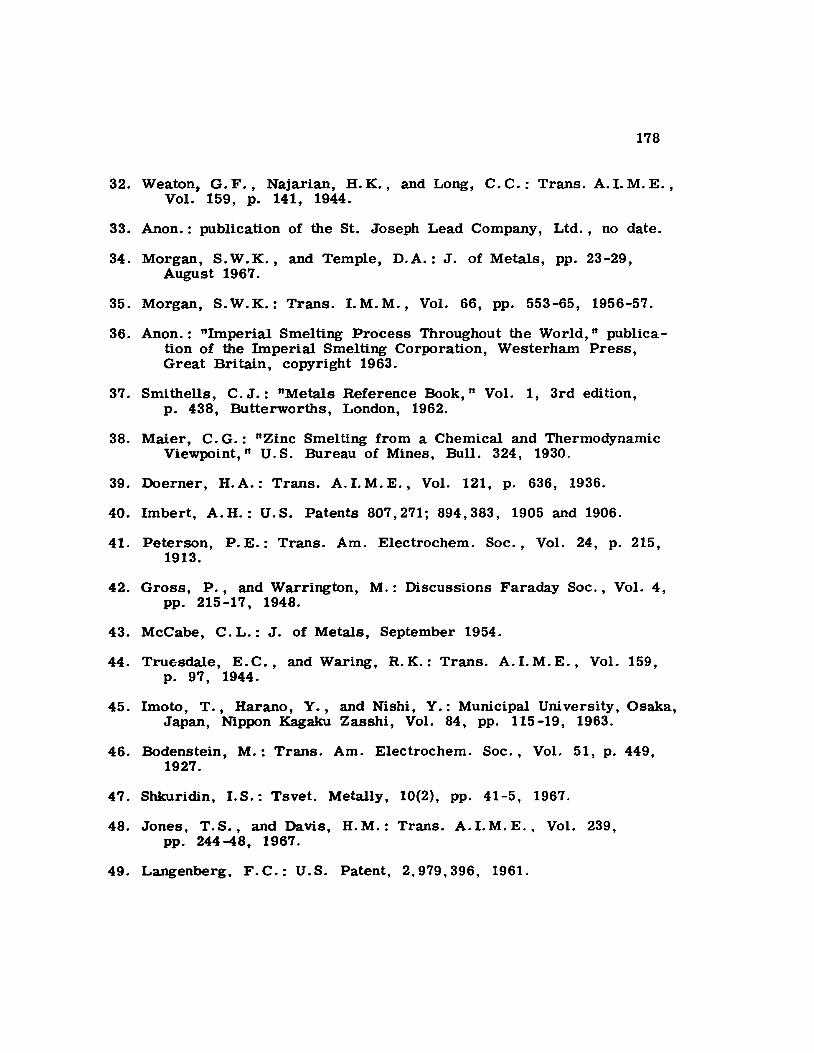
178
32. Weaton, G. F., Najarian, H. K., and Long, C. C.: Trans. A. 1. M. E. , Vol. 159, p. 141, 1944.
33. Anon.: publication of the St. Joseph Lead Company, Ltd., no date.
34. Morgan, S. W.K., and Temple, D.A.: J. of Metals, pp. 23-29, August 1967.
35. Morgan, S.W.K.: Trans. I.M.M., Vol. 66, pp. 553-65, 1956-57.
36. Anon.: "Imperial Smelting Process Throughout the World," publication of the Imperial Smelting Corporation, Westerham Press, Great Britain, copyright 1963.
37. Smithells, C. J.: "Metals Reference Book," Vol. 1, 3rd edition, p. 438, Butterworths, London, 1962.
38. Maier, C. G.: "Zinc Smelting from a Chemical and Thermodynamic Viewpoint," U. S. Bureau of Mines, Bull. 324, 1930.
39. Doerner, H.A.: Trans. A. I. M. E., Vol. 121, p. 636, 1936.
40. Imbert, A.H.: U.S. Patents 807,271; 894,383, 1905 and 1906.
41. Peterson, P. E.: Trans. Am. Electrochem. Soc., Vol. 24, p. 215, 1913.
42. Gross, P., and Warrington, M.: Discussions Faraday Soc., Vol. 4, pp. 215-17, 1948.
43. McCabe, C. L.: J. of Metals, September 1954.
44. Truesdale, E. C., and Waring, R. K.: Trans. A. I. M. E., Vol. 159, p. 97, 1944.
45. Imoto, T., Harano, Y., and Ni shi , Y.: Municipal University, Osaka, Japan, Nippon Kagaku Zasshi, Vol. 84, pp. 115-19, 1963.
46. Bodenstein, M.: Trans. Am. Electrochem. Soc., Vol. 51, p. 449, 1927.
47. Shkuridin, I.S.: Tsvet. Metally, 10(2), pp. 41-5, 1967.
48. Jones, T. S., and Davis, H. M.: Trans. A.!. M. E., Vol. 239, pp. 244-48, 1967.
49. Langenberg, F.C.: U.S. Patent, 2,979,396, 1961.

179
50. Brant, H. H., and Marshall, W. E.: "Physical Chemistry of Process Metallurgy," Part 2. An International Symposium held at Pittsburgh, Pa., April 27 - May 1, 1959. Interscience Publishers, New York.
51. Masonov, P. Ya., Vasil'ev, E.N., Lur'ye, I. L., and Knyazev, V. F.: Russian Mining and Metallurgy, September - October 1962.
52. Okura, A., and Lu, W -K.: Cano Metall. Quarterly, Vol. 8, p. 325, October - December 1969.
53. Frantz, J. F.: Chem. Eng. Prog. Symposium Series on Fluidization, Vol. 58, No. 38, 1962.
54. Miller, C.O., and Logwinuk, A.K.: Ind. Eng. Chem., Vol. 43, pp. 1220-1226, 1951.
55. van Heerden, G., Nobel, P., and van Krevelen, D. W.: Chem. Eng. Sei., 1(1), pp. 37 -49, 1951.
56. Johnson, E.: Inst. Gas Engrs., (London) Repts., publication No. 378/179, 1949-50.
57. Benner, R. L., and Kenworthy, H.: U.S. Bureau of Mines, Report of Investigations 6769, part 2, August 1965.
58. Ing rah am , T.R. and Kellogg, H.H.: Trans. A.I.M.E., 227, pp. 1419-25, 1963.
59. Hopkins, D. W.: Trans. Am. Electrochem. Soc., Vol. 96, No. 3, 1949.
60. Kato, Y. and Takei, T.: J. Electrochem. Soc., 17, p. 297, 1930.
61. Snurnikov, A. P., Larin, V. F., Margulis, E. V., and Krasavina, S. M.: Tsvet. Metally, 10(3), pp. 25 -8, 1966.
62. Wicks, C. E. and Block, F. E.: U. S. Bureau of Mines Bulletin 605, 1963.
63. Vavilov, N.S., Tsylev, L.M., and Ch'ung-Chih, C.: Russian Mining & Me~urgy, pp. 23-32, Jan.-Feb. 1962.
64. Kivnick, A., and Hixson, A. N.: Chem. Eng. Prog., Vol. 48, No. 8, pp. 394 -400, 1952.
65. Lewis. W.K., Gilliland, E.R., and Reed, W.A.: Ind. Engrg. Chem., 41(6), pp. 1227-37. 1949.
180
66. Wetherill, W. H., and Furnas, C. C.: Ind. Engrg. Chem., 26(4), pp. 983-991, 1934.
67. Strangway, P.K., and Ross, H. U.: Cano Metall. Quarterly, 5(3), 1966.
68. Seth, B. B. L., and Ross, H. U.: Cano Metall. Quarterly, 5(4), 1966.
69. Lu, W-K., and Bitsianes, G.: Cano Metall. Quarterly, 7(1), 1968.
70. Strangway, P. K., Lien, H.O., and Ross, H. U.: Cano Metall. Quarterly, 8(2), 1969.
71. Kubaschewski, O., and Evans, E. LI.: "Metallurgical Thermodynamics, n 3rd ed., Pergamon Press, London, 1958.