the fiscal management of compensation programs
TRANSCRIPT

Loyola University Chicago
From the SelectedWorks of Dow Scott
2005
The fiscal management of compensation programsDow Scott, Loyola University ChicagoT D McMullenR S Sperling
Available at: https://works.bepress.com/dow_scott/62/

13WorldatWork Journal third quarter 2005
Dow Scott, Ph.D.Loyola University Chicago
Thomas D. McMullenHay Group
Richard S. Sperling, CCPHay Group
The Fiscal Management ofCompensation Programs
Employee compensation is a major expenditure that can easily
represent anywhere from 20 percent to 30 percent of revenues in
manufacturing. In service industries it can reach 80 percent of
revenues (Henderson 2006). High labor costs create real competitive
challenges, such as those currently being experienced by United Airlines
and General Motors, among others. Thus it is not surprising that the fiscal
management of compensation programs is a key accountability criteria for
senior executives in most organizations. However, few research studies have
examined fiscal-compensation management practices and the effectiveness
of these practices. Using the “Fiscal Management of Compensation
Programs” survey conducted by WorldatWork, Hay Group and Loyola
University, the authors analyze the design, execution and governance of
compensation programs by focusing on several areas:
0 They identify the nature of control and influence that compensation
(or human resources), operations and finance have over compensation
program design, administration and control of expenditures within
the organization.
Contents ©2005 WorldatWork.The content is licensed for use by purchaserssolely for their own use and not for resale or redistribution. No part of this article may be reproduced, excerpted or redistributed in any form withoutexpress written permission of WorldatWork and appropriate attribution.Reach WorldatWork at 480/922-2020; [email protected]

0 They examine the degree of centralization in
the fiscal control of compensation programs (e.g.,
corporate level, business-unit level, line-manager level
or employee level). Of particular interest is the degree
of line-manager control and influence over exceptions
to company policy vs. the authorization required by
compensation or finance.
0 They determine whether separate guidelines,
practices and controls exist for different pay programs,
including authorization of base salary increases, and
variable pay eligibility and allocations.
0 They evaluate the effectiveness (as reported by
compensation managers) of the fiscal control methods
used to manage compensation programs — specifically,
the differences in fiscal compensation management
practices between Fortune’s “Most Admired Companies”
and peer companies.
MethodologyThe “Fiscal Management of Compensation Programs”
survey was administered to approximately 5,000
WorldatWork members through a Web link. The survey
opened in December and closed in February 2005. Hay
Group also sent a Web link encouraging its registered
Web-site users to complete the online survey during the
three-month period.
More than 600 compensation professionals,
typically managers or directors, completed the survey.
Seventy-two percent of the respondents represented
organizations with more than 1,000 employees.
(See Figure 1.) Respondents from only 8 percent of
the sample reported representing organizations with
fewer than 100 employees. Figure 2 shows the diversity
of the survey sample, which included respondents from
manufacturing (18 percent); finance and insurance (16
percent); health care and social assistance (10 percent);
and professional, scientific and technical services
(10 percent). Respondents were excluded from the
analysis if more than one manager responded for a
single organization (the highest-ranking manager was
retained) or if the organization reported it had fewer
than 10 employees.
The survey queried compensation managers about:
0 Their role in the compensation
fiscal-management process
14 WorldatWork Journal third quarter 2005
FIGURE 1 Company Size (Number of Employees) of Respondents
17%
8%
10%
15%
14%
15%
11%
10%
� >20,000� 0-100� 100-499� 500-999
� 1,000-2,499� 2,500-4,999� 5,000-9,999� 10,000-19,999
FIGURE 2 Industry Sector of Respondents
Manufacturing 18%
Finance and insurance 16%
Other 11%
Health care and social assistance 10%
Professional, scientific and technical services 10%
Educational services 5%
Public administration 5%
Other services 5%(except public administration)
Utilities 4%
Information 4%
Retail trade 3%
Transportation and warehousing 2%
Arts, entertainment and recreation 2%
Accommodations and food services 2%
Wholesale trade 1%
Mining 1%
Real estate and rental/leasing 1%

0 How compensation expenses were budgeted and
which fiscal-management tools were in place to
control this expense
0 Which pay and performance linkages were used to
distribute pay
0 The effectiveness of the fiscal management policies
and practices currently in place.
The survey instrument required approximately 20
to 30 minutes to complete. Because an organization may
have multiple compensation systems in place, compen-
sation managers were asked to respond to the survey
as it pertains to the managerial and professional
employee population in order to enhance comparability
across companies.
To provide a more thorough evaluation of
compensation fiscal-management practices, companies
identified by Fortune magazine as a “Most Admired
Company” were compared to a sample of similar-sized
companies that did not achieve this designation. The
Fortune “Most Admired Companies” survey is a highly
regarded annual analysis of corporate reputations by
Hay Group. More than 10,000 executives, directors and
industry analysts are involved in developing this ranking.
The survey invites respondents to rate companies,
overall and within industry groupings, on eight criteria
ranging from financial soundness and use of corporate
assets to quality of management and quality of
products and services.
Researchers used statistical T-tests to compare
responses between “Most Admired” and other companies,
and to compare the fiscal policies of compensation
programs that were rated effective, to those rated inef-
fective. All percentages at or above .5 are rounded up.
Research FindingsRole of Compensation and HR Managers
Compensation managers were asked to indicate their
type of involvement in the design, administration and
control of specific aspects of the compensation program
for professional and managerial employees. For each
attribute, they were asked to rate their influence on a
five-point scale consisting of the following levels:
0 Not involved
0 Provides information to management
0 Advises management
0 Shares decisions with management
0 Has primary accountability for the decision.
Findings show that relative to other leaders,
compensation managers have the most direct impact
and responsibility for designing pay structures, making
comparisons to market data, establishing the compen-
sation philosophy and setting compensation policies.
(See Figure 3.) In fact, most compensation managers
either share these design decisions with management or
have primary responsibility for their design. In contrast,
compensation managers have the least impact on
15WorldatWork Journal third quarter 2005
FIGURE 3 Compensation/HR Role in Program Design
Spot and recognition bonuses
Long-term variable pay
Short-term variable pay
Base salary increase budget
Pay structure
Market-comparison companies
Compensation policies
Compensation philosophy
Inform Advise Share Control

designing spot awards, recognition and long-term
variable pay programs. They are most likely to advise
management or share in the decisions associated with
those aspects of program design.
In addition, compensation managers are the primary
decision makers in the placement of jobs into grades or
the pay structure, according to the survey. (See Figure 4).
They also tend to have significant accountability
for administering market adjustments for hot skills,
making special pay-equity adjustments, and estab-
lishing eligibility and target payout levels for short-term
incentive programs (STI). Compensation managers
have the least amount of authority for the adminis-
tration of spot and recognition awards.
Compensation managers do not have as much
fiscal-management authority for monitoring and
controlling compensation expenditures. (See Figure 5).
The data indicate that compensation managers are
often in an advisory role to others in this regard —
most likely to finance, which is usually responsible
for controlling corporate expenditures.
The level of decision centralization is another
way to think about compensation-program control.
Figure 6 on page 17 shows that smaller organizations
tend to have more centralized control then larger
organizations. Interestingly, compensation managers
rate programs that are more centrally controlled as
less effective. In contrast, programs that are rated as
16 WorldatWork Journal third quarter 2005
FIGURE 4 Compensation/HR Role in Program Administration
Individual LTI awards
Individual LTI eligibility and targets
Individual STI awards
Individual STI eligibility and targets
Spot and recognition awards
Special pay-equity adjustments
Adjustments for key contributors
Hot skills/market adjustments
Individual promotional increases
Individual pay
Individual-employee pay rates
Placement of jobs in grades/structure
Inform Advise Share Control
FIGURE 5 Compensation/HR Role in Program Design
Spot and recognition award expenditures
LTI expenditures
STI expenditures
Base salary increase expenditures
Inform Advise Share Control
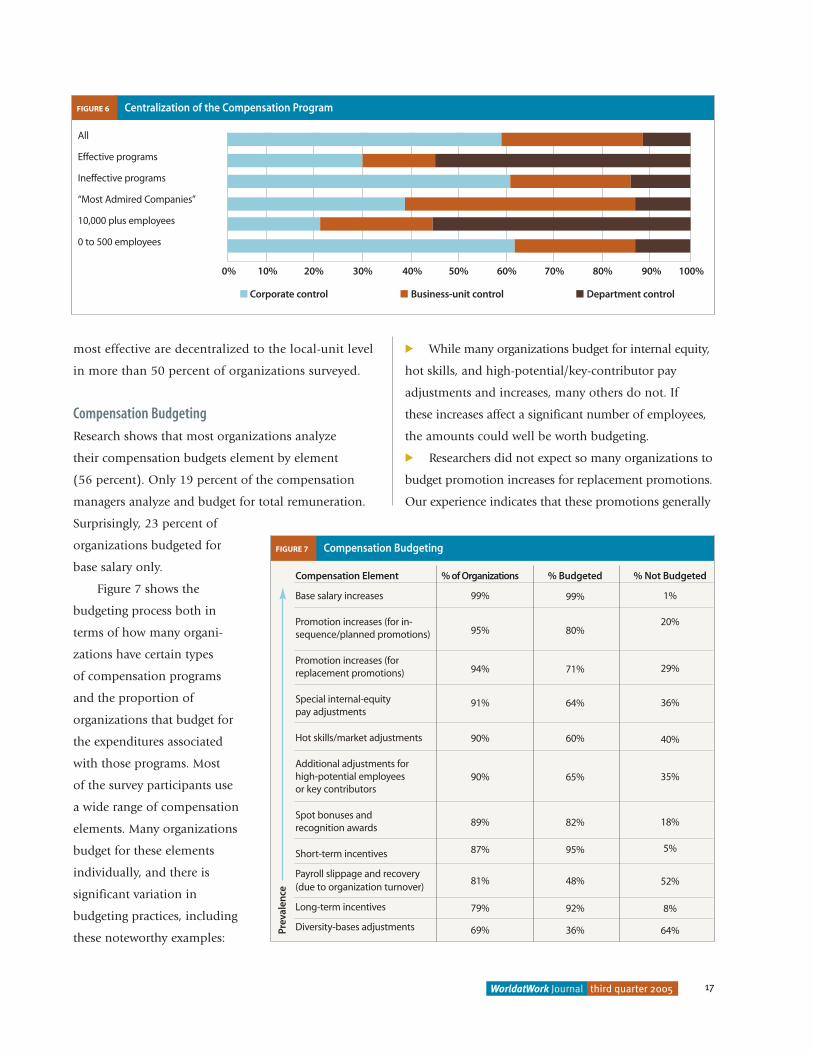
most effective are decentralized to the local-unit level
in more than 50 percent of organizations surveyed.
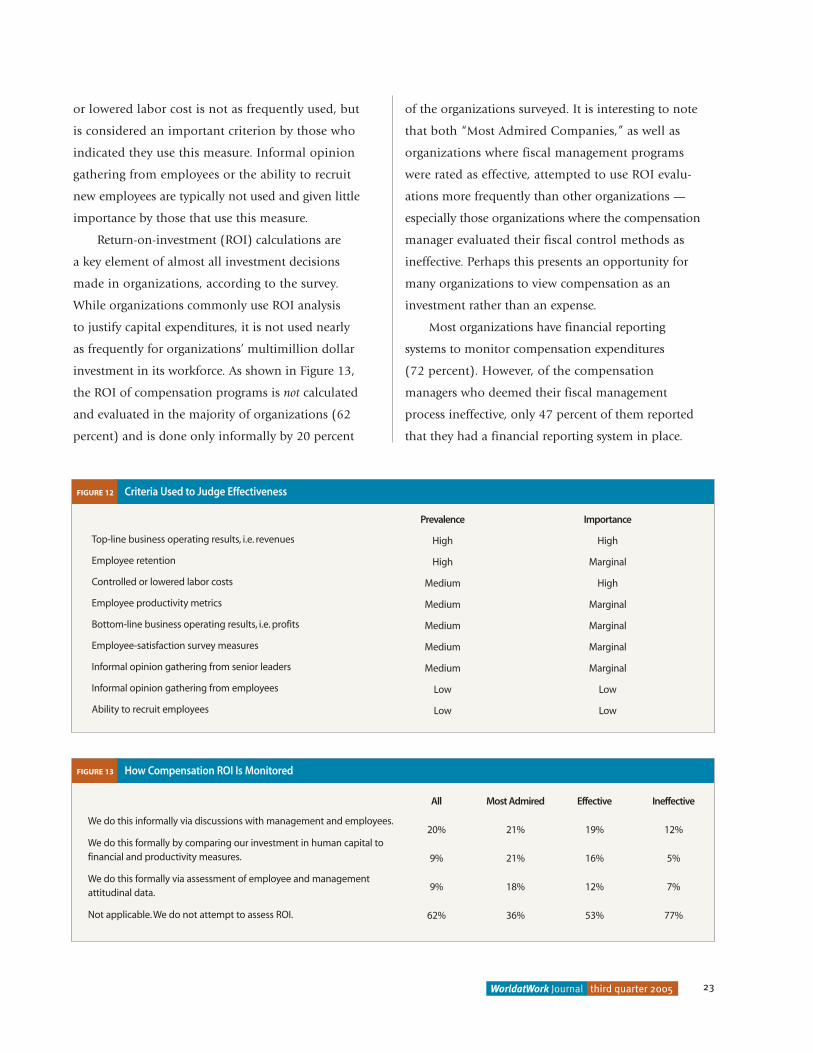
Compensation Budgeting
Research shows that most organizations analyze
their compensation budgets element by element
(56 percent). Only 19 percent of the compensation
managers analyze and budget for total remuneration.
Surprisingly, 23 percent of
organizations budgeted for
base salary only.
Figure 7 shows the
budgeting process both in
terms of how many organi-
zations have certain types
of compensation programs
and the proportion of
organizations that budget for
the expenditures associated
with those programs. Most
of the survey participants use
a wide range of compensation
elements. Many organizations
budget for these elements
individually, and there is
significant variation in
budgeting practices, including
these noteworthy examples:
0 While many organizations budget for internal equity,
hot skills, and high-potential/key-contributor pay
adjustments and increases, many others do not. If
these increases affect a significant number of employees,
the amounts could well be worth budgeting.
0 Researchers did not expect so many organizations to
budget promotion increases for replacement promotions.
Our experience indicates that these promotions generally
17WorldatWork Journal third quarter 2005
FIGURE 6 Centralization of the Compensation Program
All
Effective programs
Ineffective programs
“Most Admired Companies”
10,000 plus employees
0 to 500 employees
0% 10% 20% 30% 40% 50% 60% 70% 80% 90% 100%
� Corporate control � Business-unit control � Department control
FIGURE 7 Compensation Budgeting
Compensation Element
Base salary increases
Promotion increases (for in-sequence/planned promotions)
Promotion increases (forreplacement promotions)
Special internal-equity pay adjustments
Hot skills/market adjustments
Additional adjustments for high-potential employees or key contributors
Spot bonuses and recognition awards
Short-term incentives
Payroll slippage and recovery(due to organization turnover)
Long-term incentives
Diversity-bases adjustments
% of Organizations
99%
95%
94%
91%
90%
90%
89%
87%
81%
79%
69%
% Budgeted
99%
80%
71%
64%
60%
65%
82%
95%
48%
92%
36%
% Not Budgeted
1%
20%
29%
36%
40%
35%
18%
5%
52%
8%
64%Prev
alen
ce

do not add costs, as the replacements tend to be
paid less than the people they replace.
Past years’ surveys have indicated a decline in the
prevalence of budgeting for payroll recovery or slippage
(the difference between actual year-end pay and expected
year-end pay for a constant sample of jobs, which is
caused by a variety of factors such as promotions,
departures and new hires) though only anecdotally.
Despite this decline, it was surprising to find that 52
percent of participants do not budget for slippage. The
authors’ consulting experience suggests that slippage
can change payroll levels by as much as 1 percent.
Perhaps both the high prevalence of budgeting
for replacement promotions and the low prevalence
of budgeting for slippage reflect a new reality. Only 19
percent of participants report paying new incumbents
less than the people they replace, and 72 percent report
that actual salary-increase expenditures are approxi-
mately equal to budget. Organizations that report
having effective compensation planning and budgeting
processes do not show a higher prevalence of budgeting
for slippage. However, 41 percent say new incumbents
are paid less than the people they replace and 81
percent report expenditures being equal to budget.
These organizations seem to be finding ways to
identify and reallocate slippage, even though they
do not budget for it.
Another interesting phenomenon associated
with compensation budgeting is how organizations
handle savings that result from temporary vacancies.
Twenty-five percent of organizations use these savings
to reduce overall labor expenditures, 11 percent plan
for vacancies and include the savings in their budgets
and 14 percent allow managers to use the savings for
other purposes. (See Figure 8.) However, the survey
demonstrates that the most prevalent practice among
respondents (50 percent) is to have no consistent
policy for dealing with this type of savings. This is
a case where common practice does not equal best
practice. Organizations reporting effective compensation
planning and budgeting are much more likely to have
a consistent policy (61 percent) than those reporting
ineffective processes, of which only 37 percent have
a consistent policy.
Given the commitment of financial resources
associated with employee compensation, budgeting for
employee salaries and wages is important. As reported
by survey participants, the most important determinant
of how much an organization is going to budget for
salary increases is how much other organizations are
budgeting (i.e., labor-market movement). The organi-
zation’s ability to pay, its desired competitive position
in the labor market and its financial performance
represent a second tier of criteria — both in terms of
prevalence of use by organizations and in the level of
importance perceived by compensation managers. The
three criteria that were seldom used to determine base
pay increases and rated as having lower importance
were cost of living, employee turnover and employee
morale or satisfaction.
18 WorldatWork Journal third quarter 2005
FIGURE 8 Treatment of Savings When a Position Is not Filled When Budgeted
Reduces overall labor costs and credited as a labor saving
A standard amount of salary savings are calculated into the salarybudget (i.e. planning includes a certain number of unfilled positions.)
Business unit or operations can use the salary saving for other purposessuch as employee development, travel expenses, bonuses, etc.
No consistent policy
All
25%
11%
14%
50%
Not Effective
18%
5%
13%
63%
Effective
34%
17%
10%
39%

Base salary increase allocations are most often
based on either a combination of individual
performance and market position (56 percent) or
on performance only (30 percent). Only 12 percent
of organizations gives all employees the same raise,
sometimes called a “general increase;” 1 percent
determines increases based on competitive market
position alone; and 1 percent bases increases on
maturity curves or employee tenure.
Pay Structure
A total rewards philosophy suggests that rewards
should be considered as a whole, including total cash
compensation, employee benefits, desirability of the work
environment, and training and career-development
opportunities. While there is a great deal of attention
paid to total rewards approaches by the compensation
profession, survey results indicate that 80 percent of
organizations set their cash compensation targets based
only on the cash compensation marketplace, with no
consideration given to the value of benefits, perquisites,
work culture or training and development opportunities.
This suggests that organizations are largely ignoring the
notion of a total rewards model. Only 4 percent of the
organizations say they raise their compensation targets in
order to make up for a lower-than-desired competitive
position against their benefits, perquisites or work
environment. And 10 percent of the organizations say
they lower their compensation targets to offset higher-
than-desired competitive positions of their benefits,
perquisites or work environment.
Organizations follow a variety of strategies
in managing compensation within salary ranges.
Sixty-three percent of organizations allow salaries to
fall below the minimum pay range. These organizations
treat below-minimum salaries in a variety of ways.
Eighteen percent allow salaries below minimums
solely for performance reasons, 23 percent have a
policy to accelerate increases until salaries are within
the range and 21 percent allow managers to
determine the timeframe for moving salaries
above the minimum.
Ninety percent of organizations allow salaries
to exceed the maximum of the range. More than half
(51 percent) freeze salaries that exceed maximums
but give lump-sum merit payments or bonuses. Only
15 percent freeze salaries without lump sums. In 23
percent of organizations, salary increases are allowed
even when salaries exceed range maximums.
Although organizations use a number of criteria
for moving individual employees through the pay
range, performance versus job standards is reported
as both the most prevalent criterion and the most
important. Position in range (relative position in the
labor market) and performance relative to individual
objectives are used frequently, but are considered less
important criteria. Finally, time in the position and edu-
cation level seldom are used to move employees through
the range and are not considered to be important criteria.
In terms of fiscal compensation management,
managerial discretion in granting pay raises is an
19WorldatWork Journal third quarter 2005
The most importantdeterminant of how much anorganization is
going to budget forsalary increases is how much
other organizations are budgeting.

important issue. In 27 percent of the organizations
surveyed, line managers determine how to use market
references or compa-ratios to adjust pay. In 40 percent of
the organizations, there are formal guidelines regarding
market references or compa-ratios that the line manager
must consider when adjusting base pay. In 33 percent
of the organizations, market references or compa-ratios
largely determine how base pay should be adjusted,
with relatively limited managerial discretion.
Pay and Performance Linkages
Research indicates that employees often are skeptical
that better performance will lead to better compensation
(Hills 1987). According to Hay Insight’s global employee
opinion norms, 56 percent of employees do not agree
that better performance results in better pay. (Hay Group,
2005). According to previous data, numerous factors
lead to this skepticism among employees, including:
0 The relatively modest size of historic merit
increase budgets
0 Lack of clarity in compensation and pay-for-
performance objectives
0 Inadequate performance differentiation
0 The inadequate differentiation of rewards.
“Most Admired Companies,” however, do tend
to find a way to provide differentiation in rewards.
In a 2002 survey of WorldatWork members, results
show that Fortune’s “Most Admired Companies” were
more likely to differentiate base salary increases for
outstanding performers (typically a 2X differential vs. a
1.5X differential) than companies that did not receive
this distinction (Scott, McMullen, Wallace and Morajda
2004). Therefore, with a 4-percent merit-increase
budget, outstanding performers in a “Most Admired
Company” would average 8-percent increases, while
outstanding performers in a typical company would
average 6-percent increases.
One of the key reasons that many organizations
are having a difficult time in differentiating pay for
outstanding versus average performers is that they give
base salary increases to virtually all employees, which
quickly consumes the merit budget. The survey found
that 68 percent of organizations give increases to
between 95 percent and 100 percent of employees.
Moreover, 95 percent of organizations give at least
80 percent of employees within the organization
a salary increase.
The 2005 survey shows a striking difference in
how two hypothetical organizations might differentiate
pay for top performers. For example, Company A and
Company B both have a 4-percent base salary increase
budget. Company A provides an average 1.5X differ-
ential in base pay increase for outstanding performers
(as shown in the 2002 survey report) and gives 100
percent of the workforce a salary increase. In contrast,
Company B provides a 2X differential (in line with
“Most Admired Companies”) and provides increases
to 80 percent of the workforce. In this example,
Company A is able to give outstanding performers
a 6-percent pay increase while Company B can give
outstanding performers a 10-percent average increase.
Variable pay programs represent another key
compensation program linked to performance. The
funding of variable pay programs in large part indicates
20 WorldatWork Journal third quarter 2005
Research indicates that employees areoften skeptical thatbetter performancewill lead to better
compensation.

how costs are controlled within the organization:
0 Nineteen percent of the organizations used
discretionary funding, which was typically decided
by management at the end of the fiscal year.
0 Self-funded programs, typically financed through
reduced costs or increased revenues/profitability
(typically driven by formulas established in advance),
were used in 23 percent of the organizations.
0 In 35 percent of the organizations, a percentage
of payroll is used to fund variable pay expenditures.
0 Twenty-three percent of the respondents indicated
that this question was not applicable or that they used
a different method for budgeting variable pay.
To further ensure the fiscal management of variable
pay programs, the overwhelming majority of plans
make use of funding hurdles or triggers (84 percent),
such as a minimum level of organizational financial
performance before payouts occur. In addition, more
than 90 percent of organizations make use of caps
or maximums on variable pay plans that protect the
business in the case of significant variation in organi-
zation performance that may not be solely caused
by the actions of plan participants. While hurdles,
targets and caps can be effective tools in the fiscal man-
agement of variable pay programs, they also can make
the linkage between performance and pay less clear.
Figure 9 shows that a majority of the surveyed
organizations base variable pay allocations largely on
formulas (66 percent), but a noticeable minority use
highly discretionary allocation processes (13 percent).
The remaining 22 percent balance their use of payout
formulas and management discretion. “Most Admired
Companies” reported a greater use of management
discretion in allocating variable pay, while organi-
zations that view their fiscal management processes
as most effective relied more on formulas and allowed
less management discretion.
21WorldatWork Journal third quarter 2005
FIGURE 9 Variable Pay Allocation Processes
Variable pay program payouts are highly discretionary, and managementhas significant latitude in determining individual payouts.
Variable pay program payouts are generally balanced between formula and management discretion.
Variable pay program payouts are largely determined via a formula, butmanagement discretion may change an individual payout to some degree.
Variable pay program payouts are typically driven from a formula thatallows no management discretion in the individual payout.
All
13%
22%
41%
25%
Most Admired
16%
32%
32%
20%
Most Effective
9%
9%
52%
30%
Dis
cret
ion
While hurdles, targets and caps can be effective
tools in the fiscalmanagement of
variable payprograms, they also
can make the linkagebetween performance
and pay less clear.

Effectiveness of the Fiscal Management Process
Compensation managers generally believe that
compensation fiscal management processes are
indeed effective. Between 63 percent and 79 percent
of organizations rate their programs as effective, based
on budgeting and planning, administration and control,
the status of the compensation/finance partnership,
and the timeliness and accuracy of compensation infor-
mation. (See Figure 10.) However, methods used to
reduce compensation expenditures were not rated highly
by respondents. The strategy of not filling or delaying
the fulfillment of open positions was the only cost
reduction strategy that was widely used and effective;
whereas all other strategies were rated as marginally
effective. (See Figure 11.) This is likely due to the fact
that keeping positions open has the least impact on
current employees.
Researchers asked compensation managers how
they judged the effectiveness of the compensation fiscal
management process. Figure 12 on page 23 shows the
prevalence and relative importance of criteria used to
assess the effectiveness of the compensation program.
Respondents indicated that top-line business operating
results are the most prevalent criteria used to measure
effectiveness. They also rated top-line business results
as highly important. Employee retention is frequently
used as a criterion but is not afforded as much
importance as top-line operating results. Controlled
22 WorldatWork Journal third quarter 2005
FIGURE 11 Methods for Lowering Compensation Costs
Don’t fill or delay filling open positions
Reduce headcount
Outsource employee work
Offer retirement or severance bonuses
Reduce employee benefits
Delay pay increases
Substitute FT employees with PT employees
Freeze wages across the board
Freeze wages except in special cases
Encourage unpaid leaves of absence
Reduce pay across the board
Use selected employee pay reductions
Prevalence
High
High
Medium
Medium
Medium
Medium
Medium
Low
Low
Low
Low
Low
Effectiveness
Effective
Marginal
Marginal
Marginal
Marginal
Marginal
Marginal
Marginal
Marginal
Marginal
Marginal
Marginal
FIGURE 10 Treatment of Savings When a Position Is not Filled When Budgeted
Budgeting and planning process
Administration and control process
Role of human resources working with finance and management
Timeliness of compensation information
Accuracy of compensation information
Ineffective
6%
6%
6%
4%
3%
Marginal
26%
31%
27%
26%
18%
Effective
68%
63%
68%
70%
79%
or lowered labor cost is not as frequently used, but
is considered an important criterion by those who
indicated they use this measure. Informal opinion
gathering from employees or the ability to recruit
new employees are typically not used and given little
importance by those that use this measure.
Return-on-investment (ROI) calculations are
a key element of almost all investment decisions
made in organizations, according to the survey.
While organizations commonly use ROI analysis
to justify capital expenditures, it is not used nearly
as frequently for organizations’ multimillion dollar
investment in its workforce. As shown in Figure 13,
the ROI of compensation programs is not calculated
and evaluated in the majority of organizations (62
percent) and is done only informally by 20 percent
of the organizations surveyed. It is interesting to note
that both “Most Admired Companies,” as well as
organizations where fiscal management programs
were rated as effective, attempted to use ROI evalu-
ations more frequently than other organizations —
especially those organizations where the compensation
manager evaluated their fiscal control methods as
ineffective. Perhaps this presents an opportunity for
many organizations to view compensation as an
investment rather than an expense.
Most organizations have financial reporting
systems to monitor compensation expenditures
(72 percent). However, of the compensation
managers who deemed their fiscal management
process ineffective, only 47 percent of them reported
that they had a financial reporting system in place.
23WorldatWork Journal third quarter 2005
FIGURE 12 Criteria Used to Judge Effectiveness
Top-line business operating results, i.e. revenues
Employee retention
Controlled or lowered labor costs
Employee productivity metrics
Bottom-line business operating results, i.e. profits
Employee-satisfaction survey measures
Informal opinion gathering from senior leaders
Informal opinion gathering from employees
Ability to recruit employees
Prevalence
High
High
Medium
Medium
Medium
Medium
Medium
Low
Low
Importance
High
Marginal
High
Marginal
Marginal
Marginal
Marginal
Low
Low
FIGURE 13 How Compensation ROI Is Monitored
We do this informally via discussions with management and employees.
We do this formally by comparing our investment in human capital to financial and productivity measures.
We do this formally via assessment of employee and management attitudinal data.
Not applicable.We do not attempt to assess ROI.
All
20%
9%
9%
62%
Most Admired
21%
21%
18%
36%
Effective
19%
16%
12%
53%
Ineffective
12%
5%
7%
77%

24 WorldatWork Journal third quarter 2005
Compensation expenditures were monitored monthly
by 51 percent of the organizations studied, quarterly
by 21 percent, annually by 16 percent, only as
needed by 9 percent and not at all by 2 percent.
Conclusions and Recommendations
The “Fiscal Management of Compensation” survey
found that practices vary widely among those surveyed.
However, different practices are not equally effective,
and in some cases indicate that organizations have
insufficient fiscal management tools in place. Results
further indicate that compensation managers have
a major role in designing and administering compen-
sation programs. However, the finance function also
plays a major role, especially in terms of monitoring
and controlling compensation expenditures.
Most surprising is that not all organizations
are budgeting for all elements of their compensation
programs, or monitoring these costs frequently. In
addition, pay ranges seem to be surprisingly porous —
and pay ranges and compa-ratios seemingly would be
the first line of defense in managing compensation
decisions and allocating scarce funding most effectively.
Finally, most compensation managers consider
their fiscal management policies and practices to
be effective. However, the data indicates that fiscal
management pay systems may be incomplete given
how infrequently compensation managers use ROI
calculation to control compensation-program costs.
Based on these findings, compensation
managers could significantly enhance the effectiveness
of their compensation programs if they integrated
these suggestions:
0 Use the notion of “total rewards” or at least
total remuneration to compare compensation programs
with those of other organizations.
0 Review how compensation budgets are calculated
and reported, determine which expenditures are
significant and variable for their organizations,
and budget for them.
0 Increase the pay differentiation between
employees who are average and outstanding per-
formers. Carefully consider whether targets, hurdles
and caps are necessary.
0 Consider the use of ROI in developing and
communicating compensation budgets.
0 Consider how slippage affects the total compen-
sation budget and may hinder the accomplishment of
compensation goals.
0 Carefully consider the use of salary ranges and
manage compensation costs. Determine how to handle
exceptions.
Not all organizations
are budgeting for all elements of
their compensationprograms, or
monitoring these costs frequently.

Authors’ Note: The authors would like to recognize the
contributions of Marc J. Wallace, III, Vasu Mirmira and
Dennis Morajda to this research.
Editor’s Note: The “Fiscal Management of
Compensation” survey is available to WorldatWork
members at no cost. To obtain your copy, go to
www.worldatwork.org and click on “Library,”
then “Surveys/Research.”
25WorldatWork Journal third quarter 2005
Resources PlusFor more information related to this article:Go to www.worldatwork.org/advancedsearch and type in this key wordstring on the search line:
• Compensation Costs.Go to www.worldatwork.org/bookstore for:
• Determining Compensation Costs: An Approach to Estimating and Analyzing Expense.
Go to www.worldatwork.org/certification for:• C4: Base Pay Management.
ReferencesHay Group.“Hay Insight’s Employee Survey Benchmark Report, 2005 Edition (forthcoming.)
Hills, F.S., Scott, K.D., Markham, S.E.and Vest, M.J. (1987).“Merit pay: Just or unjust desserts.”Personnel Administrator, 32 (9), 52-59.
Henderson, R. I. (2003).Compensation Management in a Knowledge-Based World.Upper Saddle River NJ: Pearson – Prentice Hall.
Scott, K.D., McMullen,T.D.,Wallace M.and Morajda, D.(2004).“Annual Cash Incentives for Managerial and Professional Employees.” WorldatWork Journal.13(4), 6-15.
AuthorDow Scott, Ph.D. ([email protected]) is a professor of human resources in the School ofBusiness Administration at Loyola University Chicago. His practical approaches to teach-ing, research and consulting focus on helping business leaders create more productiveand satisfying work environments. He has been published in more than 100 journals,books and conference proceedings; and received national recognition for team/produc-tivity improvement and HR research. Scott’s research and consulting have focused onemployee retention, creation of effective teams, performance-improvement strategies,pay and incentive systems, evaluation of HR programs and the development of high-performance organizations.
Thomas D. McMullen ([email protected]) is a senior consultant andMidwest Reward practice leader in the Chicago office of Hay Management Consultants.He has more than 20 years of combined HR practitioner and compensation consultingexperience. His work focuses primarily on total rewards and performance programdesign, including rewards strategy development, incentive plan design, employee pay and job evaluation.
Prior to joining Hay, McMullen was in senior compensation roles with Kentucky FriedChicken Corp. and Humana Inc. He holds a master’s degree in business administrationand a bachelor’s degree in mathematics from the University of Louisville.
Richard S. Sperling, CCP ([email protected]) is a senior consultant in the Chicago office of Hay Group. He works with clients to design and value jobs, buildeffective organization structures, and develop and implement reward systems. He hasdesigned leading-edge approaches to analyzing, understanding, designing and valuingwork in clients’ increasingly complex and varied organizational settings.
Prior to joining Hay Group in 1981, Sperling worked for Ford Motor Co. in a variety of HR positions. He holds a bachelor’s degree in science from Yale University and a master’s degree in management from Northwestern University.