the fiscal impacts of the st. paul houses to homes program · 2010-09-13 · the fiscal impacts of...
TRANSCRIPT

February 1997
The fiscal impacts of the St. Paul HOUSES TO HOMES program
Edward G. Goetz Kristin Cooper
Bret Thiele Hin Kin Lam
Neighborhood Planning for Community Revitalization
Center for Urban and Regional Affairs University of Minnesota

The fiscal impacts of the St. Paul HOUSES TO HOMES program
by
Edward G. Goetz Kristin Cooper
Bret Thiele Hin Kin Lam
Neighborhood Planning for Community Revitalization
Center for Urban and Regional Affairs University of Minnesota
February 1997

I. INTRODUCTION _____________________________________________________1
THE VACANT HOUSING PROBLEM ________________________________________ 1
THE HOUSES TO HOMES PROGRAM _______________________________________ 4
COMPARABLE PROGRAMS________________________________________________ 6
II. PROGRAM COSTS & BENEFITS _____________________________________11
METHODS _______________________________________________________________ 11
Costs of Vacant Housing in St. Paul___________________________________________ 12
FINDINGS _______________________________________________________________ 15 Direct property value benefit ______________________________________________________ 15 Indirect property value benefit _____________________________________________________ 16 Spillover investment benefits ______________________________________________________ 20 Additional rehabilitation benefits - sales tax revenue ___________________________________ 23 Property maintenance costs _______________________________________________________ 25 Police Costs ____________________________________________________________________ 27 Foreclosure losses_______________________________________________________________ 28
III. CONCLUSION_____________________________________________________32
REFERENCES ________________________________________________________35

1
I. INTRODUCTION As urban areas continue to grow outward, neighborhoods in the central cities are often faced with increased concentrations of low-income residents, and therefore lower property values and vacant housing. While market forces generate housing rehabilitation and reoccupation in other areas of the city, in low income, inner-city communities, the market generates little private investment. In many cities, it is left to the public sector to respond with programs that fund vacant housing rehabilitation. St. Paul, Minnesota has one such program is called Houses to Homes. The program provides funds to fill the gap between renovation costs and sales prices for single-family homes and multiplex renovations to single-family use. Houses to Homes also funds demolition of substandard housing and new construction of owner-occupied, single-family homes on vacant lots. This report presents an analysis of the fiscal impacts of Houses to Homes. We compare the benefits and costs of three separate dispositions to vacated houses in St. Paul; rehabilitation, demolition, or private market reoccupation. In the first section of the report, we briefly summarize the vacant housing problem in St. Paul. In addition, we describe the Houses to Homes program, how it works, and what it has accomplished since 1991. We also briefly compare the St. Paul response to vacant homes with programs created in other, comparable cities. In the second part of the report we present the findings of our analysis of the fiscal effects of Houses to Homes.
THE VACANT HOUSING PROBLEM There are approximately 475 vacant houses on the city’s official vacant housing
list at any given time and an additional 100 vacant houses which either go unreported or are secured and maintained, and therefore do not make it to the list. From 1991 to 1995, 1755 vacant properties were tracked by the city. These figures compare favorably to other mid-sized American cities, as shown in table 1.
A study of housing conditions in ten comparable cities compiled by St. Paul Planning and Economic Development (PED) from 1990 Census data showed St. Paul had the lowest board-up rate and the least change in board-up rate from 1980 to 1990.

2
TABLE 1: COMPARISON CITIES BOARD-UP RATE AND CHANGE
CITY BOARD-UP RATE 1980-1990 CHANGE St. Paul 0.2% + 0.1% Portland 0.3% + 0.2% Minneapolis 0.4% + 0.3% Milwaukee 0.6% + 0.5% Tacoma 0.6% + 0.5% Cincinnati 0.7% + 0.1% Denver 0.8% + 0.7% St. Petersburg 1.0% + 0.9% Pittsburgh 1.3% + 0.7% Fort Worth 1.8% + 1.5%
Source: “Working Paper: How Does Saint Paul Compare? -- Economic Trends in the 1980s,” St. Paul Planning and Economic Development, 1993.
While the number of vacant houses is not high in contrast to other cities, Map 1
shows that the vacant buildings are concentrated within the lower-income neighborhoods in the city, thereby intensifying their impact. MAP 1: HOUSES TO HOMES PROJECTS 1991-1995
[MAP]
Source: St. Paul Planning and Economic Development.
3
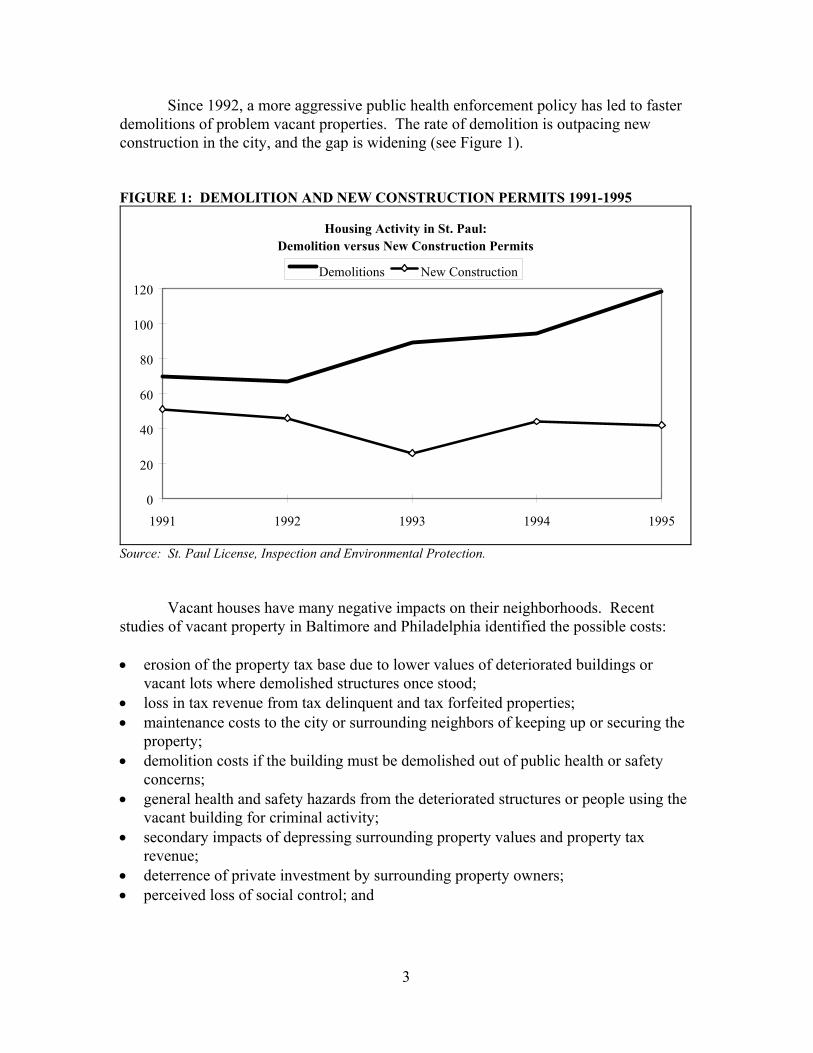
Since 1992, a more aggressive public health enforcement policy has led to faster demolitions of problem vacant properties. The rate of demolition is outpacing new construction in the city, and the gap is widening (see Figure 1). FIGURE 1: DEMOLITION AND NEW CONSTRUCTION PERMITS 1991-1995
Housing Activity in St. Paul:Demolition versus New Construction Permits
0
20
40
60
80
100
120
1991 1992 1993 1994 1995
Demolitions New Construction
Source: St. Paul License, Inspection and Environmental Protection.
Vacant houses have many negative impacts on their neighborhoods. Recent studies of vacant property in Baltimore and Philadelphia identified the possible costs:
• erosion of the property tax base due to lower values of deteriorated buildings or
vacant lots where demolished structures once stood; • loss in tax revenue from tax delinquent and tax forfeited properties; • maintenance costs to the city or surrounding neighbors of keeping up or securing the
property; • demolition costs if the building must be demolished out of public health or safety
concerns; • general health and safety hazards from the deteriorated structures or people using the
vacant building for criminal activity; • secondary impacts of depressing surrounding property values and property tax
revenue; • deterrence of private investment by surrounding property owners; • perceived loss of social control; and

4
• harm the overall physical appearance of the neighborhood and its attractiveness as a place to live.1
Concern about these impacts has contributed to the call for public sector
intervention in the rehabilitation of vacant houses.
THE HOUSES TO HOMES PROGRAM
The Houses to Homes program began in 1991 with the convergence of several forces.2 In the St. Paul Planning and Economic Development Department there was a deputy director of neighborhoods and housing who is credited with being “responsible for some of the city’s most innovative housing projects,”3 including Houses to Homes and the Middle Income Housing Fund. The staff within the division were looking at housing trends, including the results of the 1990 Census which showed increasing middle class flight from the city. They projected that the city’s vacant housing inventory, which numbered over 600 units, would increase to over 1,000 if nothing was done.
The mayor at the time was a neighborhood and community development advocate who focused his efforts on housing. The city was home to a local branch of the Local Initiatives Support Corporation (LISC), a national nonprofit corporation that funds affordable housing development. LISC came to St. Paul in 1988, and by the early 1990s was working on capacity-building with St. Paul neighborhood-based community development corporations (CDCs). LISC was also seeking city commitment for rehabilitating housing to leverage $2.35 million in funds from national foundations. The proposal included creating homeownership opportunities in the city through the rehabilitation of vacant housing by non-profit CDC’s.4 At the same time, city officials were trying to deal with its growing housing abandonment problem while simultaneously attempting to boost the rate of homeownership in the city.
1 Philadelphia City Planning Commission. Vacant Land in Philadelphia: A Report on Vacant Land Management and Neighborhood Restructuring, Philadelphia, June 1995 and University of Maryland Community Planning Studio. Issues and Recommendations on Vacant Property in Baltimore, Baltimore, Fall 1995. 2 Information presented in this section is the result of a conversation with Gloria Bostrom, former deputy director of neighborhoods and housing, 25 July 1996 and St. Paul Planning and Economic Development, Houses to Homes: Saint Paul Vacant Housing Strategy for the 1990s. St. Paul, February 1991, except where otherwise indicated. 3 “Planning official leaves a legacy of innovative city housing programs.” St. Paul Pioneer Press, 5 January 1995. 4 Paul Fate, LISC Program Director, letter to Dan Cornejo, St. Paul Planning and Economic Development Director, 8 February 1991.

5
In Minnesota, homesteaded property can be tax delinquent for five years before the state takes title (this period was shortened to two years for properties in URAP-targeted areas in 1993). After the state takes ownership of the property, it may be another year before the property is put up for tax auction. The length of time required to take ownership of the property and the amount of additional deterioration which might occur during this period is a major frustration for officials implementing a vacant housing rehabilitation program. Other vacant houses might be HUD-foreclosed properties which, because of their condition or the condition of the surrounding neighborhood, are slow to reach the market or to sell.
By creatively combining funds from a variety of city budgets dedicated to housing rehabilitation, staff were able to put together a pot of $1.5 million to be dedicated to financing the gap between the cost to acquire and rehabilitate vacant properties and their final market value. Much discussion surrounded the level at which the gap subsidies should be set. Following consideration of what the program hoped to accomplish, the subsidy level was set at $40,000 for rehabilitation of single-family vacant houses and $65,000 for rehabilitation and conversion of multi-family units to single-family structures. There was initial dissension about setting the subsidy level that high, but members of the committee felt that the program ought to create high quality housing in order to attract middle income people to the city and preserve historic structures.
With the mayor’s support, the program was approved by the city council and went into effect in 1991 with much fanfare in the local newspaper.5 Since 1991, 232 houses have been rehabilitated, 320 have been demolished, 34 vacant lots were built upon and 1,169 vacant homes were reoccupied through the private market.6
How the program works
Houses to Homes guidelines list the following program objectives:
• to better coordinate and focus City actions through code enforcement, rehabilitation and demolition to address vacant buildings/houses;
• to contribute to revitalization and stabilization of neighborhoods; • to increase homeownership opportunities; • to save existing housing stock, where feasible; • to recapture and improve the City’s tax base; and • to encourage private/public/community partnership centered around homeownership
and other neighborhood revitalization efforts.7
5 “St. Paul Gets $2.3 Million Housing Grant.” St. Paul Pioneer Press, 28 February 1991 and “Couple gets first home through city program to repair vacant houses.” St. Paul Pioneer Press, 24 August 1991. 6 These figures include projects using city assistance through Houses to Homes gap financing, technical advice or other financing. 7 St. Paul Planning and Economic Development, Houses to Homes Vacant House Assistance Program: Guidelines Overview. St. Paul, 1991.

6
The program provides gap subsidies as outlined above to non-profit or for-profit developers or prospective homeowners to fix up vacant houses which require moderate to substantial rehabilitation and are contributing to neighborhood blight. Homeowners must meet certain income criteria depending on the source of funds used for the gap financing. Gap financing can be used for acquisition, title and closing costs; construction and contingency funding; and carrying costs, resale closing costs, interim financing fees, marketing, design and developer fees. Rehabilitation is expected to go beyond simple compliance with city code requirements to make the properties marketable into the future. Certain regulatory requirements must also be met because public sector funding is involved. These include installation of a sprinkler system if the property is more than 50 percent gutted,8 lead paint and asbestos removal, replacement of lead water line service, and installation of windows meeting the Uniform Building Code when required. Program guidelines also allow for the Housing and Redevelopment Authority to grant waivers to the subsidy levels for “special historical or architectural treatment or a demonstrated public purpose.”9
COMPARABLE PROGRAMS Urban Homesteading
Urban Homesteading programs emerged in the early 1970’s as part of the country’s urban core neighborhoods suffered from blight and abandonment. Programs originated in east coast cities, where eligible would-be homeowners were offered tax-forfeited vacant properties owned by the city. In exchange for the property title, homeowners agreed to fix up the property, using “sweat equity” for the work they could perform themselves and federal rehabilitation loans for work requiring professional assistance. The federal government picked up on the success of the local programs and started the Urban Homesteading Demonstration Program in 1973.10 The program was very popular among legislators and the national press, particularly because of the imagery of hard-working homeowners taming a new frontier much like earlier generations conquered the West by developing land in exchange for title.11
8 According to a Met Council report, this is city requirement not found in other cities in Minnesota and seldom used nationwide. It was passed by the City Council with the support of the fire and department, plumbers and fire suppression unions with the belief that it is relatively inexpensive to install sprinklers when rehabilitation is taking place and that installation might result in lower insurance costs. The study quoted city staff estimating that installing sprinkler systems could add as much as $4-6 per square foot to the rehabilitation and also found that few insurance companies offer discounts for buildings with sprinkler systems. (Metropolitan Council, Housing Redevelopment and Rehabilitation in the Twin Cities Metropolitan Area: Three Case Studies. St. Paul, November 1995, 35. 9 St. Paul Planning and Economic Development. 10 U.S. General Accounting Office, Urban Homesteading: A Good Program Needing Improvement (Washington, D.C., GPO, 1979). 11 Mittie Olion Chandler, Urban Homesteading: Programs and Policies (Greenwood Press, Westport, 1988).

7
The demonstration program turned into a permanent program and was later expanded to include more cities nationwide. The program required that prospective homeowners be low- to moderate-income and in need of improved housing. It also required that they be able to complete the repairs required or be able to contract and pay for the work to be done. However, the main focus of the program was never to supply affordable homeownership opportunities so much as to occupy and rehabilitate vacant houses in distressed areas and thereby remove blighting influences in the neighborhoods, generate spin-off investments by other homeowners and promote the revitalization of urban core neighborhoods.12
Though popular in many circles, the program also generated criticism. Questions
arose about whether the right properties and homeowners were being selected and whether the program was generating any spin-off private investment or neighborhood revitalization.
Instructions for choosing properties outlined in a HUD guide for local Urban
Homesteading officials illustrate these tensions: “This decision involves both practical and political considerations. The properties should not be so seriously deteriorated that the cost of rehabilitation is beyond the means of lower- or moderate-income homesteaders. At the same time, homesteading could be viewed as a giveaway program if properties required little or no repair, inviting political criticism of the program.”13
Analysis of the data collected from the demonstration program also pointed to
issues surrounding the measurement of the program’s success. One author found that the racial composition of the neighborhood and the larger housing market dynamics had a larger impact on the overall economic health of the area and private investment decisions.14 City programs
A closer look at programs to rehabilitate vacant housing in mid-sized American cities revealed different approaches to working with non-profit CDCs and vacant housing. Table 2 presents a summary of the program characteristics in eight comparable cities. 12 U.S. General Accounting Office. 13 U.S. Department of Housing and Urban Development. Urban Homesteading: A Guide for Local Officials. (Washington, D.C., GPO, 1987), 3. 14 David Varady, Neighborhood Upgrading: A Realistic Assessment (Albany: State University of New York, 1986).

8
Property Acquisition
Many options are available to a city in acquiring vacant property. Each has advantages and disadvantages in terms of the amount of time required to acquire the property and the cost. Indianapolis has used eminent domain to acquire properties for non-profit rehabilitation. It does this by creating a “redevelopment area” and then working with the non-profit developers and neighborhood residents to identify problem properties for acquisition. Funds expended by the city in acquiring the property may lower the amount of remaining subsidy available for rehabilitation.
Indianapolis also uses a receivership process when the owner of vacant land
cannot be located. In this scenario, the city goes to court to have a non-profit developer named as receiver of the property to transfer ownership. If the owner resurfaces, the cost of any work completed on the project must be reimbursed before ownership is reclaimed. 15
In Hartford, the city typically obtains the property through foreclosure or bank donation. If the city purchases the property it generally costs less than $20,000. In St. Louis, properties rehabilitated by non-profit developers are all owned by the city (as opposed to HUD). They are properties transferred to the city by the tax forfeiture process or through condemnation and are sold to the non-profit developers for a nominal price.16
In Cincinnati, the city acquires properties through tax sale or buys them from
HUD. They then sell the properties to the CDC’s at the same price. The purpose of city intervention is to avoid problems with transfer of title.17 Subsidy Levels
As the method and cost of acquisition differs between cities, so does the overall
gap subsidy level. Other cities generally do not have stated subsidy caps, but evaluate projects on a case-by-case basis. The levels of subsidies are the targets of political pressure in cities outside of St. Paul. In St. Louis decisions on the disposition of vacant property depend to some degree by ward on the preference of the alderman. Attempts are made there to keep subsidy levels under $40,000 for single family homes, but that amount has come under criticism from people who prefer down payment assistance and moderate rehabilitation programs.18
Indianapolis is in the process of trying to set limits for rehabilitation costs. Staff
is looking at both per unit limits and limits in costs per square foot. Typical gap subsidies at present are approximately $15,000, but reductions in federal funding to the
15 Sheri Kohlmeyer, Indianapolis Division of Economic and Housing Development, telephone conversation with author, 2 July 1996. 16 Rick Bonnish, St. Louis Community Development Agency, telephone conversation with author, 2 July 1996. 17 Sara Martin, Cincinnati Department of Neighborhood Services, telephone conversation with author, 3 July 1996. 18 Bonnish.

9
city may impact that figure.19 In Cincinnati, on the other hand, a decision was made to avoid doing houses which could not be sold at a price to cover acquisition and rehabilitation costs.20 In Milwaukee the city limits project subsidies to $15,000 but this does not include the purchase price of the properties. Other program features Most of the cities utilize federal Community Development Block Grant (CDBG) funds, as well as funds from HUD’s HOME program. Only two cities, Hartford and Portland use state funds. As a result, the programs have income limits for the participants who purchase the rehabilitated homes, though these limits vary from city to city. Finally, virtually all of the programs provide homeownership counseling to program participants and they typically require the purchasers to remain in the house for at least five years after purchasing the home. Market Corrections
One of the most powerful tools for dealing with vacant housing may well be a
strong housing market. Both Denver and Portland used various strategies based on federal funding to rehabilitate vacant housing in the past, but have scaled back efforts as the private market demand for housing increased.21 Cities may not be able to control the private housing markets or direct population growth within their borders, but recognizing the importance of regional growth patterns and growth controls offers an opportunity for input. The demand for housing near the urban core, particularly in Portland, may be due to tight control of the urban growth boundary in that region.
19 Kohlmeyer. 20 Martin. 21 David Sweet, Portland Buildings Bureau, telephone conversation with author, 3 July 1996 and Susan Spinnel, Denver Community Development Housing Section, letter to author, 14 June 1996.

10
Table 2: Vacant housing programs in comparable cities. City Funding
Source Subsidy Mechanism
Acquisition Process
Subsidy Limits
Average Subsidy Amount
Income Limits
CDCs Involved
Coun- seling?
Occupancy Req.s?
Hartford CDBG, State of CT., sweat equity
Fee simple, transfer property, 1st & 2nd mortgages
Tax foreclosure, HUD/VA fore-closure, dona-tion, purchase
$1 sales price, mortgage base on rehab
- Yes, & 1st time home-buyers
No Yes 5 years
Milwaukee CDBG, HOME Construction loan & 1st mortgage
Purchase $15,000 per unit $14,000 per unit
Yes, 80% of median
Yes Yes 5 years
Indianapolis HOME Fee simple, 1st mortgage
Land utilization
$15,000 plus acquisition
Yes Yes Yes 5 years
St. Louis HOME Fee simple, 1st mortgage
Tax foreclosure & condemnation
$40,000 for rehab, $25,000 for new
$28,000 per unit
Yes, 100% of area median
Yes Yes 5 years for 1-4 units
Cincinnati CDBG, HOPE III
Low income loans
Tax foreclosure & purchase
Equal to appraised value
$20,000 per unit
Yes, HOPE III guidelines
Yes Yes 3 years
Omaha CDBG, HOME 2nd mortgage, deferred loans
Purchase $20,000 per unit $13,500 per unit
Depends upon loan source
Yes No 10 years
Portland CDBG, State funds
1st or 2nd mort-gages
Tax foreclosure & condemnation
$20,000 per unit
Federal pro-gram limits
Yes Yes 3 to 5 years
Cleveland CDBG, HOME, LIHTC
Lease purchase loans, 2nd mort-gages
Direct purchase by new owners
$18,400 (HOME) $50,000 (LIHTC)
Yes, federal program limits
Yes Yes 5 years

11
II. PROGRAM COSTS & BENEFITS
METHODS
When a house becomes vacant in St. Paul, one of three things occurs. First, the house can be rehabilitated through the Houses to Homes program. Second, if the house remains vacant for over 12 months, the city can move to have it demolished. A third potential outcome is that the vacant home can be reoccupied at any point by another tenant or the property owner. The three potential outcomes from housing vacancies are illustrated below in figure 2. In the following section we analyze the costs and benefits associated with each of the options pictured below. Figure 2: Outcomes of vacant homes in St. Paul since 1991.
In the analysis that follows, we explicitly compare the costs and benefits to each of the three property dispositions. We examine the effects of each on property tax revenues for the city, nearby investment by neighbors, and costs to the city associated with police and citizen services. Other benefits examined include sales tax revenues and losses to property foreclosure.
Vacant house
Rehab (n=232)
Demolition (n=320)
Reoccupation (n=1169)

12
Costs of Vacant Housing in St. Paul
This section will look first at ways the costs associated with vacant housing play out locally and then turn to a closer look at costs and discussion of benefits related to the Houses to Homes program. Erosion of Property Tax Base
Perhaps the most obvious cost of vacant housing or vacant lots is the immediate loss of tax base because of the depressed value of the property. While the average estimated value of homesteaded residences in 1989 was $67,584, vacant properties or vacant lots are valued at much lower, thereby lowering the property tax assessment. This is particularly important in St. Paul, because residential properties make up over 40 percent of the city’s tax base, an amount which is increasing in relation to commercial and industrial properties and apartments.22
Secondary Impacts on Property Values
In addition to the immediate loss in tax revenue from the vacant property, surrounding properties may also experience depressed values, resulting in lower tax revenues. Studies differ on the amount of the impact, but not on its existence. A National Association of Home Builders study based on figures from the 1991 and 1993 American Housing Surveys found that an abandoned building within 30 feet of a home in a Northeastern central city reduced the value of the home by over 30 percent.23 The Family Housing Fund of the Twin Cities reported that, based on realtors’ experiences, houses on the same block as vacant properties show decreases in property values of $2,500 and more, while homes adjacent and across the street decrease $10,000 in value.24 A study of property values in Minneapolis found that an abandoned housing building in a census tract lowers a property’s value by $859.98.25 Deterred Private Investment
This loss in property value and uncertainty about the return may deter surrounding property owners from investing in maintenance or improvements to their properties. Property owners who decide to invest in their properties may find that they cannot secure private financing for the work because of their proximity to vacant buildings or the overall condition of the neighborhood.
22 Greg Blees, City Council Fiscal Policy Director. Research presented at the Policy Session on Property Values of the St. Paul City Council, 15 May 1996. 23 Paul Emrath. “Features that Influence Home Values.” Housing Economics, December 1995, 8. 24 Ana Moreno. Cost Effectiveness of Mortgage Foreclosure Prevention. Family Housing Fund of Minneapolis and Saint Paul, November 1995, 16. 25 Edward G. Goetz, Hin Kin Lam and Anne Heitlinger, There Goes the Neighborhood? The Impact of Subsidized Multi-Family Housing on Urban Neighborhoods (Minneapolis: Center for Urban and Regional Affairs, 1996) 55.

13
Loss in Tax Revenue from Tax Delinquent and Tax Forfeited Properties
When homes are abandoned by their owners, they frequently become tax delinquent, as the cost of paying property taxes can exceed the value of the property. After the property goes into tax forfeiture, ownership is transferred to the state and any outstanding taxes must be written off. This is a direct loss to the city, county and school district. When the property is sold at tax auction, some of these revenues might be recouped, but only after paying for the county’s administrative expenses and any outstanding assessments. If any of the proceeds are remaining (which is unlikely), they are divided between the three taxing entities, with the city receiving only 40 percent of the total and the county and school board dividing the rest. Costs for Property Maintenance and Security
Once a vacant property is identified by the city and placed on its Vacant Housing List, health inspectors visit the site every two months. As a result of these visits or in response to calls from concerned citizens, the city may perform maintenance tasks at the property, such as cutting the grass, picking up garbage or shoveling the sidewalk. Because of concerns to health or safety, the property might also be boarded up. The costs of these summary abatements are assessed to the property. At the end of the year, the assessments are certified to the owner’s taxes, but if the owner is tax delinquent, they remain unpaid. Maintenance tasks might also fall to neighbors who do not wish to wait for the city to intervene. In addition to any costs incurred, it may add to their dissatisfaction with their neighborhood. Demolition Costs
As is the case with summary abatements at vacant properties, abandoned houses may be demolished if they represent a significant health and safety hazard. The cost of the demolition is also assessed to the property owner, and one-tenth is certified to the property taxes every year if the total assessment is not paid in full. Like the other assessments, the cost of the demolition (several thousand dollars) may be lost if the owner is not paying property taxes. Any outstanding balance of the demolition or summary abatements must be paid by the city at the time a property is turned over to the state. These costs may be recouped by the city if the tax auction proceeds are sufficient to cover administrative costs incurred by the county with funds remaining. However, the county does not take the amount of outstanding assessments into account in setting the sales price of the tax forfeit property, and until recently, did not contact the city to find out the amount of outstanding assessments. Health and Safety Hazards
In addition to maintenance costs, the city also incurs costs in responding to police, fire or complaint calls to the property. Each call generates a response where a city employee goes to the property and might perform a range of activities with varying expenses, from making a note in a file to putting out a fire. For each of the cost categories described above, we are able to estimate the fiscal impact of rehabilitation, demolition, or private sector reoccupation of the vacant home. In a small

14
number of cases, Houses to Homes has subsidized the complete demolition of a house and the new construction of a replacement house on the same site. These cases are included with the rehabilitation projects for the purpose of this report. In the analysis that follows we rely upon various assumptions and estimates to calculate costs and benefits. Thus, where appropriate we will provide a conservative, a mid-range, and a more generous estimate of the fiscal impacts we calculate. In addition to the impacts we calculate, there are other possible effects that, for various reasons, we do not estimate. A description of these impacts is provided below. Non-quantified impacts Income generation from rehabilitation In the analysis below, we investigate the question of whether rehabilitation of a vacant home leads to spillover investment in nearby properties. We then go on to estimate what the increased property tax and sales tax revenues are from the upgrading of the housing stock that takes place after a Houses to Homes rehabilitation. We do not estimate, however, the increased disposable income generated by the construction jobs created by the Houses to Homes rehabilitation and the spillover investment. These benefits can be assumed to be significantly greater than zero and should be acknowledged when weighing the total impact of rehabilitation versus demolition or reoccupation. Loss of affordable homeownership opportunities Each vacant home represents an under-utilized element of the housing stock. Rehabilitation and resale of the home through Houses to Homes not only returns the house to the stock, but it also provides an income-qualified family with an opportunity to own a home. The benefits of providing affordable homeownership to families is not included in our analysis. Perceived Loss of Social Control
Incidents occurring at vacant properties or vacant lots may exacerbate a feeling of dissatisfaction of residents with the neighborhood and hopelessness which accompanies the presence of vacant buildings. Because the vacant buildings are concentrated in low-income areas, they are both indications and reflections of other social problems. Rehabilitation, demolition, and reoccupation may have varying impact on the degree to which this problem is mitigated. The difficulties of measuring these effects preclude our including them in the present analysis. Harm to Overall Physical Appearance The presence of a vacant building may influence the attitudes of residents or outsiders in judging the attractiveness of a neighborhood as a place to live, visit or do business. It is conceivable that rehabilitation, demolition, and reoccupation may have differential impact on aesthetic judgments of the neighborhood. To the extent that these judgments affect future locational decisions, including decisions to locate new businesses and employment opportunities nearby, they may

15
have a very real impact on the health of the neighborhood. Constraints of time and resources kept us from collecting data on this issue.
FINDINGS
Direct property value benefit

16
In this section we estimate the average property tax revenues produced by properties in each of the three disposition categories - rehabilitation, demolition, and reoccupation. after each of the three dispositions. First, we estimate that properties rehabilitated through Houses to Homes will be valued at their average sales price, $68, 894. Demolished properties will be valued at an average of $6,010. This average was obtained from data on demolished properties in St. Paul, obtained from the St. Paul Department of Planning and Economic Development (PED). Finally, we assume that the reoccupied units are valued at $29,618. This estimate was obtained by using the average acquisition price paid through the Houses to Homes program. That is, this was the value of homes that had been vacant prior to their being rehabilitated. Calculation of benefits
In order to estimate the public revenue, we apply property tax rates as paid by property owners in St. Paul. Property tax is levied against 1% of the first $72,000 of value. The levy rate is 153.09%. Thus, we use the following equation to determine the property tax revenue to the city:
Revenue = Value * .01 * 1.5309 We then take the revenue figures and carry them out over 20 years, and calculate the
discounted present value of that revenue stream. Based on the the cost of capital to the city (i.e., the municipal bond rate at a 20 year term) we use a 5% discount rate.26 The discounted present value of 20 years of property tax revenue from a rehabilitated home is $13,145. This compares to $1,148 for demolished properties and $5,650 for reoccupied homes.
In addition to these total figures, we can calculate what St. Paul’s portion of the tax
revenues would be by multiplying the figures above by (.4), because the City receives 40% of property tax revenues. The discounted present value of the direct revenue to the city is $5,258 under rehabilitation, $459 for a demolition, and $2,260 for reoccupation.
Indirect property value benefit
Proponents of housing rehabilitation programs claim that rehabilitation not only improves the quality (and therefore market value) of the house rehabilitated, but it also increases nearby property values, enhancing the market value of the entire neighborhood. As described earlier, an abandoned house can decrease nearby property values by many thousands of dollars. The higher market values generated by rehabilitation are reflected in higher tax assessments, providing local government with greater property tax revenues. In this section, we analyze the degree to which this scenario plays out in the St. Paul Houses to Homes program. Analysis of impacts
In order to estimate the impact of rehabilitation, demolition, and reoccupation on nearby property values, we constructed a hedonic price model of residential properties in St. Paul. We
26 According to Shirley Davis, the Treasurer of St. Paul, the most recent bond rate paid by the city was 4.89%. Thus, a 5% discount rate actually slightly underestimates the current present value.

17
collected data from the County Assessor’s office for every residential property in the city. These data provide information on the housing structure and the property lot. This allowed us to take account of characteristics such as lot size, number of bedrooms, bathrooms, existence of a fireplace, porch, garage, and other features that help determine housing value. To those structural characteristics we added neighborhood “dummy” variables.27 The County Assessor’s office divides the city into 22 neighborhoods that they define as separate housing submarkets. These dummy variables allow us to take into account a range of neighborhood-level demographic and market characteristics that may also affect property values. To the structural and neighborhood variables we added one more set of variables; the number of Houses to Homes rehabilitations, demolitions, and reoccupations that took place on the same block as the property in question. These last variables are the ones in which we are most interested. The coefficients for these variables tell us what impact these different dispositions have had on property values. The dependent variable for this analysis is the most recent sales price of the house as recorded in the Assessor’s data.
We restricted the sample to houses that were on a block that had a vacant property. In addition, because our dependent variable was sales price, we eliminated those properties that sold before the rehabilitation, demolition, or reoccupation took place. These two restrictions resulted in a sample size of 1713 properties. Table 3 presents the findings from this analysis.
The coefficients listed in table 3 are interpreted as being the amount of increase or decrease in property value associated with a change of a single unit in the independent variable. For example, the first variable listed in the table is “Single family home.” This variable is coded “1” for those properties that are single family homes, and “0” for properties that are not. Thus, the coefficient indicates that all other things being equal and controlled for, the single family homes in this sample of homes average $11,805 more in value than other types of homes. Similarly, those with a garage average $6,161 more in value than those without a garage, other things being held constant. The coefficients for the three variables of interest reveal that demolition and reoccupation had significant negative effects on the property values of other homes on the block (b= -1300.51 and b= - 1191.05, respectively). The coefficient for rehabilitation is also negative, but not statistically significant. This means that there is no reliable statistical impact of rehabilitation on nearby property values; values tend to remain essentially stable on blocks with rehabs. Recall that our sample is only those blocks with a vacant house; these blocks are typically going to be troubled areas with stagnant or declining values. This analysis suggests that demolition and reoccupation hasten the decline of nearby values, while rehabilitation stabilizes values of other houses in these areas.
Table 3: Impact of the Houses to Homes program on property values - hedonic price model
Variable Coefficient Probability
Single family home 11805 .000 Condition 16041 .000
27 Dummy variables take on the value of 0 or 1, indicating the presence of a characteristic, or its absence. In this analysis, we include 22 separate dummy variables, each indicating whether a property is located in the neighborhood or not. For properties located in neighborhood 7, for example, the value of the dummy variable “Nbhd7” equals 1, and the values for all of the other “Nbhd_” variables is coded 0.

18
Garage 6161 .000 Pool 16505 .126 Lot area 1.067 .000 Total lot area 23.37 .000 Number of bedrooms -277 .561 Number of bathrooms 310 .729 Fireplace 4506 .002 Age of house -236 .000 Homesteaded property 10143 .000 Enclosed porch -2.217 .588 Deck area 26.15 .002 Neighborhood 1 55193 .000 Neighborhood 3 29117 .001 Neighborhood 4 7797 .000 Neighborhood 5 4305 .452 Neighborhood 6 -1694 .346 Neighborhood 7 2173 .195 Neighborhood 8 4719 .004 Neighborhood 10 9304 .001 Neighborhood 11 5718 .003 Neighborhood 12 4860 .007 Neighborhood 13 1715 .686 Neighborhood 15 3255 .080 Neighborhood 17 20761 .000 Neighborhood 18 19375 .192 Neighborhood 19 2856 .131 Neighborhood 20 13160 .000 Neighborhood 21 29796 .001 Neighborhood 22 36677 .000 Neighborhood 24 23732 .000 Neighborhood 86 -3537 .000 Neighborhood 110 885 .655 Rehabilitation -498.34 .330 Demolition -1300.51 .029 Reoccupation -1191.05 .001 constant 10480 .001
Adjusted R2 .5838 N = 1713 F = 63.51 .000
Thus, in comparison with the other two dispositions, rehabilitation provides benefits to
the city, in terms of property tax revenues that would have been lost had the city followed one of the other two strategies. Below, we estimate the magnitude of this benefit. Calculation of benefits
To produce an estimate of the impact of Houses to Homes activity on property values, we multiply the coefficients for demolition and reoccupation by 13 in order to get the total increment in value for the entire block. (According to the data we collected to analyze the spillover investment occurring in neighborhoods with a Houses to Homes rehabilitation, we found that the average St. Paul block face has 14 homes.) Most analyses of this type show that

19
property value effects of certain land uses have an impact for at least one-eighth of a mile in each direction. Thereafter the effect diminishes until disappearing outside of three-quarters of a mile or one mile. In this analysis, we assume that the effect we saw for the block face reduces by 50% for the eight surrounding blocks and again by 50% (to 25% of its original impact) for the next ring of (16) blocks before disappearing.
Two things should be noted about our assumptions regarding the extent of the effects we
found in the hedonic model. First, in a central city such as St. Paul, it is generally the case that two rings of city blocks will be less than one-eighth of a mile from the core block. Thus, on the whole our estimate appears conservative. Second, because our estimate is not based on data analysis we have chosen to investigate a range of estimates. The assumption described above will serve as the basis for our mid-range estimate. An even more conservative estimate would have the property value impact disappearing after the first ring of block. Thus, we made calculations based on the assumption that the effect diminishes by 50% for the first block and then disappears. Our high range estimate is based on a more generous assumption about the property value impact of demolitions and reoccupations. That is, for the high end calculations we assumed that the impact reduces to 67% of the original size for the first ring of blocks and then reduces to 33% of the original for the second ring of blocks. Our calculations are described in the following manner:
Low estimate: A = (b*13) + (b*14*.5*8) Mid-range estimate: A = (b*13) + (b*14*.5*8) + (b*14*.25*16) High estimate: A = (b*13) + (b*14*.67*8) + (b*14*.33*16), where A is the estimated aggregate property value change in the neighborhood, and b is the coefficient in the hedonic model for the demolition and reoccupation variables. This value, A, is then multiplied by the property tax rate to determine the increment in tax revenues for a given year. We extrapolate the findings over 20 years and calculate the discounted present value. This process produces the estimated public sector costs shown in table 4. Table 4: Estimated indirect property value impacts. Rehab Demo Reocc Low Mid High Low Mid High Low Mid High Total
0 0
0
-$14,570
-$26,397
-$34,202
-$13,340
-$24,165
-$31,310

20
fiscal impacts City fiscal impacts
0
0
0
-$5,828
-$10,559
-$13,681
-$5,336
-$9,666
-$12,524
Spillover investment benefits
It is possible that rehabilitation and demolition may have differential impact on the propensity of neighbors to invest in their own homes. Demolition, for example, may signal to nearby property owners that there is little interest in maintaining the housing stock in the neighborhood and may make them less likely to invest in their own properties. Theoretically, we expect rehabilitation to have the opposite effect. That is, we expect that rehabilitation sends a signal to neighbors that the area is worth investing in and that neighbors are making the investments necessary to maintain the housing stock. This could increase a household’s willingness to make investments in their own housing. In this section of the report we analyze this issue and attempt to quantify the degree to which these effects occur. Analysis of spillover impacts
In order to test for the impact of rehabilitation, demolition, and reoccupation on nearby investment we collected data on the number and amount of construction permits pulled from 1986 to 1996. We proceeded in the following way: A) We chose the block face (a block of houses facing the same street) as our unit of analysis. B) We identified blocks where only one of the three possible dispositions occurred. That is, we
identified all of the blocks where only a rehabilitation took place, without any demolition or reoccupation. Then we identified the blocks in which only demolitions took place, without any rehabilitation or reoccupation. We repeated the process for reoccupations.
C) We then chose a random sample of 25 blocks in each category. D) Data on the number of houses on the block, the number of construction permits pulled, and
the total value of the permits pulled were collected (excluding the address at which the rehabilitation took place) for each year from 1986 to 1996.
E) We controlled for the number of houses on the block by computing the mean permit value per house. This variable was used as the dependent variable in our analysis.
F) We used an interrupted time series technique to determine the impact of rehabilitation, demolition, and reoccupation on mean permit value. We constructed a separate equation for each of the three disposition categories. By comparing the statistical findings across these equations we can estimate the differential impact of the dispositions on nearby property investment.
The statistical analysis produced findings summarized in table 5. Of the three
dispositions, only rehabilitation has a statistically significant impact on nearby property investment. The coefficient in the upper left corner indicates that rehabilitation results in an

21
increase of $713.54 of investment per house per year. The coefficients for demolition and reoccupation are negative, suggesting that these dispositions actually reduce nearby investment. But, because these coefficients are not statistically significant, we conclude that there is actually no reliable impact on investment of these two dispositions. In addition, the statistics show that on the rehabilitation blocks, investment was decreasing by an average of $97.37 per house per year prior to the rehabilitation (see the pre-intervention trend coefficient). The trend after the rehab is not statistically significant, thus we assume it is even. Taken together this means that the rehabilitation not only increased the average level of investment on the blocks we studied, but it also arrested a downward slide on those blocks.
Table 5: The impact of rehabilitation, demolition, and reoccupation on nearby property investment: Interrupted time series analysis. Eq. 1 Eq. 2 Eq. 3 Rehab Demo Reocc Change in level 713.54 * -658.12 -16.99 Pre-intervention trend -97.37 * 204.80 -52.52 Post-intervention trend -15.73 -351.78 136.43 * p < .10 This process is illustrated in figure 3 below. Line a-b represents the pre-rehabilitation trend in nearby investment. There is a slight downward slope. Line b-c represents the impact of the rehabilitation on the level of investment taking place in the neighborhood (estimated by the coefficient of 713.54 more investment per house per year). Line c-d is the post-rehabilitation trend. It is, according to the findings shown in table 5, not statistically different than 0. Finally, line b-e represents the level of investment that would have taken place in the absence of the rehabilitation. Thus, the sum of the impact of rehabilitation on nearby investment is the area between points d and e.
Thus, we calculate that the per house impact of rehabilitation in the first year is an
increase of $713.54 plus an additional $97.37 (a total of $810.91). For each subsequent year this total increases by $97.37 (the amount of decline that would have occurred without the rehabilitation). We can now use these estimated figures to calculate the increased tax revenue generated by the increased private sector investment in neighborhoods experiencing a rehabilitation.
Figure 2: The impact of rehabilitation on nearby property investment.

22
Calculations of benefits
We make two adjustments to these figures before we calculate the net present value of this revenue stream. First, it is the case that investment does not translate into market value on a dollar for dollar basis. According to the estimates of nonprofit community developers who work in the neighborhoods affected by the St. Paul Houses to Homes program, only 30% of investment translates to market value.28 Thus, our first adjustment to the figures is to reduce them to 30% of their estimated value.
Second, it is the case that not all private investment is reflected in the permit data. Indeed, there are reasons to suspect a rather large underestimation of the total amount of private investment that takes place. To the extent that permits take time, cost money, and might result in city inspections and plan checks, some property owners may wish to avoid the entire process, if possible. The City’s Building Inspections Division estimates that permits may undercount actual private investment by as much as 30%.29 Thus, the second adjustment is to increase our figures by 30%.
After these adjustments, we make calculations that are similar to the ones made in the property values analysis in the preceding section. That is, we assume that the impact of the spillover private investment reduces by half for the surrounding eight blocks, and again by half for the second ring of 16 blocks. Then we apply the tax rate to the amount. The steps are listed below: A) Take the year one increment in average permit value of $810.91 ($713.54 + $97.37). This
figure increases each year by $97.37. B) Because the average block in the sample has 14 homes, multiply (A) by 13 (14 minus the
house rehabbed through Houses to Homes). This provides the increase in permit value on the entire block due to the rehabilitation.
C) Multiply (A) by 14 to get the total for the surrounding blocks. The multiply by .5 and then by 8, because the magnitude of the spillover investment reduces by half for the surrounding blocks.
28 Estimate obtained at a meeting of the St. Paul Community Development Coalition, Wednesday, October 2, 1996. 29 Communication from Marcia Moermond, Senior Researcher, St. Paul City Council Research, January 7, 1997.
intervention point
a
b c d
e

23
D) Multiply (A) by 14 * .25 * 16 to account for the magnitude of the spillover investment in the second ring of blocks.
E) Add (B) (C) and (D) to get the total increment in permit value. F) Multiply (E) by .3, because only 30% of permit value translates to market value. G) Multiply (F) by 1.3 because the number of permits pulled underestimates actual private
investment by 30%. H) Multiply (G) by .01*1.5309 in order to determine the tax revenue. I) Repeat this for each of the 20 years (this is necessary because (A) above changes each year). J) Determine the net present value of this revenue stream, at 5% discount rate.
These steps provide us with the discounted present value of $13,507. That is, a single rehabilitation results in nearby property investment that yields $13,507 in tax revenue over a 20-year period discounted to present value.
As in the calculations of the indirect property tax revenues, we provide both a range of
estimates as well as the city of St. Paul’s portion of the revenues. To calculate a low range estimate we assume, as we did in the previous analysis, that the spillover impact might extend as little as only one block surrounding the property. For our high range estimate we assumed, as before, that the magnitude of the effect would decrease to 67% of its original value for the surrounding block and then to 33% of its original value for the second ring of blocks. Our range of estimates, along with the calculation of city revenues are shown in table 6 below. Table 6: Estimated spillover investment impacts. Rehab Demo Reocc Low Mid High Low Mid High Low Mid High Total fiscal impacts
$7,457 $13,507 $17,502 0 0 0 0 0 0
City fiscal impacts
$2,983 $5,403 $7,001 0 0 0 0 0 0
Our calculations suggest that the discounted present value of the total public fiscal benefits due to the spillover investment generated by a Houses to Homes rehabilitation project range from a low of $7,457 to as much as $17,502. The City of St. Paul directly receives from $2,983 to $7,001 of those benefits. There are no similar benefits from either a demolition or a reoccupation.
Additional rehabilitation benefits - sales tax revenue

24
In this section we quantify an additional source of revenue to the city of St. Paul, based on the estimated sales tax revenue generated by rehabilitation activity. The sales tax revenue would come from two sources, the materials and supplies used in the construction job itself that are bought in St. Paul, and more indirectly, through the enhanced income of construction workers who are St. Paul residents and who make purchases in the city.
For the purposes of this analysis, we estimate only the direct generation of sales tax revenue through the purchase of construction materials for the Houses to Homes rehabilitation projects, and for the spillover private investment that takes place as a result of Houses to Homes rehabilitation projects. In order to calculate the benefits, we use the analysis of spillover investment to produce estimates of the amount of construction work produced by HOUSES TO HOMES rehabs, demolitions, and reoccupations. Recall that the investment analysis indicated that only rehabilitation resulted in a net increase in spillover investment. The increase was in the amount of $713 per house per year and an additional $97 per year (because the declining pre-rehab trend was stabilized by the intervention). Calculation of benefits
Using the mid-range estimate of spillover investment produced in the previous analysis, we calculate the sales tax revenues to the city from material purchased as a result of this construction work. We assume, as we did in the analysis of spillover investment, that permits undercount the actual amount of work done by 30%. We also use as a mid-range assumption that 30% of the cost of rehabilitation goes to materials.30 Calculating the 7% sales tax on the materials purchased in the spillover investment induced by a Houses to Homes rehab produces a very large net public sector benefit of $67,211. There are two reasons why this benefit seems so large compared to the property tax revenues examined in the previous analyses. First, the tax is applied to the total increment in materials expenditures whereas property taxes are applied on only 1% of the value of houses. Second, the property tax impact of spillover investment is significantly reduced by the fact that only 30% of the value of the rehabilitation work translates into market value. Neither of these important reductions apply to sales tax where the tax of 7% is applied to every cent spent on rehabilitation work. Table 7: Sales tax revenues from the estimated spillover investment. Rehab Demo Reocc Low Mid High Low Mid High Low Mid High Total fiscal impacts
$56,009 $67,211 $78,413 0 0 0 0 0 0
City fiscal impacts
$2,801 $3,361 $3,921 0 0 0 0 0 0
Table 7 reveals very large public benefits from sales tax revenues that result from the
spillover investment after a Houses to Homes rehab. At the same time, only a very small 30 Estimates obtained from Ed Johnson, West Seventh Street Community Federation.

25
percentage of those benefits go directly to the City of St. Paul. In order to calculate St. Paul’s portion of the sales tax revenues we first assumed that only 70% of the construction materials purchased for the spillover investment projects were purchased in St. Paul. We then took that amount and applied to it the ½ of one percent share of the sales tax that goes directly to the city.
Property maintenance costs
In this analysis we determine the degree to which rehabilitation, demolition, or reoccupation affect the cost of citizen services at previously vacant residential properties. In order to estimate whether the type of disposition affects the number of citizen service calls made to a property, we employ an interrupted time series model, with the disposition as the intervention point. We collected data on the monthly number of citizen service calls at randomly selected properties (25 in each disposition category) since 1990. Using a Poisson time series regression model we are able to quantify the degree to which each of these dispositions affect the need for citizen services.31 We computed separate models for each disposition. The findings are summarized in table 8.
Table 8: Poisson time series analysis of Citizen Service calls for rehabilitation, demolition, and reoccupation. Rehab Demo Reocc Change in level -1.14** -.804** -.174 Pre-intervention trend .04*** .029 *** .052*** Post-intervention trend -.04** -.025** -.074*** ------------------------ Ratio of post- to pre-intervention mean .134 .447 .839 ** p < .05 *** p < .01
The data show that both rehabilitation and demolition significantly reduce the number of monthly calls for citizen services. That is, the coefficient for “change in level” for both rehabilitation and demolition is statistically significant and negative in direction. Though the coefficients in a Poisson regression cannot be interpreted in the same manner as a simple interrupted time series analysis, it is possible to compute the change in intercept as a percentage
31 A Poisson method is a form of non-linear estimation that is appropriate when the dependent variable is restricted in range to positive integers. The count-data that we have collected on public health calls and police calls (described in the following section) make the Poisson regression the preferred model. The coefficients produced by the model cannot be given the same interpretation as those produced by simple time series models.

26
reduction in the pre-intervention mean. Thus, the data show that rehabilitation reduces the calls to 13.4% of their pre-intervention level, while demolition reduces calls to 44.7% of pre-intervention levels. The coefficient for the reoccupation equation is not significant, indicating that there is no statistically reliable effect of reoccupation on the level of citizen service calls. Though both rehab and demolition reduce service calls, rehabilitation reduces calls by a greater amount.
According to our estimates,32 the cost to the city for public health inspections is $40.77 per call and vacant houses are inspected an average of 16 times per year. We will use these estimates to produce a cost estimate for citizen service calls because the majority of the citizen service calls are public health related.33 We produce a cost savings estimate in the following manner: A) The average vacant home is inspected 16 times per year for a total cost of $652.32
(16*$40.77). B) After rehab those numbers are 2.14 inspections per year (16*.134) for $87.25. C) After demolition the numbers convert to 7.15 per year (16*.447) and $291.50. D) For reoccupation the numbers remain the same: 16 inspection per year for $652.32.
The annual savings are simply $652.32 minus the estimated post-intervention costs. For rehabilitation the savings are $565.07 per year. For demolition the savings are $360.82. Minute adjustments to these numbers needed to be made to account for the slight upward trend in calls prior to the intervention for both rehab and demolition, and the slight downward trend after the intervention in both cases.34 Over a 20 year period the discounted present value of these savings are $7,141 for rehabilitation and $4,697 for demolition. All of these savings accrue to the City of St. Paul.
32 The cost per inspection is based on a projection of the number of inspections in 1995, the number of vacant buildings monitored in 1995 and the three budget lines related to monitoring housing in the city. According to information given to the City Council Research Office by the Department of Public Health, there were a total of 34,852 inspections in 1995. The budgets for vacant building monitoring, housing inspection, and nuisance buildings abatement were combined to estimate the total amount spent on monitoring all housing units in the city. This total of $1,421,062 was divided by 34,852 to estimate the cost per inspection for any housing unit. 33 Communication with M. Moermond, St. Paul City Council Research Office. 34 Table 8 indicates that there were slight slopes in the pre- and post-intervention trends for reoccupation, but that the intervention did not significantly alter the level of calls at those properties. By calculating the partial derivatives of the expected values we are able to produce coefficients that can be interpreted as the amount of change in the dependent variable given a one-unit change in the independent variable. Though the pre- and post-intervention trends were incorporated into the estimates of the impact of rehabilitation and demolition, the magnitude of the partial derivatives for reoccupation are so small that we assumed the impact of the trend changes would be negligible.

27
Police Costs
In this section we estimate the savings to the city in the police costs associated with servicing vacant and abandoned houses. As several studies show, vacant housing is often the location of illegal activities and, as such, can be a burden not only to the neighborhood, but to a city’s police department in terms of the time and expense of responding to calls. Analysis of impact
We collected data on monthly police calls at all of the addresses of properties involved in the Houses to Homes program. The police data date back to January 1990 and run through July 1996. We utilized a Poisson time series analysis using the date of disposition (the month the property was either rehabbed, demolished, or reoccupied) as the intervention point. Such an analysis provides estimates of how much change occurred in the number of police calls after the disposition of the property. By running separate equations for properties that were rehabbed, demolished and reoccupied, it is possible to estimate the impact of each of the interventions. The analyses were done on random samples of 25 properties in each category. Table 9: Poisson time series analysis of police calls at rehabilitated, demolished and reoccupied properties. Rehab Demo Reocc Change in level -.207 -3.259*** .143 Pre-intervention trend .002 -.022 -.004 Post-intervention trend -.009 .033* -.024** ------------------------ Ratio of Post- to pre-intervention mean .812 .038 1.15 * p < .10 ** p < .05 *** p < .01
The time series analysis produced the findings, summarized in table 9. Only demolition of a property significantly changed the number of police calls occurring at the properties studied. Demolition reduced the number of police calls at properties by 96 percent. That is, the post-demolition level of police calls was only 3.8 percent that of the pre-demolition level. Rehabilitation and Reoccupation did not significantly alter the level of police activity at properties. These findings are somewhat to be expected given that after a demolition there is no structure to play host to illegal or suspicious activity, thus calls to the property are likely to reduce. Perhaps more important, when the structure is gone there is no readily observable address to be used as a reference when making a police call. This, too, may reduce the number

28
of calls to a property, irrespective of the amount of criminal activity taking place. Nevertheless, it is also the case that rehabilitation and reoccupation had no impact on crime calls at the properties studies. Calculation of benefits
Using the percentage reduction in police calls due to demolition it is now possible to estimate the cost savings to the city. According to city budget figures, the cost to respond to the average police call is $115.35 The pre-demolition average for police calls was .276 per month. That is, the 25 properties in our random sample received an average of .276 calls per month prior to their being demolished. This equates to 3.312 calls per year (.276*12), or a cost of $380.88 per year (3.312*$115). If demolition reduces the number of calls to 3.8% of their pre-demolition level, we would expect only .126 calls per year at demolished sites (3.312*.038). This equates to a cost of $14.49 per address, per year, after demolition. The difference between $380.88 and $14.49 represents the annual savings to the city; $366.39. To these amounts we made slight adjustments for the post-intervention trends shown in table 9 for demolition and reoccupation. Extrapolating this over 20 years and taking the net present value produces a discounted present value of the police savings of $4,169 per demolition and $735 per reoccupation. Rehabilitation did not alter the level or trend of police calls at the addresses we studied.
Foreclosure losses
Frequently, demolished properties fall into tax delinquency and ultimately tax foreclosure. When this occurs, the property is sold at auction and the county and city recoup whatever costs they can from the sale of the property. Sales prices, however, infrequently cover the actual costs of back taxes and accrued assessments. Thus, for each property demolished there is a risk of significant loss to the city. In this section we analyze this question and, based on city data, assign an average loss amount to each demolition that occurs in the city.
When a demolished property goes into tax default, the owed taxes and interest accumulate on the tax bill for the property each year. In addition to back taxes, however, the city can add additional assessments as they occur. For example, if the city is called to the property to address a public health issue, or should the city be called to cut the grass or maintain the property in some other way, the cost of that service is added as an assessment to the tax bill. Actual foreclosure does not take place until the property has been delinquent for five years. At that point, the county can proceed with foreclosure actions and ultimately offer the property for sale at auction. At the sale of the property, the county takes its administrative costs out of the proceeds first, after which the county, the city, and the school district take their share of the back taxes. If there are left over proceeds from the sale, the city can then recover its assessments. The St. Paul City Council Research staff estimate that the city recovers only 17% of all of its costs (including tax revenue) from the average foreclosure sale.
35 The information on the cost per police call is as reported by the police department’s operations division for the 1996 budget. It is listed as the 1995 estimated patrol cost per call.

29
Using a current list of demolished homes in St. Paul, we are able to estimate the average
assessment balance of properties in foreclosure. The data we were provided by St. Paul PED included data on 300 demolished homes. Of those 300, 14 had been delinquent for at least five years (some were delinquent as many as seven years, indicating that the county does not always get around to proceeding with the foreclosure sale in year five). We calculated the average accumulated tax bill in the following manner:
A) Using those properties in the data base that had been in default at least five years, we
calculated that on the average they had been demolished in the fourth year of delinquency and had been delinquent an average of six years.
B) Assuming an average property value of $29,618 for an abandoned house (this estimate comes from the average purchase price to the city of a Houses to Homes property), we calculated four years worth of back taxes and interest.
C) Assuming an average property value of $6,010 for a vacant lot we calculated an additional two years worth of back taxes and interest (based on this reduced value of the property).
D) We added (B) and (C) to get the total owed in taxes. The difference between this sum and
the total payable (an average of $13,157 for the properties in the data base) is the various additional assessments to the property made by the city. To that amount we added the average demolition cost ($9,500) to calculate the total assessments and back taxes owed on the foreclosed properties. We then calculated the discounted present value of that six year stream of uncollected revenues.
E) Assuming that the city was entitled to 40% of the back taxes and 100% of the rest of the assessments, we calculated the net potential loss to the city for each foreclosed property.
F) We multiplied (E) by the total number of foreclosed properties in the data base to get the aggregate potential loss to the city.
G) According to city estimates, the city reclaims only 17% of its costs in tax foreclosure cases, losing the other 83%. Thus we multiplied (F) by .83 to calculate the actual aggregate loss to the city.
H) We divided (G) by the total number of demolished properties in the data base to compute the average cost per demolition.
These calculations produced a mid-range estimate of $7,789 in losses for each
demolition. We produced a high- and low-range estimate for these costs by altering the percentage of properties that would end up in foreclosure. Our data base indicated that 38% of the properties being tracked by the city had already gone to foreclosure. The rest of the properties were in default but had not reached foreclosure. Thus, we used three alternative figures to estimate how many of the remaining properties would end up in foreclosure. For our mid-range estimate we used 25%. Our conservative estimate was 10%, and our high-range estimate was 40%. These adjustments produced a low-range estimate of $6,612 in losses per demolition, and a high-range estimate of $8,921.
30
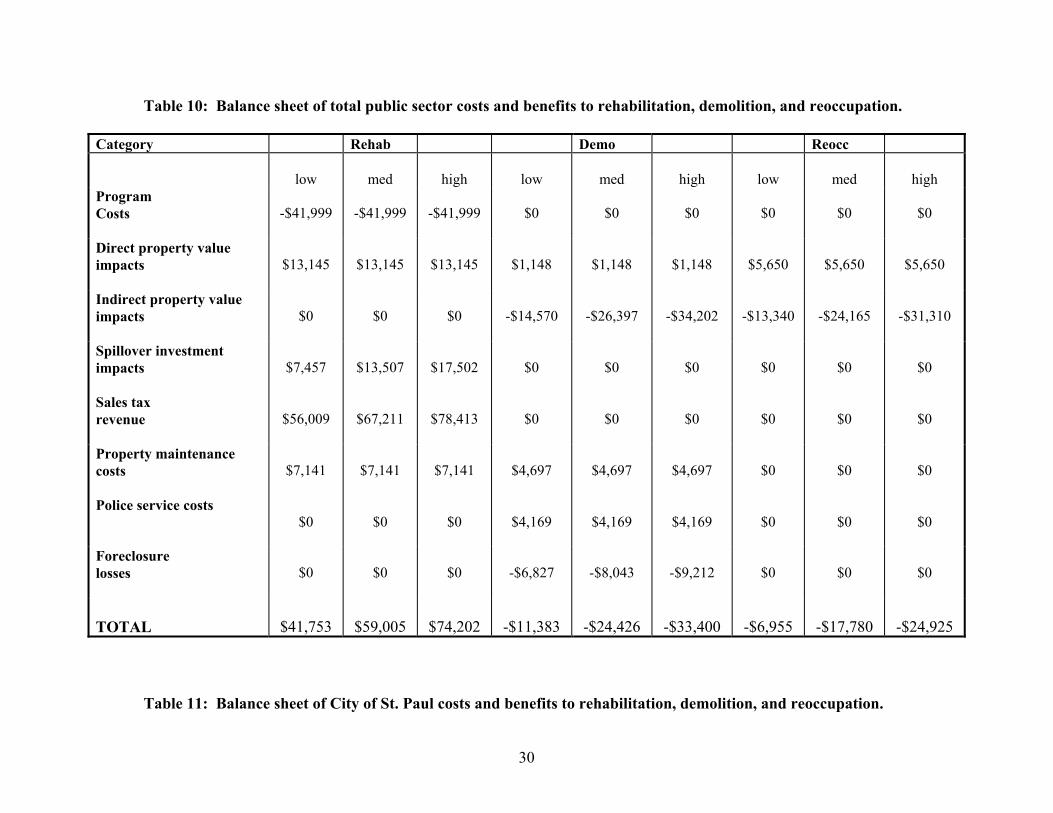
Table 10: Balance sheet of total public sector costs and benefits to rehabilitation, demolition, and reoccupation.
Category Rehab Demo Reocc
low
med
high
low
med
high
low
med
high Program Costs
-$41,999
-$41,999
-$41,999
$0
$0
$0
$0
$0
$0
Direct property value impacts
$13,145
$13,145
$13,145
$1,148
$1,148
$1,148
$5,650
$5,650
$5,650
Indirect property value impacts
$0
$0
$0
-$14,570
-$26,397
-$34,202
-$13,340
-$24,165
-$31,310
Spillover investment impacts
$7,457
$13,507
$17,502
$0
$0
$0
$0
$0
$0
Sales tax revenue
$56,009
$67,211
$78,413
$0
$0
$0
$0
$0
$0
Property maintenance costs
$7,141
$7,141
$7,141
$4,697
$4,697
$4,697
$0
$0
$0
Police service costs
$0
$0
$0
$4,169
$4,169
$4,169
$0
$0
$0
Foreclosure losses
$0
$0
$0
-$6,827
-$8,043
-$9,212
$0
$0
$0
TOTAL
$41,753
$59,005
$74,202
-$11,383
-$24,426
-$33,400
-$6,955
-$17,780
-$24,925
Table 11: Balance sheet of City of St. Paul costs and benefits to rehabilitation, demolition, and reoccupation.

31
Category Rehab Demo Reocc
low
med
high
low
med
high
low
med
high Program Costs
-$41,999
-$41,999
-$41,999
$0
$0
$0
$0
$0
$0
Direct property value impacts
$5,258
$5,258
$5,258
$459
$459
$459
$2,260
$2,260
$2,260
Indirect property value impacts
$0
$0
$0
-$5,828
-$10,559
-$13,681
-$5,336
-$9,666
-$12,524
Spillover investment impacts
$2,983
$5,403
$7,001
$0
$0
$0
$0
$0
$0
Sales tax revenue
$2,801
$3,361
$3,921
$0
$0
$0
$0
$0
$0
Property maintenance costs
$7,141
$7,141
$7,141
$4,697
$4,697
$4,697
$0
$0
$0
Police service costs
$0
$0
$0
$4,169
$4,169
$4,169
$0
$0
$0
Foreclosure losses
$0
$0
$0
-$6,827
-$8,043
-$9,212
$0
$0
$0
TOTAL
-$23,816
-$20,836
-$18,678
-$3,330
-$9,277
-$13,568
-$2,341
-$6,671
-$9,524

32
III. CONCLUSION In this report we have estimated the fiscal costs and benefits related to three different vacant housing strategies. The data show that rehabilitation has very real public sector benefits, benefits that increase when compared with demolition or reoccupation. Demolition and reoccupation are associated with lower nearby property values. This is consistent with other research that shows that vacant properties have a deflating effect on nearby property values. Over the long term, this impact can amount to a sizable stream of revenue that a city foregoes because of the choice to demolish or do nothing about the vacant property. Rehabilitation also spurs nearby property owners to invest in their own homes. The very visible signs of large scale public sector rehabilitation in a neighborhood apparently act as signals to other owners that encourages their own investments. This spillover investment, over a long period of time represents a sizable amount of private investment. Given estimates about how much of that investment represents building and construction materials, the sales tax revenue generated from building materials expenditures, by itself, is enough to cover the average Houses to Homes project subsidy. Rehabilitation of vacant homes also provides net benefits in the form of reduced costs to the city of public health and property maintenance services. Finally, demolition presents real costs to the city due to the high rate of tax foreclosure for those properties demolished. The single cost category for which rehabilitation did not show superior savings was in police service. Both demolition and reoccupation reduced public sector costs in those areas, while rehabilitation did not. Significantly, however, not all of the benefits of rehabilitation are captured by the city. Most of the sales tax revenue goes to the state, while the county and school district shares in the property tax revenues. When the analysis focuses on city benefits only, the rehabilitation strategy is still a net cost to the city (of $21,866). However, the total cost to the city is roughly one-half of the original average subsidy. That is, rehabilitation provides benefits to the city equal to about one-half of the original subsidy level ($42,000). Demolition, on the other hand, costs the city an average of just over $9,000. Although subsidy appears to be a much more costly alternative up-front (a $40,000 subsidy compared to no subsidy for demolition), after a systematic review of costs and benefits, the difference between the two strategies is closer to $12,000. City officials must decide whether the non-fiscal and non-quantifiable benefits of rehabilitation are worth a $12,000 expenditure.
* * *
Vacant houses in economically and socially troubled neighborhoods are obvious signs of distress and deceptively easy targets for efforts at intervention. Vacancy indicates both a decline in the attractiveness of a neighborhood for housing choice and a lack of private market demand for investment. Continuing cycles of decline are self-reinforcing in several ways. Housing which is allowed to deteriorate in a core neighborhood may reach a point where it is not economically feasible to save even if the neighborhood becomes more attractive for other reasons, such as proximity to urban amenities. Deteriorating housing conditions also depress
33
property values in neighborhoods which are often home to low-income residents. This negates any equity they might have hoped to capture in their homes. Homeowners wishing to move then find they cannot get enough by selling their home to repay the mortgage due, which might encourage further abandonment.
The impacts of the deteriorated housing and falling values are especially cruel in low-income neighborhoods, because those residents are least able to afford taking a loss on their prime investment, yet they are also least likely to be able to afford necessary repairs to keep up their homes or have options of finding housing in other areas. Falling property values also discourage existing homeowners from investing in maintaining or improving their properties, leading to further deterioration.
Public intervention is necessary to halt, or at a minimum, slow this cycle of decline. The housing stock of a city is as important an aspect of its infrastructure as its streets or sewers. The condition of a city’s housing determines its value and the city’s ability to generate property tax revenue. It also impacts the demand for infrastructure outlays by influencing where people live and where they spent their workday and their paycheck. The condition of the city’s housing stock also influences how attractive a city is to businesses and visitors.
Because of the spillover effects of other properties and overall neighborhood conditions, property owners often are unable to capture private investments made in maintaining and improving their properties. Private investment in rehabilitation may also be deterred by a lack of available credit in core neighborhoods because of past investment experience or discriminatory practices.
Given the economic risks present in encouraging low income people to become homeowners, some might argue that public sector efforts might better be focused on providing better options for rental housing in the city. However, St. Paul has a history of strong neighborhoods and has chosen to focus on continuing that strength through homeownership. It is thought that homeowners are more likely to invest in their neighborhoods because of their financial interest and longer tenure. It is also thought that homeowners are to be valued for directly contributing to the health of the city through residential property taxes and less use of police services.
Intervention by the public sector in maintaining and improving housing conditions may also act to make core neighborhoods more attractive to more moderate income property owners. The neighborhoods are often well-positioned within the city, close to the downtown and accessible to public transportation. They also offer homes with some of the features characteristic of old houses, such as oak woodwork, hardwood floors and leaded glass, at an affordable price. By providing opportunities for integration of moderate income property owners, capacity within the neighborhood is increased to generate tax revenue, maintain properties and provide social role models. It also serves to deconcentrate poverty in the neighborhoods and thereby might decrease its effects by reducing crime and need for social spending. (This scenario also points to the necessity to provide opportunities for affordable housing in moderate- and higher-income areas to allow for their economic integration and avoid the crowding out associated with gentrification.)

34
This study shows that in addition to these benefits, there are ample public sector fiscal benefits associated with a policy of rehabilitation of vacant houses. One important factor for local policy makers is the extent to which the fiscal benefits are captured by levels of government other than the municipality. This could be used as a justification for greater state and county level participation in housing rehabilitation programs. These non-municipal levels of government also share disproportionately in the costs of demolition or reoccupation. Finally, though the policy debate in St. Paul at this moment focuses on the size of the subsidy provided by the city through Houses to Homes, one cannot assume that reducing the average subsidy from $40,000 to $20,000 will simply produce one-half the benefits described in the report. Our findings are based on actual program experience. The spillover investment (that accounts for the bulk of the benefits associated with rehabilitation) we found resulted from Houses to Homes projects that averaged a $40,000 subsidy. It may well be the case that the amount of rehabilitation bought by a $20,000 subsidy is insufficient to generate any market response. We have no data on this question, nor is there a way to estimate an answer.

35
REFERENCES
Adams, John S., University of Minnesota. “What Can the City of St. Paul Do to Enhance
Residential [and Commercial] Property Values?” Paper presented at the Policy Session on Property Values of the Saint Paul City Council, St. Paul, Minn., 15 May 1996.
and Barbara J. VanDrasek Minneapolis-St. Paul: People, Place and Public Life.
Minneapolis: University of Minnesota, 1993. Blees, Greg, City Council Fiscal Policy Director. Research presented at the Policy Session on
Property Values of the Saint Paul City Council, St. Paul, Minn., 15 May 1996. Bonnish, Rick, St. Louis Community Development Agency. Telephone conversation with
author, 2 July 1996. Bostrom, Gloria. Conversation with author, St. Paul, Minn., 25 July 1996. Chandler, Mittie Olion Urban Homesteading: Programs and Policies. Westport: Greenwood
Press, 1988. City Pages, 7 August 1996. Craig, William J., Miriam Goldfein, Lucy Mathews Heegaard and Fredrick W. Smith
Community Reinvestment in the City of Saint Paul: Are Residents and Businesses Receiving the Financial Services They Need?. Minneapolis: Center for Urban and Regional Affairs, 1990.
Dunn, Jr., James L.. “Bureaucracy and the Bulldozer.” Governing, July 1994, 22. Emrath, Paul. “Features that Influence Home Values.” Housing Economics, December 1995, 8. Fallis, George Housing Economics. Canada: Buttersworth & Co., 1985. Fate, Paul, LISC Program Director. Letter to Dan Cornejo, St. Paul Planning and Economic
Development Director, 8 February 1991. Goetz, Edward G., Hin Kin Lam and Anne Heitlinger There Goes the Neighborhood? The
Impact of Subsidized Multi-Family Housing on Urban Neighborhoods. Minneapolis: Center for Urban and Regional Affairs, 1996.
Hughes, James W. and Kenneth D. Bleakly, Jr. Urban Homesteading. New Brunswick: Center
for Urban Policy Research, 1975. Kohlmeyer, Sheri, Indianapolis Division of Economic and Housing Development. Telephone
conversation with author, 2 July 1996.

36
Lukermann, Barbara, Judith A. Martin and Sandra de Montille Vacant Lands in Minneapolis and
St. Paul: An Examination of the Urban Land Market in the Central City. Minneapolis: Center for Urban and Regional Affairs, 1991.
Martin, Sara, Cincinnati Department of Neighborhood Services. Telephone conversation with
author, 3 July 1996. Metropolitan Council. Housing Redevelopment and Rehabilitation in the Twin Cities
Metropolitan Area: Three Case Studies. St. Paul, November 1995. Moreno, Ana. Cost Effectiveness of Mortgage Foreclosure Prevention. Family Housing Fund
of Minneapolis and Saint Paul, November 1995. Munson, Michael, Metropolitan Council. “Presentation on Regional Demographic Influences on
St. Paul Property Values.” Research presented at the Policy Session on Property Values of the Saint Paul City Council, St. Paul, Minn., 15 May 1996.
New Orleans Times-Picayune, 11 February 1995. Pemberton, Sheri. Telephone conversation with author, 6 September 1996. Philadelphia City Planning Commission. Vacant Land in Philadelphia: A Report on Vacant
Land Management and Neighborhood Restructuring. Philadelphia, June 1995. Ramsey County Historical Society. Discover St. Paul. St. Paul, 1979. Rohe, William M. “Expanding Urban Homesteading: Lessons from the Local Property
Demonstration.” Journal of the American Planning Association, Autumn 1995, 444-455. St. Paul City Council. Saint Paul Housing Policy for the 1990’s: Housing Action Program
1996-1997 (draft). St. Paul, 1996. . Resolution Affirming the Houses to Homes Program Guidelines. Resolution No. 95-
9/27-4. September 1995. . Saint Paul Housing Policy for the 1990’s: Housing Action Program 1994-1995. St.
Paul, 1994. St. Paul Housing and Redevelopment Authority. St. Paul, 28 March 1996. St. Paul Pioneer Press, 28 February 19919 July 1996. St. Paul Planning and Economic Development. Houses to Homes Vacant House Assistance
Program: Guidelines Overview. St. Paul, 1991.

37
St. Paul Planning and Economic Development. Working Paper: How Does Saint
Paul Compare? -- Economic Trends in the 1980s. St. Paul, 1993. St. Paul Planning Commission. Saint Paul Housing Policy for the 1990’s. St. Paul, 1990. Smart, Eric Making Infill Projects Work. Washington, D.C.: ULI-the Urban Land Institute,
1985. Spinnel, Susan, Denver Community Development Housing Section. Letter to author, 14 June
1996. Sweet, David, Portland Buildings Bureau. Telephone conversation with author, 3 July 1996. U.S. Department of Housing and Urban Development. Urban Homesteading: A Guide for
Local Officials. Washington, D.C., 1987. U.S. General Accounting Office. Urban Homesteading: A Good Program Needing
Improvement. Washington, D.C., 1979. University of Maryland Community Planning Studio. Issues and Recommendations on Vacant
Property in Baltimore. Baltimore, Fall 1995. Varady, David Neighborhood Upgrading: A Realistic Assessment. Albany: State University of
New York, 1986.