the first industrial revolution: a puzzle for growth economists
TRANSCRIPT

The First Industrial Revolution: a Puzzle for Growth Economists
Nick Crafts and Larry Neal

The Holy Grail
• To explain the sustained acceleration in economic growth in Britain during the Industrial Revolution
• The Good News: the explicandum is better described
• The Bad News: endogenous growth theory does not yet have a persuasive model that fits the facts

British Industrial Revolution
• Modest growth
• Escape from ‘Malthusian Trap’
• Large structural change
• No take-off but TFP growth increases significantly

Growth in Britain (% per year)
1780-1801 1801-31 1831-73
GDP 1.3 1.9 2.4
Population 1.0 1.4 1.2
Industry 2.0 2.8 3.2
TFP 0.1 0.4 0.8

Malthusian Model Crafts & Mills (2007)
LogW = α - βLogPop + ρt
Trend growth of W is zero till 1800 while ‘Iron Law’ of wages allows population growth at ρ/β =0.5% pre-1800, = 2% post-1800 based on higher ρ
English population in 1800 was 3 x 1550 population but no sign of positive feedback from population to technological progress
The key feature of the industrial revolution is the dog that didn’t bark – rapid population growth was sustained without a collapse in real wages

Employment Composition (%)
1760 1800 1840
Agriculture 52.8 40.8 28.6
Industry 23.8 29.5 47.3
Urbanization 21.0 33.9 48.3

Agricultural/Total Employment at British 1840 Income Level (%)
Belgium 44.4
Britain 22.2
France 44.1
Germany 39.9
Italy 55.4
Netherlands 37.4

Family to Capitalist Farming
• Disappearance of small farms
• Release of surplus labour
• Promotes industrialization
• ‘Explains’ British divergence from ‘European Norm’

Simulated 1841 EconomyCrafts & Harley (2004)
28 41Industrial Employment (%)
47 22Agricultural Employment (%)
69100Industrial Output
105100Agricultural Output
Peasant
2/3Actual

Institutions, Theory
• “Rules of the game” set incentives and constraints for “play” by economic agents.
• “Winners” become incumbents, resist institutional change
• “Losers” adapt, exit, or revolt

Institutions are persistent
• New rules emerge in response to external shocks; they do not evolve gradually
• New institutions are conditioned by adaptations of past losers
• New institutions are fragile; reversals are typical. Legitimacy is hard to establish

Institutions Matter
• Modern economic growth associated with modern institutions:
nation statesecularismconstitutional governmentextension of the franchise

Institutions Matter
• Issue of causality confounded by advantages of backwardness for followers, who can:
substitute capital skip learning stagesadopt most advanced technologyimport capital, skills, institutions

Slow TFP Growth
• Uneven technological progress
• Slow incremental improvements and diffusion of well-known inventions, e.g. steam power
• Disincentives to innovative activity
• Confirmed by growth of wages (Clark, 2005)

TFP Growth
• Much slower and less pervasive than ‘old-hat view’ believed
• Sustained acceleration from 2nd quarter of 19th century indicates new era of growth
• Note the (delayed) impact of steam
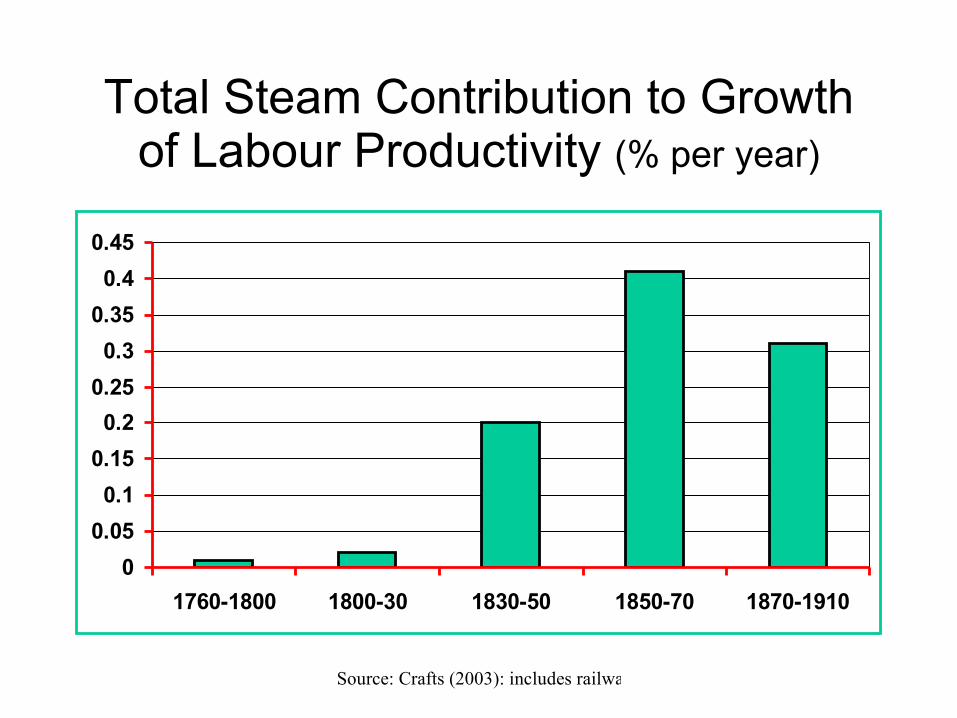
Source: Crafts (2003): includes railway, steamships, steam engines
Total Steam Contribution to Growth of Labour Productivity (% per year)
0
0.05
0.1
0.15
0.2
0.25
0.3
0.35
0.4
0.45
1760-1800 1800-30 1830-50 1850-70 1870-1910

1780-1860: Ingenuity or Abstention ?Crafts (2004b)
• TFP growth accounted for less than 30% of GDP growth
• TFP growth accounted for 70% of labour productivity growth
• TFP growth and new varieties of capital goods accounted for 87% of labour productivity growth

Sources of Labour Productivity Growth, 1780-1860 (Crafts, 2005) (% per year)
0.78Labour Productivity Growth
0.03 Other
0.19 Agriculture
0.34 Modernized Sectors
0.56TFP
0.13 Other
-0.03 Agriculture
0.12 Modernized Sectors
0.22Capital Deepening

Why Was Britain First ?
• Timing of acceleration in TFP growth much harder to explain than structural change
• Search but success not guaranteed
• Inventions and market demand
• The Peso Problem
• Macro-inventions
• NEG and agglomerations

Endogenous Innovation Models
• Expected technological progress is faster if
appropriability of returns improves
productivity of R & D inputs goes up
markets get bigger

Endogenous GrowthSchumpeter relationship (high λ)
Schumpeter (low λ)
Solow (high s)
Solow steady-state relationship (low s)
x
k^

Growth Potential
• In later 18th century quite probable that growth potential higher in Britain than in France or 16th_century Britain (cf. Crafts, 1995)
• Britain better at micro-inventions but what does that tell us about the ex-ante probability of making the decisive inventions in cotton and getting ahead in the key sector ?

Implications for Unified Growth Theory
• Industrial revolution is more than a scale effect of bigger population (cf. Kremer, 1993)
• Period of sustained demographic pressure is prolonged and escape from Malthusian Trap involves substantial increase in TFP growth (cf. Galor & Weil, 2000)
• Understanding the acceleration of technological progress is central; the ‘national innovation system’ (cf Mokyr, 2002) not the size of the population is the heart of the matter

Role of Markets: Land, Labor, Capital, Entrepreneurs
• Markets allocate resources more efficiently than alternative methods: Command economies
Custom in traditional economies• Hicks’ dilemma:
Command is usual response to shocksCustom emerges in absence of shocks

Role of Finance: Mobilize Resources
• Hicks’ resolution of dilemma:European invention of city-states governed by merchant elites committed to maintenance of markets
• Neal’s resolution of dilemma:Governments that use debt markets to respond to shocks committed to use labor and capital markets as well

Tales of Two Institutions

Tales of Two InstitutionsBritish National Debt, 1694-1815
£0
£100
£200
£300
£400
£500
£600
£700
£800
1694
1698
1702
1706
1710
1714
1718
1722
1726
1730
1734
1738
1742
1746
1750
1754
1758
1762
1766
1770
1774
1778
1782
1786
1790
1794
1798
1802
1806
1810
1814
Mil
lio
ns
of
po
un
ds
BookValueDebt
Market Value


Tales of Two Revolutions
• Bordo-White compare UK & France during Napoleonic Wars
• UK wins, despite flexible exchange rates, fiat currency, and tax shocks.Why? Credible commitment for debt
• France loses, despite fixed exchange rates, and balanced budget.Why? Napoleon’s defeat in Russia.

Neal’s Tale of Two Revolutions
• Capital flight initiated by French revolution elimination of feudal rights
• Capital fled to merchant centers throughout Europe, using private trade credit circuits
• British war finance resumes on 18th c. model, fails with fall of Amsterdam, leads to paper pound

Neal’s Tale of French Revolution
• Flexible exchange rate of pound “locks in” foreign capital in London’s capital market
• Continental Blockade destroys UK system of war finance, as intended
• Napoleon’s capital levies throughout conquered Europe increase flight capital to London


Tale of Two Revolutions
• France: establishes property rights, rule of law, constitutional monarchy, and funded government debt by end of 1815.
• New institutions constantly under threat and revised periodically through 1871.
• Lesson: Institutions matter, but hard to legitimate and incorporate in new setting

Tale of Two Revolutions• Great Britain: switches capital formation to
capital goods industry, reducing relative cost of capital permanently (cf. Hicks)
• Key to success is arms-length financial markets maintained by government throughout conflicts with France
• Postwar settlement difficult: Corn Laws, repatriation of capital, de-mobilization,
• TFP resumes rise by 1830, accelerates after 1850