the first industrial revolution: a puzzle for growth economists
DESCRIPTION
The First Industrial Revolution: a Puzzle for Growth Economists. Nick Crafts and Larry Neal. The Holy Grail. To explain the sustained acceleration in economic growth in Britain during the Industrial Revolution The Good News : the explicandum is better described - PowerPoint PPT PresentationTRANSCRIPT

The First Industrial Revolution: a Puzzle for Growth Economists
Nick Crafts and Larry Neal

The Holy Grail
• To explain the sustained acceleration in economic growth in Britain during the Industrial Revolution
• The Good News: the explicandum is better described
• The Bad News: endogenous growth theory does not yet have a persuasive model that fits the facts

British Industrial Revolution
• Modest growth
• Escape from ‘Malthusian Trap’
• Large structural change
• No take-off but TFP growth increases significantly

Growth in Britain (% per year)
1780-1801 1801-31 1831-73
GDP 1.3 1.9 2.4
Population 1.0 1.4 1.2
Industry 2.0 2.8 3.2
TFP 0.1 0.4 0.8

Malthusian Model Crafts & Mills (2007)
LogW = α - βLogPop + ρt
Trend growth of W is zero till 1800 while ‘Iron Law’ of wages allows population growth at ρ/β =0.5% pre-1800, = 2% post-1800 based on higher ρ
English population in 1800 was 3 x 1550 population but no sign of positive feedback from population to technological progress
The key feature of the industrial revolution is the dog that didn’t bark – rapid population growth was sustained without a collapse in real wages

Employment Composition (%)
1760 1800 1840
Agriculture 52.8 40.8 28.6
Industry 23.8 29.5 47.3
Urbanization 21.0 33.9 48.3

Agricultural/Total Employment at British 1840 Income Level (%)
Belgium 44.4
Britain 22.2
France 44.1
Germany 39.9
Italy 55.4
Netherlands 37.4

Family to Capitalist Farming
• Disappearance of small farms
• Release of surplus labour
• Promotes industrialization
• ‘Explains’ British divergence from ‘European Norm’

Simulated 1841 EconomyCrafts & Harley (2004)
Actual 2/3
Peasant
Agricultural Output 100 105
Industrial Output 100 69
Agricultural Employment (%) 22 47
Industrial Employment (%) 41 28

Institutions, Theory
• “Rules of the game” set incentives and constraints for “play” by economic agents.
• “Winners” become incumbents, resist institutional change
• “Losers” adapt, exit, or revolt

Institutions are persistent
• New rules emerge in response to external shocks; they do not evolve gradually
• New institutions are conditioned by adaptations of past losers
• New institutions are fragile; reversals are typical. Legitimacy is hard to establish

Institutions Matter
• Modern economic growth associated with modern institutions:
nation statesecularismconstitutional governmentextension of the franchise

Institutions Matter
• Issue of causality confounded by advantages of backwardness for followers, who can:
substitute capital skip learning stagesadopt most advanced technologyimport capital, skills, institutions

Slow TFP Growth
• Uneven technological progress
• Slow incremental improvements and diffusion of well-known inventions, e.g. steam power
• Disincentives to innovative activity
• Confirmed by growth of wages (Clark, 2005)

TFP Growth
• Much slower and less pervasive than ‘old-hat view’ believed
• Sustained acceleration from 2nd quarter of 19th century indicates new era of growth
• Note the (delayed) impact of steam

Source: Crafts (2003): includes railway, steamships, steam engines
Total Steam Contribution to Growth of Labour Productivity (% per year)
0
0.05
0.1
0.15
0.2
0.25
0.3
0.35
0.4
0.45
1760-1800 1800-30 1830-50 1850-70 1870-1910

1780-1860: Ingenuity or Abstention ?Crafts (2004b)
• TFP growth accounted for less than 30% of GDP growth
• TFP growth accounted for 70% of labour productivity growth
• TFP growth and new varieties of capital goods accounted for 87% of labour productivity growth
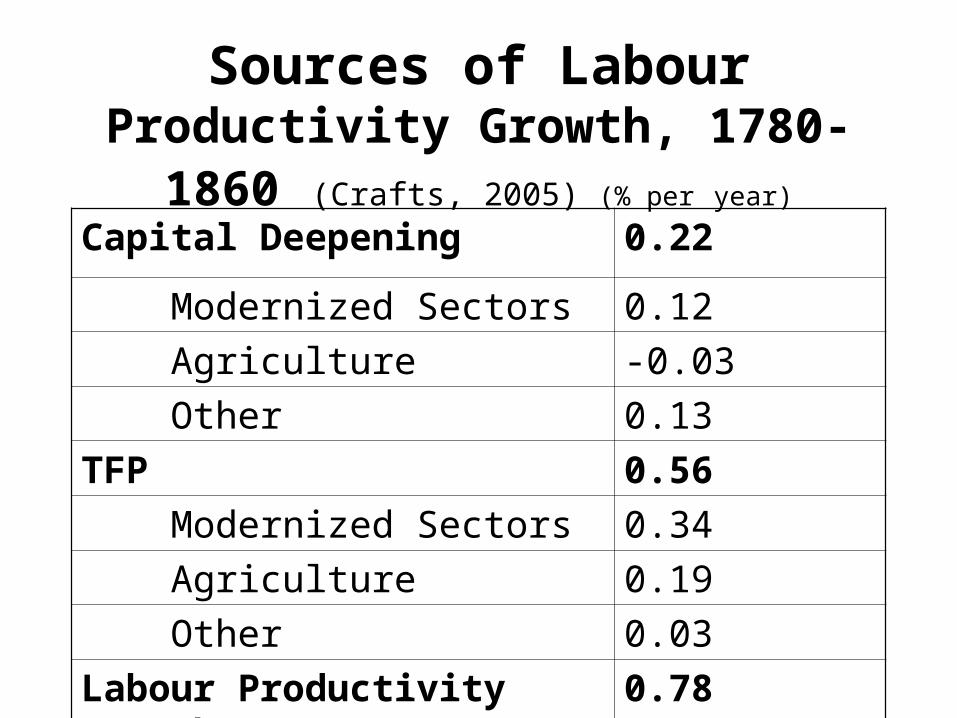
Sources of Labour Productivity Growth, 1780-1860 (Crafts, 2005) (% per year)
Capital Deepening 0.22
Modernized Sectors 0.12
Agriculture -0.03
Other 0.13
TFP 0.56
Modernized Sectors 0.34
Agriculture 0.19
Other 0.03
Labour Productivity Growth 0.78

Why Was Britain First ?
• Timing of acceleration in TFP growth much harder to explain than structural change
• Search but success not guaranteed
• Inventions and market demand
• The Peso Problem
• Macro-inventions
• NEG and agglomerations

Endogenous Innovation Models
• Expected technological progress is faster if
appropriability of returns improves
productivity of R & D inputs goes up
markets get bigger

Endogenous GrowthSchumpeter relationship (high λ)
Schumpeter (low λ)
Solow (high s)
Solow steady-state relationship (low s)
x
k^

Growth Potential
• In later 18th century quite probable that growth potential higher in Britain than in France or 16th_century Britain (cf. Crafts, 1995)
• Britain better at micro-inventions but what does that tell us about the ex-ante probability of making the decisive inventions in cotton and getting ahead in the key sector ?

Implications for Unified Growth Theory
• Industrial revolution is more than a scale effect of bigger population (cf. Kremer, 1993)
• Period of sustained demographic pressure is prolonged and escape from Malthusian Trap involves substantial increase in TFP growth (cf. Galor & Weil, 2000)
• Understanding the acceleration of technological progress is central; the ‘national innovation system’ (cf Mokyr, 2002) not the size of the population is the heart of the matter

Role of Markets: Land, Labor, Capital, Entrepreneurs
• Markets allocate resources more efficiently than alternative methods: Command economies
Custom in traditional economies
• Hicks’ dilemma:Command is usual response to shocksCustom emerges in absence of shocks

Role of Finance: Mobilize Resources
• Hicks’ resolution of dilemma:European invention of city-states governed by merchant elites committed to maintenance of markets
• Neal’s resolution of dilemma:Governments that use debt markets to respond to shocks committed to use labor and capital markets as well

Tales of Two Institutions

Tales of Two InstitutionsBritish National Debt, 1694-1815
£0
£100
£200
£300
£400
£500
£600
£700
£800
Mil
lio
ns
of
po
un
ds
BookValueDebt
Market Value


Tales of Two Revolutions
• Bordo-White compare UK & France during Napoleonic Wars
• UK wins, despite flexible exchange rates, fiat currency, and tax shocks.Why? Credible commitment for debt
• France loses, despite fixed exchange rates, and balanced budget.Why? Napoleon’s defeat in Russia.

Neal’s Tale of Two Revolutions
• Capital flight initiated by French revolution elimination of feudal rights
• Capital fled to merchant centers throughout Europe, using private trade credit circuits
• British war finance resumes on 18th c. model, fails with fall of Amsterdam, leads to paper pound

Neal’s Tale of French Revolution
• Flexible exchange rate of pound “locks in” foreign capital in London’s capital market
• Continental Blockade destroys UK system of war finance, as intended
• Napoleon’s capital levies throughout conquered Europe increase flight capital to London


Tale of Two Revolutions
• France: establishes property rights, rule of law, constitutional monarchy, and funded government debt by end of 1815.
• New institutions constantly under threat and revised periodically through 1871.
• Lesson: Institutions matter, but hard to legitimate and incorporate in new setting
Tale of Two Revolutions• Great Britain: switches capital formation to
capital goods industry, reducing relative cost of capital permanently (cf. Hicks)
• Key to success is arms-length financial markets maintained by government throughout conflicts with France
• Postwar settlement difficult: Corn Laws, repatriation of capital, de-mobilization,
• TFP resumes rise by 1830, accelerates after 1850