the fester locus in botryllus schlosseri experiences selection
TRANSCRIPT

Nydam and De Tomaso BMC Evolutionary Biology 2012, 12:249http://www.biomedcentral.com/1471-2148/12/249
RESEARCH ARTICLE Open Access
The fester locus in Botryllus schlosseri experiencesselectionMarie L Nydam1* and Anthony W De Tomaso2
Abstract
Background: Allorecognition, the ability of an organism to distinguish self from non-self, occurs throughout theentire tree of life. Despite the prevalence and importance of allorecognition systems, the genetic basis ofallorecognition has rarely been characterized outside the well-known MHC (Major Histocompatibility Complex) invertebrates and SI (Self-Incompatibility) in plants. Where loci have been identified, their evolutionary history is anopen question. We have previously identified the genes involved in self/non-self recognition in the colonialascidian Botryllus schlosseri, and we can now begin to investigate their evolution. In B. schlosseri, colonies sharing 1or more alleles of a gene called FuHC (Fusion Histocompatibility) will fuse. Protein products of a locus called fester,located ~300 kb from FuHC, have been shown to play multiple roles in the histocompatibility reaction, as activatingand/or inhibitory receptors. We test whether the proteins encoded by this locus are evolving neutrally or areexperiencing balancing, directional, or purifying selection.
Results: Nearly all of the variation in the fester locus resides within populations. The 13 housekeeping genes(12 nuclear genes and mitochondrial cytochrome oxidase I) have substantially more structure among populationswithin groups and among groups than fester. All polymorphism statistics (Tajima's D, Fu and Li's D* and F*) aresignificantly negative for the East Coast A-type alleles, and Fu and Li's F* statistic is significantly negative forthe West Coast A-type alleles. These results are likely due to selection rather than demography, given that 10of the housekeeping loci have no populations with significant values for any of the polymorphism statistics.The majority of codons in the fester proteins have ω values < 1, but 15–27 codons have > 95% posterior probabilityof ω values > 1.
Conclusion: Fester proteins are evolving non-neutrally. The polymorphism statistics are consistent with eitherpurifying selection or directional selection. The ω statistics show that the majority of the protein is experiencingpurifying selection (ω < 1), but that 15–27 codons are undergoing either balancing or directional selection: ω > 1 iscompatible with either scenario. The distribution of variation within and among populations points towardsbalancing selection and away from directional selection. While these data do not provide unambiguous support fora specific type of selection, they contribute to our evolutionary understanding of a critical biological process bydetermining the forces that affect loci involved in allorecognition.
Keywords: Allorecognition, Selection, Fester, Botryllus schlosseri
* Correspondence: [email protected] of Science and Mathematics, Centre College, 600 W. Walnut Street,Danville, KY 40422, USAFull list of author information is available at the end of the article
© 2012 Nydam and De Tomaso; licensee BioMed Central Ltd. This is an Open Access article distributed under the terms of theCreative Commons Attribution License (http://creativecommons.org/licenses/by/2.0), which permits unrestricted use,distribution, and reproduction in any medium, provided the original work is properly cited.

A
A
A
B1
B1
B1
B2
B2
B2
Figure 1 Cartoon of the fester genomic structure. Top panel:A/A homozygote, Middle Panel: A/B1/B2 heterozygote, BottomPanel: B1/B2/B1/B2 heterozygote. The C haplotype is not includedbecause its composition and location relative to the A and Bhaplotypes is unknown.
Nydam and De Tomaso BMC Evolutionary Biology 2012, 12:249 Page 2 of 16http://www.biomedcentral.com/1471-2148/12/249
BackgroundAllorecognition is the ability of an organism to differen-tiate self or close relatives from unrelated individuals.Examples of allorecognition include the self-incompatibility (SI) systems in plants, vertebrate im-mune response to foreign antigens mediated by MHCloci, and fusion/rejection, where two genetically inde-pendent individuals physically join to become a singleindividual or reject each other. Effective allorecognitionsystems are critical to the survival of organisms: the SIloci prevent inbreeding depression, T-lymphocytes edu-cated by MHC molecules protect vertebrates againstpathogens, and fusing to a closely related individual canprovide competitive and reproductive advantages wherespace is limited and reproductive output is based on thesize of the organism [1]. Allorecognition occurs acrossthe tree of life [1], in anemones [2], angiosperms [3],ascidians [4-6], bacteria [7], bryozoans [8], cellular slimemolds [9], corals [10], fungi [11], hydroids [12], gymnos-perms [13,14], plasmodial slime molds [15], red algae[16], sponges [17], and vertebrates [18].Despite the prevalence and importance of allorecogni-
tion systems, the genetic basis of allorecognition hasrarely been characterized outside the well-known MHCin vertebrates and SI in plants. The genes responsible forallorecognition have recently been identified in a handfulof systems: a bacterium [7], a colonial ascidian [19], acellular slime mold [20], fungi [11], a hydroid [21], and asolitary ascidian [6]. Only in the ascidian systems havewe identified putative receptor-ligand pairs [22]; ligandsbind to receptors on the cell surface.In the colonial ascidian Botryllus schlosseri, allorecog-
nition occurs when terminal projections of an extracor-poreal vasculature, called ampullae, come into contactbetween juxtaposed colonies. If colonies are compatible,the ampullae will fuse, forming a parabiosis betweenthe two colonies. If they are incompatible, the ampullaewill undergo a rejection reaction which prevents vas-cular fusion. The polymorphisms of a gene called FuHC(Fusion/HistoCompatibility) determine 100% of histo-compatibility outcomes between interacting colonies:fusion occurs if the colonies share 1 or more FuHCalleles [19, Nydam et al., unpublished data].Another polymorphic locus, called fester, is encoded
~300 Kb from the FuHC; FuHC and fester are tightlylinked [22]. Fester appears to encode a cell-surface re-ceptor involved in multiple aspects of histocompatibilityin B. schlosseri. From a genetic standpoint, fester displaysa characteristic reminiscent of all immune genes –diversity.Fester achieves diversity through several mechanisms.
First, the locus is highly polymorphic, and encodes over60 protein alleles, although these polymorphisms do notcontribute to histocompatibility outcomes [22]. Because
fester is likely a receptor of the ligand FuHC [22], thesepolymorphisms can tell us how fester and FuHC interactat the molecular level to determine histocompatibilityoutcomes. Specifically, regions of high polymorphism infester could indicate domains that bind with FuHC, andvice versa.Second, a preliminary phylogenetic analysis of fester
coding sequences split them into 4 groups: A, B1, B2,and C [22]. The A haplotype has a single copy of fester,while the B haplotype encodes 2 linked duplicates (B1and B2). At present, the composition of the C haplotypeis unknown. There are no other fester genes anywhereelse, based on our crossing data [22]. We will use theterm haplotype to refer to the A, B1/B2 and C haplo-types in this article. Figure 1 provides a visual represen-tation of these haplotypes.Finally, the fester locus is diversified in each colony via
alternative splicing [22]. The fester locus is encoded in11 exons, 6 of which can be alternatively spliced in allcombinations, making a total of 64 potential splice var-iants. Each colony examined expresses a full-length festermRNA, 3 common alternative splice variants, as well asa unique repertoire of 8–24 different alternative splicevariants; Exons 6 and 7 are very commonly spliced out[22]. Exons 1–7 correspond to the extracellular domainof the protein, and Exons 8–10 to 3 predicted trans-membrane domains [22]. In the present data set, thePCR primers always amplified all 11 exons. However, thefull-length cDNA was rarely incorporated into the bac-terial vector; the longest amplicons recovered fromthe cloning process were almost always missing Exons 6and 7.Functionally, 2 experiments support a role of the fester
protein in histocompatibility. A monoclonal antibody(mAB) experiment, whereby the histocompatibility reac-tion is interrupted by a mAB that binds to and activatesthe fester protein, resulted in a rejection being converted

Nydam and De Tomaso BMC Evolutionary Biology 2012, 12:249 Page 3 of 16http://www.biomedcentral.com/1471-2148/12/249
to a fusion. This conversion only occurred in pairings in-volving fester genotypes that expressed the fester allelethat binds to the mAB [22]. Fester could therefore be areceptor which binds to FuHC, blocking an ongoing re-jection reaction and initiating the fusion event [22]. Incontrast, a siRNA experiment, in which the expressionof the fester protein is blocked, turned both fusion andrejection phenotypes into no response phenotypes, andampullae were inert [22]. This result suggests that festeralso plays a role in initiating the rejection reaction.Given this dual role, if fester is not expressed, no histo-compatibility reaction occurs: a rejection reaction cannotoccur because it is not initiated, and a fusion cannotoccur because no receptors can detect the FuHC.We know very little about the evolution of allore-
cognition loci outside MHC and SI, but we have severalreasons to hypothesize that loci like fester may be evolv-ing non-neutrally. First, abundant evidence exists forselection acting on both ligands and receptors directlyinvolved in MHC (reviewed in [23,24]) and SI (reviewedin [25]). Second, fester is highly polymorphic [22]; aneutral model of evolution is unlikely to explain allelicdiversity found in fester and other allorecognitionloci [26].We will use three approaches to infer whether fester is
experiencing selection or genetic drift: distribution ofpolymorphism within and among populations (AMOVAand FST calculations), polymorphism statistics, and ωstatistics. AMOVA and FST values for fester alleles willbe compared to housekeeping genes. If the fester allelesare outliers with respect to the housekeeping loci, thiswill be taken as evidence for selection. Polymorphismstatistics (D, D*, F*) look for evidence of selection usinga genealogical framework; values significantly differentfrom zero are evidence for selection. The ω statistic cal-culates the posterior probability that particular codonsare experiencing selection.If selection is acting on fester, we will examine the sup-
port for three types of selection: balancing, directional,and purifying. Using AMOVA and FST statistics, a lowamount of polymorphism within populations comparedto housekeeping genes is consistent with directional se-lection; the opposite pattern is consistent with balancingselection [27]. Polymorphism statistics (D, D*, F*) areless than zero when purifying or directional selection isoperating, and greater than zero when balancing selec-tion is operating [28,29]. An ω value greater than 1 sup-ports directional or balancing selection, and less than 1supports purifying selection [30]. In the few cases whereallorecognition loci have been studied in an evolutionaryframework, balancing selection is more prevalent thanpurifying or directional selection [25]. If we find thatfester alleles evolve under selection, we therefore expectto find evidence for balancing selection.
ResultsSamplingColonies were collected from floating docks in each of 6populations in 2009 and 2010: Falmouth, MA, Quissett,MA, Sandwich, MA, Monterey, CA, Santa Barbara, CAand Seattle, WA. Falmouth, MA and Quissett, MA are 3miles apart, on Vineyard Sound and Buzzards Bay, re-spectively. Sandwich, MA is 25 miles from the Fal-mouth/Quissett area, on Cape Cod Bay. Santa Barbara,CA is 237 miles south of Monterey, CA and 1,113 milessouth of Seattle, WA.
Relationships among fester haplotypesWe constructed phylogenetic trees to evaluate the evolu-tionary relationships between the fester haplotypes. MLand Bayesian methods show the A-type alleles, the B1/B2-type alleles and the C-type alleles to be monophyleticgroups (Figure 2, Additional file 1). In all analyses, the 2B2-type alleles group together, but B1 is paraphyleticwith respect to B2. The B2 clade has strong support(Bayesian posterior probability = 1.0, ML bootstrapvalue = 0.93).
Comparison of variation among fester allele typesWe compared variation and diversity among fester alleletypes to inform our understanding of the evolution ofthese allele types. Significantly more variation exists inthe A clade than in either B1/B2 or C. Dxy/Da valuesquantify this disparity: A clade vs. B1/B2 clade = 0.061/0.050, A clade vs. C clade = 0.061/0.051, B1/B2 clade vs.C clade = 0.047/0.032. Because Da corrects for within-allele type variation, the higher variation in the A-typealleles is not an artifact of more colonies having A-typealleles than B1/B2 or C-type alleles.When A-type alleles are compared between East Coast
and West Coast, several measures of diversity (π basedon all sites, π based on synonymous sites, Watterson'sΘ, and haplotype diversity) are larger for the East Coastgroup than for the West Coast group (Table 1). Wesampled 22 colonies with A-type alleles from the EastCoast, and 18 colonies with A-type alleles from the WestCoast.
RecombinationAll populations (A-type East and West Coasts, B1-typeand C-type East Coast) experience intragenic recombin-ation. 2 and 1 minimum number of recombinationevents (Rm) are found in the A-type East and WestCoast groups, respectively. For A-type East Coast, re-combination is detected between sites 279,300 (in Exon3) and 338,731 (between Exons 4 and 8). For A-typeWest Coast, recombination is detected between sites447,701 (between Exons 4 and 8). Significant negativecorrelations between physical distance and all 3
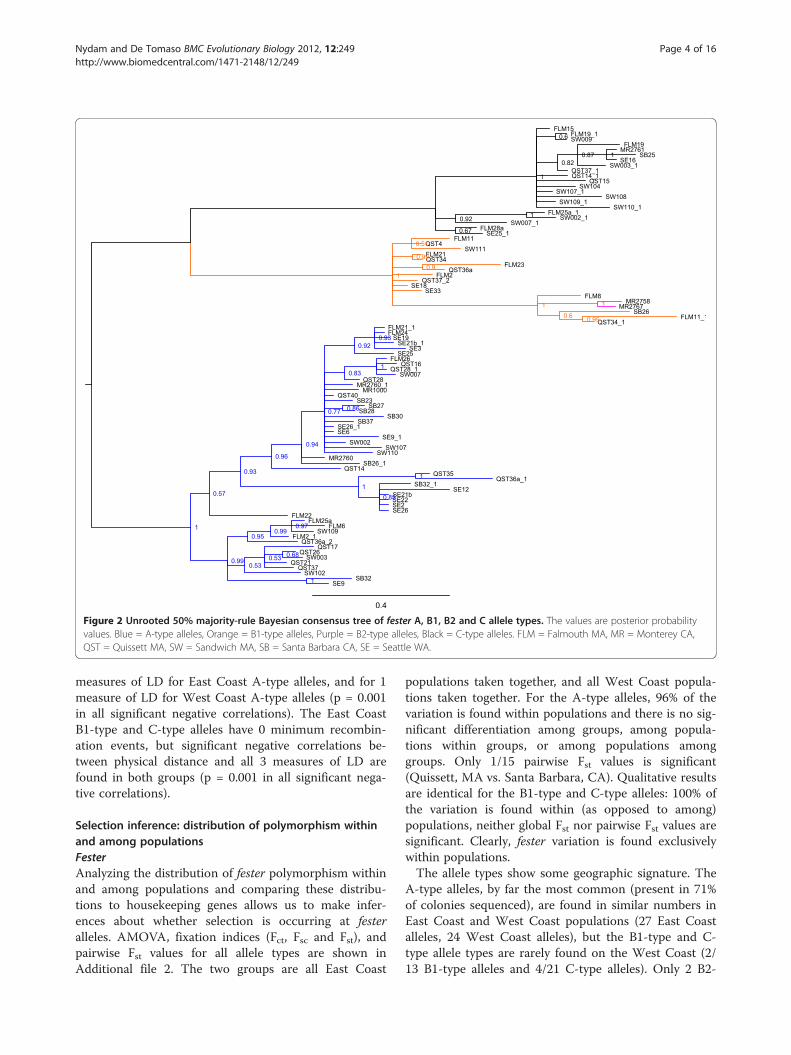
Figure 2 Unrooted 50% majority-rule Bayesian consensus tree of fester A, B1, B2 and C allele types. The values are posterior probabilityvalues. Blue = A-type alleles, Orange = B1-type alleles, Purple = B2-type alleles, Black = C-type alleles. FLM = Falmouth MA, MR = Monterey CA,QST = Quissett MA, SW = Sandwich MA, SB = Santa Barbara CA, SE = Seattle WA.
Nydam and De Tomaso BMC Evolutionary Biology 2012, 12:249 Page 4 of 16http://www.biomedcentral.com/1471-2148/12/249
measures of LD for East Coast A-type alleles, and for 1measure of LD for West Coast A-type alleles (p = 0.001in all significant negative correlations). The East CoastB1-type and C-type alleles have 0 minimum recombin-ation events, but significant negative correlations be-tween physical distance and all 3 measures of LD arefound in both groups (p = 0.001 in all significant nega-tive correlations).
Selection inference: distribution of polymorphism withinand among populationsFesterAnalyzing the distribution of fester polymorphism withinand among populations and comparing these distribu-tions to housekeeping genes allows us to make infer-ences about whether selection is occurring at festeralleles. AMOVA, fixation indices (Fct, Fsc and Fst), andpairwise Fst values for all allele types are shown inAdditional file 2. The two groups are all East Coast
populations taken together, and all West Coast popula-tions taken together. For the A-type alleles, 96% of thevariation is found within populations and there is no sig-nificant differentiation among groups, among popula-tions within groups, or among populations amonggroups. Only 1/15 pairwise Fst values is significant(Quissett, MA vs. Santa Barbara, CA). Qualitative resultsare identical for the B1-type and C-type alleles: 100% ofthe variation is found within (as opposed to among)populations, neither global Fst nor pairwise Fst values aresignificant. Clearly, fester variation is found exclusivelywithin populations.The allele types show some geographic signature. The
A-type alleles, by far the most common (present in 71%of colonies sequenced), are found in similar numbers inEast Coast and West Coast populations (27 East Coastalleles, 24 West Coast alleles), but the B1-type and C-type allele types are rarely found on the West Coast (2/13 B1-type alleles and 4/21 C-type alleles). Only 2 B2-

Table 1 π, θ-w, # haplotypes, haplotype diversity
Fester A-type alleles
Population π (All Sites) π (Synonymous) π (Nonsynonymous) Θ-w (per site) # Haplotypes Haplotype diversity
East Coast 0.020 0.020 0.010 0.030 17 0.96
West Coast 0.010 0.010 0.010 0.010 13 0.90
Fester B1-type alleles
Population π (All Sites) π (Synonymous) π (Nonsynonymous) Θ-w (per site) # Haplotypes Haplotype diversity
East Coast 0.010 0.030 0.010 0.010 8 0.95
Fester C-type alleles
Population π (All Sites) π (Synonymous) π (Nonsynonymous) Θ-w (per site) # Haplotypes Haplotype diversity
East Coast 0.010 0.030 0.010 0.020 13 0.93
40S_3A
Population π (All Sites) π (Synonymous) π (Nonsynonymous) Θ-w (per site) # Haplotypes Haplotype diversity
Falmouth, MA 0.001 0.014 0.000 0.002 6 0.533
Quissett, MA 0.001 0.004 0.000 0.001 3 0.600
Sandwich, MA 0.002 0.011 0.000 0.002 3 0.833
Monterey, CA NA NA NA NA 1 0.000
Santa Barbara, CA 0.006 0.025 0.000 0.006 2 0.500
Seattle, WA 0.009 0.040 0.000 0.007 3 0.800
All populations 0.003 0.014 0.000 0.005 9 0.658
60S_L6
Population π (All Sites) π (Synonymous) π (Nonsynonymous) Θ-w (per site) # Haplotypes Haplotype diversity
Falmouth, MA 0.002 0.006 0.001 0.003 5 0.455
Quissett, MA 0.001 0.003 0.000 0.002 5 0.433
Sandwich, MA 0.002 0.005 0.000 0.002 5 0.547
Monterey, CA 0.008 0.015 0.006 0.008 3 0.511
Santa Barbara, CA 0.002 0.004 0.002 0.004 8 0.699
Seattle, WA 0.002 0.007 0.001 0.003 8 0.678
All populations 0.003 0.008 0.002 0.007 18 0.711
60S_L8
Population π (All Sites) π (Synonymous) π (Nonsynonymous) Θ-w (per site) # Haplotypes Haplotype diversity
Falmouth, MA 0.001 0.003 0.001 0.002 5 0.524
Quissett, MA 0.002 0.004 0.001 0.002 5 0.599
Sandwich, MA 0.002 0.003 0.001 0.002 3 0.833
Monterey, CA 0.001 0.003 0.000 0.001 2 0.500
Santa Barbara, CA NA NA NA NA NA NA
Seattle, WA 0.001 0.002 0.001 0.001 3 0.506
All populations 0.002 0.003 0.001 0.001 5 0.593
60S_L10
Population π (All Sites) π (Synonymous) π (Nonsynonymous) Θ-w (per site) # Haplotypes Haplotype diversity
Falmouth, MA 0.005 0.020 0.000 0.007 7 0.393
Quissett, MA 0.007 0.032 0.000 0.007 6 0.693
Sandwich, MA 0.003 0.014 0.000 0.004 2 0.333
Monterey, CA 0.009 0.039 0.000 0.009 6 0.929
Santa Barbara, CA 0.010 0.041 0.000 0.009 7 0.911
Seattle, WA 0.008 0.035 0.000 0.005 10 0.776
All populations 0.008 0.036 0.000 0.007 18 0.672
Nydam and De Tomaso BMC Evolutionary Biology 2012, 12:249 Page 5 of 16http://www.biomedcentral.com/1471-2148/12/249

Table 1 π, θ-w, # haplotypes, haplotype diversity (Continued)
60S_L13
Population π (All Sites) π (Synonymous) π (Nonsynonymous) Θ-w (per site) # Haplotypes Haplotype diversity
Falmouth, MA 0.007 0.018 0.004 0.005 13 0.833
Quissett, MA 0.008 0.019 0.004 0.006 7 0.655
Sandwich, MA 0.006 0.016 0.004 0.007 2 0.500
Monterey, CA 0.003 0.009 0.001 0.002 3 0.644
Santa Barbara, CA 0.007 0.021 0.003 0.005 4 0.714
Seattle, WA 0.008 0.026 0.003 0.006 16 0.903
All populations 0.010 0.028 0.004 0.006 19 0.833
71kda
Population π (All Sites) π (Synonymous) π (Nonsynonymous) Θ-w (per site) # Haplotypes Haplotype diversity
Falmouth, MA 0.004 0.014 0.000 0.005 10 0.804
Quissett, MA 0.004 0.014 0.001 0.005 9 0.735
Sandwich, MA 0.006 0.023 0.001 0.006 13 0.896
Monterey, CA 0.009 0.037 0.000 0.007 5 0.867
Santa Barbara, CA 0.008 0.032 0.000 0.006 19 0.943
Seattle, WA 0.004 0.014 0.001 0.004 7 0.909
All populations 0.008 0.029 0.001 0.007 47 0.906
actin
Population π (All Sites) π (Synonymous) π (Nonsynonymous) Θ-w (per site) # Haplotypes Haplotype diversity
Falmouth, MA 0.004 0.017 0.000 0.005 12 0.879
Quissett, MA 0.006 0.025 0.000 0.005 14 0.931
Sandwich, MA 0.005 0.021 0.000 0.006 12 0.918
Monterey, CA 0.004 0.015 0.000 0.004 4 0.652
Santa Barbara, CA 0.005 0.022 0.000 0.005 18 0.954
Seattle, WA 0.005 0.020 0.000 0.004 6 0.818
All populations 0.005 0.022 0.000 0.007 44 0.924
ADP/ATP translocase
Population π (All Sites) π (Synonymous) π (Nonsynonymous) Θ-w (per site) # Haplotypes Haplotype diversity
Falmouth, MA 0.008 0.029 0.001 0.007 13 0.863
Quissett, MA 0.014 0.052 0.002 0.014 3 0.833
Sandwich, MA 0.005 0.020 0.000 0.005 3 0.833
Monterey, CA 0.020 0.082 0.000 0.020 2 1.000
Santa Barbara, CA NA NA NA NA NA NA
Seattle, WA 0.012 0.046 0.001 0.012 4 1.000
All populations 0.009 0.034 0.001 0.007 18 0.915
Hsp90
Population π (All Sites) π (Synonymous) π (Nonsynonymous) Θ-w (per site) # Haplotypes Haplotype diversity
Falmouth, MA 0.015 0.065 0.001 0.020 13 0.788
Quissett, MA 0.010 0.044 0.001 0.016 13 0.812
Sandwich, MA 0.018 0.079 0.001 0.012 7 0.911
Monterey, CA 0.002 0.008 0.000 0.002 8 0.909
Santa Barbara, CA 0.002 0.008 0.000 0.002 9 0.815
Seattle, WA 0.014 0.063 0.001 0.013 3 0.464
All populations 0.010 0.045 0.001 0.014 23 0.685
Nydam and De Tomaso BMC Evolutionary Biology 2012, 12:249 Page 6 of 16http://www.biomedcentral.com/1471-2148/12/249

Table 1 π, θ-w, # haplotypes, haplotype diversity (Continued)
ma2_actin
Population π (All Sites) π (Synonymous) π (Nonsynonymous) Θ-w (per site) # Haplotypes Haplotype diversity
Falmouth, MA 0.003 0.013 0.000 0.004 9 0.831
Quissett, MA 0.004 0.016 0.000 0.004 8 0.857
Sandwich, MA 0.003 0.011 0.000 0.004 7 0.768
Monterey, CA 0.004 0.017 0.000 0.006 3 0.385
Santa Barbara, CA 0.004 0.016 0.000 0.004 4 0.458
Seattle, WA 0.003 0.016 0.000 0.003 4 0.542
All populations 0.005 0.019 0.000 0.006 13 0.777
mtCOI
Population π (All Sites) π (Synonymous) π (Nonsynonymous) Θ-w (per site) # Haplotypes Haplotype diversity
Falmouth, MA 0.009 0.031 0.002 0.016 4 0.491
Quissett, MA 0.007 0.035 0.002 0.010 5 0.405
Sandwich, MA 0.026 0.094 0.004 0.158 3 0.833
Monterey, CA 0.002 0.007 0.000 0.003 2 0.400
Santa Barbara, CA 0.004 0.015 0.002 0.010 6 0.468
Seattle, WA 0.025 0.105 0.002 0.018 4 0.711
All populations 0.021 0.093 0.002 0.013 11 0.725
vasa
Population π (All Sites) π (Synonymous) π (Nonsynonymous) Θ-w (per site) # Haplotypes Haplotype diversity
Falmouth, MA 0.004 0.011 0.001 0.004 6 0.733
Quissett, MA 0.020 0.080 0.002 0.020 7 0.800
Sandwich, MA 0.023 0.095 0.000 0.020 10 0.970
Monterey, CA 0.012 0.047 0.001 0.010 5 0.857
Santa Barbara, CA 0.025 0.097 0.003 0.020 8 0.859
Seattle, WA 0.013 0.055 0.000 0.011 5 0.861
All populations 0.022 0.088 0.002 0.026 23 0.750
Vigilin
Population π (All Sites) π (Synonymous) π (Nonsynonymous) Θ-w (per site) # Haplotypes Haplotype diversity
Falmouth, MA 0.011 0.037 0.004 0.017 9 0.934
Quissett, MA 0.023 0.080 0.007 0.017 15 0.980
Sandwich, MA 0.019 0.065 0.007 0.016 11 0.958
Monterey, CA 0.018 0.069 0.004 0.018 5 0.893
Santa Barbara, CA 0.018 0.070 0.004 0.016 23 0.938
Seattle, WA 0.018 0.064 0.004 0.017 5 0.822
All populations 0.024 0.088 0.006 0.016 55 0.971
Nydam and De Tomaso BMC Evolutionary Biology 2012, 12:249 Page 7 of 16http://www.biomedcentral.com/1471-2148/12/249
type alleles are present in our samples, and althoughthey are both found in the Monterey population, wecannot conclude anything about the geographic structur-ing of this allele type with so few samples.
Housekeeping genesThe housekeeping genes are as follows: mitochondrialCOI, 40S ribosomal protein 3A, 60S ribosomal proteinL6, 60S ribosomal protein L8, 60S ribosomal proteinL10, 60S ribosomal protein L13, adult-type muscle actin
2, heat shock cognate 71kda protein, cytoplasmic actin2, ADP/ATP translocase 3, heat shock protein HSP-90beta, vasa, and vigilin. The housekeeping genes show apattern that contrasts with fester. All housekeeping locihave a substantially lower percentage of the variationwithin populations than fester (Figure 3). All loci have asubstantially higher percentage of the variation amonggroups than fester although Fct is not significant for anylocus (Additional file 2). All loci have a substantiallyhigher percentage of the variation among populations

F F F H H H H H H H H H H H H H
Gene Type
Per
cent
age
varia
tion
with
in p
opul
atio
ns
020
4060
8010
0
F = Fester
H = Housekeeping Gene
Figure 3 Comparison of percentage of variation found withinpopulations between fester and housekeeping genes. Festertypes are labeled "F", and housekeeping genes are labeled "H". Thethree fester values are A-type, B1-type and C-type. These numberswere derived from AMOVA (analyses of molecular variance), whichare presented in their entirety in Additional file 2. The bars from leftto right correspond to the following genes: fester B1-type, fester C-type, fester A-type, cytoplasmic actin 2, 60S ribosomal protein L10,60S ribosomal protein L13, mitochondrial COI, 60S ribosomal proteinL8, 60S ribosomal protein L6, 40S ribosomal protein 3A, ADP/ATPtranslocase 3, adult-type muscle actin 2, vigilin, heat shock cognate71 kda protein, heat shock protein HSP-90 beta, and vasa.
Table 2 Tajima's D, Fu and Li's D* and F* statistics forfester A, B1 and C allele types
Allele type and Location Tajima'sD value
Fu and Li'sD* value
Fu and Li'sF* value
A-type alleles East Coast −1.31* −1.96* −1.96*
A-type alleles West Coast −1.01 −0.85 −0.95*
B1-type alleles East Coast −0.99 −0.27 −0.52
C-type alleles East Coast −1.26 −1.51 −1.67
Asterisks represent D, D* or F* values with associated p values that are lessthan 0.05.
Nydam and De Tomaso BMC Evolutionary Biology 2012, 12:249 Page 8 of 16http://www.biomedcentral.com/1471-2148/12/249
within groups than fester, and Fsc is significant for all locibut 1 (Additional file 2). Significant differentiation existsamong populations among groups: overall Fst is signifi-cant for all loci, and a majority of pairwise Fst values aresignificant.
Tests of selection: polymorphism statisticsFesterTable 1 shows θ and π for each allele type. For the A-type alleles, East Coast has higher levels of polymorph-ism than West Coast. B1-type and C-type East Coastgroups have polymorphism values similar to those of theA-type West Coast group.Table 2 displays Tajima's D values for A-type East and
West Coasts, and B1-type/C-type East Coast. Coalescentsimulations given θ and segregating sites show similar p-values (and always with the same qualitative result), soonly results from the simulations given θ will be shown.A-type: D values are significantly negative for East Coastonly. B1-type and C type East Coast D values are alsonegative, but are not statistically significant.Fu and Li's D* and F* values are presented in Table 2.
Coalescent simulations given θ and segregating sitesshow similar p-values (and always with the same
qualitative result), so only results from the simulationsgiven θ will be shown. Both A-type groups have signifi-cantly negative D* values, but only East Coast has sig-nificantly negative F* values. Just as in the Tajima's Danalyses, B1-type and C-type East Coast D values arenegative, but p values from the coalescent simulationsare > 0.05 in all cases.
Housekeeping genesSummary statistics, shown in Table 2, have consistentlylower values for the housekeeping genes than for fester.Values for Tajima’s D, Fu and Li’s D* and F* can befound in Additional file 3. We see very few significantvalues for the housekeeping loci. For mtCOI, two popu-lations are significant for all three statistics. For 60Sribosomal protein L10, one population is significant forall three statistics. For vasa, one population is significantfor one statistic. None of the other housekeeping locihave populations with significant values for any of thethree statistics.We also noted that all D, D* and F* values across
populations are negative for fester. For the housekeepinggenes, only cytoplasmic actin 2 shows a pattern of con-sistent negative values across populations for the poly-morphism statistics. 40S ribosomal protein 3A, 60Sribosomal protein L8, 60S ribosomal protein L10, ADP/ATP translocase, HSP 90 beta and mtCOI show no trendtowards positive or negative values across populationsfor any of the three statistics. 60S ribosomal protein L6and adult-type muscle actin 2 are negative across popu-lations for Tajima’s D, but no pattern is seen in either D*or F*. Heat shock cognate 71kda protein and vasa haveno pattern for Tajima’s D, but a majority of populationshave positive values for D* and F*. 60S ribosomal proteinL13 shows a pattern of positive values across popula-tions for all three statistics.To further compare housekeeping genes and fester, we
calculated mean Tajima's D, Fu and Li's D*, and Fu andLi's F* values (across all six populations) for housekeep-ing genes. We then compared these values to D, D* andF* for fester A-type East Coast, A-type West Coast, B1-type East Coast, and C-type West Coast (Figures 4, 5, 6).For all of the statistics, the fester values and the

Figure 4 Comparison of mean Tajima's D between festerand housekeeping genes. Fester genes are labeled "F", andhousekeeping genes are labeled "H". There are four fester values:A-type East Coast, A-type West Coast, B1-type East Coast, C-typeEast Coast. Mean Tajima's D values for housekeeping genes wereobtained by averaging across all six populations (Falmouth, MA,Quissett, MA, Sandwich, MA, Monterey, CA, Santa Barbara, CA andSeattle, WA). The bars from left to right correspond to the followinggenes: 60S ribosomal protein L13, vasa, heat shock cognate 71kdaprotein, vigilin, 60S ribosomal protein L10, ADP/ATP translocase 3,heat shock protein HSP-90 beta, cytoplasmic actin 2, 60S ribosomalprotein L8, mitochondrial COI, 40S ribosomal protein 3A, adult-typemuscle actin 2, 60S ribosomal protein L6, fester B1-type East Coast,fester A-type West Coast, fester C-type East Coast, and fester A-typeEast Coast.
H H H H H H H F F F
Gene Type
Mea
n F
u an
d Li
's D
* va
lue
−1.
5−
1.0
−0.
50.
00.
51.
0
H = Housekeeping GeneF = Fester
Figure 5 Comparison of mean Fu and Li's D* between festerand housekeeping genes. Fester genes are labeled "F", andhousekeeping genes are labeled "H". There are four fester values:A-type East Coast, A-type West Coast, B1-type East Coast, C-type EastCoast. Mean Fu and Li's D* values for housekeeping genes wereobtained by averaging across all six populations (Falmouth, MA,Quissett, MA, Sandwich, MA, Monterey, CA, Santa Barbara, CA andSeattle, WA). The bars from left to right correspond to the followinggenes: vasa, 60S ribosomal protein L13, vigilin, heat shock cognate71kda protein, heat shock protein HSP-90 beta, mitochondrial COI,ADP/ATP translocase 3, cytoplasmic actin 2, 40S ribosomal protein3A, adult-type muscle actin 2, 60S ribosomal protein L6, 60Sribosomal protein L10, 60S ribosomal protein L8, fester B1-type EastCoast, fester A-type West Coast, fester C-type East Coast, and festerA-type East Coast.
Nydam and De Tomaso BMC Evolutionary Biology 2012, 12:249 Page 9 of 16http://www.biomedcentral.com/1471-2148/12/249
housekeeping gene values are non-overlapping. Specific-ally, all of the fester values for each statistic are lowerthan all of the housekeeping gene values. This clearlyshows that fester does not experience the same evolu-tionary forces as the rest of the genome.
Tests of selection: ω statisticsThe locations and number of all codons with >95%posterior probability of directional/balancing selectionare shown in Figure 7. Exons 1–7 are predicted tocorrespond to extracellular domains of the fester pro-tein, Exons 8–10 to transmembrane domains. Codonswith <95% posterior probability of selection are notconsidered to be under directional/balancing selection.The majority of codons in the fester proteins have ωvalues < 1, consistent with purifying selection.A-type alleles East Coast. 27 codons have >95% poster-
ior probability of directional/balancing selection (ω > 1).Exons 3, 4 and 8 have significantly higher ω values thanthe rest of the gene (Exon 3: W value = 5,616, p value =0.020, Exon 4: W value = 8,037, p value = 0.007, Exon 8:
W value = 6,981, p value = 0.013). A-type alleles WestCoast. 19 codons have >95% posterior probability of dir-ectional/balancing selection (ω > 1). Exons 4, 5 and 8have significantly higher ω values than the rest of thegene (Exon 4: W value = 7,983, p value = 0.0084, Exon5: W value = 9,651, p value = 0.0105, Exon 8: W value =7,478, p value = 0.0007). B1-type alleles East Coast. 17codons have >95% posterior probability of directional/balancing selection (ω > 1). Exons 4, 5 and 8 have sig-nificantly higher ω values than the rest of the gene (Exon4: W value = 8,032, p value – 0.014, Exon 5: W value =11,062, p value = <0.001, Exon 8: W value = 7,230,p value = 0.0138). Exons 9–11 do not have significantlyhigher ω values than the rest of the gene. C-type allelesEast Coast. 15 codons have >95% posterior probabilityof directional/balancing selection (ω > 1). Exons 4, 5 and8 have significantly higher ω values than the rest of thegene (Exon 4: W value = 8,032, p value – 0.014, Exon 5:W value = 11,062, p value = <0.001, Exon 8: W value =7,230, p value = 0.0138). Exons 9–11 do not have signifi-cantly higher ω values than the rest of the gene.

Figure 6 Comparison of mean Fu and Li's F* between festerand housekeeping genes. Fester genes are labeled "F", andhousekeeping genes are labeled "H". There are four fester values:A-type East Coast, A-type West Coast, B1-type East Coast, C-type EastCoast. Mean Fu and Li's F* values for housekeeping genes wereobtained by averaging across all six populations (Falmouth, MA,Quissett, MA, Sandwich, MA, Monterey, CA, Santa Barbara, CA andSeattle, WA). The bars from left to right correspond to the followinggenes: vasa, 60S ribosomal protein L13, vigilin, heat shock cognate71kda protein, mitochondrial COI, heat shock protein HSP-90 beta,ADP/ATP translocase 3, cytoplasmic actin 2, 40S ribosomal protein3A, ribosomal protein L10, 60S ribosomal protein L8, adult-typemuscle actin 2, 60S ribosomal protein L6, 60S fester B1-type EastCoast, fester A-type West Coast, fester C-type East Coast, and festerA-type East Coast.
Figure 7 Locations of the codons with greater than 95%probability of ω greater than 1 across the fester locus. Thenumbers at the top of the figure refer to the exons sequenced. Theanalysis was done on four separate data sets - A-type East Coastalleles, A-type West Coast alleles, B1-type East Coast alleles andC-type East Coast alleles.
Nydam and De Tomaso BMC Evolutionary Biology 2012, 12:249 Page 10 of 16http://www.biomedcentral.com/1471-2148/12/249
DiscussionTests of selectionSelection is occurring at the fester locusTwo sets of hypotheses have generally been advancedfor the maintenance of polymorphism at allorecognitionloci – those invoking neutral processes, and those invok-ing selective processes (reviewed in [31]). All three ana-lytical methods we employed (distribution of variationwithin and among populations, polymorphism statisticsand ω statistics) provide evidence that selection is occur-ring at the fester locus.Nearly all of the variation in the fester locus resides
within populations, just as with FuHC [32]. The house-keeping genes have substantially more structure amongpopulations within groups and among groups than fester(Figure 3). In addition, a majority of the pairwise Fstvalues are significant for the housekeeping genes, butonly one is significant in fester A-type, and none in B1-type or C-type. The East Coast exhibits more differenti-ation between populations than the West Coast: 15intra-East Coast population pairs show differentiationwhereas 19 intra-West Coast population pairs do
(Additional file 2). This variation in amount of differenti-ation may be due to the wider geographical sampling onthe West Coast. However, any bias in AMOVA resultsdue to higher differentiation on the West Coast than onthe East Coast would affect both fester and housekeepinggenes.The population differentiation at the housekeeping loci
confirms the significant genetic structure seen for neu-tral markers (microsatellites) in B. schlosseri [33,34].These results are in sharp contrast to the lack of signifi-cant population differentiation at fester and FuHC.The pattern seen here is consistent with balancing selec-
tion acting on fester. Loci experiencing balancing selection(which maintains variation) should have larger amounts ofpolymorphism within populations and smaller amountsamong populations than neutral loci (assuming selectionpressures are similar between populations), whereas theopposite pattern is expected for loci experiencing direc-tional selection [27].All polymorphism statistics (Tajima's D, Fu and Li's D*
and F*) are significantly negative for the East Coast A-typealleles, and Fu and Li's F* statistic is significantly negativefor the West Coast A-type alleles, consistent with eitherpurifying selection or a recent selective sweep at thishaplotype (directional selection). These results are likelydue to selection rather than demography, given that 10 ofthe housekeeping loci have no populations that were sig-nificant for any of the polymorphism statistics. Theremaining three loci only have 1–2 populations (out ofsix) that were significant for one or more of the statistics.In addition, the housekeeping loci do not show a consist-ent negative trend of polymorphism statistics across allpopulations, as fester does. Figures 4, 5, 6 provideadditional conformation that values of polymorphismstatistics are more negative for fester than for housekeep-ing genes.

Nydam and De Tomaso BMC Evolutionary Biology 2012, 12:249 Page 11 of 16http://www.biomedcentral.com/1471-2148/12/249
Polymorphism statistics for B1-type and C-type allelesare always negative, but are not statistically differentfrom zero. We cannot therefore reject the null hypoth-esis that the B1-type and C-type alleles are evolving neu-trally, based on these statistics. However, fester B1-typeand C-type are clearly on a different evolutionary trajec-tory than the rest of the B. schlosseri genome (Figures 4,5, 6) and ω statistics provide evidence for selection onall 3 of the fester-allele types tested: A, B1 and C.Exons 4,5 and 8 have statistically higher ω values than
the rest of the gene for the A-type West Coast group,the B1-type group, and the C-type group. The A-typeEast Coast group also highlights Exon 3 as significant,but not Exon 5. No putative conserved domains weredetected when Exons 3 and 4 were submitted as queriesto the NCBI non-redundant protein sequences databaseusing BLASTp. Exon 5 encodes a short consensus repeat(SCR, or sushi) domain often found in vertebrate com-plement receptors (part of the innate immune system)[22]. Exon 8 is a functional transmembrane domain thatwas co-localized with CD45 to the cellular membrane[22]. Splice variants missing Exons 3 and 5 are occasion-ally found, but Exons 4 and 8 are present in all variantssequenced thus far [22]. We will focus on these 4 exonsin further studies of fester's role in the allorecognitionreaction, especially its interactions with FuHC.Another gene encoded in the FuHC locus, uncle fester,
represents a partial duplication of the fester locus, withthe genomic region encoding Exons 4–9 nearly identicalto fester's Exons 6–11, but uncle fester's Exons 1–3 donot appear to be related to any fester sequence [35]. Thisprotein plays a role in initiating the rejection responsebetween incompatible individuals, but is not involved inthe fusion response [35]. Uncle fester, like fester, likelyacts a receptor to the FuHC ligand. Two of the festerexons that have statistically higher ω values than the restof the fester gene (Exons 4 and 5) are not related to theuncle fester sequence. Fester's Exon 8 is very similar touncle fester's Exon 6, and has higher ω values than therest of the fester gene.
Type of selection occurring at the fester locusThese data do not provide unambiguous support for aspecific type of selection. The polymorphism statisticsare consistent with either purifying selection or direc-tional selection. The ω statistics show that the majorityof the protein is experiencing purifying selection (ω < 1),but that 15–27 codons are undergoing selection. The se-lection detected by ω statistics could be either balancingor directional; ω > 1 is compatible with either scenario.The distribution of variation within and among popula-tions points towards balancing selection and away fromdirectional selection.
The genetic basis of allorecognition has only beencharacterized in B. schlosseri, although the majority ofbotryllid species exhibit allorecognition. Identificationand amplification of fester in other botryllids could allowus to discriminate between balancing and directional se-lection. First, we could determine if trans-species poly-morphism is occurring. In several classic allorecognitionsystems, alleles from Species A are more closely relatedto alleles in Species B than they are to other alleles inSpecies A (e.g. SI loci SRK and SCR in several Arabidop-sis species: [36,37], Het-c in Neurospora crassa: [38]).Such a pattern could be explained if alleles that pre-datespeciation events have been maintained by balancing se-lection until the present time [39]. Second, divergencedata would allow us to conduct several additional testsof selection (e.g. the HKA and McDonald-Kreitmantests) and apply other polymorphism statistics (e.g. Fuand Li's D and F).Why might fester be evolving non-neutrally? If balan-
cing selection is acting to maintain the allelic diversity atfester, what would be the mechanism of this selection?Given fester's likely function as a receptor of the ligandFuHC, fester may be evolving in response to FuHC evo-lution. Fusion can incur a significant fitness cost [40-42];individuals with rare FuHC alleles will not fuse as oftenand may have higher fitness (negative frequencydependent selection). Fester alleles may evolve to bindwith these rare FuHC alleles, and would therefore besubject to similar selective pressures as the FuHC alleles.A recent study on the alr2 allorecognition gene in
Hydractinia comes to a similar conclusion [43]. They as-sert that alr2 polymorphism is maintained by balancingselection, with negative frequency dependent selectionas the mechanism. Hydractinia colonies also undergo fu-sion, and fusion can be costly for the losing genotype insituations where the two genotypes do not contributeequally to the next generation [43].But if directional (rather than balancing) selection is
maintaining variation at fester, what would be the bio-logical explanation for this pattern? Fusion may also bebeneficial to colonial ascidians such as B. schlosseri[41,44]. High rates of fusion are seen in the field(Botrylloides violaceus) [45] and the laboratory be-tween unrelated individuals (Diplosoma listerianum)[46], and half-siblings (B. schlosseri) [47]. B. schlosserijuveniles also prefer to settle near related individuals[48,49]. In a scenario where fusion is beneficial, indivi-duals with common fester alleles (and therefore higherfusion rates) would have higher fitness, and these com-mon alleles would go to fixation.
Relationships among fester haplotypesBecause B1 is paraphyletic with respect to B2, the B2copy may be derived from a duplication of the B1 copy.

Nydam and De Tomaso BMC Evolutionary Biology 2012, 12:249 Page 12 of 16http://www.biomedcentral.com/1471-2148/12/249
In our laboratory-reared strains in which the fester cop-ies have been physically mapped, both B1 and B2 resideon a single haplotype, while the A haplotype has a singlecopy [22]. This is consistent with a duplication eventcreating the second B copy. Duplication events oftendrive genomic diversity in vertebrate MHC receptors in-cluding Ly49 genes in murines [50], NKG2 genes inhumans [51], and lemurs [52], KIRs in humans [53,54],and heavy chain variable segment (VH) genes in humans[55]. However, more B2 alleles need to be sequenced be-fore hypotheses about the origins of the B2 copy can betested.The A clade is equally divergent from both the B1/B2
and C clades, which are less divergent from each otherthan either is from the A clade. This pattern is consist-ent with at least 2 evolutionary scenarios: 1) the Ahaplotype experienced a duplication event which gaverise to the ancestor of the B1/B2 and C haplotypes, or 2)a duplication at either B1 or B2 that gave rise to the Chaplotype (or vice versa). Either way, A-type alleles arenearly evenly distributed between East Coast and WestCoast populations (27 vs. 24), whereas B1-type and C-type alleles are mostly found in East Coast populations(B1: 11/13, C: 17/21). This pattern suggests that the A-type alleles are more widespread in B. schlosseri sourcepopulations than either the B1-type or C-type alleles(both East and West Coast populations are invasive).The A-type alleles may therefore occupy the basal pos-ition in the fester phylogeny. But until we can sequencethe fester locus from other Botryllus species, thisremains speculation.
Comparison of variation among fester allele typesThe A-type alleles are more variable than either the B1-type or C-type alleles. While more A-type alleles (51)were sequenced than B1-type (13) or C-type (21) locusalleles, it is unlikely that sampling bias completelyexplains this pattern. We found 4 distinct A-type allelesand no such diversity was discovered in the B1, B2 or C-type alleles. There are 3 possible explanations for thispattern: 1) stronger directional or balancing selection onthe A haplotype, 2) the A haplotype is older than theother haplotypes and has accumulated more diversitythrough neutral or selective processes and/or 3) the lackof variation in the B1/B2 haplotype may be due tohomogenization of variation due to unequal crossover orgene conversion between B1 and B2 (concerted evolu-tion) [56]. The first hypothesis is supported by theresults of the polymorphism statistics, which are consist-ent with the action of selection on the A-type alleles butnot on the B1-type or C-type alleles. We cannot evaluatethe second hypothesis without sequences from otherbotryllid species or more B. schlosseri populations.Regarding the third hypothesis, concerted evolution has
long been thought to play a role in the evolution of im-munoglobulin genes [57,58]. For example, this processhas been suggested as a mechanism for the lack of vari-ation in certain NKG2 genes in murines and humans[59]. But concerted evolution cannot necessarily explainlower levels of variation at the fester C haplotype com-pared to the fester A haplotype, and the importance ofconcerted evolution by inter-locus gene conversion forthe evolution of MHC and immunoglobulin genes hasbeen challenged by the more recent birth-and-deathmodel [55].Almost all measures of A-type allele diversity are
higher in the East Coast group than the West Coastgroup. Although we sampled a larger number of EastCoast than West Coast colonies with A-type alleles (22vs. 18), the distinct evolutionary histories of these twosets of populations may also play a role in the diversitydisparity. East Coast B. schlosseri Lineage A came fromthe Mediterranean Sea, which is the center of diversityfor this group of lineages collectively known as B. schlos-seri [60]. West Coast B. schlosseri Lineage A, on theother hand, came from the Western Pacific Ocean [60].The Western Pacific Ocean populations came originallyfrom the Mediterrean Sea [60]. East Coast B. schlosserimay be more diverse than West Coast B. schlosseri be-cause native populations seeded the East Coast and non-native populations seeded the West Coast.
ConclusionDespite the prevalence and importance of allorecognitionsystems, the genetic basis of allorecognition has rarelybeen characterized outside the well-known MHC in verte-brates and SI in plants. Where loci have been identified,their evolutionary history is an open question. We haveidentified that the fester locus, a putative receptor in theB. schlosseri allorecognition system, evolves via naturalselection. Studies such as these will increase our under-standing of a widespread biological phenomenon.
MethodsSamplingThe species B. schlosseri comprises five divergentlineages (A-E) [45,61]. Lineage A is thought to be nativeto the Mediterranean; it has spread throughout theAtlantic, Mediterranean, and Pacific Oceans throughanthropogenic means. All of the B. schlosseri individualsin this study are Lineage A; populations from the WestCoast of the U.S. originated from invasive westernPacific individuals, whereas populations from the EastCoast of the U.S. originated from invasive Mediterra-nean individuals [60].Colonies were collected from floating docks in each of 6
populations in 2009 and 2010: Falmouth, MA, Quissett,MA, Sandwich, MA, Monterey, CA, Santa Barbara, CA

Nydam and De Tomaso BMC Evolutionary Biology 2012, 12:249 Page 13 of 16http://www.biomedcentral.com/1471-2148/12/249
and Seattle, WA. Falmouth, MA and Quissett, MA are 3miles apart, on Vineyard Sound and Buzzards Bay,respectively. Sandwich, MA is 25 miles from theFalmouth/Quissett area, on Cape Cod Bay. Santa Barbara,CA is 237 miles south of Monterey, CA and 1,113 milessouth of Seattle, WA. Single systems were dissected fromcolonies and flash-frozen with liquid nitrogen and storedat −80°C.
Amplification and sequencingFesterTotal RNA was extracted from frozen tissue using theNucleoSpin Nucleic Acid and Protein Purification Kit(Macherey-Nagel). This RNA was used to synthesizesingle-stranded cDNA using SuperScript III reverse tran-scriptase (Invitrogen) and an oligo (dT) primer. 5-folddilutions of the single-stranded cDNA was then PCR-amplified with TRsa and TS-PCR primers. The resultingPCR product was diluted 50-fold and used as the tem-plate for PCR amplification. We used the followingprimer pair to amplify fester: Forward: 5' AAAGA-TAGTGCATCTGTTTCCATCCAA 3' and Reverse: 5'GCAGCTGCTTCGATTTTCTTTCCTTGT 3'. This pri-mer pair amplified all fester haplotypes, and all exonswere amplified in the initial PCR. Cycling conditionswere 39x (95C for 30 sec, 55C for 30 sec, 72C for 1 min30 sec), 72C for 5 min. PCR amplification was per-formed in a 20-μl total reaction volume with 13.6μl ofH20, 4μl of 5x HF Buffer (Finnzymes), 0.2 mM dNTPs,0.6 μl of 100% DMSO, 0.3333 μM of each primer,0.02U/μl of Phusion Polymerase (Finnzymes) and 2 μlof template DNA. PCR products were cloned usingthe pGEMW-T kit and at least 12 clones per colonywere sequenced in order to find alleles from all alleletypes: many colonies have more than 1 allele type. Whenan A/A, B1/B2/B1/B2 or C/C homozygote was found,we religated and transformed the original PCR productand sequenced additional clones to ensure that the col-ony was indeed a homozygote. Colony PCR productswere incubated with 0.25μl each of Exonuclease I andShrimp Antarctic Phosphatase at 37°C for 30 min, fol-lowed by 90°C for 10 min prior to sequencing.Purified PCR products were sequenced with a Big
Dye Terminator Cycle sequencing kit and a 96 capil-lary 3730xl DNA Analyzer (Applied Biosystems) atthe UC Berkeley Sequencing Facility. A non-redundantset of alleles has been submitted to GenBank (Acces-sion Numbers JN083148-JN083236). Sequences wereedited, trimmed and aligned with Aligner (CodonCodeCorporation, Dedham, MA). Colonies sequenced foreach population are shown in Table 3. Only Exons 1–5and 8–11 were included in the alignment. We know thatthe PCR primers always amplified all 11 exons becausethe product was always 1.1 kb. However, the full-length
cDNA was rarely incorporated into the bacterial vector;the longest amplicons recovered from the cloningprocess were almost always missing Exons 6 and/or7 despite screening up to 192 clones per colony. BothExons 6 and 7 were monomorphic when present, so wedecided to exclude them from the alignment. No othersplice variants were included in the alignment (i.e. allincluded sequences had Exons 1–5 and 8–11).
Housekeeping genesWe amplified 13 housekeeping genes (12 nuclear genesand mitochondrial cytochrome oxidase I) to determinewhether the pattern of population structure and thevalues of polymorphism statistics were specific to thefester locus. Significant negative polymorphism statisticscould be due to selective or demographic processes (e.g.recent population growth). But demographic processeswould affect all genes, not just those involved in allore-cognition. mtCOI is a gene commonly used for popula-tion structure analyses in B. schlosseri (e.g. [34,60,61]).Two of the 12 nuclear loci were found in GenBank(adult-type muscle actin 2, Accession #FN178504.1 andvasa, Accession #FJ890989.1) and the other 10 werelocated in our B. schlosseri EST database (40S ribosomalprotein 3A, 60S ribosomal protein L6, 60S ribosomal pro-tein L8, 60S ribosomal protein L10, 60S ribosomal proteinL13, heat shock cognate 71kda protein, cytoplasmic actin2, ADP/ATP translocase 3, heat shock protein HSP-90beta, and vigilin).Template for PCR amplification was generated as
described above for the fester locus. Primers and ther-mocycling conditions for each gene are available fromthe authors. vasa PCR products were cloned as describedfor the fester locus. The PCR products of the other nu-clear loci were sequenced directly. PCR products wereincubated with 0.25μl each of Exonuclease I and ShrimpAntarctic Phosphatase at 37°C for 30 min, followed by90°C for 10 min.Purified PCR products were sequenced with a Big Dye
Terminator Cycle sequencing kit and a 96 capillary3730xl DNA Analyzer (Applied Biosystems) at the UCBerkeley Sequencing Facility. Sequences that wereobtained by direct sequencing of PCR products (all nu-clear sequences minus vasa) were phased in DnaSP5.10.01 [62]. All sequences have been submitted to Gen-Bank (40S ribosomal protein 3A: JQ596880-JQ596936,60S ribosomal protein L6: JQ596937-JQ597084, 60Sribosomal protein L8: JQ597085-JQ597174, 60S riboso-mal protein L10: JQ597175-JQ597294, 60S ribosomalprotein L13: JQ597595-JQ597716, heat shock cognate71kda protein: JQ597295-JQ597430, cytoplasmic actin 2:JQ597431-JQ597548, ADP/ATP translocase 3: JQ597549-JQ597594, heat shock protein HSP-90 beta: JQ597717-JQ597826, adult-type muscle actin 2: JQ597827-JQ597974,

Table 3 Fester genotypes of sequenced colonies
Populations Number of Colonies A/A A/B1/B2 B1/B2/B1/B2 A/C C/C A/B1/B2/C
Falmouth, MA 12 2 2 4 1 3 0
Monterey, CA 4 1 0 2 0 1 0
Quissett, MA 13 7 2 2 1 1 0
Sandwich, MA 10 1 0 1 5 2 1
Santa Barbara, CA 8 6 1 0 0 1 0
Seattle, WA 12 8 1 1 1 1 0
Nydam and De Tomaso BMC Evolutionary Biology 2012, 12:249 Page 14 of 16http://www.biomedcentral.com/1471-2148/12/249
mtCOI: JN083237-JN083303, vasa: JN083304-JN083376,vigilin: JQ597975-JQ598070). Sequences were edited,trimmed and aligned with Aligner (CodonCode Corpor-ation, Dedham, MA).
Relationships among fester haplotypesWe used RAxML 7.2.7 on the CIPRES web portal to ob-tain the best-scoring ML tree, as well as bootstrap sup-port for each node on this tree [63]. We used the GTR+G likelihood model of nucleotide substitution as imple-mented in RAxML. All nodes with less than 50% sup-port were collapsed, and the resulting tree was visualizedusing FigTree 1.3.1 [64].Bayesian analyses were performed with MrBayes 3.1.2
[65]. The GTR+G model of nucleotide substitution wasapplied (Nset=6). Each analysis was run for 10 milliongenerations, with sampling every 1000 generations. Thefirst 2000 trees were eliminated as burn-in. The runswere completed using the Computational Biology Ser-vice Unit at Cornell University which is partially fundedby the Microsoft Corporation.
Comparison of variation among fester allele typesThe average number of nucleotide substitutions per site(Dxy) and the number of net nucleotide substitutions persite (Da) between each pair of allele types was calculatedin DnaSP 5.10.01 [62]. Da corrects for within-allele-typevariation [66]. The three allele types analyzed are A-type,B1-type, and C-type. For all population-level analyses, weanalyze each allele type separately because each has a sep-arate evolutionary history, and because including diver-gent alleles in the same data set could create artifacts.When analyzing population level data, we use the term"allele type" instead of "haplotype". B2 alleles were recov-ered from an insufficient number of colonies to beincluded in population level analyses, so our analyses weredone on B1-type alleles rather than on the B1/B2haplotype.
RecombinationIntragenic recombination was determined in the EastCoast and West Coast groups for the fester A-typealleles, and for the East Coast group in the fester B1-typeand C-type alleles. Recombination was assessed by
calculating Rm, the minimum number of recombinationevents in DnaSP 5.10.01 [62] and the correlation betweenphysical distance and 3 measures of linkage disequilib-rium (LD): r2, D' and G4 in program permute [67].
Selection inference: Distribution of polymorphism withinand among populationsWe characterized population structure within B. schlos-seri for fester A-type, B1-type, and C-type alleles and allhousekeeping genes using an analysis of molecular vari-ance (AMOVA), fixation indices (Fct, Fsc and Fst), andpairwise Fst values between populations in Arlequin3.5.1.2 [68]. The fester B2-type alleles were not analyzed,as only 2 alleles were recovered from all coloniessequenced. For the fester A-type alleles and all thehousekeeping loci, 2 groups (East Coast and WestCoast) were analyzed, with 3 populations in each group(East Coast: Falmouth, MA, Quisset, MA and Sandwich,MA. West Coast: Monterey, CA, Santa Barbara, CA, Se-attle, WA). Molecular variance was therefore partitioned3 ways: among groups, among populations withingroups, and within populations. For the B1-type and C-type alleles, only 1 group (East Coast) was analyzed, asfew West Coast colonies had B1-type or C-type alleles.Molecular variance was therefore assigned among andwithin populations only.
Tests of selection: polymorphism statisticsFor East Coast and West Coast alleles separately (festerA-type alleles), East Coast alleles (fester B1-type and C-type alleles), and each of the six populations (housekeep-ing genes), we calculated the summary statistics θ, π,number of haplotypes, and haplotype diversity in DnaSP5.10.01 [62]. We also employed Tajima's D [28] and Fuand Li's D* and F* [29] test statistics. Statistical signifi-cance of D, D*, and F* were determined using 10,000 co-alescent simulations in DnaSP. We performed 2 sets ofcoalescent simulations: based on θ and segregating sites.Estimates of per gene recombination (R) for each popu-lation were made in DnaSP and were then imported intothe simulations. Tajima's D, Fu and Li's D* and F* statis-tics were calculated for fester A-type alleles (East Coastand West Coast groups), B1-type alleles (East Coast
Nydam and De Tomaso BMC Evolutionary Biology 2012, 12:249 Page 15 of 16http://www.biomedcentral.com/1471-2148/12/249
group only), C-type alleles (East Coast group only), andall housekeeping genes (all six populations).
Tests of selection: ω statisticsOmega values (ω = dN/dS) and associated 95% HPD (high-est posterior density) regions across fester A-type, B1-typeand C-type alleles were estimated using the programomegaMap 0.5 [67]. omegaMap calculates ω values in thepresence of intragenic recombination [67]. omegaMapruns were carried out using the resources of the Compu-tational Biology Service Unit at Cornell University whichis partially funded by the Microsoft Corporation. Wechose 250,000 iterations for each run, with thinning set to1,000. We used an improper inverse distribution for μ,and κ, and an inverse distribution for ω and ρ. Initial par-ameter values for μ and κ were 0.1, and 3.0, respectively. ωand ρ priors were set between 0.01 and 100. An independ-ent model was used for ω, so that ω values were allowedto vary across sites. The number of iterations discarded asburnin varied across runs, but was determined by plottingthe traces of μ and κ; iterations affected by the startingvalue of the parameter were discarded. 2 independent runswere conducted for each population. These 2 runs werecombined in all cases, after it was determined that themean and 95% highest posterior density (HPD) regions foreach parameter in the 2 runs matched closely.We also calculated the posterior probability of selec-
tion per codon across the protein. Exons that containedclusters (≥ 2) of these codons were identified; Mann–Whitney U tests in R 2.12.2 were performed on theseexons to determine if they had higher ω values than therest of the protein.
Additional files
Additional file 1: Best scoring Maximum Likelihood Tree of fester A,B1, B2 and C allele types. Blue = A-type alleles, Orange = B1-typealleles, Purple = B2-type alleles, Black = C-type alleles. FLM = FalmouthMA, MR = Monterey CA, QST = Quissett MA, SW = Sandwich MA,SB = Santa Barbara CA, SE = Seattle WA. Numbers are bootstrap valuesfrom 1,000 replicates.
Additional file 2: AMOVA, Fixation Indices and Pairwise Fst valuesfor fester and all housekeeping genes.
Additional file 3: Tajima's D, Fu and Li's D* and F* statistics for allHousekeeping Genes.
Competing interestsThe authors declare that they have no competing interests.
Authors’ contributionsMLN generated the data, performed the analyses and wrote the manuscript.AWD provided funding and edited the manuscript. Both authors have readand approved the final manuscript.
Authors’ informationMLN studies the evolution of allorecognition in B. schlosseri and theevolution of reproductive isolation and speciation in the solitary ascidianCiona intestinalis. AWD studies the evolution and molecular mechanisms of
allorecognition in B. schlosseri, as well as the mechanisms of germ lineparasitism in B. schlosseri.
Data accessibilityAll sequences have been submitted to GenBank.
AcknowledgementsWe thank S. Rendulic for collecting many of the B. schlosseri colonies used inthis study, and Nathan Derieg, Scott Hodges, Daisie Huang, Todd Oakley,Sabrina Pankey, Alison Pischedda, Steve Proulx, and Des Ramirez forcomments on the manuscript. This work was supported by National ScienceFoundation Grant IOS-0842138 to AWD.
Author details1Division of Science and Mathematics, Centre College, 600 W. Walnut Street,Danville, KY 40422, USA. 2Department of Molecular, Cellular, andDevelopmental Biology, University of California, Santa Barbara, Santa Barbara,CA 93106, USA.
Received: 24 September 2012 Accepted: 19 December 2012Published: 22 December 2012
References1. Buss L: Somatic cell parasitism and the evolution of somatic tissue
compatibility. Proc Natl Acad Sci USA 1982, 79:5337–5341.2. Mercier A, Sun Z, Hamel JF: Internal brooding favours pre-metamorphic
chimerism in a non-colonial cnidarian, the sea anemone Urticina felina.Proc Roy Soc Lond Ser B 2011, 278:3517–3522.
3. Allen AM, Hiscock SJ: Evolution and phylogeny of self-incompatibilitysystems in angiosperms. In Self-incompatibility in flowering plants –evolution, diversity and mechanisms. 1st edition. Edited by Franklin-Tong VE.Heidelberg, Germany: Springer-Verlag; 2008:73–101.
4. Raftos D: Allorecognition and humoral immunity and tunicates. Ann NewYork Acad Sci 1994, 712:227–244.
5. Saito Y, Hirose E, Watanabe H: Allorecognition in compound ascidians.Intl J Dev Biol 1994, 38:237–247.
6. Harada Y, Takagaki Y, Sunagawa M, Saito H, Yamada L, Taniguchi H,Shoguchi E, Sawada H: Mechanism of self sterility in a hermaphroditicchordate. Science 2008, 320:548–550.
7. Gibbs KA, Urbanowski ML, Greenberg EP: Genetic determinants of selfidentity and social recognition in bacteria. Science 2008, 321:256–259.
8. Hughes RN, Manriquez PH, Morley S, Craig SF, Bishop JDD: Kin or self-recognition? Colonial fusibility of the bryozoan Celleporella hyalina.Evol Dev 2004, 6:431–437.
9. Shaulsky G, Kessin R: The cold war of the social amoebae. Curr Biol 2007,17:684–692.
10. Hidaka M, Yurugi K, Sunagawa S, Kinzie RA III: Contact reactions betweenyoung colonies of the coral Pocillopora damicornis. Coral Reefs 1997,16:13–20.
11. Glass NL, Jacobson DJ, Shiu PK: The genetics of hyphal fusion andvegetative incompatibility in filamentous ascomycete fungi. Ann Rev Gen2000, 34:165–186.
12. Grosberg RK, Levitan DR, Cameron BB: Evolutionary genetics ofallorecognition in the colonial hydroid Hydractinia symbiolongicarpus.Evolution 1996, 50:2221–2240.
13. Runions CJ, Owens JN: Evidence of pre-zygotic self-incompatibility in aconifer. In Reproductive biology. Edited by Owens SJ, Rudall PJ. Kew, UK:Royal Botanic Gardens; 1998:255–264.
14. Pandey KK: Incompatibility in Abutilon 'Hybridum'. Am J Bot 1960,47:877–883.
15. Clark J: Plasmodial incompatibility in the myxomycete Didymiumsquamulosum. Mycologia 2003, 95:24–26.
16. Santelices B, Correa JA, Aedo D, Flores V, Hormazabal M, Sanchez P:Convergent biological processes in coalescing Rhodophyta. J Phyc 1999,35:1127–1149.
17. Fernandez-Busquets X, Burger MM: Cell adhesion and histocompatibility insponges. Mic Res Tech 1999, 44:204–218.
18. Flajnik MF, Kasahara M: Origin and evolution of the adaptive immunesystem: genetic events and selective pressures. Nat Rev Gen 2010,11:47–59.

Nydam and De Tomaso BMC Evolutionary Biology 2012, 12:249 Page 16 of 16http://www.biomedcentral.com/1471-2148/12/249
19. De Tomaso AW, Nyholm SV, Palmeri KJ, Ishizuka KJ, Ludington WB,Mitchel K, Weissman IL: Isolation and characterization of a protochordatehistocompatibility locus. Nature 2005, 438:454–459.
20. Benabentos R, Hirose S, Sucgang R, Curk T, Katoh M, Ostrowski E,Strassmann J, Queller D, Zupan B, Shaulsky G, Kuspa A: Polymorphicmembers of the lag-gene family mediate kin-discrimination inDictyostelium. Curr Biol 2009, 19:567–572.
21. Nicotra ML, Powell AE, Rosengarten RD, Moreno M, Grimwood J, Lakkis FG,Dellaporta SL, Buss LW: A hypervariable invertebrate allodeterminant.Curr Biol 2009, 19:583–589.
22. Nyholm SV, Passegue E, Ludington WB, Voskoboynik A, Mitchel K,Weissman IL, De Tomaso AW: fester, a candidate allorecognition receptorfrom a primitive chordate. Immunity 2006, 25:163–173.
23. Bernatchez L, Landry C: MHC studies in nonmodel vertebrates: whathave we learned about natural selection in 15 years? J Evol Biol 2003,16:363–377.
24. Garrigan D, Hedrick PW: Detecting adaptive molecular polymorphism:lessons from the MHC. Evolution 2003, 57:1707–1722.
25. Nydam ML, De Tomaso AW: Creation and maintenance of variation inallorecognition loci: molecular analysis in various model systems.Front Mol Inn Immunol 2011, 2:1–6.
26. Yokoyama S, Nei M: Population dynamics of sex-determining alleles inhoney bees and self-incompatibility alleles in plants. Genetics 1979,91:609–626.
27. Schierup MH, Vekemans X, Charlesworth D: The effect of subdivision onvariation at multi-allelic loci under balancing selection. Gen Res 2000, 76:51–62.
28. Tajima F: Statistical method for testing the neutral mutation hypothesisby DNA polymorphism. Genetics 1989, 123:585–595.
29. Fu YX, Li WH: Statistical tests of neutrality of mutations. Genetics 1993,133:693–709.
30. Garrigan D, Hedrick PW: Detecting adaptive molecular polymorphism:lessons from the MHC. Evolution 2003, 57:1707–1722.
31. Grosberg RK: The evolution of allorecognition specificity in clonalinvertebrates. Quart Rev Biol 1988, 63:377–412.
32. Nydam ML, Taylor AA, De Tomaso AW: Evidence for selection on achordate histocompatibility locus. Evolution 2012, doi:10.1111/j.1558-5646.2012.01787.x.
33. Ben-Shlomo R, Reem E, Douek J, Rinkevich B: Population genetics of theinvasive ascidian Botryllus schlosseri from South American coasts.Mar Ecol Prog Ser 2010, 412:85–92.
34. Bock DG, MacIsaac HJ, Cristescu ME: Multilocus genetic analysesdifferentiate between widespread and spatially restricted cryptic speciesin a model ascidian. Proc Roy Soc Lond Ser B 2012, doi:10.1098/rspb.2011.2610.
35. McKitrick TR, Muscat CC, Pierce JD, Bhattacharya D, De Tomaso AW:Allorecognition in a basal chordate consists of independent activatingand inhibitory pathways. Immunity 2011, 34:616–626.
36. Sato K, Nishio T, Kimura R, Kusaba M, Suzuki T, Hatakeyama K, Ockendon DJ,Satta Y: Coevolution of the S-Locus genes SRK, SLG, and SP11/SCR inBrassica oleracea and B. rapa. Genetics 2002, 162:931–940.
37. Guo YL, Zhao X, Lanz C, Weigel D: Evolution of the S-locus region inArabidopsis thaliana relatives. Plant Phys 2011, 157:937–946.
38. Wu J, Saupe SJ, Glass NL: Evidence for balancing selection operating atthe het-c heterokaryon incompatibility locus in a group of filamentousfungi. Proc Natl Acad Sci USA 1998, 95:12398–12403.
39. Takahata N: A simple genealogical structure of strongly balanced alleliclines and trans-species evolution of polymorphism. Proc Natl Acad SciUSA 1990, 87:2419–2423.
40. Rinkevich B, Weissman IL: Chimeras vs. genetically homogeneousindividuals: potential fitness costs and benefits. Oikos 1992, 63:119–124.
41. Chadwick-Furman NE, Weissman IL: Life history plasticity in chimeras ofthe colonial ascidian Botryllus schlosseri. Proc Roy Soc London Ser B 1995,262:157–162.
42. Chadwick-Furman NE, Weissman IL: The effects of allogeneic contact onlife- history traits of the colonial ascidian Botryllus schlosseri in MontereyBay. Biol Bull 2003, 205:133–143.
43. Gloria-Soria A, Moreno MA, Yund PO, Lakkis FG, Dellaporta SL, Buss LW:Evolutionary genetics of the hydroid allodeterminant alr2. Mol Biol Evol2012, doi:10.1093/molbev/mss197.
44. Rinkevich B, Shapira M: Multi-partner urochordate chimeras outperformtwo-partner chimerical entities. Oikos 1999, 87:315–320.
45. Westerman E, Dijkstra J, Harris L: High natural fusion rates in a botryllidascidian. Mar Biol 2009, 156:2613–2619.
46. Bishop JDD, Sommerfeldt AD: Not like Botryllus: indiscriminate post-metamorphic fusion in a compound ascidian. Proc Roy Soc Lond B 1999,266:241–248.
47. Carpenter MA, Powell JH, Ishizuka KJ, Palmeri KJ, Rendulic Z, De Tomaso A:Growth and long-term somatic and germline chimerism following fusionof juvenile Botryllus schlosseri. Biological Bulletin 2011, 220:57–70.
48. Ben-Shlomo R, Motro U, Paz G, Rinkevich B: Pattern of settlement andnatural chimerism in the colonial urochordate Botryllus schlosseri.Genetica 2008, 132:51–58.
49. Grosberg RK, Quinn JF: The genetic control and consequences of kinrecognition by the larvae of a colonial marine invertebrate. Nature 1986,322:456–459.
50. Hao L, Nei M: Rapid expansion of killer cell immunoglobulin-like receptorgenes in primates and their coevolution with MHC Class I genes. Gene2005, 347:149–159.
51. Glienke J, Sobanov Y, Brostjan C, Steffens C, Nguyen C, Lehrach H, Hofer E,Francis F: The genomic organization of NKG2C, E, F and D receptorgenes in the human natural killer gene complex. Immunogen 1998,48:163–173.
52. Averdam A, Petersen B, Rosner C, Neff J, Roos C, Eberle M, Aujard F,Munch C, Schempp W, Carrington M, Shiina T, Inoko H, Knaust F, Coggill P,Sehra H, Beck S, Abi-Rached L, Reinhardt R, Walter L: A novel system ofpolymorphic and diverse NK cell receptors in primates. PloS Genetics2009, 5:e1000688.
53. Martin AM, Kulski JK, Gaudieri S, Witt CS, Freitas EM, Trowsdale J,Christiansen FT: Comparative genomic analysis, diversity and evolution oftwo KIR haplotypes A and B. Gene 2004, 335:121–131.
54. Norman P, Abi-Rached L, Gendzekhadze K, et al: Meiotic recombinationgenerates rich diversity in NK cell receptor genes, alleles, andhaplotypes. Genome Res 2009, 19:757–769.
55. Nei M, Gu X, Sitnikova T: Evolution by the birth-and-death process inmultigene families of the vertebrate immune system. Proc Natl Acad SciUSA 1997, 94:7799–7806.
56. Liao D: Concerted Evolution: Molecular mechanism and biologicalimplications. Am J Hum Gen 1999, 64:24–30.
57. Hood L, Campbell JH, Elgin SCR: The organization, expression, andevolution of antibody genes and other multigene families. Ann Rev Gen1975, 9:305–353.
58. Ohta T: On the evolution of multigene families. Theor Pop Biol 1983,23:216–240.
59. Vance RE, Jamieson AM, Raulet DH: Recognition of the Class Ib moleculeQa-1 by putative activating receptors CD94/NKG2C and CD94/NKG2E onmouse natural killer cells. J. Exp. Med 1999, 190:1801–1812.
60. Lejeusne C, Bock DG, Therriault TW, MacIsaac HJ, Cristescu ME: Comparativephylogeography of two colonial ascidians reveals contrasting invasionhistories in North America. Biol Inv 2011, 13:635–650.
61. Lopez-Legentil S, Turon X, Planes S: Genetic structure of the star seasquirt, Botryllus schlosseri introduced into southern European harbours.Mol Ecol 2006, 15:3957–3967.
62. Librado P, Rozas J: DnaSP v5: A software for comprehensive analysis ofDNA polymorphism data. Bioinform 2009, 25:1451–1452.
63. Stamatakis A, Hoover P, Rougemont J: A rapid bootstrap algorithm for theRaxML web servers. Syst Biol 2008, 57:758–771.
64. Rambaut A: FigTree 1.3.1. Computer program available from website http://tree.bio.ed.ac.uk/software/figtree. 2006–2009.
65. Ronquist F, Huelsenbeck JP: MRBAYES 3: Bayesian phylogenetic inferenceunder mixed models. Bioinform 2003, 19:1572–1574.
66. Nei M: Molecular Evolutionary Genetics. New York: Columbia UniversityPress; 1987.
67. Wilson DJ, McVean G: Estimating diversifying selection and functionalconstraint in the presence of recombination. Genetics 2006,172:1411–1425.
68. Excoffier L, Lischer HEL: Arlequin suite ver 3.5: A new series of programsto perform population genetics analyses under Linux and Windows.Mol Ecol Res 2010, 10:564–567.
doi:10.1186/1471-2148-12-249Cite this article as: Nydam and De Tomaso: The fester locus in Botryllusschlosseri experiences selection. BMC Evolutionary Biology 2012 12:249.