the feasibility of privatizing pittsburgh's public
TRANSCRIPT
1
The Feasibility of Privatizing Pittsburgh's Public Authorities to Forestall Bankruptcy
Independent Study Project, Spring 2009
Lora Mae Aquinde Andrew Bray
Sanya Gurnani Robert Kaminski
Master of Science in Public Policy and Management Candidates, May 2009
School of Public Policy and Management Heinz College
Carnegie Mellon University
Advised by: Professor Robert Strauss

2
Executive Summary
As a vehicle to forestall the bankruptcy of the City of Pittsburgh, we analyzed the financial viability of the privatization of the Parking and Water and Sewer Authorities. Our analysis, based on financial models created from data collected from the Authorities and other sources, provides two conclusions: privatization of the Parking Authority is feasible. On the other hand, due to data unavailability, it is difficult to estimate reliably what the Water Authority would be worth, especially because the project was unable to obtain data on the nature of the underground water and sewer distribution pipes in terms of age and capacity. As a result of this uncertainty, a hybrid approach to privatization that would involve a public/private partnership that would involve, in effect, risk sharing, due to the unknown nature of future capital needs, deserves further study. An essential ingredient to such a study would be the disclosure of the status of the underground capital stock of the water and sewer authority which in turn would enable a realistic appraisal of what capital needs will be over the immediate and inter-mediate time periods. Funding for this project from the Eden Hall Foundation of Pittsburgh, Pennsylvania is gratefully acknowledged.

3
Table of Contents
Introduction .................................................................................................................. 5
Process.......................................................................................................................... 6
Pittsburgh Parking Authority
History .......................................................................................................................... 7
Description.................................................................................................................... 8
Competitive Analysis ......................................................................................................... 9
Price Elasticity of Demand for Parking in Pittsburgh ......................................................... 10
Financial Valuation and Analysis ................................................................................. 11
Methodology................................................................................................................... 11
Assumptions............................................................................................................... 12
Free Cash Flows .............................................................................................................. 13
Net Income ................................................................................................................. 13
Depreciation ............................................................................................................... 14
Capital Expenditure..................................................................................................... 14
Change in Net Working Capital.................................................................................... 14
Present Value of Real Estate Tax Liability..................................................................... 14
Total Long Term Debt ................................................................................................. 15
Results............................................................................................................................ 15
Sensitivity Analysis .......................................................................................................... 15
Pittsburgh Water and Sewer Authority
History ........................................................................................................................ 16
Description.................................................................................................................. 17
Water System .................................................................................................................. 17

4
Sewer System .................................................................................................................. 18
Property Valuation........................................................................................................... 19
Current Situation......................................................................................................... 19
Water Consumption......................................................................................................... 20
Financial Valuation and Analysis Methodology ........................................................... 22
Estimating Value of Operations ....................................................................................... 22
Assumptions............................................................................................................... 22
Free Cash Flows .............................................................................................................. 23
Debt of the Authority .................................................................................................. 24
Capital Expenditure of the Authority ........................................................................... 24
Results............................................................................................................................ 24
Scenario 1:.................................................................................................................. 25
Scenario 2:.................................................................................................................. 27
Comparative Efficiency: Public vs. Private Utilities ....................................................... 30
Benchmark Ratios............................................................................................................ 30
Water and Sewer Rates .................................................................................................... 31
Public-Private Partnership (PPP)................................................................................... 31
Case Study: Clarion County Regionalization..................................................................... 32
Pittsburgh Water and Sewer Authority.............................................................................. 32
Appendix A Operating Efficiency Benchmark Ratios .................................................... 34
Appendix B PWSA Debt Overview................................................................................... 1
Appendix C ................................................................................................................. 37
Appendix D Follow-Up Letter to PWSA Regarding Documents Requested in Right to Know Request ............................................................................................................. 38
Works Cited................................................................................................................. 41

5
Introduction
With the City of Pittsburgh experiencing serious financial woes, including prospective municipal pension fund insolvency and outstanding annual debt service topping nearly 18% (the highest in the country) of the budget, we set out to find and analyze the ways the City can forestall bankruptcy. With unlimited power to tax, a traditional bankruptcy case would not likely hold up. With a decreasing tax base and major organizations that are tax-exempt, significantly increasing taxes would also not likely be viable without significant effects on the population.
Looking to examples of other financially-troubled municipalities, we identified that the privatization of public assets (freeways, parking lots, etc) could be an easy way to inject cash into the City budget while eliminating an annual liability which is currently $577 million. As of January 15th 2009, the unfunded liability of the Pension fund of the City of Pittsburgh is $577 million representing 64 percent of the total pension fund (see Figure 1).
The governmental structure of the City is unique in that many functional municipal departments (with their own missions and assets) operate as quasi-independent authorities - these include the Housing Authority, Urban Redevelopment Authority, Sports and Exhibition Authority, and others. Of these authorities we identified two with the most straightforward, commonly privatized assets: the Parking Authority and the Water and Sewer Authority.
In other municipalities, these types of transactions have historically been structured as long-term leases or outright sales. Given the legal complexity and liability structures of long-term leases (What happens when a garage collapses? Who is responsible?), we focused on the outright sale of the authorities.
Figure 1. City of Pittsburgh Pension Fund Status
Source: http://www.city.pittsburgh.pa.us/mayor/assets/09_Pension_Solution_Parking_Garage_Lease.pdf

6
With the growing national trend of private sector involvement in the operations and maintenance of municipal authorities, particularly water and sewer systems, it is hard to ignore the obvious that this will eventually creep up in Pittsburgh. With regards to privatization of authorities, options include contracting certain functions of the operations, such as installation of water mains, equipment rental and in some cases meter readings. In the most extreme case, there is an outright sale of the authority. In this extreme case, the municipality that created the authority receives the net proceeds from the sale after all debt has been paid.
The goal of this study is to analyze the feasibility of privatization of these two authorities. With publically available data, other private sources, and expert industry opinion, we constructed financial models to determine sales prices under realistic assumptions.
Process
Our first approach was to obtain audited financial statements for the last 5 years to enable us project the operations of the authority. The next approach was to have a basis of comparison for the authority. What would a private entity looking to invest in the authority expect? Would that entity be interested in operations or maintenance of the authority or both?
An authority is a separate legal entity with power to incur debt, own property and finance its activities by means of user charges or lease rentals. The reasons for creating authorities such as the Pittsburgh Water and Sewer Authority include- financial reasons such as the desire to avoid local tax increases (people may accept authority user charges because of its relative freedom from political pressure), administrative reasons, since they perform only one function, the authority board can concentrate its energies on a single area (removal of authority affairs from close popular control allows it to make decisions beneficial to the public in the long run, but possibly unpopular in the short run).
The analysis was approached in a holistic way - we collected and analyzed financial and technical data from a variety of sources, spoke with industry experts, obtained key documents, identified key assumptions and ultimately created flexible financial models incorporating this information.
Data for the parking analysis was easily and relatively painlessly obtained. It consisted of audited financial statements of the Parking Authority for FY 2003 through 2007 obtained with the assistance of Deputy County Controller Guy Tumolo and current and historical parking rate information (the latter obtained using the Wayback Machine at http://www.archive.org). To get a bigger-picture qualitative view on the situation, we spoke with Merrill Stabile, President of ALCO Parking, the largest private parking operator in the city as well as Dr. Robert C.

7
Hampshire, assistant professor of operations research at the Carnegie Mellon Heinz College, someone with knowledge and experience with structuring of capital sales.
On the other hand, the data for the Water and Sewer Authority was not as easy to obtain. Despite a Right to Know request and a meeting with the Director of the Water and Sewer Authority and their external counsel, we did not receive some relevant information such as the inventory pipe information and the detailed and separate financial statements for the Water and Sewer Systems. Professors at Carnegie Mellon, Dr. Dave Dzombak and Dr. Jeanne VanBriesen who were also very helpful while explaining the internal structure of this authority. Meeting with the Director of Pennsylvania American Water (PAAW) was essential to our analysis as she provided us with the potential to do a competitive analysis as well as clear goals for the financial analysis.
Pittsburgh Parking Authority
History The Authority, a body corporate and politic under the laws of the Commonwealth of Pennsylvania, was organized in 1947 by the City of Pittsburgh pursuant to the Parking Authority Law of Pennsylvania, Act of June 5, 1947, P.L. 458, as amended and supplemented, 53 P.S. SS 341 et seq. , (the "Act").1
The Authority was created for the purpose of conducting the necessary research activity to maintain current data leading to efficient operation of on-street parking facilities, and is authorized by law to plan, design, locate, acquire, hold, construct, improve, maintain and operate, own and lease, either in the capacity of lessor or lessee, land and facilities to be devoted to the parking of vehicles of any kind; to borrow money; to make and issue bonds and to secure the payment of such bonds or any of its revenues and receipts; and to make such agreements with the purchasers or holders of such bonds, or with others in connection with any such bonds, as the Authority shall deem advisable.
The Authority has the power of eminent domain and all Authority property is exempt from real estate taxation, except any part of its structures or facilities used for commercial activities. The Authority has no taxing power.
1 “Pittsburgh Parking Authority – History and Purpose.” Pittsburgh Parking Authority. 23 Mar. 2009. <http://www.city.pittsburgh.pa.us/pghparkingauthority/html/history_and_purpose.html>.
Deleted:

8
The Act also permits parking authorities to sell or lease air rights or space above their facilities for commercial uses other than parking (except the sale of gasoline or automobile accessories). Such commercial space is subject to real estate taxes.
The Authority is governed by a five member Board (the "Board"); appointed by the Mayor of the City of Pittsburgh to serve without compensation for staggered terms of five years at the pleasure of the Mayor. The Authority's staff is employed to administer the Authority's program and carry out decisions of the Board.
Description With eleven downtown garages, and a total of over almost 9,000 parking spaces, the Parking Authority controls approximately 60 percent of the market for parking in Pittsburgh. With total outstanding debt and interest of approximately $160 million, total debt per parking space clocks in at around $20,000 - a number, according to industry sources, roughly in line with that of the private sector. The Parking Authority brought in about $41 million in revenue in 2008. Garages Owned by the Parking Authority Downtown
1 First Avenue & T Station 2 Fort Duquesne/Sixth 3 Grant Street Transportation Center 4 Mellon Square 5 Ninth/Penn 6 Oliver Garage 7 Smithfield/Liberty 8 Third Avenue 9 Wood/Allies
Neighborhood
1 Forbes/Semple 2 Shadyside
Attended Lots
1 Monongahela Wharf 2 Second Avenue Parking Plaza

9
Competitive Analysis Pittsburgh is broken up into 6 zones. The tables below show the break up of garages according to these zones. The rates of the Pittsburgh Parking are on an average 54 percent lower than its competition, the private parking operators such as ALCO Parking 2.
Table 1. Parking Rates: Pittsburgh Parking Authority vs. Private Operators
Zone Total Spaces Daily Max Rate
Zone 1
Ft. Duquesne & Sixth Street Garage 920 $9.75 Private Operators 1,707 $16.10
Zone 2
Ninth & Penn Garage 586 $9.75
Grant Street Transportation Center Garage 991 $13.00
Private Operators 2,556 $15.56
Zone 3
Third Ave. Garage 570 $12.75
Wood/Allies Garage 542 $9.75
Mon Wharf Garage 700 $8.00
Private Operators 2,762 $16.76
Zone 4
Smithfield/Liberty Garage 596 $8.75
Oliver Garage 480 $6.00
Private Operators 250 $22.00
Zone 5
First Ave Garage 1,243 $8.75
Second Ave Plaza 420 $6.00
Private Operators 3,935 $14.02
Zone 6
Mellon Square Garage 798 $13.75
Private Operators 6,612 $12.76
2 Pittsburgh Parking Authority Annual Financial Statement 2008

10
Price Elasticity of Demand for Parking in Pittsburgh With downtown garage utilization rates from the audited financial reports and historical parking rate information collected from cached Parking Authority webpages, we were able to calculate an approximate price elasticity of demand for parking in downtown Pittsburgh. The last major parking rate increase for which we also had utilization data was in FY 2004. Taking the percentage change in parking utilization from 2003 to 2004 divided by the percentage change in parking rates (we used the day lease rate as a proxy number) yielded an elasticity -0.30 (see Table 1). This means that a 1% increase in parking rates leads to a 0.30 percent decrease in parking utilization - a relatively inelastic value. If this number is applicable to the rest of the parking in downtown, operators (including the Authority) could stand to significantly increase rates without losing much business. Mr. Stabile indicated that there is excess demand in the market for parking, and considering suburban commuters into the city, the propensity for drivers to cease parking altogether downtown is limited.
Table 2. Price Elasticity of Demand Calculated from Day Lease and Utilizations Rates Changes, FY 2003 And 2004
Sensitivity Analysis of Parking Rate Increases
Given the relative inelasticity of demand for parking downtown, a revenue raising option for the City is to increase the rates charged for parking in Authority-owned garages. It is to be noted that the demand for parking is not perfectly inelastic; An increase in rates does cause a decrease in parking utilization (albeit a small one). In other words, the Authority cannot infinitely raise parking rates. Using the elasticity calculated in Table 2 and 2008 parking receipts (note: not net

11
of costs), we are able to construct a sensitivity analysis with to calculate exactly how high rates can be increase before revenue decreases due to decreased demand (see Figure 2).
Figure 2. Sensitivity of parking rate increases
Using this sensitivity, the Authority could reasonably increase rates by 120 percent before decreased demand leads to decreasing revenue. With rates increased by 120 percent, parking receipts would reach an approximate level of $38 million before decreasing. Between that point and 230 percent, parking receipts would decrease until they reach the baseline 2008 levels.
Financial Valuation and Analysis Methodology In order to calculate the value of the Parking Authority, we used the Discounted Cash Flow Analysis. We calculated the Free Cash Flow for 5 years through projected sales and other assumptions and then calculated the Terminal Value by assuming a normalized growth rate of 3%. The sum of the present values of the 5 years and the terminal value gave us the total present value. We then subtracted the Total Debt and Net property tax value to calculate the Net Present Value of an outright sale.

12
Estimating Value of Operations
The Operating Income was calculated by subtracting the Operating Expenses from the Operating Revenue for the past 5 years. We then calculated the operating margin of all 5 years by dividing the Operating Revenue by the Sales.
Assumptions
• Growth of sales The average growth rate of sales over the past 5 years has been 8 percent. Assuming that a private entity will make processes more efficient and increase the growth of the authority, we have valuated the authority based on a 10 percent growth rate. We understand that this is a more aggressive estimate and have thus done a sensitivity analysis in order to judge the change in value of the authority with higher as well as lower growth rates.
• Cost of Capital The cost of capital reflects the average risk and overall capital structure of the authority. If a Private Entity shows an interest in buying the authority, they will require at least a 10% rate of return. In this case the cost of capital is equal to the rate of return required in this transition. The cost of capital is based on the risk free rate and the market rate of return if the CAPM formula is used. We calculated it to be 10.76 percent.
• Risk- free rate Since most investors are averse to risk, they require a higher expected return to induce them to invest in a risky equity. We treated the Parking Authority as a risky equity. The cost of capital that a private entity would require should be high. We use the yield on a 10-year T-bond as a proxy for risk free rate3. As at May 6th 2009, this was at 3.16 percent.
• Risk Premium The risk premium is driven primarily by investors’ attitude toward risk. The current economic situation will suggest that investors will be more risk averse than they were 50
3 http://www.federalreserve.gov/releases/h15/update/

13
years ago. We assume a risk premium of 7.6 percent, based on the fact that market prices are relatively low. Risk premium is the second part of the CAPM and it includes the beta and expected market return.
Table 3: List of Assumptions
Line Item Assumption
Sales Growth Rate 12.00% Operating Margin 32.50% Cost of Capital 10.67% Long-term Growth Rate 3.0% Depreciation average of last 3 years Change in Working Capital 116% change in sales Cap Ex average of last 3 years Number of Years 5 Income Tax 35.00%
Free Cash Flows The calculation of free cash flows is based on the following formula. Each of these are explained in further detail.
Net Income
• Operating Income We first calculated the operating gross margin from the past 5 years by dividing the operating income by the net income and then took an average of the past 3 operating margins. This average operating margin was 32.5 percent and we used this to calculating the projected operating income for the next 5 years.
• Taxes We then subtracted the real estate taxes from the Operating Income to calculate the net income to be used in this calculation. The real estate taxes were on an average 10 percent of the net income and this same percentage was used to project tax payments.

14
Depreciation Depreciation is a noncash expense that reduces the value of an asset as a result of wear and tear, age, or obsolescence. Most assets lose their value over time (in other words, they depreciate), and must be replaced once the end of their useful life is reached. We took an ongoing average of the past 3 years to project depreciation.
Capital Expenditure Funds used by a company to acquire or upgrade physical assets such as property, industrial buildings or equipment. We took an ongoing average of the past 3 years to project capital expenditure.
Change in Net Working Capital We calculated the ratio of change in net working capital over the change in sales for the past 5 years and then used the average percentage to calculate the projected change in working capital. The average percentage is 116%.
Present Value of Real Estate Tax Liability If the Parking Authority were sold to a private entity, it would be liable for annual real estate taxes to Allegheny County, the City of Pittsburgh as well as the School District. Given millage rates of 4.69, 10.8, and 13.92, the combined tax liability would be 29.41 mills, or $29.41 on every $1,000 of valuation.
To get an approximate estimate of the value of the property owned by the Authority, we obtained a dataset of Allegheny County property assessments and filtered out all those properties designated as being owned by the Authority. This required hand selection, as some lines were labeled "Public Parking Authority," or "Public Parking Auth of Pittsburgh," "Public Parking Authority of PGH," etc. There were 38 such properties. Using information from the Authority, we compiled a separate list of Authority-owned garages and lots. These totaled 46. While we had specific addresses for properties in the latter listing, the Allegheny County dataset used Parcel ID numbers. Comparing these two listings, there appeared to be properties in our self-created listing that did not appear in the Allegheny County dataset and vice versa. Incentives to properly record publically owned property is likely low.
Summing up the total fair market values (according to Allegheny County valuations) of the properties listed as being owned by the Authority leads to a value of approximately $53 million. Taking into account missing properties, as well as capital costs per space, we estimated the total value of Authority real estate to be approximately $433 million ($164 million depreciated over 31 years).
Given total annual millage of 29.41, assuming no growth in millage or increase in property values, we found the discounted net present value of real estate tax liability to be approximately $7.7 million. Considering our growth assumptions and rough estimations of actual valuations, this should be considered a very conservative estimate.

15
Total Long Term Debt We summed up the current maturities of bonds payable and the bonds payable to calculate the total long term debt. The debt will need to be defeased as it is all callable and private entities cannot continue to hold municipal debt.
Results Assuming that this is an all cash transaction and the debt is defeased completely, we value the authority to be only worth $71 million. This is very different from the number Mayor Ravenstahl has been quoting in the press of $300-400 million.
Table 4. Final NPV Results
Results
Present Value $ 51,990,297.1 Terminal Value $ 123,182,755.3 Net Present Value $ 175,173,052.4 Total Debt $ 105,010,462.0 Present Value of Real Estate Taxes $ 7,692,300.0 Total Value $ 62,470,290.4
Sensitivity Analysis Table 5 shows how the NPV would change with the change in sales growth rate and the cost of capital. We can see that the NPV decreases with the increase in cost of capital and with the decrease in the sales growth rate.
Table 5. Sensitivity Analysis

16
Cost of Capital Sales Growth Rate
70,966,960.77$ 14.0% 12.0% 10.0% 8.0% 6.0% 4.0%
18.0% ($26,160,607) ($23,373,781) ($20,931,074) ($18,813,357) ($17,001,970) ($15,478,724)
16.0% ($12,803,214) ($9,584,769) ($6,783,413) ($4,375,656) ($2,338,589) ($649,886)
14.0% $5,440,175 $9,243,497 $12,528,488 $15,324,725 $17,661,048 $19,565,560
12.0% $31,831,531 $36,474,527 $40,450,625 $43,798,385 $46,555,400 $48,758,296
10.7% $57,030,238 $62,470,290 $67,100,110 $70,966,961 $74,116,915 $76,594,856
8.0% $148,207,598 $156,511,999 $163,481,536 $169,195,476 $173,731,079 $177,163,589
6.0% $323,021,911 $336,785,505 $348,198,760 $357,403,146 $364,536,519 $369,733,118
4.0% $1,197,684,548 $1,238,665,800 $1,272,188,523 $1,298,707,801 $1,318,667,016 $1,332,497,850
2.0% ($1,426,974,719) ($1,467,557,064) ($1,500,239,250) ($1,525,509,957) ($1,543,845,217) ($1,555,708,416) Pittsburgh Water and Sewer Authority
History Prior to 1984, the City’s water and wastewater system was operated and maintained by the City Water and Public Works Department. In 1984, Pittsburgh Water and Sewer Authority (PWSA) was created and through Lease and Management Agreement with the City, it was responsible for maintaining and improving the existing water and sewer system, collecting user fees, and overseeing a $200 million capital improvement program. The City, which was now an agent for the Authority, provided the services necessary to operate the system.
In July 1995, the Lease Agreement was terminated and both parties entered into a Capital Lease Agreement and a Cooperation Agreement. Pursuant to this Capital Lease Agreement, PWSA assumed full responsibility for operating and maintaining the system, and enforcing shared-costs agreements with outside municipalities. Since the system still belongs to the City, PWSA made minimum lease payments of $101 million to the City during the first 3 years of the contract. The Authority will have the option to purchase the system in for $1 when the lease expires in 2025.
Meanwhile, in accordance with the terms of the Cooperation Agreement, employees of the City’s Water Department are now under the Authority. As such, employee-related obligations are now the responsibility of PWSA although pension costs are entirely covered by the City (PWSA’s employees still participate in the City’s Municipal Pension Fund Plan4). The City still continues to provide for certain services, e.g. vehicle maintenance, engineering, financial, legal information, in connection with operating and maintaining the system for which PWSA reimburses the City for these related direct and indirect costs.
4 As per meeting with PWSA Director Michael Kenney, 23 March 2009.

17
It is worth noting the important features of these Agreements: (a) provision of water services to the City, e.g. government usage, public, free of charge for a maximum of 600 million gallons per year, and (b) taking on the City’s obligation to subsidize water customers not served by PWSA so their water charges are similar to those imposed by the Authority.
Description
Water System PWSA currently services approximately 83,000 domestic, commercial, industrial and public customers in the Pittsburgh region although this figure has dropped in 2007 largely due to a decline in residential customers (see Table 6). It also has existing contracts for water sales to neighboring municipalities (see Table 7). To meet this demand, the Authority relies solely on Allegheny River as its water source. The Authority is permitted by the Pennsylvania Department of Environmental Protection (PADEP) a maximum withdrawal of 100 million gallons per day (MGD).
Table 6. Number of Connections Served, 2003 – 2007 2003 2004 2005 2006 2007
Domestic 74,251 74,203 75,119 75,028 72,233
Commercial 6,923 6,204 6,011 6,069 6,071
Industrial 116 118 150 143 140
Institutional 565 557 569 565 556
Other 901 1,090 1,460 1,501 1,491
Total 82,756 82,172 83,309 83,306 80,49182.756 82.172 83.309 83.306 80.491
% Pop Served 80% 80% 80% 80% 80%
Source: PADEP Annual Water Supply Report, 2003 - 2007

18
Table 7. Municipalities/Authority Served by PWSA
PA American Water
West View Water Authority
Reserve Township
Millvale
Shaler Township
Etna Borough
Sharpsburg Borough
Fox Chapel Water Authority
Blawnox Borough
Emergency
Supply
Municipality/Authority Purpose of Service
Supply
Supply
Supply
Emergency
Emergency
Emergency
Emergency
The PWSA distribution system is comprised of 15 pressure zones, 1,200 miles of distribution mains, 12 pumping stations, 5 reservoirs and 11 water storage tanks. The treatment system is composed of a primary water treatment plant located in Aspinwall and a membrane plant in Highland Park; the former is capable of producing up to100 MGD while the latter only has 20 MGD treatment capacity.
PADEP and the Allegheny County Health Department (ACHD) have issued a consent order against PWSA in 1996 to comply with the PA Safe Drinking Water Act, specifically to enclose all water storage facilities, i.e. install membrane covers on four reservoirs – Herron Hill, Lanpher, Highland #1, and Highland #2. All but one of the reservoirs are now covered; Highland #2 is scheduled to be covered this year as outlined in the Capital Improvement Program in the Authority’s 2008 bond issue (Project A2).
Sewer System The sewage collection system spans 83 municipalities in Allegheny Count with Pittsburgh being the largest municipality to convey raw sewage to the Allegheny County Sanitary Authority (ALCOSAN) for treatment.
PWSA is responsible for maintaining the City’s sewer system, transporting sewage to ALCOSAN and billing of services rendered by ALCOSAN while ALCOSAN’s role is to convey, treat and dispose of sewage.
Currently, the City has a combined water system where sanitary and storm flows converge into the same sewer main before it is coveyed to the sewage treatment plant and then discharged into
Source: PWSA 2003 Bond Issue

19
the Ohio River. This set-up allows for combined sewer overflows which can pollute the waterways with sewage. All municipalities, together with ALCOSAN, are in the process of addressing the combined sewer overflow issue and of complying with the Clean Water Act. specifically the Combined Sewer Overflow Policy, as per the consent order issued in 2004 with the US Environmental Protection Agency (US EPA), PADEP and ACHD. To date, ALCOSAN has paid $1.2 million in federal fines5.
Property Valuation PWSA has a total of 11 properties as listed in the Allegheny County Assessment SAS dataset of properties owned by all authorities in the area. Total fair market value for these properties is valued at only $73,200.
Table 8. PWSA Properties
PROPERTYOWNER PROPERTYHOUSENUM PROPERTYADDRESS MUNIDESC USEDESC FAIRMARKETTOTAL
PITTSBURGH WATER & SEWER AUTHORITY 808 53RD ST 10th Ward - PITTSBURGH VACANT LAND 2,100$
PITTSBURGH WATER & SEWER AUTHORITY 0 53RD ST 10th Ward - PITTSBURGH VACANT LAND 2,200$
PITTSBURGH WATER & SEWER AUTHORITY 26 WELSH WAY 17th Ward - PITTSBURGH VACANT LAND 1,400$
PITTSBURGH WATER & SEWER AUTHORITY 24 WELSH WAY 17th Ward - PITTSBURGH VACANT LAND 1,400$
PITTSBURGH WATER & SEWER AUTHORITY 22 WELSH WAY 17th Ward - PITTSBURGH VACANT LAND 1,800$
PITTSBURGH WATER & SEWER AUTHORITY 20 WELSH WAY 17th Ward - PITTSBURGH VACANT LAND 1,900$
PITTSBURGH WATER & SEWER AUTHORITY 5301 CELADINE ST 10th Ward - PITTSBURGH SINGLE FAMILY 60,600$
PITTSBURGH WATER AND SEWER AUTHORITY 0 ERK WAY 24th Ward - PITTSBURGH MUNICIPAL GOVERNMENT 500$
PITTSBURGH WATER AND SEWER AUTHORITY 0 TANK ST 24th Ward - PITTSBURGH MUNICIPAL GOVERNMENT 500$
PITTSBURGH WATER AND SEWER AUTHORITY 0 TANK ST 24th Ward - PITTSBURGH MUNICIPAL GOVERNMENT 400$
PITTSBURGH WATER AND SEWER AUTHORITY 0 FLORENCE ST 24th Ward - PITTSBURGH MUNICIPAL GOVERNMENT 400$
Current Situation A goal that PWSA is striving towards is to market water to other communities outside of the City of Pittsburgh service area. PWSA provides drinking water to Blawnox, Fox Chapel, Millvale, Reserve Township, as well as portions of Pennsylvania American Water System.
What is the current financial state of PWSA? How can we evaluate the valuation of the authority? Obtaining data for this analysis was an arduous task. The most challenging part of the project was our inability to obtain consistent data, particularly the Authority’s detailed income and balance sheet statements and the annual continuing property records, which would have allowed for a more thorough analysis. This constraint hindered our ability to do an analysis on lease of operations or maintenance of the Authority to any interested private entity. The most we were able to do was to compare water rates of the Authority to private water distributing
5 In an Associated Report press release dated April 3, 2009, it stated that bringing the sewer system into compliance will cost between $10 - $50 billion.

20
companies in the City.
Water Consumption Before we proceeded in our analysis, we wanted to understand the nature of the demand for water in the City of Pittsburgh. Where does the water go to in the city? As can be seen from Figure 2, demand from industrial and institutional customers, and bulk sales to other water service providers have remained relatively stable. Commercial demand has been fluctuating over time while domestic usage has been declining6. What is surprising in the chart is the large proportion of unaccounted for water – from a low of 19 percent to a high of 30 percent.7 In a study done by the Municipal Technical Advisory Service (MTAS) of the University of Tennessee, a high proportion of unaccounted for water, which can reach around 40 percent, is not uncommon in the United States although this observation is a more common feature among publicly-owned water utilities. The ideal percentage for this water loss is set at 5 percent. The chart also shows a manifestation of the free water being provided annually by PWSA to the City as part of the Cooperation Agreement signed in 1995; this is categorized as “Other”, where it includes water that goes into public, municipal, hydrant inspections, hydrant flushing, street flushing, government usage, plant processes, etc. This particular provision demonstrates that the Authority is foregoing a huge sum of earnings with percentages ranging from 29 to 33 percent of total water use in addition to the amount of water that is unaccounted for. Summing the two largest categories of water consumption, PWSA lost about 48 to 63 percent of non-revenue earning water from 2003 – 2007. Comparing these two, it is clear that more money is lost to the free provision of water to the City. Perhaps the best description arising from this pro bono service is “the biggest leak in the pipe is the City of Pittsburgh”.
6 As per the meeting with Mr. Michael Kenney (PWSA Executive Director), the Authority is attributing the decreased demand mainly to water conservation methods rather than as a function of changes in the population or number of connections. 7 Unaccounted for water is defined by the Municipal Technical Advisory Service (MTAS) of the University of Tennessee as the difference between water produced and the water used by the customers – this can come from leaks, inaccurate meters, water consumed but not metered, improper meter reading and billing/accounting errors.

21
Figure 3. Average Daily Water Use (Metered and Unmetered Connections), 2003 - 2007
2003 2004 2005 2006 2007
Unaccounted for Water 15,880,081 13,175,895 21,675,158 19,961,690 20,465,920 21% 19% 30% 28% 29%
Other 24,230,000 23,575,000 21,370,000 22,682,000 20,465,920 33% 33% 29% 32% 29%
Bulk Sales to other PWS 2,656,252 3,152,000 2,788,762 2,329,071 3,165,008 4% 4% 4% 3% 4%
Institutional 4,635,630 4,235,532 3,992,559 4,048,288 4,077,397 6% 6% 5% 6% 6%
Industrial 2,173,753 2,130,666 1,855,244 1,576,236 2,495,419 3% 3% 3% 2% 3%
Commercial 9,773,890 9,923,035 8,344,151 8,294,030 8,795,466 13% 14% 11% 12% 12%
Domestic 14,760,394 14,295,659 12,771,512 12,241,132 12,088,167 20% 20% 18% 17% 17%
Total 74,110,000 70,487,787 72,797,386 71,132,447 71,553,297
Note: Domestic use is the only category that has unmetered connections.
0%
10%
20%
30%
40%
50%
60%
70%
80%
90%
100%
2003 2004 2005 2006 2007
unaccounted for
other
bulk sales to other PWS
institutional
industrial
commercial
domestic

22
Financial Valuation and Analysis Methodology The methodology for the following valuation of PWSA is adopted from on the Allegheny Institute Report “A Financial Valuation of the Pittsburgh and Sewer Systems” done in 1995 by Daniel Hagan and William McDonald. They used a Discounted-Cash-Flow approach where free cash flows (FCF) per period are calculated and then deriving their respective present value using a normalized discount rate. The “intrinsic value” is then calculated by summing the present values of the FCF. The discounted cash flow used for the valuation is the Gordon Model:
+
Where,
CF = cash flow
r = discount rate
n = time period 1 to t
TV = terminal value
Estimating Value of Operations We based projections of the financial statements on the pro-forma report obtained from the Director of Finance of PWSA.8 We proceeded to get the free cash flow, the cash from operations that is actually available for distribution to investors. The value of operations is the present value of the free cash flows the authority is expected to generate out into the future.
Assumptions
• Growth of sales, expenses PWSA pays no dividends so the growth rate is assumed to reflect sales growth forecast. Based on the pro-forma budget provided, PWSA is conservative enough to forecast zero growth in sales revenue from 2010 - 2012. Expenses, on the other hand, were forecasted
8 This report was emailed to us. Excel sheet is available.

23
to grow at 3 percent annually. This was based on the 5-year pro-forma provided by PWSA. In addition, the model assumes that PWSA will not expand its operations, i.e. acquire small water purveyors in the adjacent municipalities.
• Cost of Capital The cost of capital reflects the average risk and overall capital structure of the authority. The Pittsburgh Water and Sewer Authority have two divisions that differ in risk, water and sewer. However we were unable to obtain disaggregated information. We therefore assumed them as one division; hence projects undertaken are for both water and sewer. No adjustments for cost of capital are needed.
• Risk- free rate Since most investors are averse to risk, they require a higher expected return to induce them to invest in a risky equity. We treated the Pittsburgh Water and Sewer Authority (PWSA) as a risky equity. The cost of capital that a private entity would require should be high. We use the yield on a 10-year T-bond as a proxy for risk free rate9. As at May 6th 2009, this was at 3.16 percent.
• Risk Premium The risk premium is driven primarily by investors’ attitude toward risk. The current economic situation will suggest that investors will be more risk averse than they were 50 years ago. We assume a risk premium of 7.6 percent, based on the fact that market prices are relatively low.
• Expected Return on the Market A private entity seeking to invest in the Water and Sewer Authority would expect a return of 10.76 percent (the sum of the risk free rate and the risk premium).
Free Cash Flows We based the representation of the cash generated by the Authority on pro-forma report provided to us. The approach involved taking the operating cash flow and subtracting capital expenditure. Projections for the cash flow forecast were based on figures provided from PWSA’s pro-forma budget. Cash flows were restated, detailing operating revenues and operating expenses from 2008 through 2012.
9 “Federal Reserve Selected Interest Rates (Daily).” Federal Reserve System, 6 May 2009. <http://www.federalreserve.gov/releases/h15/update/>

24
Debt of the Authority The combined debt of the Authority include, Series 1993 A Revenue Bonds, Series 1998 A, B and C Revenue Bonds, Series 2003, Series 2007 A, B 1-2, Series 2008 A, B, C and D Revenue Bonds, Pennvest Bonds, and payments to the City through the City Cooperation Agreement. As of FY 2008, outstanding debt of the Authority was at $793,575,000.
Debt service payments include payments to existing bond issues, Pennvest bonds, as well as ongoing Variable Rate Demand Bonds (VRDB) fees. We realized a level forecasted debt service payments from 2008 through 2040 for forecasted debts service payments.10
Total debt outstanding would be defeased by the authority in the case of an outright sale.
Capital Expenditure of the Authority Based on the Capital Expenditure Plan in the Engineers Report for 2008 Bond Issue, we created two scenarios to allow for a sensitivity analysis.
Table 9. PWSA Capital Improvement Plan
2008 2009 2010 2011 2012
A1 Water - Water Distribution 350,000$ 3,150,000$ 3,150,000$ 2,650,000$
A2 Water - Pumping and Storage 379,167$ 6,050,000$ 1,350,000$ 20,833$
A3 Water - Treatment Plant 9,402,611$ 12,785,667$ 3,211,389$ 36,147,000$
B2 - Sewer - Combined Sewer 125,000$ 2,440,000$ 2,240,000$ 3,640,000$
B4 - Sewer - Pump Station 1,860,000$ 1,500,000$
C1 - City/URA/SEA/Port Authority 4,125,000$ 5,975,000$ 3,250,000$ 3,700,000$ 1,175,000$
D1 - Engineering 1,855,000$ 2,520,000$ 2,420,000$ 2,420,000$
E1 Tools and Equipment 300,000$ 2,000,000$ 2,000,000$ 1,250,000$
Z1 Contingency 325,581$ 558,140$ 558,140$ 558,140$
Total 7,459,748$ 33,955,751$ 29,253,807$ 17,450,362$ 37,322,000$
As can be seen from the above table, capital expenditures have a budgeted 355 percent increase from 2008 to 2009; this expenditure drops to 14 percent and further dropping to 40 percent in 2010 and 2011, respectively, before it increases by 114 percent in 2012. Due to the fluctuation in budgeted amounts, the valuation will be done in two scenarios: the first scenario will conservatively assume $7.4million in capital expenditure from 2008 through2012 while the second scenario will use actual projections from the above table.
Results
10 Provided by PWSA, “PNC Capital Debt Overview FY 2008 Report”

25
Scenario 1: Less Construction Fund of $7.4million projected from 2008-2012.
Given the erratic increases in capital expenditure during the 4-year period, we assumed a constant stream of $7.4million in this scenario. By utilizing the lowest budgeted value, this scenario is the most optimistic. This generated a level positive cash flow for the projected periods.
Table 10. Scenario 1: Restated Cash Flow
2008 2009 2010 2011 2012
Projected Minimal Rate Increases: 0.00% 5.00% 0.00% 0.00%
Operating Revenue (1)
Utility Revenues Water and Conveyance (Net) 85,812,000 85,814,675 90,105,759 90,105,759 90,105,759
Utililty Revenues Wastewater (Net) 38,246,000 44,174,130 45,770,000 45,770,000 45,770,000
Fees 2,925,000 2,500,000 1,830,000 1,830,000 1,830,000
Misc. Other 2,131,000 2,500,000 2,000,000 2,000,000 2,000,000
Total Operating Revenue 129,114,000 134,988,805 139,705,759 139,705,759 139,705,759
Operating Expense (1)
Operating Expenses (excl. dep, amort) 39,069,000 40,241,070 41,448,302 42,691,751 43,972,504
Sewage Treatment expenses 38,246,000 44,174,130 45,770,000 45,770,000 45,770,000
Other Expenses
City Direct and Indirect Water & Sewer Costs 9,650,000 8,650,000 8,150,000 8,150,000 7,150,000
Non-city subsidy (2) 687,840 832,286 832,286 832,286 832,286
Total Operating Expense 87,652,840 93,897,486 96,200,589 97,444,038 97,724,790
Operating Income 41,461,160 41,091,319 43,505,170 42,261,721 41,980,969
Total Interest Earnings (3) 3,716,000 1,623,000 1,500,000 1,500,000 1,500,000
Less: Cooperation Agreement Bond Pmt (4) (2,500,000) (2,500,000) (1,000,000) (1,000,000) (1,000,000)
Less: Construction Fund (5) (7,459,748) (7,459,748) (7,459,748) (7,459,748) (7,459,748)
Free Cash Flow - Years 1 to 5 35,217,412$ 32,754,571$ 36,545,422$ 35,301,973$ 35,021,221$
RESTATED CASH FLOW FORECAST
Notes:
1
2
3
4
5
Reflects actual 2008 values, budgeted 2009 values and forecasted values for 2010 - 2012
Interest Income excludes Cap Int Trust Funds, "Unrealized Gains/Losses" and "Capitalized Interest Adj's".
Values based on PNC Debt Overview 2008 Bond 'Summary of Existing Revenue Bonds' less amounts for 'Cooperation Agreement'
Amount for 2008 provided by PAAW; the following years are based on the growth rate of 21% extrapolated from PWSA's original values in their proforma
Based on Engineers Report for 2008 Bond Issue. See Bond Drawdown Sheet

26
Table 11. Scenario 1: Intrinsic Value Calculation
Year 1 2 3 4 5 Terminal Value
Cash Flow 35,217,412$ 32,754,571$ 36,545,422$ 35,301,973$ 35,021,221$ 325,476,028$
Discount Rate 10.76% 10.76% 10.76% 10.76% 10.76% 10.76%
PV Factor 0.9029 0.8151 0.7360 0.6645 0.5999 0.5999
Discounted CF Stream 31,796,147$ 26,699,678$ 26,895,780$ 23,456,715$ 21,009,540$ 195,255,948$
Present Value of Cash Flows: 325,113,807$
INTRINSIC VALUE CALCULATION
WITH CAPEX--$7.4million constant
With the PV of PWSA cash flows at $325 million, the value of the Authority is a negative $468 million (see Figure 5).
Table 12. Scenario 1: Terminal Value Cash Flow for Years 6 to Infinity
Cash Flow for Year 5 35,021,221$
Growth Rate of Cash Flows
Revenue Growth Rate (1) 0%
Expense Growth Rate (2) 3%
Normalized Growth rate, g 0.00%
Discount Rate
Risk Free Rate (3) 3.16%
Plus: Risk Premium (4) 7.60%
Normalized Discount rate, r 10.76%
Capitalization Rate, r-g 10.76%
Cash Flow - Yr. 6 35,021,221$
Divisor, r-g 10.76%
Terminal Value Cash Flow 325,476,028$
Present Value of the Cash Flows 325,113,807$
Total Outstanding Debt 793,575,000$
Value of Authority (468,461,193)$
TERMINAL VALUE CASH FLOW FOR YEARS 6 TO INFINITY

27
Below is the sensitivity analysis for Scenario 1. Value of the authority at -$468 million is on the upper left-hand side. We can see that the value of the authority increases (blue shade), albeit still negative, as sales growth are more robust coupled with minimal increases in the cost of capital. Unshaded cells are worse cases.
Table 13. Scenario 1: Sensitivity Analysis
Cost of Capital Sales Growth
(468,461,193)$ 0% 0.50% 1% 1.5% 2.00% 2.50%
10.76% (468,461,193) (457,921,939) (446,302,844) (433,428,986) (419,085,511) (403,005,537)
10.90% (472,642,364) (462,430,259) (451,186,628) (438,746,867) (424,909,380) (409,424,572)
11.04% (476,717,499) (466,818,899) (455,934,382) (443,908,931) (430,553,230) (415,633,631)
11.18% (480,690,582) (471,092,564) (460,551,715) (448,921,936) (436,025,297) (421,642,869)
11.32% (484,565,398) (475,255,717) (465,043,935) (453,792,257) (441,333,317) (427,461,799)
11.46% (488,345,550) (479,312,593) (469,416,064) (458,525,908) (446,484,572) (433,099,338)
11.60% (492,034,463) (483,267,210) (473,672,858) (463,128,570) (451,485,919) (438,563,855)
11.74% (495,635,403) (487,123,391) (477,818,827) (467,605,615) (456,343,817) (443,863,211)
11.88% (499,151,478) (490,884,767) (481,858,248) (471,962,123) (461,064,365) (449,004,799)
12.02% (502,585,654) (494,554,794) (485,795,181) (476,202,905) (465,653,315) (453,995,576)
12.16% (505,940,760) (498,136,762) (489,633,481) (480,332,518) (470,116,107) (458,842,096)
12.30% (509,219,495) (501,633,804) (493,376,813) (484,355,286) (474,457,882) (463,550,539)
12.44% (512,424,437) (505,048,907) (497,028,663) (488,275,307) (478,683,507) (468,126,737)
12.58% (515,558,049) (508,384,919) (500,592,347) (492,096,475) (482,797,590) (472,576,196)
12.72% (518,622,688) (511,644,558) (504,071,025) (495,822,488) (486,804,499) (476,904,123)
12.86% (521,620,605) (514,830,419) (507,467,705) (499,456,864) (490,708,377) (481,115,442)
SENSITIVITY ANALYSIS
WITH CAPITAL EXPENDITURE---$7.4million constant
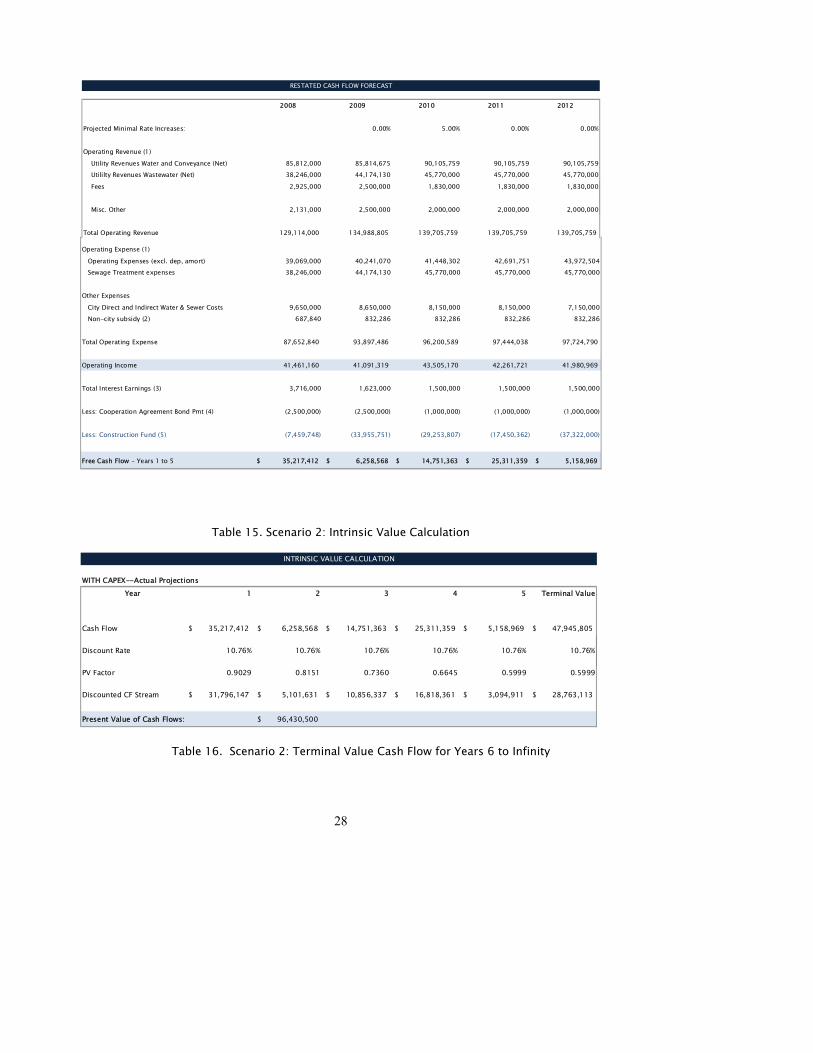
Scenario 2: Using actual projections of the Capital Expenditure Plan in the Engineers Report for the 2008 Bond Issue.
Table 14. Scenario 2: Restated Cash Flow Forecast
28
Operating Expense (1)
Operating Expenses (excl. dep, amort) 39,069,000 40,241,070 41,448,302 42,691,751 43,972,504 Sewage Treatment expenses 38,246,000 44,174,130 45,770,000 45,770,000 45,770,000
Other Expenses
City Direct and Indirect Water & Sewer Costs 9,650,000 8,650,000 8,150,000 8,150,000 7,150,000
Non-city subsidy (2) 687,840 832,286 832,286 832,286 832,286
Total Operating Expense 87,652,840 93,897,486 96,200,589 97,444,038 97,724,790
Operating Income 41,461,160 41,091,319 43,505,170 42,261,721 41,980,969
Total Interest Earnings (3) 3,716,000 1,623,000 1,500,000 1,500,000 1,500,000
Less: Cooperation Agreement Bond Pmt (4) (2,500,000) (2,500,000) (1,000,000) (1,000,000) (1,000,000)
Less: Construction Fund (5) (7,459,748) (33,955,751) (29,253,807) (17,450,362) (37,322,000)
Free Cash Flow - Years 1 to 5 35,217,412$ 6,258,568$ 14,751,363$ 25,311,359$ 5,158,969$
2008 2009 2010 2011 2012
Projected Minimal Rate Increases: 0.00% 5.00% 0.00% 0.00%
Operating Revenue (1)
Utility Revenues Water and Conveyance (Net) 85,812,000 85,814,675 90,105,759 90,105,759 90,105,759
Utililty Revenues Wastewater (Net) 38,246,000 44,174,130 45,770,000 45,770,000 45,770,000
Fees 2,925,000 2,500,000 1,830,000 1,830,000 1,830,000
Misc. Other 2,131,000 2,500,000 2,000,000 2,000,000 2,000,000
Total Operating Revenue 129,114,000 134,988,805 139,705,759 139,705,759 139,705,759
RESTATED CASH FLOW FORECAST
Table 15. Scenario 2: Intrinsic Value Calculation
Year 1 2 3 4 5 Terminal Value
Cash Flow 35,217,412$ 6,258,568$ 14,751,363$ 25,311,359$ 5,158,969$ 47,945,805$
Discount Rate 10.76% 10.76% 10.76% 10.76% 10.76% 10.76%
PV Factor 0.9029 0.8151 0.7360 0.6645 0.5999 0.5999
Discounted CF Stream 31,796,147$ 5,101,631$ 10,856,337$ 16,818,361$ 3,094,911$ 28,763,113$
Present Value of Cash Flows: 96,430,500$
INTRINSIC VALUE CALCULATION
WITH CAPEX--Actual Projections
Table 16. Scenario 2: Terminal Value Cash Flow for Years 6 to Infinity

29
Cash Flow for Year 5 5,158,969$
Growth Rate of Cash FlowsRevenue Growth Rate (1) 0%
Expense Growth Rate (2) 3%
Normalized Growth rate, g 0.00%
Discount Rate
Risk Free Rate (3) 3.16%
Plus: Risk Premium (4) 7.60%
Normalized Discount rate, r 10.76%
Capitalization Rate, r-g 10.76%
Cash Flow - Yr. 6 5,158,969$
Divisor, r-g 10.76%
Terminal Value Cash Flow 47,945,805$
Present Value of the Cash Flows 96,430,500$ Total Outstanding Debt 793,575,000$
Value of Authority (697,144,500)$
TERMINAL VALUE CASH FLOW FOR YEARS 6 TO INFINITY
In this scenario the value of the Authority is -$697 million. Cash flow stream for the projected periods were not leveled. It is important to note that negative free cash flow is not bad in itself. If free cash flow is negative, it could be a sign that the Authority is making large investments. If these investments earn a high return, the strategy has the potential to pay off in the long run.
As with the sensitivity analysis for scenario 1, we can see that the value of the authority increases (blue shade) as sales growth are more robust coupled with minimal increases in the cost of capital.

30
Table 17. Scenario 2: Sensitivity Analysis
Cost of Capital Sales Growth
(697,144,500)$ 0% 0.50% 1% 1.5% 2.00% 2.50%
10.76% (697,144,500) (695,591,965) (693,880,359) (691,983,913) (689,870,979) (687,502,241)
10.90% (697,891,030) (696,386,687) (694,730,390) (692,897,891) (690,859,494) (688,578,430)
11.04% (698,621,286) (697,163,126) (695,559,730) (693,788,263) (691,820,838) (689,623,035)
11.18% (699,335,862) (697,921,980) (696,369,209) (694,656,029) (692,756,228) (690,637,555)
11.32% (700,035,317) (698,663,910) (697,159,615) (695,502,132) (693,666,808) (691,623,398)
11.46% (700,720,189) (699,389,546) (697,931,690) (696,327,463) (694,553,657) (692,581,881)
11.60% (701,390,984) (700,099,482) (698,686,140) (697,132,863) (695,417,787) (693,514,240)
11.74% (702,048,190) (700,794,287) (699,423,634) (697,919,128) (696,260,155) (694,421,639)
11.88% (702,692,267) (701,474,500) (700,144,805) (698,687,009) (697,081,663) (695,305,171)
12.02% (703,323,658) (702,140,633) (700,850,257) (699,437,220) (697,883,163) (696,165,863)
12.16% (703,942,782) (702,793,177) (701,540,560) (700,170,437) (698,665,460) (697,004,688)
12.30% (704,550,042) (703,432,595) (702,216,260) (700,887,300) (699,429,316) (697,822,558)
12.44% (705,145,821) (704,059,333) (702,877,873) (701,588,418) (700,175,452) (698,620,336)
12.58% (705,730,487) (704,673,814) (703,525,892) (702,274,367) (700,904,550) (699,398,839)
12.72% (706,304,390) (705,276,443) (704,160,787) (702,945,697) (701,617,259) (700,158,837)
12.86% (706,867,866) (705,867,605) (704,783,005) (703,602,930) (702,314,192) (700,901,059)
SENSITIVITY ANALYSIS
WITH CAPITAL EXPENDITURE --ACTUAL PROJECTIONS
Comparative Efficiency: Public vs. Private Utilities
Benchmark Ratios Benchmark ratios to compare operating efficiency between PAAW and PWSA were not possible given the absence of detailed financial data from PWSA. Comparing these two utility companies operating on the same geographical region would provide us with a conceptually valid measure of the efficiency gap between that which is investor-owned vs. publicly owned, and if indeed deadweight losses are to be found in either operation. Ideally, the following ratios are to be computed to assess the “competitiveness gap” between private and publicly-operated water utilities. These ratios are based on a study by Edwin S. Rubenstein (Oct. 2000) The Untapped Potential of Water Privatization. Appendix A contains the benchmark ratios from Public Service Commission of Wisconsin’s Water Utility Statistical Benchmarks.
• Total Operating Expenses per Connection • Employees per 1,000 Connections • Salaries as Percent of Operating Revenues • Maintenance as Percent of Operating Revenues

31
Water and Sewer Rates
Table 18. 2007 Summary of Water and Sewer Rates (Cost per Month per 5,000 gal.)
Water Rate Sewer Rate*
PWSA $32.42 $33.74
PAAW $46.05 $22.90 - $54.25
As evidenced in the table, PAAW, a private water utility company, charges higher rates than a publicly-owned company. However, it should be noted that both entities are not operating in the same playing field, e.g. private utilities face a different tax treatment. Although this is not an all-encompassing justification for the higher prices, comparison of efficiency ratios for both entities should be able to set these two apart.
Perhaps what would be beneficial for Pittsburgh residents would be for PWSA to enter into a Public-Private Partnership to contract out its services to a privately-owned entity to be able to handle its infrastructure upgrading and maintenance, and in complying with the outstanding consent order.
Currently, given these difference in water use charge, PWSA is subsidizing customers within the City that are served by the relatively higher-price water utility providers. Between PAAW and PWSA, the former is more expensive by $13.63. According to PWSA’s 5-Year Proforma, the subsidy cost for 2008 was $1.07 million while projected subsidy expense from 2009 – 2012 is $1.3 million – a 21 percent increase. However, upon consultation with PAAW, the amount billed was actually $687,840; thus, we utilized this amount and increased it accordingly, i.e. by 21 percent, for the following years.
Public-Private Partnership (PPP) American Water has identified steps and labels of various PPP arrangements in existence today (see Figure 11).
Figure 4. PPP Options
Note: PAAW sewer rates vary depending on the community it is serving.

32
Case Study: Clarion County Regionalization Pennsylvania American Water’s regionalization of its operations in Clarion County began in 1998. This particular PPP entailed acquisition, interconnection and pipeline extensions, low-interest financing and water main replacements. Clarion County benefited directly from this partnership through proceeds from the sale, savings from avoidance of future capital expenditures (both for new infrastructures and upgrading/maintenance), line extensions, compliance with drinking water standards, full-time staffing, professional management and single tariff pricing (water rates).
Pittsburgh Water and Sewer Authority Although Pittsburgh’s situation may be different from Clarion County’s, PWSA should look into the several benefits that can be made should it enter into a PPP with an investor-owned company:
• Growth: In view of PWSA’s plans of acquiring adjacent municipalities, extending their coverage requires large capital expenditures, not only in terms of connecting to those systems but also with upgrading and maintaining the newly acquired system.
• Decaying Infrastructure: as per the PWSA Engineers Report, some of PWSA’s sewer system is almost 150 years old while some of its water facilities, e.g. pump stations, water storage, and distribution system, are about 70 years old. We were not able to ascertain the exact ages and estimate the costs for upgrading the infrastructure, since we did not receive the Authority’s Continuing Property Records. However, given that this is a capital-intensive industry, replacement and upgrading of these facilities entail huge capital expenditures in the near future.
Source: PAAW, “PPP Types in the US Market”

33
• Federal Regulations: the outstanding consent order regarding the combined sewer
overflow calls for a $3 billion project to bring the sewer system into compliance; although this cost is to be shared with the 82 other municipalities served by ALCOSAN, the implications for PWSA being the largest conveyor of sewage in terms of cost-sharing is still yet to be determined.
Given these mounting capital expenditures facing the Authority, the probable course of action for PWSA would be to issue more bonds, continue refunding existing ones or enter into interest rate swap agreements. In order to keep up with debt service payments, PWSA will need to increase its water and sewer charges should it not be able to widen its revenue base.
Conclusion This valuation report suggests that both The Pittsburgh Parking Authority and The Pittsburgh Water and Sewer Authority are not viable options for an outright sale. The risks and unknowns in the report include the valuation of a 75-99 year lease as well as the value of debt a private entity would have to assume in an outright sale. We assumed in our models an all cash transaction.
Both Authorities are capital intensive enterprises which require ongoing capital investment and maintenance programs. Because private entities face taxes and do not have access to tax exempt funds, they are handicapped in investing in the purchase of these authorizes.
The significant financial capital tied up in the Authorities may suggest that transforming physical capital into financial capital as a viable option. However, the combined outright sale of the Pittsburgh Parking Authority as well as the Pittsburgh Water and Sewer Authority will not generate the required capital needed to be injected in the City’s budget.
Failing outright sale of these authorities, one last revenue raising option is to increase parking rates and dedicate those additional funds to the City's fiscal obligations. The sensitivity calculations performed earlier suggest that the Parking Authority could significantly raise parking rates without much effect on demand. The Authority could potentially contribute these increased proceeds, net of costs, to partially defray City obligations.

34
Appendix A Operating Efficiency Benchmark Ratios
Description of Benchmark
Operating Revenues, Metered Sales of Water
Residential per customer
Residential per thousand gallons of water sold
Commercial per customer
Commercial per thousand gallons of water sold
Industrial per customer
Industrial per thousand gallons of water sold
Public authorities per customer
Public authorities per thousand gallons of water sold
Total Operating Revenues Per Full‐Time Equivalent Employee
Transmission and Distribution Expenses for Class AB and C Utilities
Per $1,000 of utility plant
Per $1,000 of revenues
Per milion gallons of water sold
Per customer
Customer Accounts Expenses for Classes AB and C Utilities
Per $1,000 of revenues
Per milion gallons of water sold
Per customer
Sales Expenses for Classes AB and C Utilities
Per $1,000 of revenues
Per milion gallons of water sold
Per customer
Administrative and General Expenses for Classes AB and C Utilities
Per $1,000 of revenues
Per milion gallons of water sold
Per customer
Total Operating and Maintenance Expenses
Per $1,000 of utility plant
Per $1,000 of revenues
Per milion gallons of water sold
Per customer

35
Total Operating Expenses
Per $1,000 of utility plant
Per $1,000 of revenues
Per milion gallons of water sold
Per customer
Per full‐time equivalent employee
Average Cost of Additions and Retirements for Mass Property Plant Accounts
Transmission and distribution mains, average cost per foot for additions
Transmission and distribution mains, average cost per foot for retirements
Services, average cost per unit of additions
Services, average cost per unti for retirements
Meters, average cost per unit for additions
Meters, average cost per unit for retirements
Hydrants, average cost per unit for additions
Hydrants, average cost per unit for retirements
Pumping Statistics
Total Kilowatt hours of electricity used per million gallons pumped
Percent of water pumped into distribtion mains which is unaccounted for
Financial Ratios
Debt to equity ratio, defined as long‐term debt and notes payable divided by municipal equity
Rate of return of net investment rate base (NIRB) in percent
Water Production Expenses for Utilities With Own Source of Surface Water
Source of Supply Expenses Per $1,000 of utility plant Per $1,000 of revenues Per million gallons of water sold Per customer
Pumping Expenses Per $1,000 of utility plant Per $1,000 of revenues Per million gallons of water sold Per customer
Water Treatment Expenses Per $1,000 of utility plant Per $1,000 of revenues Per million gallons of water sold Per customer

36
Type Status Call Feature W.A.C W.A.M Purpose Priority Maturity Remaining
1993 A CIBs Exempt Non-Callable 6.500% 3.95 Refunding (91 A) Senior 2013 27,230,000$ 1998 A CIBs Exempt (Current)3/1/2008 Refunding (95 A) Senior 2008 - 1998 B CABs Exempt Non-Callable 5.275% 18.75 Capital Projects Senior 2030 146,805,000 1998 C CIBs Exempt 1-Mar-08 Refunding (95 B) Subordinate 2008 - 2003 CIBs Exempt 1-Sep-13 3.591% 4.96 Refunding (93 A,B) Senior 2023 81,430,000 2007A CIBs Exempt Non-Callable 4.717% 5.26 Refunding (02,05) Senior 2017 41,315,000 2007B1, B2 VRDB Exempt 30 Day Notice 3.932% 16.44 Refunding (02,05) Senior 2033 82,645,000 2008 A CIBs Taxable Anytime 6.570% 12.56 Mixed Use Senior 2024 68,970,000 2008 B VRDB Exempt 30 Day Notice 4.038% 28.81 Mixed Use Senior 2039 145,495,000 2008 C VRDB Exempt 30 Day Notice 3.998% 24.72 Mixed Use Subordinate 2035 103,795,000 2008 D Mix Exempt 9/1/2018 4.322% 27.65 Capital Projects Senior 2040 95,890,000
Total 793,575,000$
PENNVEST Notes Exempt Anytime Projects 2025City Cooperation Agreement 2012
Table 11. PWSA Summary Debt Overview FY 2008
Figure 12. PWSA Debt Service Payments, 2008 - 2040
$-
$5,000,000
$10,000,000
$15,000,000
$20,000,000
$25,000,000
$30,000,000
$35,000,000
$40,000,000
$45,000,000
2008
2010
2012
2014
2016
2018
2020
2022
2024
2026
2028
2030
2032
2034
2036
2038
2040
2008 D2008 C2008 B2008 A2007B1&B22007A
20031998 C1998 B1998 A1993 A
Appendix B
PW
SA D
ebt Overview

37
Appendix C Table 12. Listing of Common Authority, Statute, and/or Regulation Elements11
11 “Restructuring and Consolidation of Small Drinking Water Systems: A Compendium of State Authorities, Statutes and Regulations.” US Environmental Protection Agency. Oct. 2007. 3 Mar. 2009. < www.epa.gov/ogwdw/smallsystems/pdfs/compendeum_smallsystems_restruct.pdf>
AK AR AZ CA CT ID IN KS KY LA MI MS MO NV NH NM NJ NY OR PA RI SC TX VA WA WV WYState Requires Aquired System to Give Consent for Mergers or Acquisitions
X X X X X
State Requires Acquiring Systen to Give Consent to Accept Consolidation or Restructuring
X X X X X X X
Acquiring System Allowed to Impose a Surchage, Additional Fee, Compensation, Etc.
X X X X X
PSC or PUC Provides Expedited Rate Making Procedures for Consolidating Systems
X X X X
Acquring Systems Assumes Liabilites or Obligations of Acquired System
X X X X X
State Can Attach Assets, Appoint a Receiver, Order a Takeover or Merger
X X X X X X X X X X X X X X
Consolidating Systems Eligible for Additional Grants or Loans, or Receive Preferred Status for Financial Assistance Programs
X X X X X X X X X X X X
State Can Order Improvements, Changes, or Additions to Consolidating Systems
X X X X X
New Systems Must Prove Need for Servise, Existing Systems Must Prove Need for Extension
X X X X X X X X X
New Systems Must Submit Regionalization or Consolidation Studies or Assessments
X X X X X
Common Authority, Statute, and/or Regulation Elements

Appendix D Follow-Up Letter to PWSA Regarding Documents Requested in Right to Know Request
Memorandum
FROM: Sanya Gurnani
TO: Prof. Robert Strauss, Professor of Economics and Public Policy
DATE: March 30, 2009
SUBJECT: Minutes and Status of Requests
As per our meeting with Mr. Michael Kenney, Ms. Tracy Smith of PWSA and Mr. David Montgomery of Thorpe-Reed, on March 23, 2009, I list from our notes the major points of the meeting, the data that was requested by us in order to examine the financial and technical feasibility of selling or leasing the Pittsburgh Water and Sewer Authority to private interests. Please note “Received” indicates what we have received this past week from Traci Smith’s various emails of electronic documents to you that you shared to us.
1. Detailed Income and Balance Sheet Statements for the 5 most recent years (2003-2007)
a. Split-up between Water and Sewer Revenue and Cost Structure
2. Annual Continuing Property Records report for the last 5 years RECEIVED
a. Inventory of pipe by length and diameter, by age and type of pipe
3. Rate schedule12 RECEIVED
4. EPA and DEP Consent Orders (c/o Mr. Montgomery)
5. Last 3 years PA DEP Annual Water Supply Reports: RECEIVED 5 year capital plan and 1 year capital plan by projects RECIEVED Details of outstanding long term debt and debt structure RECEIVED
a. By bond issue, issue date, amount of borrowing
b. Interest rates, terms
6. Number of employees with a breakdown per department and hourly wage
12 Mr. Kenney indicated that PWSA has done a rate structure comparison study for the entire state. He mentioned that he can provide us a copy of the study. Study results show that PWSA is cheaper than other providers; no qualifier whether “cheaper” meant only water or water & wastewater charge; also, Lora personally asked Tracy if we could acquire a copy of the Benchmarking Performance Indicators Survey (AWWA).

39
7. Annual Capital Budget for the last 5 years
a. Upgrades to plant, pipe, valve, boxes etc.
8. Revenue projections RECEIVED
Meeting Notes:
1. Mr. Kenney expressed his concern regarding the volume of data requested. Prof. Strauss indicated that we will help in photocopying and picking up the data if needed.
2. Mr. Kenney raised a question regarding the perspective from which this project will be viewed from – City, Authority, customers, private sector. There was also a question regarding the perspective in terms of value, i.e. asset, customer, or going rate. PWSA maintains that they place their value on customers. Professor Strauss indicated that the project will examine sale/leasing from multiple perspectives and will be objective.
3. Property records: Inventory of underground infrastructure is not an issue; however, issues might arise for above-ground infrastructure, such as pump stations and plants.
4. Mr. Kenney stated that providing copies of bond issues is not a problem. These documents will provide for information on capital improvement and their allocation to specific capital projects
5. Detailed financial statements: 2008 will not be available until May. Thus, PWSA will provide the detailed statements from 2003 – 2007.
6. Cooperation Agreement provides for PWSA to supply up to 600 million gal./yr to the City, which includes school districts, Phipps Conservatory, aviary. For all these, PWSA has both metered and un-metered connections.
7. PWSA pension cost is zero; entirely covered by the City
8. Meters are not read, rather PWSA operates on a fixed-base system whereby such system can provide real time reading

40
9. Employment: PWSA currently employs 244 employees. PWSA will provide us with a breakdown per department and hourly wage
10. Customers: PWSA has 83,000 water customers and 113,000 wastewater customers (unduplicated)
11. Board of Directors: voluntary basis
12. 2008 Series Bonds (fixed and variable rate bonds) issue with Dexia. PWSA was able to secure $300M out of $400M credit but will probably stave off the offer for 1 more year until financial markets are relatively stable. PWSA maintains that this will not lead to an immediate rate increase (although it is projecting a rate increase in 2010 based on its capital forecast)
13. Change in revenues ≠ f(population) rather it is more of a function of usage/consumption
14. EPA, DEP consent orders are only for wastewater. ALCOSAN has to build a fourth ** that is projected to cost $3B (2012 – 2026). This cost will either be covered by the 83 counties serviced by ALCOSAN or PWSA can issue bonds worth $3B and collect fees from the other counties (?). PWSA supplies 1/3 of the flow to ALCOSAN
15. Debt structure: $709 – 800 million

41
Works Cited Electronic Sources
"Case Study: Regional Solutions to Water Supply Needs - Clarion County." Pennsylvania American Water. 23 Feb. 2009 <http://www.amwater.com/paaw>.
Daley, Colleen. "Pittsburgh Water and Sewer Authority Comprehensive Distribution System Fluoride Tracer Study." University of Pittsburgh Library Electronic Theses and Dissertations. 7 Feb. 2009 <etd.library.pitt.edu/ETD/available/etd-07082007-141453/unrestricted/Daley_Collen_R_07_20_2007.pdf>.
“Federal Reserve Selected Interest Rates (Daily).” Federal Reserve System, 6 May 2009. <http://www.federalreserve.gov/releases/h15/update/>
Gilroy, Leonard. "Water PPPs Offer Financial, Environmental Compliance Solutions." Reason Foundation: Water and Wastewater. 23 Sep. 2008. 23 Feb. 2009 <www.reason.org/blog/show/1005789.html>.
"PSC - Water Utility Statistical Benchmarks." The Public Service Commission of Wisconsin. 18 Mar. 2009 <http://psc.wi.gov/utilityinfo/water/newsinfo/Benchmark.htm>.
“Pittsburgh Parking Authority – History and Purpose.” Pittsburgh Parking Authority. 23 Mar. 2009. <http://www.city.pittsburgh.pa.us/pghparkingauthority/html/history_and_purpose.html>.
"Pittsburgh Water and Sewer Authority Bond Issues." DAC Bond. 18 Mar. 2009 <http://www.dacbond.com>.
“Pittsbugh-area sewer fix could cost $50 billion.” USA Today. 3 April 2009. <http://content.usatoday.net/dist/custom/gci/InsidePage.aspx?cId=pressconnects&sParam=30480081.story>
Pokoka, Anthony. "Pittsburgh Water and Sewer Authority Outside Municipal Use of the City Sewer System." City of Pittsburgh. 2 Feb. 2009 <legistar.city.pittsburgh.pa.us/attachments/3762.doc>.
"Policy Issue - Local Services: Water Services." Privatization. 12 Feb. 2009 <http://www.privatization.org/database/policyissues/water_local.html>.
Rubenstein, Edwin. "The Untapped Potential of Water Privatization." Esrresearch - Economic Consultants. 23 Feb. 2009 <http://www.esrresearch.com/Theprivatewaterindustry.htm>.

42
Segal, Geoffrey , and Adrian Moore. "Frequently Asked Questions About Water/Wastewater Privatization." Reason Foundation: Water and Wastewater. 23 Feb. 2009 <www.reason.org>.
“Unaccounted for Water ‘A Real Drain on Your Water System’.” Municipal Technical Advisory Service – University of Tennessee. 4 Dec. 2000. 3 Apr. 2009. <http://www.mtas.tennessee.edu/knowledgebase.nsf/0/06c618903f5a75f28525726100586f56/$FILE/Unaccounted%20for%20Water.pdf>.
Smith , Tracy. “Scanned document from Scanner (Scanner).” PDF Attachment: 2003 – 2007 PADEP Annual Water Supply Reports. 25 March 2009. Smith , Tracy. “Right to Know Request.” PDF Attachments: 2007 PA Municipal Authorities Association Summary of Water and Sewer Rates. 24 March 2009. Smith , Tracy. “Request for Information.” PDF Attachments: (a) PNC Debt Overview FY 2008, (b) Property Records – PWSA Fixed Assets 12/31/2004 – 2008, (c) CHUBB Group Statement of Values 1/1/2008 – 01/01/09, (d) PWSA 5-Year Proforma. 27 March 2009.
The researchers have found that information contained in the 5-Yr Proforma spreadsheet shows evidence of circular reference, specifically on line items “Utility Revenues Wastewater (Net)”, and “Sewage Treatment Expenses”.
VanBriesen, Jeanne. “Regarding PWSA Report.” PDF Attachment: A Financial Valuation of the Pittsburgh Water and Sewer Systems. 2 March 2009.
Hagan, Daniel, and McDonald, William. “A Financial Valuation of the Pittsburgh Water and Sewer Systems.” Allegheny Institute. Sep. 1995. This valuation was done in light of the capital asset acquisition by PWSA of the City’s water department.
Personal Meeting Pennsylvania American Water. Personal Meeting. 13 March 2009. “An Example of a Concession Arrangement with the City of Elizabeth, NJ.” “Challenges in the Water Industry: Public-Private Partnerships as a Solution.” “Benefits of Public Private Partnerships in the Form of Contract Operations.” “PPP Types in the US Market.”
Pittsburgh Parking Authority Annual Reports. City of Pittsburgh Controller’s Office.