privatizing the metro card
TRANSCRIPT

PRIVATIZING THE METRO CARD: TRANSPORTATION EQUITY IN AN OPEN-LOOP SMARTCARD FARE PAYMENT SYSTEM
A Thesis Presented to the
Faculty of the Graduate School of Architecture, Planning & Preservation
COLUMBIA UNIVERSITY
In Partial Fulfillment of the Requirements for the Degree
Master of Science in Urban Planning
By
DAVID PERLMUTTER
May 15, 2015

2 Privatizing the Metro Card | David Perlmutter | May 2015
Acknowledgments
I would like to first thank my thesis advisor, Professor David King, for his ongoing support and helpful advice throughout the research process. Secondly, many thanks to Richard Barone of the Regional Plan Association for his invaluable insights as my thesis reader. I would also like to thank the following individuals for their assistance in shaping my research methodology and conclusions: Alexis Perrotta, PhD candidate at Columbia University GSAPP; Howard Permut, Senior Fellow of the Regional Plan Association; and Candace Brakewood, Professor of Civil Engineering at the City College of New York, To my partner, Matt Wallace, thank you for your continued encouragement and for enduring many sleepless nights. And finally, many thanks to my family for their love and support.

3 Privatizing the Metro Card | David Perlmutter | May 2015
Table of Contents
Glossary 5
Abstract 7
Introduction 8
Literature Review 9Transportation Equity and the Unbanked 9Contactless Smartcard Implementation in the Transit Industry 12Prepaid Debit Cards in an Open Payment System 16The Case of Chicago’s Ventra 17The MTA’s Contactless Metro Card 18
Methodology 19Hypotheses 21
Data Sources 23
Survey Results 32
Case Study Results 38Chicago, Illinois 38Boston, Massachusetts 39London, U.K. 39Philadelphia, Pennsylvania 42San Francisco Bay Area, California 43Seattle, Washington 44
Analysis and Discussion 45Survey Results 45
Conclusions and Recommendations 49Role of New York City (and Other Municipalities) 49Role of MTA 51Role of Regional MPO’s and States 52Role of the Federal Government 53
Bibliography 54Academic Sources 54Agency Reports, Conference Papers and White Papers 55Popular Press 57
Appendices 58Appendix 1: Columbia University RASCAL Consent Form for Survey Respondents 58Appendix 2: Survey Questionnaire 61STATA Output Results for Pearson’s Chi Square Test 64

4 Privatizing the Metro Card | David Perlmutter | May 2015
List of Tables and Figures
Table 1: Transit Agency Smart Card Implementation 13Table 2: Case Study Sources 19Table 3: Data Sources on New York City’s Unbanked Population and Travel Behavior 21Table 4: New York City Neighborhoods with Least Access to Traditional Financial Services 21Table 5: New York City Neighborhoods with Least Banking Penetration 22Table 6: New York City Transit Riders by Gender 23Table 7: New York City Transit Riders by Annual Household Income 23Table 8: Frequency of Subway Use 23Table 9: Trip Purpose 23Table 11: Factors Influencing Metro Card Ticket Choice 23Figure 1: Un(der)banked Households in New York, by Community Board (%), 2011 24Figure 2: Ratio of Traditional Finance Institutions to AFS Locations (2011) 25Figure 3: New York City Community Districts by Average Household Income, Quintiles (2011) 26Figure 4: “Communities of Concern” in the New York Region (NYMTC) 27Figure 5: Transportation & Land Use Characteristics at Fordham Data Collection Site 28Figure 6: Transportation & Land Use Characteristics at Myrtle-Wyckoff Data Collection Site 29Figure 7: Gender Breakdown of Survey Respondents 30Table 12: Gender Breakdown of Survey Results 30Figure 8: Age Breakdown of Survey Respondents 30Figure 9: Trip Purpose of Survey Respondents (for Most Recent Trip) 31Table 13: Trip Purpose of Most Recent Trip 31Figure 10: Trip Length for Most Recent Trip 31Table 14: Trip Length for Most Recent Trip 31Figure 11: Trip Frequency of Survey Respondents 32Table 15: Trip Frequency of Survey Respondents 32Figure 12: Number of Transfers for Most Recent Trip 32Table 16: Number of Transfers for Most Recent Trip 32Figure 13: Mode Choice for Most Recent Trip 33Table 17: Mode Choice for Most Recent Trip 33Figure 14: Payment Method for Most Recent Trip 33Figure 15: Point of Purchase for Most Recent Metro Card 34Table 18: Point of Purchase for Most Recent Trip 34Figure 16: Metro Card Type Most Recently Purchased 34Table 19: Type of Metro Card Most Recently Purchased 34Figure 17: Income of Survey Respondents 35Table 20: Income of Survey Respondents 35Figure 18: Smartphone Ownership 35Table 21: Smartphone Ownership 35Table 22: Selected Case Studies of New Fare Payment Systems 38

5 Privatizing the Metro Card | David Perlmutter | May 2015
Glossary
AFS – “Alternative Financial Services” establishments that offer financial services – typically to low-income consumers – without the use of a formal, FDIC-insured bank account. These establishments include check cashers, pawn shops, jewelry resale establishments, money transfer and remittance vendors, and payday loan shops.
APR – Annual percentage rate is a measure of annualized interest charged on a credit card or loan.
Citywide Financial Services Study (CFSS) – A study undertaken between 2009 and 2011 by the New York City Department of Consumer Affairs to document the extent and distribution of the City’s unbanked and underbanked population.
Closed-loop prepaid debit card – Also known as a “stored value card” or “gift card,” this type of card must be pre-loaded with cash value, either online through a checking account or at a retail location with cash or debit card payment. As a closed-loop card, this payment technology is limited to a single brand or product line, typically a retail brand such as Starbucks or McDonald’s.
Closed-loop smartcard – A transit agency-issued, closed-loop prepaid that uses the contactless, ISO 14443 technology exclusively for fare payment transactions.
Contactless bank card – A credit or debit card issued by a mainstream financial institution that uses the contactless ISO 14443 or similar technology. Contactless bank cards can be used as fare payment devices in a transit agency’s open payment system.
Contactless smartcard – Any RFID-based, microprocessor-embedded card device capable of communicating with an RFID reader, whether used in transit fare payment, vehicle tolling, retail payment or physical access control.
EBT – Electronic Benefit Transfer is a system of privately-managed prepaid debit cards used to facilitate the electronic transfer of government benefits in the United States such as Temporary Aid to Needy Families (TANF) or Supplemental Nutritional Assistance Program (formerly known as “Food Stamps”).
GPR prepaid card – Unlike EBT or stored value cards, GPR or “general-purpose reloadable” prepaid debit cards are unrestricted and can be used for all retail transactions, not just benefits or transactions within a particular brand.
MTA – Metropolitan Transportation Authority, the New York State government authority responsible for operating most public transit (subways, commuter rail, bus, bus rapid transit) and major bridges and tunnels in the New York metropolitan area.
Mobile payment - A payment technology using near-field communications (NFC) to transmit payment wirelessly from a consumer’s online bank account to a merchant via a contactless RFID processor. In a contactless smartcard fare payment system, the mobile phone replaces the smartcard as the payment device.
Near-field communications (NFC) – A technology that allows mobile phones to communicate wirelessly with a payment device or receiver. NFC is generally compatible with contactless smartcard technology through the ISO 14443 standard.

6 Privatizing the Metro Card | David Perlmutter | May 2015
Open-loop smartcard – See “open payment.”
Open payment – A transit fare payment system in which any contactless device – a transit-issued contactless smartcard, a GPR prepaid card, a contactless bank card, or mobile payment – may be used to pay for transit fares.
Prepaid debit card – A reloadable debit card that is not linked to a formal bank account. Whether the prepaid debit card is closed-loop (“stored value”) or open-loop (“GPR”), it must be pre-loaded with cash value before being used to transact.
Stored value card – see “closed-loop prepaid debit card”
Title VI – A section of the Civil Rights Act of 1964 requiring all transit agencies receiving federal support to equitably accommodate all passengers regardless of race, ethnicity, age, disability, gender or other protected classes.
Unbanked – An individual who has no relationship with any mainstream financial institution or formal bank account.
Underbanked – A person who has access to a formal bank account but may, for a variety of reasons, be compelled to rely on alternative financial services (AFS) for most transactions.

7 Privatizing the Metro Card | David Perlmutter | May 2015
The unbanked – individuals who lack a bank account with a mainstream financial institution – are one of the more broadly disadvantaged groups in American society. There is a great deal of demographic overlap between the unbanked as a cohort and other marginalized groups, notably undocumented immigrants, low-income Blacks and Latinos and non-native English speakers. These groups are an important constituency for transportation agencies in that they are more likely to travel by transit than other Americans. As many transit agencies transition their fare payment systems to radio frequency identification (RFID)-based, “contactless” smartcard or open payment technology linked to a rider’s bank account, there are growing opportunities to enhance multi-modalism in passenger trips, reduce operations costs, increase system profitability, and expand access to fare payment media. However, due to equity requirements of the Civil Rights Act, transit agencies must ensure that the smartcard technology also accommodates the unbanked. Ensuring that transit fare payment systems adequately serve the unbanked requires an assessment of New York’s unbanked population beyond that which is available in current academic literature. A 2011 study from the NYC Department of Consumer Affairs identified several New York City neighborhoods with the highest proportions of unbanked and underbanked residents. Through intercept surveys in two of these majority-unbanked neighborhoods – Fordham (Bronx) and Bushwick (Brooklyn) – this study attempts to clarify the travel behavior and fare payment characteristics of the un(der)banked. In addition, this study investigates potential fare policy alternatives in an open payment system that would adequately accommodate the transportation needs of the unbanked. To articulate policy recommendations to meet this objective, this study includes structured interviews with transit fare policy experts in the public, private and nonprofit sectors. These interviews explored how transit agencies can select the most appropriate fare payment technology; effectively partner with retailers and alternative financial services (AFS) to make its new fare payment medium accessible to un(der)banked communities; and establish performance metrics to monitor the fare payment system’s long-term equity.
Abstract

8 Privatizing the Metro Card | David Perlmutter | May 2015
Individuals who do not participate in mainstream banking institutions – known as “unbanked” if they lack bank accounts altogether and “underbanked” if they have inactive, low-balance bank accounts but still rely on alternative financial services like check cashers or payday loans – are one of the more marginalized cohorts of American society. Unbanked status is often correlated with an array of disadvantaged social conditions. The unbanked are generally more likely to be low-income, lack personal financial savings, be undocumented immigrants, or be members of an ethnic minority group. For transit agencies, the unbanked are an important constituency given that they are significantly more transit-dependent than other Americans. As many transit agencies transition their fare payment systems to RFID-based, “contactless” smartcard technology, there are growing opportunities to enhance multi-modalism1 in 1 Refers to travel behavior that incorporates multiple modes of travel within the same trip.
Introduction
passenger trips; reduce system operations costs; and expand access to fare payment technology to locations beyond transit-owned facilities. However, for reasons of social equity transit agencies must ensure that new smartcard fare payment systems also accommodate the unique transportation needs of the unbanked. Ensuring that transit fare payment systems adequately serve the unbanked requires a thorough understanding of the demographics of the unbanked in New York City and the United States more broadly.
Image Source: Gloria Shur Bilchik, Occasional Planet
Un(der)banked customers line up outside an AFS establishment in St. Louis, Missouri.

9 Privatizing the Metro Card | David Perlmutter | May 2015
Literature Review
Transportation Equity and the UnbankedAccommodating the unbanked in transportation policy is an under-explored area of research that has taken on new importance as many transit agencies adopt smartcard-based fare payment technologies that are linked to a rider’s bank account. While earlier research has explored the inequities of transportation policy with respect to low-income transit riders, a transit rider’s access to mainstream financial services has become a growing determinant of inequity. One’s access to transit service and ability to pay for transit fares are increasingly becoming functions of one’s degree of participation in mainstream financial institutions. The intersection of transit fare policy and access to financial services for low-income riders is therefore a matter that warrants discussion from a framework of environmental justice.
Environmental justice theory holds that communities of color are disproportionately harmed by negative impacts of the planning process while also receiving fewer of its benefits (Sanchez and Brenman, 2007, 4). Environmental justice theorists typically frame their arguments in terms of the unique disadvantages that communities of color face in the built environment, such as the disproportionate public health impacts of local air pollution from bus depots in low-income neighborhoods (ibid, 7). Dating back at least to the Rosa Parks case of 1955, equal access to transportation facilities – regardless of race, ethnicity, or other protected class – has long been considered a civil right. Because the unbanked as a cohort share with communities of color many aspects of marginality along the lines of race, income, language or citizenship, there is a strong argument that they would also experience similar negative outcomes in terms of access to public transportation.
The unique status of being unbanked – itself an artifact of low incomes, citizenship status, and rising social inequality, among other factors – is not currently protected by Title VI of the Civil Rights Act.
Title VI only prohibits recipients of federal funding, such as transit agencies, from discriminating on the basis of race, color, or national origin (ibid, 10). Since the 2001 Supreme Court case Alexander v. Sandoval, individuals are no longer able to bring suit against transit agencies to enforce Title VI regulations (ibid, 74). This ruling shifts the burden of enforcing Title VI regulations and achieving equitable access to transportation for marginalized groups like the un(der)banked from individuals onto public interest NGO’s. The un(der)banked represent the next frontier in the pursuit of environmental justice in the United States given that un(der)banked individuals are comprised primarily of the low-income, ethnic minorities, and recent immigrants as well as other traditionally marginalized groups.
Broadly speaking, being unbanked is correlated with low-income status (NYC Department of Consumer Affairs, 2013, 14) Black and Latino households (Rhine et al, 2006; Brakewood and Kocur, 2012), low educational attainment (Carney, 2012, 12; NYC Department of Consumer Affairs, 2013, 14) and spatially concentrated immigrant enclaves (Bohn and Pearlman, 2013; Jacob et al, 2005, 8). National estimates of the unbanked population vary widely from 7% (Carney, 2012), 8.2% (FDIC, 2012), 17% (Jacob et al, 2005, 8) to 22% (Stegman, 2004; Brakewood and Kocur, 2012; Smart Card Alliance, 2007). If the underbanked and unbanked are included in the estimate, their combined percentage may be as high as 30% nationally (FDIC, 2012). In New York City, it is estimated that 13% of all households and 42% of all low-income households are unbanked (New York City Department of Consumer Affairs, 2012; Stegman, 2004). Unbanked status creates significant obstacles to wealth creation, bill payment, and general financial stability. According to Stegman, 69% of the unbanked had no financial savings, compared to just 22% of the banked population (2004, 6). Beyond the economic hardships of lacking any savings and living ‘paycheck to paycheck’, the unbanked are often compelled to pay disproportionately high fees at AFS establishments (check cashers, pawn shops, payday loan and money transfer centers). AFS establishments generally charge very high transaction fees and interest rates

10 Privatizing the Metro Card | David Perlmutter | May 2015
for cashing checks, bill payment and short-term loans, which can total $1,000 a year or $15,000 over a lifetime (Kumeh, 2012; Stegman, 2004, 6). Check cashers and payday lenders in New York City, for example, charge 1.98% of the face value of a check to cash it, and an annual percentage rate (APR) of between 200 and 500% for a 14-day loan (Servon, 2014). Unbanked individuals are therefore deprived of both more affordable financial services at mainstream banks and a wide range of wealth-building transactions that typically require a bank account, such as obtaining a home mortgage loan or auto loan, securing a job or apartment requiring a good FICO credit score2, or enrolling in payroll direct deposit.
The theme of transportation equity is a key pillar of the environmental justice movement and is charged with mitigating the substantial disparities in access to transportation in society. Transportation equity encompasses a wide range of transit policy issues, such as fare policy, service frequency and coverage, or fair procurement practices in project construction. Unbanked status is typically coupled with other marginalized identities that research on transportation equity has explored in greater detail. For the purposes of this investigation, it is therefore useful to compare the overlapping challenges of unequal access to transportation faced by both unbanked and low-income transit rider groups.
Inequitable access to transit often manifests in the disproportionate cost of transportation, particularly among low-income transit riders. The cost of transportation accounts for a disproportionate share of disposable income among low-income individuals, regardless of whether they choose to drive or take public transit. A 2001 report showed that those in the lowest-income quintile spent 36% of their disposable income on transportation, compared to just 14% among the highest-income quintile (Sanchez and Brenman, 2007, 34). Low-income individuals are less likely than the general population to drive and more than three times more likely to take transit, due to the relatively high costs of auto ownership, insurance, maintenance, fuel, and taxes (Pucher and Renne, 2003, 59). A national survey from the American Public Transportation Association indicated that a 2 Environmental justice theorists commonly view the de-termining factors of the widely used FICO credit score, used by landlords and employers alike to screen for applicants, as discriminatory against communities of color. As Rice and Swesnik note, “some scoring mechanisms assume that a borrower who re-ceived a loan from a finance company is a greater credit risk than one who received a loan from a depository institution. In fact, the opposite may be true. A credit-scoring system relying on this false premise penalizes the borrower who simply may not have had access to a mainstream lender, but had abundant access to fringe lenders. Indeed, credit-scoring mechanisms reflect the lending and finance systems producing the data upon which the mechanisms are built. Oftentimes, credit-scoring mechanisms assess the riskiness of the lending environment, product type, or loan features a consumer uses rather than his or her risk profile” (2013, 949).
substantial portion of transit riders is low-income: 38% have incomes below $20,000, while 79% of transit riders have incomes below $75,000 (Sanchez and Brenman, 2007, 41). Because low-income Americans are disproportionately dependent on transit, changes in fare policy or transit service levels have greater impact on poor communities. 70% of major transit agencies have made, or are planning to make, service cuts or raised fares since the 2008 recession (American Public Transportation Association, 2011, 2). These service cuts and fare increases – especially for bus transit – generally have inequitable effects as they diminish the access to and raise the cost of transportation for low-income communities that are less likely to be able to afford car or rail travel alternatives.
Moreover, in large multimodal transit systems there is a great deal of evidence that low-income transit riders taking shorter bus trips effectively cross-subsidize high-income transit riders taking more expensive rail trips. According to the National Household Travel Survey (NHTS), low-income households earning less than $20,000 a year comprise 47% of bus riders, 20% of subway riders, and just 6% of commuter rail riders (Sanchez and Brenman, 2007, 43). Subway, light rail, and commuter rail modes each have very high capital costs compared to bus transportation, where most of the costs are in operations. As a result, many transit agencies spend large portions of their budgets on expensive capital projects serving higher-income riders, often at the expense of bus riders (a predominantly low-income, minority group) who lack alternative means of travel. In Los Angeles, for instance, the LACMTA faced Title VI lawsuits in the early 1990’s on precisely these grounds. The agency was accused of discriminatory transit service provision in light of the fact that bus riders, 94% of all system passengers, received just 30% of its funding while the other 70% went to rail projects (ibid, 44). Transportation equity literature also suggests that low-income people face longer-than-average commute times in most American cities. Data from the NHTS indicate that low-income residents in New York City faced average commutes of 39 minutes, compared to the metropolitan area’s average commute time of just 30 minutes (Shen, 2000, 78). Likewise, New Yorkers with long commutes are disproportionately low-income. According to analysis by the Pratt Center for Community Development, two-thirds of New Yorkers with commutes greater than 60 minutes have incomes less than $35,000, while just 6% of these commuters make more than $75,000 (Center for an Urban Future, 2011, 4). Among New York City Transit riders as a cohort, bus riders are known to have a lower median income ($39,600) than subway riders ($58,300) or riders who take both subways and buses ($46,300) (Seltzer, 2008, 20).

11 Privatizing the Metro Card | David Perlmutter | May 2015
There is significant demographic overlap between transit riders overall and the unbanked. Like transit riders as a cohort, substantial majorities of the unbanked population are low-income and members of ethnic minority groups. As the MTA pursues new fare payment technologies, it is prudent to examine New York City’s unbanked population through the lens of transportation equity. An analytical framework of transportation equity evaluates transit policy outcomes in terms of “disparate impact3:” do un(der)banked transit riders face differential or inferior access to transit services compared to banked transit riders? To answer this question, it is necessary to understand why individuals may be un(der)banked in the first place.
There are many possible motivations for being un(der)banked. The most common reason cited for being unbanked is low-income status, which manifests in a lack of funds required to open a bank account or maintain a minimum balance (Rhine et al, 2006, 155; NYC Department of Consumer Affairs, 2013, 63). Other major motivations for being unbanked are found among immigrant communities. Recent immigrants often lack sufficient credit history in the United States to qualify for bank accounts or credit cards (Grinstein-Weiss et al., 2010, 215). Consumers may also choose to be unbanked because of a cultural history of bank discrimination against communities of color (Joassart-Marcelli and Stephens, 2010, 885), because of difficulties with English language proficiency (Bohn and Pearlman, 2013, 867; NYC Department of Consumer Affairs, 2013, 49), inconvenience of bank hours or location (Joassart-Marcelli and Stephens, 2010, 886), or because they are undocumented and do not wish to put themselves at risk of deportation by having their identities verified (Jacobs and Jankowski, 2008, 2). Another common explanation for the choice to be unbanked is, in the case of immigrants, the inability or unwillingness of mainstream banks to facilitate international wire transfers to non-bank entities, otherwise known as remittances (Caskey et al, 2006, 53). Many unbanked individuals also prefer the immediacy and low cost of fund transfers from alternative financial services (AFS) compared to traditional banks (ibid, 32).
The dependency of unbanked on AFS illustrates the duality between individual agency and societal structure ingrained in the condition of being unbanked. Most literature suggests that being unbanked is a choice that consumers make under
3 Title VI of the Civil Rights Act of 1964 prohibits recipients of federal funds from “conducting activities that have a less favor-able effect or ‘disparate impact’ on members of one racial or ethnic group than on another” (Sanchez and Brenman, 2007, 74). However, the Alexander v. Sandoval case set a new precedent for enforcing this legislation. Title VI lawsuits may only be consid-ered if the plaintiffs can prove that an action was taken intention-ally to discriminate; the weight of statistical evidence showing disparate impact is no longer sufficient.
severe financial stress and only when more traditional options have been exhausted. Stoesz argues that the steady growth of the AFS sector is a direct result of growing economic inequality in the U.S. In particular, the AFS sector is designed for the “secondary labor market” characterized by low-wage, often part-time, service-sector jobs that offer few, if any, benefits, and little upward mobility (Stoesz, 2014, 4). Workers in the secondary labor market, caught between dual pressures of low, stagnant wages and a rising cost of living, are often forced to make unwise financial decisions such as maxing out credit cards and incurring overdrafts.
There is some evidence that individuals may transfer back and forth between formal banks and AFS – between banked, underbanked, and unbanked statuses – according to their relative financial situation. According to a Pew study, 59% of AFS customers had previously maxed out a mainstream credit card, while 52% had overdrawn a mainstream checking account in the past year (qtd. in Stoez, 2014, 7). In addition, a negative banking history can persistently exclude people from the financial mainstream. According to an FDIC survey of unbanked households that previously had bank accounts, 10% said the main reason they no longer had an account was because the bank had closed it, while another 6% said they were denied bank accounts because of problems with identification, credit or banking history (Valenti and Heiss, 2013, 5). The New York Times estimated that more than one million low-income Americans are unbanked because of banks’ anti-fraud database systems that automatically flag individuals who are declined for these reasons (Silver-Greenberg and Corkery, 2014). This suggests that un(der)banked status is not necessarily a voluntary, rational choice but rather a financial fail-safe that low-income consumers are compelled to make by the convergence of economic stagnation in the unskilled labor market and increasingly punitive regulations in the mainstream financial institutions.
Minimum balance requirements, monthly maintenance fees, and high overdraft fees of are some of the most significant impediments that low-income consumers face in navigating mainstream banks. One troubling trend in mainstream finance is the rapid disappearance of free checking accounts. According to the Center for American Progress, the percentage of mainstream financial institutions offering free checking accounts declined from 75% in 2009 to just 39% in 2012 (Valenti and Heiss, 2013, 3). Meanwhile, the average monthly maintenance fee doubled to $5.48 during the same period. Likewise, the average minimum balance required to avoid the maintenance fee rose to $723 in 2012, up 23% from 2011 (ibid). Servon argues that a standard bank
12 Privatizing the Metro Card | David Perlmutter | May 2015
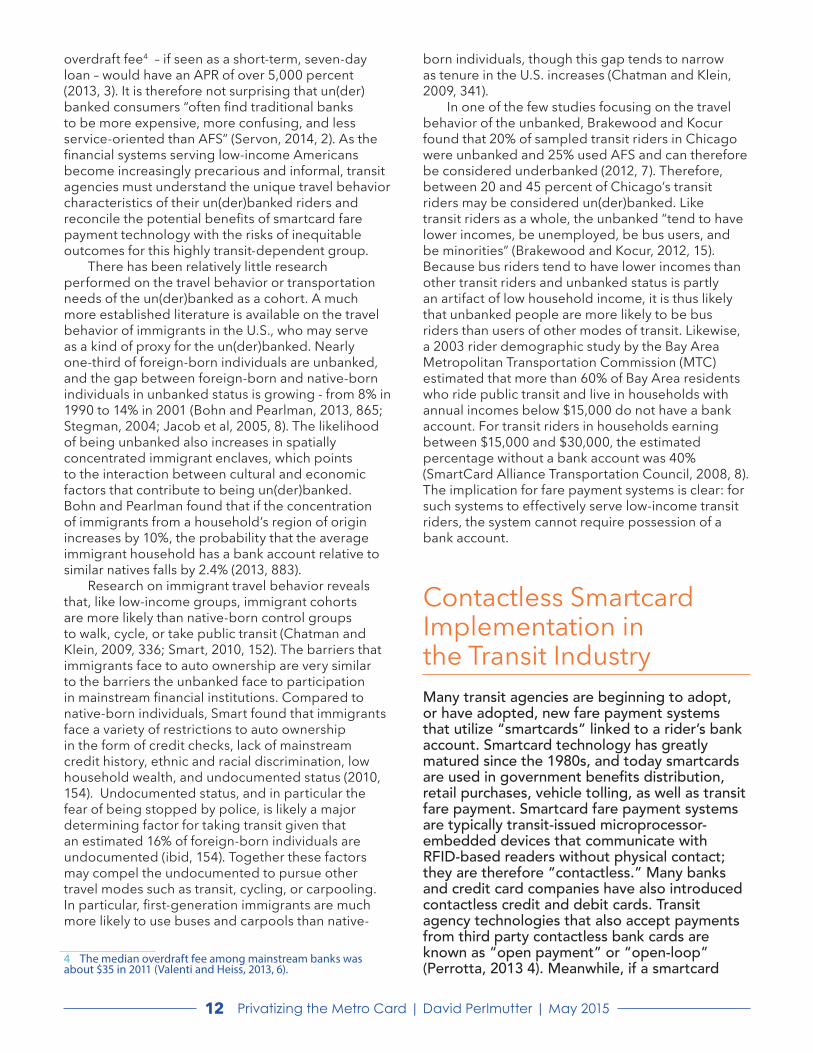
overdraft fee4 – if seen as a short-term, seven-day loan – would have an APR of over 5,000 percent (2013, 3). It is therefore not surprising that un(der)banked consumers “often find traditional banks to be more expensive, more confusing, and less service-oriented than AFS” (Servon, 2014, 2). As the financial systems serving low-income Americans become increasingly precarious and informal, transit agencies must understand the unique travel behavior characteristics of their un(der)banked riders and reconcile the potential benefits of smartcard fare payment technology with the risks of inequitable outcomes for this highly transit-dependent group.
There has been relatively little research performed on the travel behavior or transportation needs of the un(der)banked as a cohort. A much more established literature is available on the travel behavior of immigrants in the U.S., who may serve as a kind of proxy for the un(der)banked. Nearly one-third of foreign-born individuals are unbanked, and the gap between foreign-born and native-born individuals in unbanked status is growing - from 8% in 1990 to 14% in 2001 (Bohn and Pearlman, 2013, 865; Stegman, 2004; Jacob et al, 2005, 8). The likelihood of being unbanked also increases in spatially concentrated immigrant enclaves, which points to the interaction between cultural and economic factors that contribute to being un(der)banked. Bohn and Pearlman found that if the concentration of immigrants from a household’s region of origin increases by 10%, the probability that the average immigrant household has a bank account relative to similar natives falls by 2.4% (2013, 883).
Research on immigrant travel behavior reveals that, like low-income groups, immigrant cohorts are more likely than native-born control groups to walk, cycle, or take public transit (Chatman and Klein, 2009, 336; Smart, 2010, 152). The barriers that immigrants face to auto ownership are very similar to the barriers the unbanked face to participation in mainstream financial institutions. Compared to native-born individuals, Smart found that immigrants face a variety of restrictions to auto ownership in the form of credit checks, lack of mainstream credit history, ethnic and racial discrimination, low household wealth, and undocumented status (2010, 154). Undocumented status, and in particular the fear of being stopped by police, is likely a major determining factor for taking transit given that an estimated 16% of foreign-born individuals are undocumented (ibid, 154). Together these factors may compel the undocumented to pursue other travel modes such as transit, cycling, or carpooling. In particular, first-generation immigrants are much more likely to use buses and carpools than native-
4 The median overdraft fee among mainstream banks was about $35 in 2011 (Valenti and Heiss, 2013, 6).
born individuals, though this gap tends to narrow as tenure in the U.S. increases (Chatman and Klein, 2009, 341).
In one of the few studies focusing on the travel behavior of the unbanked, Brakewood and Kocur found that 20% of sampled transit riders in Chicago were unbanked and 25% used AFS and can therefore be considered underbanked (2012, 7). Therefore, between 20 and 45 percent of Chicago’s transit riders may be considered un(der)banked. Like transit riders as a whole, the unbanked “tend to have lower incomes, be unemployed, be bus users, and be minorities” (Brakewood and Kocur, 2012, 15). Because bus riders tend to have lower incomes than other transit riders and unbanked status is partly an artifact of low household income, it is thus likely that unbanked people are more likely to be bus riders than users of other modes of transit. Likewise, a 2003 rider demographic study by the Bay Area Metropolitan Transportation Commission (MTC) estimated that more than 60% of Bay Area residents who ride public transit and live in households with annual incomes below $15,000 do not have a bank account. For transit riders in households earning between $15,000 and $30,000, the estimated percentage without a bank account was 40% (SmartCard Alliance Transportation Council, 2008, 8). The implication for fare payment systems is clear: for such systems to effectively serve low-income transit riders, the system cannot require possession of a bank account.
Contactless Smartcard Implementation in the Transit IndustryMany transit agencies are beginning to adopt, or have adopted, new fare payment systems that utilize “smartcards” linked to a rider’s bank account. Smartcard technology has greatly matured since the 1980s, and today smartcards are used in government benefits distribution, retail purchases, vehicle tolling, as well as transit fare payment. Smartcard fare payment systems are typically transit-issued microprocessor-embedded devices that communicate with RFID-based readers without physical contact; they are therefore “contactless.” Many banks and credit card companies have also introduced contactless credit and debit cards. Transit agency technologies that also accept payments from third party contactless bank cards are known as “open payment” or “open-loop” (Perrotta, 2013 4). Meanwhile, if a smartcard

13 Privatizing the Metro Card | David Perlmutter | May 2015
is limited to transit transactions only, it is considered “closed-loop.” Increasingly, open-loop fare payment systems are also being integrated with mobile applications to allow passengers to pay fares and reload balances with mobile phone applications using near field communications (NFC) technology. In the case of NFC, the mobile phone itself replaces the contactless smartcard as the payment device. According to McDonald, the boom in smartcard adoption stems from the combination of four factors: 1) the desire of banks and credit card companies to leverage interchange fees on low-cost transactions; 2) the need for better identification cards for government programs; 3) the increasing sophistication of mobile payment technology in smartphones; and 4) transit agencies’ need for alternative fare payment media with the obsolescence and rising maintenance costs of legacy fare collection systems (McDonald, 2000, 3).
One of the most significant potential benefits of smartcard fare payment systems is an improved transit level of service and superior customer service compared to magnetic stripe cards. Smartcards allow increased passenger throughput at stations, also known as “speed of ingress,” and faster average boarding times on buses. Tokyo’s Suica smartcard boasts an average passenger throughput of 60 passengers per minute per turnstile at subway stations (Quibria, 2008,12), while Montreal’s OPUS card achieved a passenger throughput of 45 passengers per minute on buses (Pelletier et al, 2011, 562). Lower boarding times equate to reduced bus dwell times, which is important given the slow bus travel speeds in many North American cities. New York City, in particular, is known to have North America’s slowest bus speeds, at an average of just 8.1 miles per hour (TCRP, 2014, 41). Time savings for passengers, who no longer have to fumble for cards that must be swiped just so, lead to a more seamless, comfortable transit experience. According to the smartcard implementation manager for Philadelphia’s SEPTA, Jerry Kane, smartcards are being introduced in response to growing customer demands and are “part of providing a top-notch transit experience” (qtd in Keitel, 2009). Distributing smartcards effectively relieves transit agencies of the obligation to produce their own transit currency. According to Kane, “SEPTA is in the business of providing quality transportation to its riders, not printing money” (qtd in Keitel, 2009, 12). An open-loop smartcard, in particular, allows transit agencies to gradually outsource the management of its fare payment systems to other parties and perhaps even cease issuing fare cards altogether (Keitel, 2012, 10). Smartcards are also significantly more durable than magnetic stripe fare cards; since the
payment is contactless, there is less physical wear and tear on the card. Under normal conditions, smartcards can last up to 10 years or more before the microprocessors begin to fail (Pelletier et al, 2011, 560). Finally, smartcards can help to reduce customer complaints. Unlike magnetic stripe cards, lost or stolen smartcards can be deactivated electronically. In the case of WMATA’s SmarTrip, a lost or stolen smartcard can be registered online or at a sales office and then have the full value replace on a new card (Quibria, 2008, 11).
Smartcards also allow transit agencies to increase their revenues, encourage multi-modalism, and achieve a more flexible and equitable fare structure. Smartcards allow transit agencies more flexibility to develop more complex fare structures depending on time of day, mode, route, number of transfers, and finer gradations of distance (Perrotta, 2014, 3; Pelletier et al, 2011, 559). Smartcards also enable agencies to create an inter-operable fare payment system across different modes or transit agencies, thereby encouraging seamless multi-modal transfers and increasing farebox revenues through linked trips (Perrotta, 2014, 3). Differentiated fare structures under smartcards still allow for equity fare discounts, such as for seniors, low-income riders, students and the disabled. For instance, equity discounts in Washington, DC, are subsidized by the municipality, which sells discounted fares in poorer neighborhoods and then reimburses WMATA for the difference (ibid, 5). Because smartcards are personalized and linked to a bank account, they theoretically allow transit agencies to set a “best fare” policy in which people pay fares based on their ability to pay (ibid). This would enable transit agencies to charge higher fares for peak trips on more congested corridors while maintaining discount fares for vulnerable groups such as low-income riders, leading to greater farebox recovery without compromising transportation equity.
Another benefit of smartcards is that by collecting information on rider origins and destinations electronically, in real-time, they provide transit agencies with much more advanced datasets on rider travel behavior. Data from smartcards allows agencies to analyze travel behavior down to the scale of individual passengers, which was impossible with magnetic stripe technology (Pelletier et al, 2011, 560). This data can then help agencies better tailor their service planning by pinpointing the system’s maximum and minimum load points, passenger variability on specific routes, likelihood of transfers, and precise boarding and alighting points (ibid, 564).
Smartcards can yield significant operations cost savings as well. The cost of fare collection for most transit agencies is substantial, ranging from 7-12% for heavy rail and commuter rail to 4-6% for bus and light rail (McDonald, 2000, 18). Pelletier et al also

14 Privatizing the Metro Card | David Perlmutter | May 2015
found that most transit agencies spend between 5 and 15% of their annual revenues on fare collection (2011, 560). Although smartcards have generally high capital costs of implementation, most studies have shown that these are more than offset by lower life cycle costs in operation and lower long-term agency costs of fare collection (Perotta, 2014, 4; Pelletier et al 2011, 561). In Singapore’s EZ-Link smartcard system, for example, the cost of fare collection declined 6% post-implementation. Hong Kong’s Octopus Card, meanwhile, has half the annual operations cost of the previous magnetic stripe system (Perotta 2014, 3). These savings are primarily based on the smartcards’ durability, lower equipment maintenance costs, and the reduction of labor-intensive cash handling processes.
Moreover, smartcards help agencies lessen the toll of fare evasion and fraud, which in many agencies may constitute revenue losses of up to 10% annually (Perrotta, 2014, 5). One ancillary benefit of smartcards is that they enable transit agencies to reduce staff needed to maintain ticket vending machines. WMATA reported a 15% staff reduction in such staff after implementation of SmarTrip (Quibria, 2008, 14). However, the most urgent and compelling reason agencies are often interested in switching from magnetic stripe to smartcard is that the magnetic stripe technology’s supply chain is collapsing. SEPTA director Kane described needing to phase out magnetic stripe machines because the
list of eligible vendors to manufacture replacement parts for these machines had effectively disappeared (Keitel, 2009, 10).
Transit agencies are not the only stakeholder that sees opportunity in smartcards; there is tremendous interest from the private sector as well. One reason there is pressure on transit agencies to implement open payment smartcards (not just closed-loop systems) is that banks and credit card companies need a high volume of transactions for the low-cost transaction market to be profitable (McDonald, 2000, 8). Transportation provides that needed volume through a “captive clientele” that must use the dedicated transit fare payment method in order to board (Quibria, 2008, 15). Transit can therefore be seen as a vector for the adoption of smartcards and contactless payment in low-cost transactions throughout the broader retail economy. Keitel argues that riders using open loop contactless cards are more likely to use their contactless cards for transactions outside of the transit system, and that the brand goodwill of the issuing transit agency itself may be transferred to other merchants (2009, 12). In this vein, Montreal-based research from Paez et al suggests that certain types of commercial businesses tend to cluster near subway stations more than others (notably restaurants, grocery stores, and beauty shops). Because of their spatial affinity with transit stations, Paez argues that these types of businesses may be ideal commercial partners in a smartcard rewards or loyalty program that is mutually beneficial
Image Source: Flickr user Joe Mazzola
Selection of transit fare payment smartcards from around the world.

15 Privatizing the Metro Card | David Perlmutter | May 2015
Table 1: Transit Agency Smart Card Implementation
City Transit Agency
Card Name Primary Fare Technology
Fare Structure Recent Development or Future Plans
London
Transport for London
Oyster Card Open payment/NFC, Smartcard
Distance-based, Zone-based, Mode-based
Oyster Card itself is closed-loop but TfL began accepting contactless bank cards in 2013; all buses are now cashless
Hong Kong MTR Octopus Card Open payment/NFC Distance-based
Singapore LTA EZ-Link Open payment/NFC Distance-based Plans to reduce redundancies among multiple operator using cloud computing
Tokyo JR East Suica Open payment/NFC Distance, time, and mode-based
Seattle King County Metro
Orca Card Smartcard Zone-based, peak/off-peak pricing
Considering open payment/NFC
San Francisco BART, SF Muni, others
Clipper Card (formerly TransLink)
Smartcard Distance-based Considering open payment/NFC
Washington, D.C WMATA SmarTrip Smartcard Distance-based Implementing Open payment/NFC
Chicago CTA Ventra (formerly Chicago Card)
Open payment/NFC Distance-based Launched in summer 2014, the first large U.S. transit agency to offer open payment
Boston MBTA Charlie Card Smartcard Flat fare Implemented “mTicket,” mobile payment on commuter rail in 2012
New York City MTA Metro Card Magnetic stripe card Flat fare 2010 Pilot of open payment/NFC, is considering smartcard implementation by 2022
New York/New Jersey
PATH SmartLink Smartcard Flat fare
Salt Lake City Utah Transit Authority
PayWave Open payment/NFC Distance-based
Philadelphia SEPTA Key Open Payment/NFC Distance and time-based
In “pre-pilot” phase, launch date TBD
Los Angeles LACMTA TAP Smartcard Flat fare
Atlanta MARTA Breeze Card Smartcard Flat fare

16 Privatizing the Metro Card | David Perlmutter | May 2015
for both parties in an open-loop system (2011, 651). The transit agency would gain a small revenue stream from participating merchants in an advertising contract, while the merchants gain increased consumer exposure in a captive setting.
Equity considerations for disadvantaged riders, particularly unbanked riders, are a major concern for agencies implementing smartcards. Because transit agencies in the US must meet equity obligations such as Title VI, low-income un(der)banked transit riders must be accommodated. One problem is that smartcards often require an initial deposit or “prepayment”, which low-income riders may be unable to meet (Quibria, 2008 19). To accommodate the un(der)banked in smartcard implementation, Kocur argues that government-issued EBT cards (an open-loop prepaid debit card) could theoretically be incorporated as valid payment in an open payment environment (2010, 14). Another strategy for an open payment system is to distribute agency-issued prepaid cards at retail locations or even bank ATM’s (ibid). This strategy would require the transit agency to negotiate the terms of the prepaid cards effectively with the card provider, such that prepayment fees are waived and inequitable fee structures (relative to mainstream bank cards) are avoided. Likewise, undocumented riders will not be able to use open-loop smartcards that require personal identification and registration (Kocur, 2010, 15). Visa has developed an open-loop prepaid card reloadable up to $1,000 that has no registration requirement and does not allow cash withdrawals, making it ideal for transit agency implementation (ibid). However, because few of these solutions have been sufficiently articulated, “layering” has been the dominant approach most American transit agencies have taken (McDonald, 2000, 22). Layering refers to an implementation in which smartcards, cash payments, and older magnetic stripe cards are each accepted. This reiterates the common theme in American smartcard research that for equity reasons, the cash payment option must be preserved (Joshi, 2011, 62).
The un(der)banked, therefore, are an important community of concern in transportation planning as many public transit agencies begin to transition to new integrated fare payment systems. Adopting a new fare payment system that deprecates, penalizes, inconveniences or prohibits fare transactions not originating in a traditional bank account would be considered a highly inequitable policy and may even expose transit agencies to Title VI litigation. Agencies must carefully consider implementation alternatives of new fare payment technologies such that both banked and unbanked riders are accommodated while still realizing these technologies’ numerous benefits.
Prepaid Debit Cards in an Open Payment SystemContactless, prepaid debit cards are highly relevant for transit agencies seeking to accommodate un(der)banked customers on an open-loop smartcard fare payment system because they have similar point-of-sale capabilities to bank cards yet do not require the consumer to have a mainstream bank account. Prepaid debit cards represent one of the fastest growing segments of consumer financial services; since 2006, the total volume of prepaid transactions in the United States has grown 46% (Keitel, 2012, 4). Also known as “stored value cards,” prepaid debit cards are reloadable payment cards in which cash value is loaded onto the card before it can be used to transact. Although prepaid debit cards use the same technology as retailer-branded “gift cards,” prepaid debit cards are generally open-loop – known in the payments industry as “general-purpose reloadable” (GPR) – and can be used at a variety of venues, whereas gift cards are typically limited to a single store brand. Because a significant portion of transit riders are un(der)banked, transit agencies increasingly see prepaid debit cards as a means of achieving their intended operational cost savings of open-loop smartcards while also providing some degree of equity as cash-based payment operations are gradually phased out. There are also opportunities for transit agencies to share the revenues earned on fees from prepaid card retail transactions with the card companies.
Prepaid debit cards serve as an alternative to cash or checks and have tremendous potential to provide a means for unbanked consumers to pay for daily necessities while avoiding many of the obstacles that mainstream banking institutions present to lower-income consumers. Jacob et al summarize the potential benefits of prepaid debit cards as the following: they generally lack identification requirements; they can be purchased at many non-bank retail locations such as check cashers, convenience stores, and gas stations; they provide immediate availability of funds at a cost that is often lower than the ATM fees mainstream banks typically charge for small transactions; and they are difficult to overdraft, reducing the likelihood of unexpected fees (2005, 3). Many of the more popular prepaid debit cards in the United States today are reloadable cards used for payroll or government benefits direct deposit that need not be linked to a bank account, and a growing number of providers now allow international remittances (ibid, 11).

17 Privatizing the Metro Card | David Perlmutter | May 2015
One promising area of experimentation with prepaid debit cards is their use of transaction history to create a kind of hybrid bank account, effectively helping “bank the unbanked” (Prior and Santoma, 2008). Prepaid cards have very similar ATM and point-of-sale capacities to credit or debit cards, but the key difference is that they can be reloaded through physical machines accessing an internal account network. They are therefore useful in that they provide the core functions of a bank account while avoiding the major hurdles that the unbanked face in acquiring traditional bank accounts. If implemented judiciously, prepaid debit cards may provide un(der)banked transit riders with entry to the wealth-building features that mainstream banks have largely dominated. Several prepaid debit card companies, such as Directo and NetSpend, have experimented with offering savings features with their cards (Jacob et al, 2005, 14). NetSpend, for instance, offers prepaid debit cards that include both prepaid and savings accounts. The savings account has features similar to a mainstream savings account, including free enrollment and up to six free monthly transfers, though there are still fees to withdraw money from the prepaid debit account (ibid, 15). Unfortunately, few prepaid debit card companies offer credit-building features that might allow unbanked consumers to leverage their credit history to qualify for home mortgage loans and other pathways to wealth creation. Credit building features are generally unavailable on prepaid cards because the national credit report bureaus have yet to agree upon a standard data reporting format for prepaid cards’ data which is still viewed as “non-credit data” (ibid, 16). This indicates that although prepaid debit cards may replicate most daily functions of a mainstream bank account, they alone are insufficient in resolving some of the larger barriers the un(der)banked face in long-term savings and wealth creation.
There have been several successful pilot projects of prepaid debit cards with these functions in the context of a transit fare payment system. The Los Angeles County Metro Transit Authority (LACMTA) piloted a transit smartcard, “TAP ReadyCARD,” with two available functions: a contactless bank card (managed by Visa) and a GPR prepaid debit card designed specifically for transit fare payment (managed by Ready Credit). Among the pilot’s consumers who used the TAP ReadyCARD, 37% used direct deposit to reload their cards, compared to 82% of Ready Credit customers using a more traditional retail-oriented GPR prepaid debit card that was not branded for transit (Keitel, 2012, 18). In addition, TAP ReadyCARD customers had an average transaction size of 60% less than the traditional retail prepaid customers (ibid). This leads to one of three conclusions: 1) transit-branded prepaid cards
were less likely to be seen as the customer’s primary account; 2) transit-branded prepaid customers in Los Angeles have less disposable income than the population using non-transit-branded prepaid cards; or 3) transit-branded prepaid customers are less likely to have direct deposit enabled than consumers using a non-transit prepaid card.
Although there is not yet an academic consensus on whether prepaid debit cards offer low-income consumers a less expensive financial service compared to AFS, mounting evidence suggests that the prepaid card fee structures may be even more burdensome. Many prepaid cards distributed through state unemployment benefits programs charge fees for customer services such as using an ATM or speaking to a customer service representative over the phone (Valenti and Heiss, 2013, p.4). Likewise, Ready Credit’s transit-branded prepaid card in Los Angeles charged their customers a $0.95 fee to check their balance and a $1.95 fee to withdraw cash at an ATM (Keitel, 2012, 22). These fees are in addition to the other ATM service fees typically charged by banks and retailers, effectively reducing pay or benefits. Especially problematic for transit agencies is the possibility that prepaid debit cards, if designed with unfavorable terms of use or fee structures, may be considered discriminatory against the un(der)banked if they were distributed as part of the fare payment system.
The Case of Chicago’s VentraChicago Transit Authority’s recently implemented fare payment system, Ventra, is the first large-scale, open-loop smartcard in the United States. Ventra may offer the clearest prelude to the challenges and opportunities the New York MTA is likely to face in rolling out the next Metro Card. Like the Ready Credit pilot in Los Angeles, Ventra was designed as a dual-purpose transit fare payment smartcard (linked to a mainstream bank account) and prepaid debit card for non-transit purposes. Ventra is a public-private partnership between the Chicago Transit Authority, MasterCard (payment processor), and FirstData (prepaid card manager). The prepaid card functionality was intended as a means of including Chicago’s significant portion of un(der)banked transit riders who would be unable to link their Ventra cards to a bank account (Hilkevitch, 2013). Un(der)banked riders now have the choice of either buying a Ventra card with built-in prepaid debit card functionality or buying a disposable contactless single-ride ticket for a fare of $3,

18 Privatizing the Metro Card | David Perlmutter | May 2015
which includes a $0.50 convenience fee5 (Swartz, 2013). Because this fare is higher than the regular “base fare” of $2.25, a relatively small portion, about 4%, of Chicago transit riders bought single-ride tickets in 2012 (Cox, 2013).
Since the launch of Ventra in summer 2013, Chicago transit riders been beset by fare system technical failures, hidden customer charges and fees, and what was widely seen as an inadequate public outreach process. The Chicago Transit Authority commissioned a Fare Equity Analysis in June 2013 that stopped short of analyzing the fee structure of Ventra’s prepaid debit cards (Nancy Whelan Consulting, 2013). Instead the Equity Analysis focused on the geographic distribution of retail establishments where riders could purchase or reload their Ventra cards. Residents within one-third of a mile of a Ventra retailer were considered to have equitable access to the fare payment system. By this metric, the study found that Ventra created neither “disparate impacts” on minority communities nor “disproportionate burdens” on low-income populations (ibid, 26). The impact of Ventra prepaid card fees was not evaluated because non-transit retail transactions are managed by the card network and therefore are considered to be out of the purview of the Chicago Transit Authority6.
However, the fee structure of prepaid debit cards like Ventra for non-transit transactions should give transit agencies pause as they consider distributing these banking instruments to large, un(der)banked communities who may lack mainstream banking experience. Ventra’s standard fees7 include a $2 fee for riders requesting paper copies of their transaction history, $2 fee for calling the Ventra customer service center, a fee of $1.50 for ATM withdrawals, a $5 monthly fee for inactivity on the transit function and a $2 monthly fee for inactivity on the prepaid card function (Hilkevitch, 2013a). According to a recent analysis, Ventra’s prepaid debit card costs the typical customer $188 in annual fees, compared to just $39 in annual fees the highest-rated prepaid debit card from U.S. Bank (Hilkevtich, 2013b). Riders, according to some accounts, have been routinely double and triple-charged for fares and experienced hour-long wait times with customer service representatives based out-of-state (Zimmer, 2013). Some riders even reported being charged twice for a single ride due to the simple error of exiting a bus through the front doors, triggering Ventra’s contactless RFID scanner (Hilkevitch, 2013).
5 Cash payment is still allowed on Chicago Transit Authority’s buses (Swartz, 2013). Banked riders may also pay using contact-less credit or debit cards.6 Candace Brakewood, Personal Interview.7 This does not include two additional fees Ventra withdrew in response to public opposition, a $2.95 fee for reloading an account balance online using a credit card and a $10 per hour fee for disputing fraudulent charges (Hilkevitch, 2013b).
While the prepaid card function may fulfill the Chicago Transit Authority’s objectives of reducing cash handling operations and enabling the un(der)banked to pay for transit fares electronically, it is clear that Ventra’s hidden fees make it an opaque and inequitable solution when non-transit prepaid transactions are considered. In the words of Linda Sherry of the non-profit Consumer Action, “Why should public transit agencies be involved in making interchange fees off people? These are supposed to be public-serving agencies, and a fee-laden card isn’t exactly a public service” (qtd. in Hilkevitch, 2013a). To put this in the perspective of potential Title VI litigation, a transit riders’ group could conceivably argue that the Ventra fare payment system discriminates against the un(der)banked by compelling these riders to pay more in aggregate fees compared to the banked for the same consumer behavior. Prepaid cards are therefore merely the technological means necessary to accommodate the un(der)banked in an open-loop smartcard system, but by no means do they ensure equitable or transparent outcomes.
The MTA’s Contactless Metro CardImplementing specific fare payment accommodations or alternatives for unbanked transit riders may enable the MTA to avoid inequitable policy outcomes. In an exploratory 2010 study, the MTA indicated that a major objective of its new “Contactless Metro Card” would be to provide equal access for both unbanked and banked customers (Metropolitan Transportation Authority, 2010, 36). The MTA, in conjunction with New Jersey Transit and the Port Authority of New York/New Jersey, successfully tested contactless fare payment technology on the Lexington Line and several bus routes in a 2010 pilot project serving 17,000 riders8. The 2010 pilot was intended only to test the feasibility of contactless technology and did not measure customer acceptance nor the local market penetration of contactless bank cards (Carr, 2012). An MTA spokesperson clarified that the intent of the pilot was to ensure that “contactless” payments could be securely implemented; that the payment method could allow customers to transfer seamlessly across all regions of the system, from the MTA’s subway stations and buses to New Jersey Transit to Path trains; and that the system could endure 8 MasterCard and CitiBank installed readers at 30 Lexington Av-enue Line stations; CitiBank customers with MasterCard PayPass™ devices entered the system by tapping directly at the readers on the subway turnstiles (Metropolitan Transit Authority, 2010, 16).

19 Privatizing the Metro Card | David Perlmutter | May 2015
tough conditions (e.g. it would still work on a bumpy bus ride), and work with multiple brands, including MasterCard and Visa” (ibid). It is ultimately expected that the MTA will roll out a new contactless Metro Card by 2022, at a cost of at least $450 million (Metropolitan Transportation Authority, 2015).
However, it is unclear whether the MTA intends to include unbanked customers in a Contactless Metro Card by implementing a prepaid debit card or by simply preserving existing cash payment alternatives to the smartcard it ends up adopting. It also remains to be seen whether the MTA’s next Metro Card will be an open-loop or closed-loop system9. To pay for transit, options for unbanked riders instead of bank cards are 1) paying cash; 2) transit-issued, closed-loop contactless smartcards like Boston’s “CharlieCard”; 3) transit-issued, open-loop, contactless prepaid debit cards like Chicago’s “Ventra”; and 4) card network-issued, closed-loop prepaid debit cards (like the New York toll payment system, “EZ-Pass”) (SmartCard Alliance Transportation Council, 2008). Another option for implementation is a multi-tiered “layering” system, in which transit-issued smartcards are introduced while the agency also preserves the older magnetic stripe fare payment system of today’s MetroCard that would continue to accept cash payment (Brower and Henderson, 2004, 8). The MTA’s own documentation for its new fare payment system acknowledges that an open payment system would have greater difficulty accommodating un(der)banked riders than either a closed-loop smartcard or the existing Metro Card and may require multiple fare payment systems running in parallel (Metropolitan Transportation Authority, 2011, 17). In order to articulate an equitable transit fare payment system for the next Metro Card, this investigation undertook two qualitative research methods – intercept surveys and structured interviews – to achieve two objectives. The first objective was to understand travel behavior of un(der)banked transit riders in New York City. The second objective was to consult a variety of transit fare policy experts on emerging Best Practices for the inclusion of un(der)banked transit riders in a smartcard-based fare payment system.
9 As of this writing, the MTA has yet to announce a formal RFP for its new fare payment system, so its technological format remains unknown. (Gary Roth, Personal Interview).
Methodology
This study conducted an exploratory travel behavior survey of transit riders in neighborhoods with high portions of un(der)banked residents. According to existing literature, no publicly available survey has yet been performed in New York City that gathered information on both travel behavior and financial services participation. Therefore one of the objectives of this investigation was to propose and evaluate a research methodology that explores the intersection between un(der)banked communities, travel behavior and transit fare policy.
There are three existing pieces of research that cover similar subject matter in New York City but that stop short of addressing the intersection of unbanked communities and transit fare payment. First, the NYC Department of Consumer Affairs’ Office of Financial Empowerment completed a survey of unbanked communities in the city in 2011, the Citywide Financial Services Study (CFSS). Through a contract with the Acxiom Corporation and the non-profit Social Compact, the study estimated the number of unbanked individuals in each NYC Community District using a variety of data types as potential indicators of unbanked status10 (NYC Department of Consumer Affairs, 2011) . These data included debt-to-income ratios, FICO credit scores, home equity, homeownership rates, locations of AFS and mainstream banks, and other demographics. The data were then compiled into a numerical index ranging from 1-20 that represented an individuals’ level of traditional finance participation. A score of “1” indicated that an individual is unbanked and has no relationship with traditional finance institutions. The results of the CFSS were a series of aggregate totals of un(der)banked individuals within each of the 51 Community Districts of New York City. Although the sub-District-level data of the CFSS were proprietary and unavailable for public use11, the aggregate data provided at the District level were sufficient to create generalized maps of New York City’s un(der)banked population. As shown in Figure
10 The detailed methodology of the Citywide Financial Services Study can be found here.11 Kate Glynn-Broderick, Personal Interview.

20 Privatizing the Metro Card | David Perlmutter | May 2015
1, the distribution of un(der)banked individuals in New York City is highly varied and closely aligns with the city’s existing socioeconomic inequalities of income, race and ethnicity.
The second source is the New York Metropolitan Transportation Council’s (NYMTC) 2009 Environmental Justice Assessment for the MTA. This report does not explore the issues of un(der)banked communities or fare policy directly, but does highlight Census tracts where transportation equity is likely to be a concern. “Communities of concern” are those containing both high concentrations of ethnic minority residents (above 52%) and high portions of residents living in poverty (above 16%). As shown in Figure 4, these areas are almost identical to the neighborhoods the CFSS identified as having the greatest proportions of unbanked residents (Figure 1).
Clifford Oppurum provides in-depth travel behavior statistics of New York City Transit commuters in Automated Fare Collection and Urban Public Transportation. In a comprehensive mail-in survey of 1,201 riders of the New York City Transit system, Oppurum received 232 survey responses on a variety of topics including travel behavior (trip frequency, origins/destinations, trip purpose), fare payment preferences (type of Metro Card purchased), and socioeconomic characteristics12. Perhaps because these surveys were performed in 2002 – at a time when open-loop fare payment was not yet an MTA priority – respondents were not asked for information about how they pay for Metro Card, nor were they asked about the types of financial services they used. Nevertheless, Oppurum’s surveys constitute a solid research foundation upon which to expand. The ultimate goal of this investigation will be to propose and evaluate a survey methodology that captures respondents’ fare payment preferences, travel behavior, and financial services participation.
To further articulate this New York City-based body of research, this study performed face-to-face intercept surveys in neighborhoods identified by the CFSS as having the city’s highest proportions of un(der)banked individuals, given in Table 4 and Figure 1. The intent of these surveys is by no means to sample a statistically representative portion of the un(der)banked community in New York City. Due to limitations of time and funding, surveying the required number of respondents to be representative was not feasible13. Rather, the intent of the surveys was to isolate a particular population known to be socially and economically vulnerable – the un(der)banked) – and gain insights on their travel 12 The MTA also collected these data in the 2008 New York Customer Travel Survey (Metropolitan Transportation Authority, 2009, 43).13 A statistically significant sample of New York City’s unbanked population of approximately 825,000 would require a sample of about 600 respondents, given a confidence interval of 4 and a confidence level of 95% (Richardson et al, 101).
behavior and fare payment preferences as well as provide side-by-side comparisons to the banked respondents. Ideally, future research could expand upon these surveys until a representative number of respondents are reached and more statistically significant relationships can be established.
Two neighborhoods were selected for the intercept surveys: Fordham (53% unbanked, 45% underbanked) and Bushwick (47% unbanked, 49% underbanked) (New York City Department of Consumer Affairs, 2011). As shown in Figure 2 and Figure 3, these Community Districts also have some of the city’s lowest concentrations of mainstream financial institutions (compared to AFS establishments) as well as some of its lowest median household incomes. In selecting an appropriate survey location, three factors were considered: the proximity of MTA subway entrances, where the topic of transit fare policy will appear more immediately relevant; the proximity of AFS retail locations where un(der)banked consumers were likely to be present; and the location within a busy retail corridor with high pedestrian traffic to ensure a high respondent turnover. Surveys were completed on two weekdays and one Saturday during January 2015. As an incentive for participation, respondents were provided with a single-issue, round-trip Metro Card of $5 value14. Survey respondents were solicited on public sidewalks of highly trafficked retail corridors indicated in Figure 5 and Figure 6 and asked whether they would like to participate in a study aimed at improving the Metro Card in exchange for a $5 round-trip ticket. This form of compensation was chosen because of the transit-focused nature of the survey questionnaire and because the Metro Cards would be available for the respondents’ immediate use. For purposes of data tabulation and coding, individuals who responded that they did not use any traditional bank account were categorized as unbanked, while those who used both traditional bank accounts and AFS were counted as underbanked. For clarity, these groups were consolidated into a single group, the un(der)banked. This study required the purchase of 50 round-trip Metro Cards from MTA station agents, at a cost of $300 covered by the William H. Kinne Fund of Columbia University’s Graduate School of Architecture, Planning & Preservation.
This study also performed a series of semi-structured interviews with transit policy experts responsible for implementing new fare payment systems. During the interviews, experts were engaged in conversation about new fare payment systems with emphasis around a series of questions: the agency’s rationale for adopting a new fare
14 Each single-ride Metro Card includes a $0.50 convenience fee levied in addition to the base fare amount, meaning that a round-trip Metro Card of $5 fare value costs $6.

21 Privatizing the Metro Card | David Perlmutter | May 2015
payment system; the benefits associated with the new fare payment system (real or anticipated); barriers to implementation of the fare payment system; and the agency’s means of accommodating un(der)banked transit riders. The collective purpose of these interviews was to enable comparisons to be made from across different transit agencies, regions, and fare payment systems. The results of these interviews are presented as a series of case studies. Case study analysis was selected as the research strategy because this investigation’s themes include emerging contemporary events and a high degree of particularity among each agency’s fare payment systems. According to Yin, “the distinctive need for case studies arises out of the desire to understand complex social phenomena” because they “allow investigators to retain the holistic and meaningful characteristics of real-life events,” such as high-level managerial or organizational changes, for example (2013, 3). Case studies are the preferred strategy when “how or “why” questions are being posed, when the investigator has little control over events, and when the focus is on a contemporary phenomenon within some real-life context (Yin, 2013, pp. 6-11). The case study analytical framework is similar to that explored in Anders et al but with additional emphasis placed on policy solutions for accommodating un(der)banked transit riders (2014, 8). In the context of this investigation, both the rider surveys and case studies are considered exploratory because there is no existing dataset cataloguing the impacts of fare policy on the un(der)banked; it is very much a matter still being negotiated and explored by transit policy experts. A mixture of experts from the private, public and nonprofit sectors was selected to include a range of organizational perspectives. Table 2 includes a list of individuals who were interviewed.
Table 2: Case Study SourcesMetropolitan Area Organization Name Title
London, UK Transport for London Andrew Anderson Customer Experience Manager
New York, NY City College of New York Candace Brakewood Professor, Civil Engineering
Chicago, IL Chicago Metropolitan Planning Council
Yonah Freemark Project Manager
Philadelphia, PA Southeastern Pennsylvania Transportation Authority (SEPTA)
Jerry Kane Manager of Capital Program Planning
Boston, MA Masabi, LLC Josh Robin Vice President of Business Development
New York, NY Metropolitan Transportation Authority (MTA)
Gary Roth Bus Technology Manager
Seattle, WA King County Metro Chuck Sawyer Operations Manager
San Francisco-Oakland, CA
Metropolitan Transportation Commission
Derek Toups Senior Project Manager
Hypotheses
This study began with five distinct hypotheses about the travel behavior of the un(der)banked in New York City. The intent of the intercept surveys was, to the extent possible, confirm or reject these hypotheses.
Hypothesis 1: Un(der)banked individuals are likely to have longer commutes and a larger average number of transfers than banked individuals.
This hypothesis follows from a Pratt Institute study that concluded that low-income New Yorkers are more likely to have long commutes, in excess of sixty minutes, with more transfers, than the average New Yorker (Center for an Urban Future, 2011, 12). The un(der)banked are, of course, an overwhelmingly low-income cohort. Many low-income New York neighborhoods have inadequate transit service and are inaccessible to major employment centers. Therefore, this study predicted that un(der)banked respondents will be more likely than banked respondents to have commutes in excess of sixty minutes. This prediction is in keeping with Pratt’s finding that two-thirds of riders with long commutes have incomes below $35,000 (ibid), a threshold below which many consumers have difficulty acquiring and maintaining mainstream bank accounts.

22 Privatizing the Metro Card | David Perlmutter | May 2015
Hypothesis 2: Unbanked people are more likely to take multiple transit modes than the banked population.
Brakewood and Kocur found that 69% of Chicago’s un(der)banked transit riders took both buses and trains, versus just 53% of banked riders (2012, 7). This may be due to the reality that lower income transit riders face longer commutes that require intermodal transfers, reflecting the assumptions of Hypothesis 1.
Hypothesis 3: Unbanked people are less likely to receive assistance in paying for Metro Card.
The MTA currently gives discounted Metro Card fares to certain groups such as public school students and seniors. Other commuters receive tax-free Metro Cards as a benefit through their employers (MTA, 2009, 11). However, this study predicted that un(der)banked transit riders are less likely to receive these discounted fares because doing so generally requires identity verification. Reflecting the findings of Joassart-Marcelli and Stephens, this study predicts that the un(der)banked are more likely than the general population to be undocumented non-citizens and therefore unable to receive discounted transit fares for which they would otherwise be eligible.
Hypothesis 4: Unbanked people are more likely to buy Weekly Unlimited MetroCards than other types.
This hypothesis reflects the reality that as a predominantly low-income group, the un(der)banked are likely to have precarious personal finances and are less likely to have the disposable income necessary to spend $11215 on a Monthly Unlimited Metro Card in a single installment. It is more likely that un(der)banked riders still desire to save on a per-ride basis by buying the Weekly Unlimited and avoid the convenience fee of a Single-Ride ticket. Of all Metro Card types, the Weekly Unlimited had the lowest median income of riders surveyed in the MTA’s 2008 New York Customer Travel Survey, at just $37,600 versus the median income of $63,400 for buyers of the Monthly Unlimited and $55,200 systemwide (Kazis, 2010). The only
15 A Monthly Unlimited Metro Card costs $116.50, as of the MTA’s late March 2015 fare hike.
group with a lower median income was riders paying cash on MTA buses only; their median income was $36,200 (ibid).
Hypothesis 5: Un(der)banked individuals are equally likely to own smartphones as banked individuals.
Unlike mainstream bank accounts, mobile phones typically do not require identity verification or credit history in the United States to qualify. Unlike mainstream banks, most mobile phone carriers have widespread retail networks in lower-income neighborhoods, often with extended hours of service. Many mobile phone carriers offer flexible contracts and payment plans that reduce the cost of ownership, which is partly responsible for the high market penetration of smartphones in the US. With a market penetration of 75% in the United States16, it is reasonable to expect no difference in prevalence of ownership between banked and un(der)banked communities.
16 Josh Robin, Personal Interview.

23 Privatizing the Metro Card | David Perlmutter | May 2015
Data Sources
Table 3: Data Sources on New York City’s Unbanked Population and Travel Behavior
Dataset Name Coordinating Agency
Release Date
Financial Services Participation
Travel Behavior Immigration Status
Location
Citywide Financial Services Survey
New York City Department of Consumer Affairs
2012 Yes No No Yes
Census Transportation Planning Package
U.S. Census Bureau 2013 No Yes No Yes
National Household Travel Survey
Federal Highway Administration
2010 No Yes No Yes
Survey of Income and Program Participation
U.S. Census Bureau 2008 Yes No Yes Yes
Table 4: New York City Neighborhoods with Least Access to Traditional Financial Services
Mainstream Financial Services
AFS
District Name Borough Community District
Total Count
Count per 10,000 Households
Total Count
Count per 10,000 Households
Ratio of Traditional Financial Services to AFS Locations
Bushwick Brooklyn Brooklyn CD 4 2 0.6 19 5.8 0.1
Highbridge, Concourse Bronx Bronx CD 4 5 1.1 21 4.5 0.2
Morris/University Heights, Fordham
Bronx Bronx CD 5 6 1.5 26 6.5 0.2
Brownsville, Ocean Hill Brooklyn Brooklyn CD 16 2 0.7 13 4.3 0.2
East Tremont, Bathgate, Belmont, West Farms
Bronx Bronx CD 6 5 1.9 15 5.8 0.3
Melrose, Morrisania, Claremont
Bronx Bronx CD 3 4 1.6 11 4.4 0.4
Crown Heights South, Prospect Lefferts Gardens
Brooklyn Brooklyn CD 9 4 1.1 8 2.2 0.5
East Harlem Manhattan Manhattan CD 11
10 2.1 21 4.4 0.5
Hunts Point, Longwood Bronx Bronx CD 2 8 5.2 13 8.5 0.6
Castle Hill, Parkchester Bronx Bronx CD 9 13 2.1 24 3.9 0.6Source: Citywide Financial Services Study, New York City Department of Consumer Affairs, 2011

24 Privatizing the Metro Card | David Perlmutter | May 2015
Table 5: New York City Neighborhoods with Least Banking Penetration
District Name District Percent Unbanked Households
Percent Underbanked Households
Total Households
Percent Unbanked and Underbanked Households
Average Home Value
Percent Home Owners
Average Household Income
Mott Haven, Melrose, Port Morris
Bronx CD 1
56 42 28,334 98 $214,772 7 $33,197
Morris/University Heights, Fordham
Bronx CD 5
53 45 39,985 98 $273,256 5 $39,901
Hunts Point, Longwood
Bronx CD 2
52 45 15,332 97 $248,825 10 $35,009
Melrose, Morrisania, Claremont
Bronx CD 3
53 44 24,940 97 $296,879 9 $42,488
Highbridge, Concourse
Bronx CD 4
51 46 46,706 97 $263,561 7 $39,192
East Tremont, Bathgate, Belmont, West Farms
Bronx CD 6
44 53 25,770 97 $302,546 9 $32,209
Brownsville, Ocean Hill
Brooklyn CD 16
47 50 29,893 97 $361,344 16 $40,980
Bushwick Brooklyn CD 4
47 49 32,618 96 $422,077 16 $38,667
East New York, New Lots
Brooklyn CD 5
32 63 58,589 95 $382,214 24 $46,818
Flatbush, Rugby Brooklyn CD 17
27 68 56,770 95 $437,207 30 $54,871
Source: Citywide Financial Services Study, New York City Department of Consumer Affairs, 2011

25 Privatizing the Metro Card | David Perlmutter | May 2015
Table 6: New York City Transit Riders by GenderGender Percent of Sample
Male 37.5
Female 62.5
Source: Opurum, 2012, 113.
Table 7: New York City Transit Riders by Annual Household Income
Income Percent of Sample
Less than $10,000 8.2
$10,000 – 19,999 6.5
$20,000 – 29,999 18.5
$30,000 – 39,999 16.4
$40,000 – 49,999 17.2
$50,000 – 59,999 6.5
$60,000 – 69,999 4.3
$70,000 – 79,999 6.0
$80,000 – 89,999 3.9
$90,000 – 99,999 2.6
Greater than $100,000 9.9Source: Oppurum, 2012, 116
Table 8: Frequency of Subway Use
Frequency of Subway Use Percent of Sample
Once Weekly 5.2
2-3 Times per Week 5.6
4-5 Times per Week 32.3
6 Times per Week 22.8
7 Times per Week 34.1Source: Opurum, 2012, 116
Table 9: Trip PurposeTrip Purpose Percent of Sample
Work 50.4
Work/Shopping 9.9
Work/Leisure 14.2
Other 4.7
Work/Other 4.3
Shopping/Other 12.1
Shopping 3.4
School 3.4Source: Opurum, 2012, 120
Table 10: Market Share for Metro Card Ticket Types
Ticket Type 2003 (Opurum)
(%)
2013 (MTA) (%)
Pay-Per-Ride MetroCard 50.9 43
Weekly Unlimited MetroCard 19.8 21
Monthly Unlimited MetroCard 17.7 29
Daily Unlimited MetroCard (discontinued)
4.7 N/A
All Unlimited Cards 42.2 50
Token (discontinued) 4.3 N/A
Other (Cash Payment on buses, Single-Ride Tickets)
2.6 7
Source: Opurum, 2012, 119; Metropolitan Transportation Authority, 2013
Table 11: Factors Influencing Metro Card Ticket ChoiceFactor Percent of Sample
Frequency of Trip 56.0
Convenience of Ticket 22.4
Cost of Ticket 9.5
Income Level 6.9
Security of Ticket 3.0
Other 2.2Source: Opurum, 2012, 122

26 Privatizing the Metro Card | David Perlmutter | May 2015
Unbanked and Underbanked Households (%) in New York City
¯0 4 8 12 162
Miles
Legend
0 - 20%
20 - 40%
40 - 60%
60 - 80%
80 - 100%
1
2
Percent Un(der)banked Households
Data Collection Sites1. Fordham Road (Bronx CB 5)2. Myrtle-Wycko� (Brooklyn CB 4)
Figure 1: Un(der)banked Households in New York, by Community Board (%), 2011
Modified from New York City Department of Consumer Affairs (2011), Office of Financial Empowerment, Citywide Financial Services Survey

27 Privatizing the Metro Card | David Perlmutter | May 2015
Access to Financial Services in New York City
¯0 4 8 12 162
Miles
LegendRatio of Mainstream Financial Institutions to AFS Establishments
0.1 - 1
1.1 - 2
2.1 - 3
3.1 - 5
5.1 - 15
Data Collection Sites1. Fordham Road (Bronx CB 5)2. Myrtle-Wycko� (Brooklyn CB 4)
1
2
Figure 2: Ratio of Traditional Finance Institutions to AFS Locations (2011)
Modified from New York City Department of Consumer Affairs (2011), Office of Financial Empowerment, Citywide Financial Services Survey

28 Privatizing the Metro Card | David Perlmutter | May 2015
Median Annual Household Income of New York City Community Boards, 2011
¯0 4 8 12 162
Miles
Legend
Lowest Quintile ($32,209 - $46,000)
Second Quintile ($46,001 - $57,000)
Middle Quintile ($57,001 - $65,000)
Fourth Quintile $65,001 - $87,000)
Top Quintile ($87,001 - $173,000)
Data Collection Sites1. Fordham Road (Bronx CB 5)2. Myrtle-Wycko� (Brooklyn CB 4)
1
2
Figure 3: New York City Community Districts by Average Household Income, Quintiles (2011)
Modified from New York City Department of Consumer Affairs (2011), Office of Financial Empowerment, Citywide Financial Services Survey

29 Privatizing the Metro Card | David Perlmutter | May 2015
Figure 4: “Communities of Concern” in the New York Region (NYMTC)
Source: New York Metropolitan Transportation Council, 2009.

30 Privatizing the Metro Card | David Perlmutter | May 2015
4183 St
!
!
!
!
!
!
Transportation & Land Use at Fordham Data Collection Site
Subway Stations Survey AreaBus RoutesSubway Routes
Land Use
Transportation
One and Two-Family HomesMulti-Family Walkup BuildingsMulti-Family Elevator BuildingsMixed Residential & Commercial BuildingsCommercial & Office BuildingsIndustrial & ManufacturingTransportation & UtilityPublic InstitutionsParksParking FacilitiesVacant
4Fordham Rd
BFordham Rd D
BKingsbridge D
4Kingsbridge
Figure 5: Transportation & Land Use Characteristics at Fordham Data Collection Site
Source: New York City PLUTO database

31 Privatizing the Metro Card | David Perlmutter | May 2015
Survey Area
Myrtle-Wyckoff
Knickerbocker Av
LDeKalb Av
Seneca Av
LMyrtle-Wyckoff
Halsey St L
Subway Routes
Transportation
Land UseOne & Two-Family HomesMultifamily Walkup BuildingsMultifamily Elevator BuildingsMixed Residential & Commercial BuildingsCommercial & Office BuildingsIndustrial & ManufacturingTransportation & UtilityPublic InstitutionsParksParking FacilitiesVacant Land
Subway Stations
Bus Routes
M
M
M
Figure 6: Transportation & Land Use Characteristics at Myrtle-Wyckoff Data Collection Site
Source: New York City PLUTO database

32 Privatizing the Metro Card | David Perlmutter | May 2015
Survey Results
Table 12: Gender Breakdown of Survey ResultsBanked Percent
BankedUn(der)banked Percent Un(der)banked Total
Female 10 45% 12 55% 22
Male 9 31% 20 69% 29
Total 19 37% 32 63% 51
Figure 7: Gender Breakdown of Survey Respondents
Figure 8: Age Breakdown of Survey Respondents

33 Privatizing the Metro Card | David Perlmutter | May 2015
Figure 9: Trip Purpose of Survey Respondents (for Most Recent Trip)
Table 13: Trip Purpose of Most Recent Trip Banked % Banked Un(der)banked % Un(der)
bankedGrand Total % of Total
Leisure/Discretionary
7 29% 17 71% 24 47%
Work or School Trip/Commute
12 44% 15 56% 27 53%
Grand Total 19 37% 32 63% 51 100%
Figure 10: Trip Length for Most Recent Trip
Table 14: Trip Length for Most Recent Trip Banked Percent Banked Un(der)banked Percent Un(der)
bankedGrand Total Percent of
Total
Less than 30 mins 5 33% 10 67% 15 29%
30-60mins 10 38% 16 62% 26 51%
Greater than 60 mins
4 40% 6 60% 10 20%
Grand Total 19 37% 32 63% 51 100%

34 Privatizing the Metro Card | David Perlmutter | May 2015
Figure 11: Trip Frequency of Survey Respondents
Banked Percent Banked Un(der)banked Percent Un(der)banked
Grand Total Percent of Total
Every Day 14 36% 25 64% 39 76%
Less than Every Day
5 42% 7 58% 12 24%
Grand Total 19 37% 32 63% 51 100%
Figure 12: Number of Transfers for Most Recent Trip
Number of Transfers
Banked Percent Banked Un(der)banked Percent Un(der)banked Grand Total
0 1 8% 12 92% 13
1 9 50% 9 50% 18
2 5 36% 9 64% 14
3 or more 4 67% 2 33% 6
Grand Total 19 37% 32 63% 51
Table 15: Trip Frequency of Survey Respondents
Table 16: Number of Transfers for Most Recent Trip

35 Privatizing the Metro Card | David Perlmutter | May 2015
Figure 13: Mode Choice for Most Recent Trip
Banked Percent Banked Un(der)banked Percent Un(der)banked
Grand Total Percent of Total
Bus 3 33% 6 67% 9 18%
Subway 5 29% 12 71% 17 33%
Multiple 11 44% 14 56% 25 49%
Grand Total 19 37% 32 63% 51 100%
Table 17: Mode Choice for Most Recent Trip
Figure 14: Payment Method for Most Recent Trip

36 Privatizing the Metro Card | David Perlmutter | May 2015
Figure 15: Point of Purchase for Most Recent Metro Card
Banked Percent Banked Un(der)banked
Percent Un(der)banked
Grand Total Percent of Total
MTA Stations 18 40% 27 60% 45 88%
Retail Outlets 1 17% 5 83% 6 12%
Grand Total 19 37% 32 63% 51 100%
Table 18: Point of Purchase for Most Recent Trip
Figure 16: Metro Card Type Most Recently Purchased
Banked Percent Banked Un(der)banked Percent Un(der)banked
Grand Total Percent of Total
Monthly Unlimited 3 43% 4 57% 7 14%
Weekly 9 41% 13 59% 22 43%
Pay As You Go 6 32% 13 68% 19 37%
Single Ride 1 33% 2 67% 3 6%
Grand Total 19 37% 32 63% 51 100%
Table 19: Type of Metro Card Most Recently Purchased
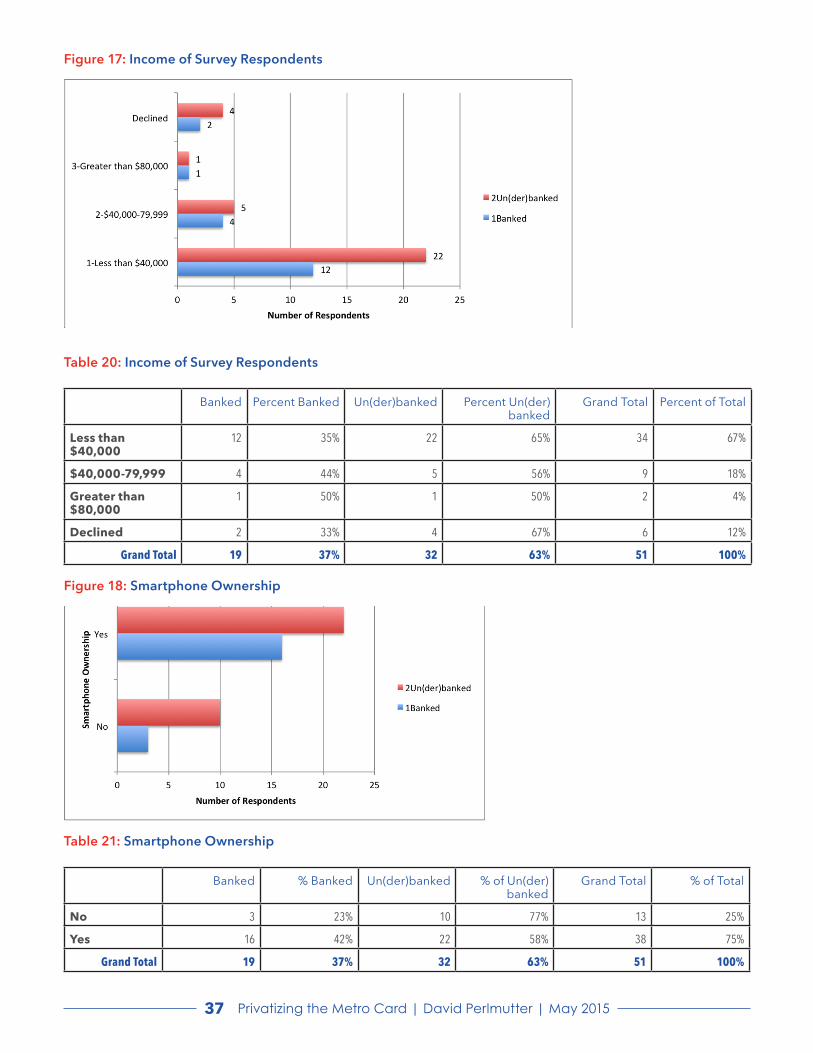
37 Privatizing the Metro Card | David Perlmutter | May 2015
Figure 17: Income of Survey Respondents
Banked Percent Banked Un(der)banked Percent Un(der)banked
Grand Total Percent of Total
Less than $40,000
12 35% 22 65% 34 67%
$40,000-79,999 4 44% 5 56% 9 18%
Greater than $80,000
1 50% 1 50% 2 4%
Declined 2 33% 4 67% 6 12%
Grand Total 19 37% 32 63% 51 100%
Table 20: Income of Survey Respondents
Figure 18: Smartphone Ownership
Banked % Banked Un(der)banked % of Un(der)banked
Grand Total % of Total
No 3 23% 10 77% 13 25%
Yes 16 42% 22 58% 38 75%
Grand Total 19 37% 32 63% 51 100%
Table 21: Smartphone Ownership

38 Privatizing the Metro Card | David Perlmutter | May 2015
Case Study Results
Chicago, Illinois
Former Fare Collection Methods and Rationale to Change
Until 2013, Chicago Transit Authority operated the Chicago Card, a transit-issued, closed-loop contactless smartcard that could be purchased and reloaded at any CTA station, online or retail location. The primary motivation to adopt open payment was operational cost savings through outsourcing the card manufacturing, equipment maintenance and account management responsibilities to the private sector. CTA also desired an account-based system that would enable the agency to track passenger origins, destinations, and other travel behavior in greater detail for operations planning purposes.
Description and Benefits of New Fare Payment System
Chicago Transit Authority’s bus and heavy rail modes now use Ventra, an open payment system launched in 2013. Ventra transit accounts can be reloaded at CTA stations, online, or at a network of retail locations using cash, credit or debit cards. Ventra requires a pre-payment fee of $5, although this fee was waived during the initial six-month rollout period. Metra, the commuter rail agency, continues to offer traditional, conductor-validated paper tickets and accepts Ventra card payments through a mobile application.
Barriers to ImplementationVentra received widespread negative media
attention for several reasons: technical issues with Ventra payments on buses; high service fees on Ventra prepaid debit cards for non-transit transactions; and general passenger resistance to the system. The transition to Ventra caused a series of highly publicized technical issues on buses because of Ventra’s account-based orientation. Ventra must access a cloud-based account server to process a passenger’s transit fare payment, whereas previously
under the Chicago Card the fare readers read/wrote information directly onto the card and required very little processing time. Although CTA buses are WiFi-equipped to speed transaction processing, access to the account servers can become disrupted if the WiFi is not functioning properly. The contract between CTA and First Data for prepaid debit card fees on non-transit transactions involved very high fees and service charges that arguably could have been avoided with a more equitable contract. Locally, Ventra fits into a larger narrative of poorly managed public-private partnerships and the privatization of public services such as charter schools and parking meters. Finally, Ventra faced significant passenger resistance surrounding two issues: the fee structure of the prepaid debit cards on non-transit transactions, and the fact that single-ride tickets not linked to a Ventra Card (using a contactless paper ticket) were more expensive than the regular base fare. The latter policy was seen as discriminatory against low-income people who could not afford to pre-pay the $5 for a Ventra contactless card.
Means of Accommodating Un(der)banked Transit Riders
The CTA promoted Ventra prepaid debit cards (for non-transit purchases) as an opportunity for un(der)banked people to access all of the benefits of a mainstream bank account while avoiding the obstacles presented to low-income people by mainstream banks themselves. In theory, this CTA effort has much in common with other municipalities’ initiatives to provide municipal identification cards to protect undocumented residents. However, given the high fees and unfavorable terms of the cards, the value of this public service was questionable. Stronger contract negotiations between CTA and the prepaid card company, First Data, may have resulted in lower fees and a more equitable card for un(der)banked passengers and consumers.

39 Privatizing the Metro Card | David Perlmutter | May 2015
Boston, Massachusetts
Current Fare Collection Methods and Rationale to Change
Massachusetts Bay Transportation Authority (MBTA) currently operates a closed-loop, contactless smartcard, “Charlie Card,” for subway, light rail, and bus transportation. Passengers pay for subway, light rail and bus rides at fare gates in station entrances or fareboxes in the front of vehicles. However, ferry and commuter rail transit does not accept Charlie Card. MBTA employees manually check tickets on these modes. In an effort to improve customer service and reduce operating expenses, MBTA advocated the expansion of Charlie Card fare collection on commuter rail in the late 2000’s. Due to the relatively low ridership on MBTA commuter rail, however, it was determined that the $70 million cost of expanding Charlie Chard fare collection infrastructure and $10 million annual operations expense could not be offset by the commuter railroad’s relatively low ridership17. The MBTA desired to change from a high-cost fare collection model, cash payment and fare vending machines dispensing only paper tickets, to a lower-cost model incorporating a larger share of mobile fare payment transactions.
Description and Benefits of New Fare Payment System
MBTA officials partnered with Masabi, LLC, a private-sector firm specializing in mobile payment and NFC technology. Instead of expanding Charlie Card, the agency chose to develop a customized mobile payment system through a contract with Masabi. They developed a mobile application that would display commuter rail tickets with a unique barcode and watermark security feature to be validated visually by train conductors. The implementation of the mobile application, mTicket, was very fast by industry standards, about four months between initial development and pilot release; full rollout took place within a year. This technology is neither contactless nor NFC and therefore not inter-operable with other modes of transit. MBTA declined to pursue NFC partly because of security concerns over NFC applications like Apple Pay or Google Wallet having access to agency fare payment data. Agency studies also showed that NFC had a very low market penetration of less than one percent, making it of limited value for widespread adoption. In addition, there were agency concerns that contactless cards lacked adequate market penetration to be a viable fare payment 17 Josh Robin, Personal Interview.
method, which precluded any implementation of open payment. Mobile payment, on the other hand, was seen as an easier technological alternative given the widespread market penetration of mobile phones (over 75% in most commuter rail passenger markets18).
Barriers to ImplementationThere were no major barriers to implementation
of the MBTA’s mobile ticket program, which had an unusually fast rollout period and no major issues reported. Visually validated mobile payment appears to have few obstacles to implementation in a proof-of-payment fare collection system like commuter rail.
Means of Accommodating Un(der)banked Transit Riders
Cash payment continues to be accepted at MBTA commuter rail stations, as before. Because mobile payment applications require a link to a customer’s bank account, they currently provide no means of accommodating un(der)banked riders. Therefore, mobile payment may help transit agencies reduce their operating expenses from cash fare collection equipment, but not eliminate them entirely.
London, U.K.
Former Fare Collection Methods and Rationale to Change
Oyster Card, the closed-loop smartcard, was introduced as part of a large infrastructure project that replaced and upgraded much of the fare collection technology within London’s transit system. The move to implement Oyster Card in 2003 had three motivations: to protect against fare fraud and evasion on the Underground, reduce operating expenses, and to improve speed of passenger ingress on all transport modes. Implementation included “installing modern fare gates within the Underground metro, replacing all bus electronic ticket machines, upgrading self-service ticket vending machines, upgrading staff controlled ticket office vending machines, new accounting system and ‘back office’ controls and the expansion and upgrades to all our retail outlets selling tickets within London.19” TfL introduced contactless smartcards to enable faster throughput at stations as well as electronic ticket checking on buses to speed up bus boarding and reduce bus travel times. The decision to deploy the smartcard was not subject to a participatory planning process, although TfL 18 Josh Robin, Personal Interview.19 Andrew Anderson, Personal Interview.

40 Privatizing the Metro Card | David Perlmutter | May 2015
Transit Agency Surveyed
Chicago Transit Authority
Massachusetts Bay Transportation Authority
Southeastern Pennsylvania Transportation Authority
Metropolitan Transportation Commission
King County Metro
Transport for London
Urbanized Area Chicago, IL Boston, MA Philadelphia, PA San Francisco-Oakland, CA
Seattle, WA London, U.K.
Modes Operated Heavy rail, Urban Bus
Commuter Rail, Heavy Rail, Urban
Bus, Light Rail
Commuter Rail, Heavy Rail, Urban
Bus, Light Rail
Commuter Rail, Heavy Rail, Urban
Bus, Light Rail, Suburban Bus
Commuter Rail, Light Rail, Urban
Bus, Suburban Bus
Heavy rail, Light rail, Urban Bus, Suburban Bus,
Ferries
Dimension
Current/Former Fare Collection
Method
Closed-loop smartcard: heavy
rail, bus
Closed-loop smartcard: heavy
rail, bus, commuter rail
Tokens, magnetic stripe fare cards:
heavy rail, light rail, buses
Magnetic stripe fare cards: heavy rail,
buses
Cash payment, paper tickets
Closed-loop smartcard: all
transportation modes
Rationale to Change Existing
System
Operational cost savings
Operational cost savings
Operational cost savings, aging fare collection
equipment; revenue-sharing
opportunities
Operational cost savings, improved
passenger throughput,
reduced bus dwell times
Improved passenger throughput,
reduced bus dwell times
Operational cost savings
New Fare Payment System
Open payment Mobile ticketing (commuter rail)
Open payment Regional closed-loop smartcard
Regional closed-loop smartcard
Hybrid: open payment and
previous closed-loop smartcard
Benefits of New Fare Payment
System
Improved customer experience
Improved customer experience
Improved customer experience,
increased ridership
Improved customer experience, increase
in linked trips
Improved customer experience, increase
in linked trips
Improved customer experience,
increased ridership and farebox
recovery
Barriers to Implementation
Customer opposition, regional
inter-agency integration
N/A Software performance issues
Regional inter-agency integration
Regional inter-agency integration
Elimination of all cash payment on
buses
Agency Study of Un(der)banked
Completed?
Ventra Fare Equity Analysis
N/A N/A 2003 Rider Demographic Study
N/A 2011 Study of All-Cash Payment on
Buses
Means of Accommodating
Un(der)banked Riders
Branded prepaid debit cards, cash
payment on buses
Cash payment still accepted at
commuter rail stations
Branded prepaid debit cards, cash
payment on buses
Fare discounts for low-income riders,
all Clipper fare media still accept
cash payment
Fare discounts for low-income riders
Expansion of retail network of
Oyster card reload/purchase locations
Other Notable Features
First large-scale open payment
system in the U.S., launched in 2013
Partnership with private sector firm
Masabi
Open payment system is in “pre-
pilot”, launch date TBD
Considering open payment system
Considering open payment system
Launched open payment in 2013
Table 22: Selected Case Studies of New Fare Payment Systems
MTC is the regional metropolitan planning organization responsible for implementing Clipper Card, the regional transit smartcard. Individual modes operated include BART (Heavy Rail), SF Muni (Light Rail, Urban Bus), and CalTrain (Commuter Rail), etc.King County Metro is the largest transit agency in the Seattle metropolitan area and is responsible for managing ORCA, the regional transit smartcard. KC Metro runs Urban Bus services. Other participating agencies include Sound Transit (Light Rail, Commuter Rail) and Community Transit (Suburban Bus).

41 Privatizing the Metro Card | David Perlmutter | May 2015
did perform significant worldwide due diligence prior to implementation. The primary means of ensuring a successful Oyster Card launch was the implementation of a new fare policy, which encouraged the use of Oyster by creating a fares differential between Pay As You Go fares on Oyster and legacy magnetic stripe tickets20.
Description and Benefits of New Fare Payment System
The Oyster Card project was financed with a public/private consortium, known in the U.K. as a Private Finance Initiative. In the 1990s, this was a common method of enabling public sector investment by getting private sector resources to invest upfront with the benefits realized over a longer timeframe. The private finance initiative (PFI) is a procurement method that uses private sector capacity and public resources in order to deliver public sector infrastructure and/or services according to a specification defined by the public sector. Oyster Card operations today are maintained by Cubic Corporation, although the program is still managed by Transport for London. Oyster Card has enabled Transport for London to achieve faster passenger throughput at stations, more seamless intermodal transfers, and more complex pricing schemes that vary according to trip distance, time of day and travel mode. In addition, the widespread market penetration of Oyster Card (greater than 80% as of 2012) enabled Transport for London to eliminate cash payment on buses in the summer of 2014. Bus passengers must now pay with a contactless bank card or the Oyster Card, which can be purchased with cash at any Tube station as well as many retail locations. The main savings were through the costs of cash fare collection. This had to be balanced against a loss of revenue since cash bus fares were higher (£2.40 compared with £1.50 for Oyster and contactless), although with the vast majority of the ridership using contactless or Oyster this ended up being a net gain for TfL. In addition to Oyster Card, Transport for London also began accepting fare payment via contactless bank cards in 2012. TfL’s fare payment system is therefore considered open payment, in that both Oyster Card and other contactless cards are accepted at all fare readers, which account for 14% of all TfL transactions in 201421.
Barriers to ImplementationTransport for London faced significant challenges
in the elimination of cash payment on buses in 2014. While only 1% of fare transactions were paid in cash 20 As of January 2015, single-ride cash tickets in Central London for the Tube cost £4.80, compared to just £2.30 for Oyster pay-ments (Transport for London, 2015).21 Andrew Anderson, Personal Interview.
by late 201322, the phasing out of cash payment presented equity challenges that required further study. A rider survey of passengers paying all cash for buses revealed that 89% of these passengers had bank accounts, and 57% had Oyster Cards (Transport for London, 2011, 8). The primary motivations for paying all cash, as opposed to the faster option of Oyster, were forgetting to carry their Oyster Card, forgetting to reload their account balance and non-residence in London. Less than one percent of frequent cash riders cited not having a bank account as their reason for paying in cash (ibid, 15). Ensuring a ubiquitous network of retail locations for Oyster Card purchases and reloading, as well as proactive consumer education well in advance of the implementation of cashless bus fare payment, were instrumental to the program’s success among un(der)banked and cash-paying riders. In addition, TfL implemented a fare policy known as “contactless acceptance,” where fare readers on buses would accept an Oyster payment even if the rider’s balance was less than the full fare of £1.50, provided the balance is greater than zero (£0.00) (Transport for London, 2015). This policy was based on the cashless bus rider surveys, which showed that many cash fares came from people who did not have enough money on their Oyster Cards to use them. This “last bus home” policy enables low-income riders to take one last bus journey within a twelve-hour window, after which they must top off their Oyster balance before riding again.
Means of Accommodating Un(der)banked Transit Riders
Part of the TfL contract with Cubic Corporation included the expansion and management of a retail network to support Oyster Card facilities. Because TfL’s Tube stations are not evenly spread throughout London, greater effort was made to plug these gaps using Oyster Ticket Stops . TfL set rules preventing agents (mostly local convenience stores) from being too close to each other or to one of our own managed ticket offices, and a contract managing the agent network has targets for each local area as to how many agents are deemed necessary in each neighborhood. The contractor is responsible for determining suitability, and they way in which TfL collects payment (by direct debit) means that the risks of non-payment are low. This contract helps to ensure that TfL’s network of retail Ticket Stops are widespread, so that un(der)banked riders who wish to pay cash top off of their balances may do so easily. For equity reasons, it is expected that TfL will continue to accept Oyster Cards (and its network of fare machines that accept cash payment) even if the agency outsources their production to a third party.22 Andrew Anderson, Personal Interview.

42 Privatizing the Metro Card | David Perlmutter | May 2015
Generally, fare discounts – for students, senior citizens, the disabled, and the unemployed – are at the discretion of London’s Mayor and not TfL23. Therefore Oyster has been a means of delivering the fare discount, rather than discounts being enabled because of Oyster. What Oyster has enabled is some control over fraud in discounted fares, by placing the photo ID on the discounted Oyster card to make it easier to identify that the holder is entitled to use the discount.
Philadelphia, Pennsylvania
Current Fare Collection Methods and Rationale to Change
The Southeastern Pennsylvania Transportation Authority (SEPTA) currently operates a fare collection system consisting of barriers for heavy rail and pay-on-board for light rail, streetcars and buses. These fares currently can be paid with cash, magnetic stripe fare cards, or tokens. For commuter rail, SEPTA operates a zone-based fare system and has conductors validate paper tickets sold at station vending machines. Fares can be purchased as single-ride tickets or daily, weekly, and monthly passes. SEPTA’s motivations for adopting a new, open-loop fare payment system were two-fold: first, to reduce the operations costs of supplying and maintaining its aging legacy fare payment system; second, to share with card companies – Xerox, the transaction processor, and Ready Credit, the prepaid debit card manager – in the revenues from interchange fees levied on prepaid card retail transactions. SEPTA, like New York MTA and New Jersey Transit, is considered one of the few major urban transit agencies to have never implemented a closed-loop, transit-issued contactless smartcard, making the technological transition to open payment all the more challenging.
Description and Benefits of New Fare Payment System
SEPTA’s new fare payment system, “Key,” will combine two payment functions into a single smart card: a closed-loop, transit-only stored value card valid only for SEPTA purchases and an open-loop prepaid debit card that can be used for transit or non-transit, GPR transactions. Technologically, Key will be similar to Chicago’s Ventra or Utah Transit Authority’s open payment system. Key will be available for purchase online, at SEPTA stations, or at one of 1,500 retail establishments located in SEPTA service corridors. Users of the prepaid card for retail purchases will need to register their cards online or 23 Andrew Anderson, Personal Interview.
at a SEPTA Customer Service location to activate the retail purse, a process that requires a Social Security number24. No such requirement exists for the transit-only function of Key, which can be used immediately after purchasing. However, customers must register the prepaid cards online or at SEPTA customer service locations (and activate the retail function) in order to take advantage of benefits such as transit balance protection in the event the card is lost or stolen.
Barriers to ImplementationSEPTA indicated that the most significant barrier
to implementation of Key was the education of passengers – particularly un(der)banked passengers – on prepaid debit cards in general as well as in the context of transit purchases. The agency recognized the difficulties Chicago Transit Authority’s Ventra program had in managing customer satisfaction during its initial rollout. SEPTA is marketing Key on a new agency website as “The All-in-One Card,” with a user experience directing passengers to choose whether to use Key exclusively for transit transactions or to activate the card’s retail functionality. A similar user experience is planned for SEPTA station fare machines. At both SEPTA stations and retail locations, cash payment will be accepted to reload either transit or GPR value25.
Consumer acceptance of Key’s prepaid debit cards will be critical for the success of the program given that other commonly used prepaid debit cards – EBT cards, university ID cards, and commuter benefits cards – have not yet adopted the contactless technology standard, ISO 14443. These cards, therefore, would not be able to communicate with the SEPTA card readers. Further inter-governmental coordination will be necessary for these payment methods to be able to be integrated into the Key open payment system.
Means of Accommodating Un(der)banked Transit Riders
For un(der)banked riders, SEPTA’s Key will issue reloadable prepaid debit cards that include two payment functions: one exclusively for transit purchases with no activation or additional fees required, and one that allows non-transit, retail purchases outside of SEPTA facilities. Key’s prepaid debit cards can be reloaded using cash at any of 1,500 retail locations, SEPTA stations, or SEPTA customer service locations. Underbanked 24 The SEPTA Key personalized prepaid debit card has a prepay-ment fee of $4.95 if the card is purchased at a SEPTA station or retail location. There is no prepayment fee for cards ordered online or at a SEPTA customer service office.25 Payment industry regulations prevent passengers from reloading the GPR accounts of prepaid debit cards using a credit card. However, the transit account of Key will be able to be re-loaded using credit or debit cards.

43 Privatizing the Metro Card | David Perlmutter | May 2015
passengers who already use other non-transit prepaid debit cards may also reload their transit balances online using these accounts. SEPTA Key’s GPR prepaid debit cards can also be linked to payroll direct deposit. This will enable passengers using payroll direct deposit to enjoy one of the primary benefits of mainstream financial bank accounts without encountering the obstacles these accounts may present to low-income consumers.
One of the most significant changes expected with Key is the rapid expansion of the network of retail locations where SEPTA fare products are sold. Currently about 300 retail locations, mostly in central Philadelphia, sell legacy SEPTA magnetic stripe fare cards and tokens. Under the contract with Xerox and Ready Credit, SEPTA is required to expand this network to 1,500 retailers regionally. All stores must be located within one-quarter mile of bus stops and one-half mile of rail stations, reflecting the well-established thresholds of walkability for these modes. Many of these retail locations will leverage existing relationships with money transfer companies such as MoneyGram or Green Dot to facilitate reload transactions on both transit and GPR accounts. It is eventually anticipated that many of these companies may issue mobile payment applications linked to the prepaid debit cards of un(der)banked consumers and therefore enable transit mobile payment for the un(der)banked. However, prepaid card management companies would be responsible for any mobile application, and this matter is considered outside the purview of transit agencies’ decision-making authority.
San Francisco Bay Area, CaliforniaCurrent Fare Collection Methods and Rationale to Change
The Metropolitan Transportation Commission (MTC) is the regional Metropolitan Planning Organization (MPO) responsible for contactless smartcard implementation in the San Francisco Bay Area. MTC oversees implementation across a highly fragmented transit landscape of 38 transit agencies between four counties. Of the 38 agencies under its jurisdiction, 26 have adopted the regional closed-loop smartcard, Clipper26. Currently, Clipper is the preferred payment method among this group of agencies spanning nearly every public transit mode (heavy rail, commuter rail, light rail, streetcar, buses and ferries. Each of these modes, however, continues to operate legacy fare payment systems such as 26 Derek Toups, Personal Interview.
paper or magnetic stripe tickets. According to MTC, 95% of service hours in the region accept Clipper. Prior to Clipper, MTC oversaw an earlier closed-loop smartcard called TransLink, which struggled to move beyond the pilot phase. MTC partnered with the Cubic Corporation in a Design/Build/Operate/Maintain contract for both TransLink and Clipper. TransLink was rebranded in 2009 as Clipper as the imperative to implement contactless fare payment became stronger. The primary motivations to implement Clipper were to promote more seamless intermodal transfers, reduce operations costs from cash handling and reduce bus dwell times. As of 2015, MTC is considering a transition to open payment technology through updated contract with Cubic. Because the technology used in both closed-loop and open-loop smartcard systems is similar, most of the transition would be in the back-end transaction processing standards. The main motivation for the transition from closed-loop to open payment is to further reduce the operating expense inherent in a closed-loop proprietary card.
Description and Benefits of New Fare Payment System
Clipper uses a series of indicators to evaluate its performance such as: market penetration relative to other fare media, number of fare transactions (around 20 million per month), volume of revenue (about $40 million per month) and call center customer service metrics . As Clipper considers an eventual transition to open payment, MTC may opt to distribute Clipper-branded stored value cards managed by a private sector vendor. In this way, MTC can pass a larger share of the operating expense of fare collection to third parties and spend more on the provision of transit service. Especially attractive is the much larger retail network possible under such a scenario; with transit fare cards sold in retail outlets by private vendors the same way store-branded gift cards are today, the network of Clipper purchase and reload points may grow ten-fold from its current 400 locations27.
Barriers to Implementation
Coordination across numerous transit agencies with diverse coverage areas, passenger demographics, vehicle fleets and operations was the most significant barrier to the implementation Clipper Card, and this is likely to be the case for any open payment system as well. Fare coordination between agencies has been especially difficult. When riders transfer from one transit agency to another in a linked trip, the main point of negotiation was how and when to compensate 27 Derek Toups, Personal Interview.

44 Privatizing the Metro Card | David Perlmutter | May 2015
agencies for the installation, maintenance and management of Clipper infrastructure. During the initial rollout of Clipper in the late-2000’s, MTC was responsible for funding these expenses (through State and federal grants); today they are largely the responsibility of the affected agencies once the fare infrastructure is operational28.
Means of Accommodating Un(der)banked Transit Riders
MTC is cognizant of the needs of its large contingent of un(der)banked riders and employs a large network of retail locations (400 outlets) where riders can reload their Clipper balances or buy new Clipper passes with cash payment. This is especially imperative for bus riders who lack access to the traditional fare vending machines found in heavy rail (BART) and light rail stations (Muni). MTC is currently investigating an open payment contract with Cubic in which Clipper fare cards would be sold as closed-loop stored value cards, a solution designed to dramatically increase the retail availability of Clipper fare media. These stored value cards would likely have less complicated terms of use and fee structures than prepaid debit cards. However, the Clipper system as a whole would be considered open payment in that any contactless card – a Clipper-branded stored value card, contactless bank card or prepaid debit card may be used to pay for transit. Recognizing the implementation issues Chicago faced, MTC expects that the transition from the current closed-loop Clipper to open payment would occur over a period of between one and three years, with both systems running in parallel during this time.
Seattle, Washington
Current Fare Collection Methods and Rationale to Change
King County Metro, the regional bus service operator of the Seattle metropolitan area, is the manager of the ORCA (“One Regional Card for All”) Card, a closed-loop contactless smartcard. ORCA began implementation in 2009 after a pilot program, Puget Pass. Legacy fare payment methods include cash payment and proof-of-payment paper tickets and are still accepted on all transit modes (buses, light rail, streetcar, commuter rail and ferries). Today passengers can purchase ORCA Cards at bus stations in Downtown Seattle, light rail 28 Some smaller agencies that are still transitioning between legacy and Clipper fare payment systems may still receive MTC funding through the federal Congestion Mitigation and Air Qual-ity program (CMAQ).
stations, online, at Metro Customer Service offices or through a small network of retail locations (mostly grocery stores). With ORCA implementation largely complete, having incorporated all transit modes and most regional transit agencies with a market penetration of over 60%29, King County Metro is now considering a transition from its closed-loop ORCA Card to an open payment system. However, no detailed plans on implementation for open payment were available.
Barriers to Implementation
Regional inter-agency coordination was a major challenge of ORCA implementation. How to accommodate passengers’ linked trips from an ORCA-accepting agency to a non-ORCA agency was a point of dispute between the large pilot agencies (King County Metro and Sound Transit) and smaller suburban and rural transit operators. That is to say, how would the agency that has yet to install ORCA fare card readers to be compensated if a passenger paid for their original trip with ORCA? One transit agency serving rural Thurston County, Intercity Transit, suspended its ORCA payment in 2012 because they. Eventually agencies agreed on a general policy that the ORCA transit agency would compensate 70-80% of the trip’s value if the second agency did not have ORCA fare readers. With nearly all regional transit agencies operating ORCA today, however, the issue of fare reciprocity has receded from agency discussion.
Means of Accommodating Un(der)banked Transit Riders
All cash payment options on ORCA fare machines at stations, as well as legacy fare payment media (proof-of-payment paper tickets) have been preserved. There is no identifiable conflict or inequity with respect to ORCA’s un(der)banked riders given that it is a closed-loop, proprietary system that continues to accept cash payments. However, King County Metro is unique among American transit agencies in its recent widespread adoption of equity-driven social fares for low-income riders. In March of 2015, King County Metro began a reduced-fare program called “ORCA Lift,” where low-income riders can register with local health clinics or nonprofits to receive a discounted fare smartcard. This network of nonprofits and clinics was assembled from the rollout of the Affordable Care Act and is considered unique among transit agencies for its cross-industry partnership. Households earning up to 200 percent of the federal poverty level ($47,700 for a family of four) may apply30. Applicants who 29 Chuck Sawyer, Personal Interview.30 Full conditions for ORCA Lift qualification are located here
45 Privatizing the Metro Card | David Perlmutter | May 2015
can verify their participation in any means-tested benefits program such as food stamps or Medicaid immediately qualify. King County Metro anticipates that ORCA Lift will eventually reach up to 100,000 low-income riders, making it by far the nation’s most comprehensive low-income fare discount. ORCA Lift is expected to cost between $7 and $9 million per year in foregone revenue and administration costs (Johnson, 2015). Because ORCA is a regional, inter-agency smartcard, ORCA Lift also allows low-income riders to use Sound Transit light rail, commuter rail, and express bus service.
Analysis and Discussion
Survey Results As a general limitation of this study, it cannot be overstated that few conclusive, statistically significant conclusions can be drawn from a survey with such a small sample size (n=51). This limitation stems from insufficient funds and time necessary to collect a truly representative sample, which would have required about 600 respondents and $3,600 in funding for survey compensation incentives. However, in the interest of investigating an under-explored area of research for a vulnerable group where data collection is time-consuming and expensive, this study employed Pearson’s Chi Square Test to see if any statistically significant relationships could be established. The Pearson’s Chi Square Test was chosen as an analytical tool because both the dependent and independent variables explored in the survey questionnaire were categorical. The independent variable explored in the survey was banked or un(der)banked status. The dependent variables included: age; gender; trip purpose; trip frequency; trip length; number of transfers; mode choice; method of payment; fare discounts; Metro Card point of purchase; Metro Card type; household income; and smartphone ownership. The results of the Pearson’s Chi Square Test are given in Appendix 3.
As expected with a relatively small sample size, the Chi Square revealed few statistically significant relationships between independent and dependent variables. The only statistically significant relationships were between banked / un(der)banked status and two dependent variables: number of transfers and method of payment. The relationship between method of payment and un(der)banked status is expressed by the p-value of 0.008, which indicates a less than one percent likelihood that the correlation exists purely by chance. However, this relationship is not meaningful in that a rider’s method of payment is intrinsically linked to the types of financial services they use and

46 Privatizing the Metro Card | David Perlmutter | May 2015
therefore to their un(der)banked or banked status. The relationship between number of transfers and un(der)banked status is more meaningful, however. With a p-value of 0.039, this relationship meets the significance threshold of 0.05 and indicates a less than four percent chance this travel behavior occurred at random. All other relationships tested failed to meet the significance threshold and must therefore be treated with caution. This is not to preclude the possibility of the relationship being significant, only that a larger sample size is needed to confirm it. For purposes of discussion, this study includes descriptive statistics to indicate possible relationships that may be confirmed with larger sample sizes. Preliminary conclusions concerning the results of this study’s original hypotheses are included below.
Hypothesis 1: Un(der)banked individuals are likely to have longer commutes and a larger average number of transfers than banked individuals.
This hypothesis must be at least partially rejected given that a statistically significant correlation was found between banked individuals and larger numbers of transfers. Surprisingly, un(der)banked respondents tended to have a lower number of transfers than banked respondents. Sampling bias may have played a role in this result: because surveys were only completed on two weekdays and one Saturday, it is possible that weekend travel behavior was over-represented in the sample. Another possibility is that the sample is biased by the survey locations: both Fordham Road and Myrtle-Wyckoff are relatively well served by public transit. Studies citing the long commutes of low-income New Yorkers typically cite the more peripheral areas of the city such as outer Queens (where bus and subway access are much more sparse) as being more emblematic of this trend (Center for an Urban Future, 2011, 13). Among respondents sampled, 60% of those with commutes greater than sixty minutes were un(der)banked, as shown in Table 13. However, this does not represent meaningful deviation from the sample as a whole, which was 63% un(der)banked. Therefore the hypothesis that un(der)banked individuals are more likely to take trips longer than sixty minutes must also be rejected.
Hypothesis 2: Unbanked people are more likely to take multiple transit modes than the banked population.
Due to the small sample size, no statistically significant relationship could be established between un(der)banked status and travel mode choice. Table 16 indicates a slight preference
among un(der)banked respondents for subway travel. 71% of exclusive subway riders were un(der)banked, compared to 63% of the sample as a whole. Meanwhile, 56% of multi-modal respondents were un(der)banked, indicating a slight preference against multi-modal travel among un(der)banked riders. Therefore, this hypothesis should be rejected.
Hypothesis 3: Unbanked people are less likely to receive assistance in paying for Metro Card.
Very few respondents (n=5) answered that they received a discounted Metro Card. No statistically significant relationship between this variable and un(der)banked status could be established. A much larger sample size will be needed to confirm or reject this hypothesis.
Hypothesis 4: Unbanked people are more likely to buy Weekly Unlimited Metro Cards than other types.
Given the small sample size, no statistically significant relationship could be established between un(der)banked status and type of Metro Card purchased. Table 18 indicates that a very weak preference may exist toward Pay-As-You-Go and Single Ride Metro Cards and against Weekly and Unlimited Metro Cards. However, due to the small sample size these conclusions must be confirmed with a much larger dataset.
Hypothesis 5: Un(der)banked individuals are equally likely to own smartphones as banked individuals.
A substantial majority of un(der)banked respondents did own smartphones (69%), compared to 84% of banked respondents. Likewise, there was no statistical relationship found between un(der)banked status and smartphone ownership in the Pearson’s Chi Square Test (p-value of 0.227). Therefore we may accept this hypothesis and can conclude that un(der)banked and banked respondents are equally likely to own smartphones, apart from the influence of other explanatory variables.
Case Study ResultsTravel behavior and transportation equity of the un(der)banked is an emerging topic of research with a relatively sparse academic literature to support it. Transit agencies themselves have devoted even less attention to the topic; the implementation of open-loop fare payment systems is what has prompted most research on the intersection of fare payment and access

47 Privatizing the Metro Card | David Perlmutter | May 2015
to financial services. Given that just two major American transit agencies have implemented open payment systems31, it is unsurprising that it is generally uncommon for transit agencies to perform their own assessments of un(der)banked communities or survey their riders about their access to financial services. The only three agencies known to have done so are the Chicago Transit Authority (Nancy Whelan Consulting, 2013; Brakewood and Kocur, 2012), San Francisco Metropolitan Transportation Commision (Smartcard Alliance Transportation Council, 2008, 8), and the Southwest Ohio Regional Transit Authority (Brakewood and Kocur, 2012). Of these agencies, only the Chicago Transit Authority’s analysis is publicly available. This analysis stopped short of evaluating the impacts of non-transit prepaid card transactions among un(der)banked riders as part of its Fare System Equity Analysis. Transport for London served un(der)banked riders by continuing to operate a closed-loop Oyster Card in addition to an open payment system. In addition, the U.K.’s estimated two million un(der)banked individuals appear to enjoy more equitable access to financial services through national regulations on the consumer finance sector32. A national partnership between the U.K. Post Office and JPMorgan created Universal Bank Services Scheme in 2003, a low-cost bank account serving 4.5 million mostly low-income people who are able to collect government benefits electronically (“Retail banking,” 2006). Therefore, there are relatively fewer un(der)banked individuals for London transit agencies to accommodate. Transport for London performed an equity analysis of transit riders paying cash for bus fare during its transition to a cashless bus fare payment system and found that cash-paying riders could be accommodated through the closed-loop smartcard Oyster which is supported by an extensive retail network (Transport for London, 2011).
In order to avoid inequitable outcomes from prepaid card implementation as well as potential Title VI litigation, agencies must significantly expand the scope of both their data collection and equity analysis efforts. Travel behavior surveys like the methodology employed in this study, which capture riders’ use of transit as well as access to financial services, should become the norm and employed at a statistically significant scale among any major transit agency considering implementing an open payment system.
31 These agencies are Utah Transit Authority and Chicago Transit Authority.32 Andrew Anderson, Personal Interview.
Open payment systems are becoming more prevalent across major American transit agencies. Washington, D.C.’s WMATA and Philadelphia’s SEPTA33 are both in the process of implementing open payment systems (Washington Metropolitan Area Transportation Authority, 2011), while King County Metro34 and the Bay Area’s Metropolitan Transportation Commission35 are considering it as the next step beyond their existing closed-loop smartcards. The high upfront capital cost of implementation is generally the biggest barriers to implementation. Smaller transit agencies cannot generally afford open payment technology due to their generally lower ridership and smaller operating budgets. The primary rationale for transit agencies implementing open payment is two-fold: first, the long-term reduction in operating costs that would come with removal of cash-handling equipment and maintenance of a fare card supply chain; second, the opportunity to revenue-share with the private sector in non-transit transactions that are generated through agency-issued prepaid cards. Other motivations less frequently mentioned were reduced bus dwell times and improved passenger throughput at stations. Finally, and not insignificantly, is the benefit of providing an improved customer experience, which manifests in more seamless multi-modal transfers, faster passenger boarding, higher ridership and higher farebox revenue. Open payment also enables agencies to eventually remove cash handling equipment on buses, a tremendous boon for bus travel time and performance.
Transit-issued prepaid debit cards are not necessarily an inequitable solution for the un(der)banked provided that they are used only for transit transactions. It is worth mentioning that in any open payment system, transit riders are in no way required to use their prepaid cards for non-transit purposes. Using Ventra, for instance, exclusively as a transit fare card would negate most of the fees that are levied against consumers. Not enough data is available from the Chicago system about consumer spending patterns on Ventra prepaid cards on transit vs. non-transit transactions. Non-transit spending is considered highly sensitive private information that is not readily available to researchers. Future internal research from credit card networks may be needed to clarify the balance between transit and non-transit spending on open-loop transit prepaid cards.
It follows that, for un(der)banked communities, consumer education and outreach about prepaid cards will be critical in the acceptance of any open payment system. For some un(der)banked consumers, they may ultimately be a means of encouraging greater retail spending and even their
33 Jerry Kane, Personal Interview.34 Chuck Sawyer, Personal Interview.35 Derek Toups, Personal Interview.

48 Privatizing the Metro Card | David Perlmutter | May 2015
introduction to the mainstream consumer finance sector, which presents ethical challenges to transit agencies: do the transit agencies issue prepaid cards and leave riders to figure out their terms, fees and limitations on their own, while sharing with the card networks in the lucrative interchange fees levied on non-transit transactions? Or do the transit agencies take a more proactive approach in educating their riders on what might be their first exposure to a mainstream financial product? So far, the Chicago Transit Authority has taken the former approach, though of course subsequent implementations at other agencies may have different outcomes. Due to the nature of public-private partnerships, however, it is generally not in the best interests of transit agencies to impose overly strict or onerous contractual terms on the private sector. Private sector companies responsible for operating and maintaining contactless smartcard technologies provide a valuable and coveted service that transit agencies risk losing if they find the contracts unfavorable. Because of this inherent conflict of interest, transit agencies may not be the ideal stakeholder to promote equity for un(der)banked riders in an open payment system beyond the bare minimum requirements of Title VI. Which New York City stakeholders should safeguard equity of contactless smartcard implementation is a matter warranting further discussion.
While currently prepaid cards represent a preferred alternative for agencies to accommodate un(der)banked riders under an open payment system, this may not be the case for much longer. Growing evidence suggests that prepaid debit cards may, in fact, be a stopgap measure for the un(der)banked in an open payment system until NFC and mobile payment infrastructure matures and becomes more ubiquitous. As Table 20 suggests, smartphones are more prevalent than bank accounts in low-income, un(der)banked communities. The emergence of Apple Pay, Google Wallet, and other app-based mobile payment systems for commuter rail systems is promising. Among American agencies, the Massachusetts Bay Transportation Authority was a pioneer in enabling a mobile payment system on its commuter railroad network (Brakewood et al, 2014). Although the market penetration of this technology on MBTA commuter rail is not yet known, smartphones and consumer mobile payments among commuter rail passengers are highly prevalent. 76% of passengers surveyed owned a smartphone, while 50% had made a mobile payment at other merchants (ibid, 15). Among fare policy experts, commuter rail is seen as the early adopter of mobile transit payments because – unlike a rapid transit system – conductors typically take tickets manually, and the need to move high volumes of passengers through fare gates
quickly is less pressing36. The potential operations cost savings in reducing cash handling operations and streamlining payments are very appealing to transit agencies: Portland’s Tri-Met recently launched a mobile payment application across all of its modes37, while New York MTA’s Metro-North Railroad recently issued an RFP for mobile payment on the nation’s second largest commuter rail system (Anders et al, 2014, 12). SEPTA also expects mobile payment to eventually supplant its Key smartcard among overall transit fare payment transactions38.
One shortcoming that mobile payment technology must overcome, however, is the speed necessary to complete a payment transaction. Gated, urban transit systems like New York City Transit require transaction processing speeds of around 500 milliseconds to achieve desirable passenger throughput and avoid overcrowding at the turnstile gates . As of 2015, mobile payment technology has not yet achieved this transaction processing speed in the United States beyond a handful of pilot demonstrations. As soon as the NFC technology matures and achieves this speed, however, smartphone apps may become transit agencies’ preferred fare payment system.
Although mobile payment technology using NFC in the United States typically requires access to a mainstream bank account (as in the cases of Apple Pay or Google Wallet), prepaid debit card companies are increasingly adopting mobile applications. Mobile payment technology linked to prepaid debit accounts is already widespread in countries of the developing world, where mainstream financial participation is much lower than in the United States. Mozido, a Texas-based mobile payment manager, recently announced a partnership with the City of Oakland’s municipal ID card, which also doubles as a GPR prepaid debit card. Although no mobile application has yet emerged that can be used by un(der)banked consumers, it is easy imagine a public-private partnership between prepaid debit card companies and transit agencies enabling un(der)banked riders to pay mobile transit fares using a prepaid card company’s mobile application.
36 Josh Robin, Personal Interview.37 Portland Tri-Met modes do not have fare gates to control entry to the system, instead relying on proof-of-payment (Anders et al, 2014, 12). Comparisons between Tri-Met and larger, urban transit agencies like the MTA are not equivalent in this regard.38 Jerry Kane, Personal Interview.

49 Privatizing the Metro Card | David Perlmutter | May 2015
Conclusions and Recommendations
Mitigating or resolving any potential inequitable outcomes of a transit open payment system in New York City will require addressing the intersecting issues of access to financial services and transportation equity among the un(der)banked, a highly vulnerable group. A truly equitable fare open-loop fare payment system would involve an inter-governmental partnership between transit agencies and city governments aimed at achieving three goals: ensuring a ubiquitous network of retail locations to purchase and reload transit prepaid cards, especially in low-income neighborhoods; providing an outreach campaign for un(der)banked on how to maximize the benefits of open payment while avoiding the fees associated with prepaid cards; a comprehensive citywide consumer education program; and expanded regulatory capacity over the consumer finance sector to ensure un(der)banked communities have greater access to mainstream bank accounts and at more favorable terms.
Based on the results of the surveys and expert interviews performed, this investigation concludes that this task is likely too large and inter-disciplinary in scope for any single transit agency to resolve alone. Although it may seem self-evident to transit riders, transit agencies’ general core competency is their ability to provide effective transit service for passengers, and not necessarily to provide social services such as reduced-fare programs or promote access to consumer financial products. While federal equity mandates such as Title VI require transit agencies to serve protected groups such as low-income or unbanked passengers equitably, this does not necessarily suggest that the transit agencies themselves must be the stakeholders responsible for designing, funding and implementing equity programs. The results of this investigation’s surveys and interviews indicate that there is a strong need for inter-governmental partnerships between various stakeholders such as the MTA, NYMTC, and City, State and federal agencies. The MTA itself may, in fact, play a smaller supporting role in the implementation of equity measures supporting an open payment system. For instance, while the MTA
may be responsible for implementing contactless fare payment infrastructure at its stations and assets, fare policy accommodations for the un(der)banked could be managed by City agencies, while federal legislative action may be required to promote equity for the un(der)banked in the mainstream financial and AFS sectors. Accordingly, a series of policy recommendations for each of the relevant stakeholders in the New York metropolitan area is proposed below:
Role of New York City (and Other Municipalities)
Much of what is known about the un(der)banked in New York City comes from groundbreaking research of the Department of Consumer Affairs, and particularly its Office of Financial Empowerment. Their Citywide Financial Services Study contains the most accurate and precise data on un(der)banked communities available. The Department of Consumer Affairs (DCA) must expand these data collection efforts and ensure that un(der)banked estimates are prepared regularly, either annually or biennially. In recognition of the fact that inequality affects suburban areas as well as New York City, suburban jurisdictions such as counties or regional MPO’s should replicate DCA’s methodology and collect data on their own un(der)banked populations. Ultimately, New York municipalities must partner together on this data collection so that a regional, frequently updated portrait of residents’ access to financial services can be established. While this reinforces the importance of regional governance more broadly, and its relative absence in the New York metropolitan area, the un(der)banked issue deserves special priority because it represents growing socioeconomic inequalities that could ultimately derail local economic growth if not addressed. Collecting data to diagnose communities’ access to financial services is the vital first step needed to promote financial empowerment and equity.

50 Privatizing the Metro Card | David Perlmutter | May 2015
Since 2008, DCA has launched an extensive network of neighborhood Financial Empowerment Centers in 30 low-income communities across New York City to promote free financial counseling and low-cost financial services products. This is a commendable program that could be easily leveraged in preparation for a transit open payment system, where low-income transit riders could be proactively coached about upcoming changes to the Metro Card. This effort could include expanding access to transit-issued stored value cards or low-fee GPR prepaid cards. DCA research shows that such outreach is vital, especially with respect to prepaid cards. Just 10% of recent immigrants in the NYC Department of Consumer Affairs’ Immigrant Financial Services Survey had used prepaid cards previously, compared to nearly 70% who had used money transfer services (NYC Department of Consumer Affairs, 2013, 22). The City should also provide additional subsidy to expand the network of community development credit unions that are known to provide more affordable, culturally appropriate financial services to lower-income communities. Based on Chicago Transit Authority’s implementation of open payment, it is clear that proactive consumer education about prepaid cards and other low-cost financial services is vital for an open payment to provide equity to the un(der)banked. DCA is ideally situated to meet this need.
As part of this proactive consumer finance education campaign for un(der)banked riders, DCA should consider additional consumer protections aimed specifically at prepaid debit card products. These might entail emailing prepaid card customers and alerting them to check balances online or to use retail cash back instead of ATM withdrawals in order to avoid unnecessary fees. Los Angeles’ Ready Credit pilot program was notable in pioneering this approach (Keitel, 2012, 22). To avoid the double-charging issue that Chicago transit riders faced with Ventra’s rollout, agencies should adopt a proactive advertising campaign on transit facilities. One example is Transport for London’s awareness campaign against “card clash,” in which riders were advised against carrying multiple contactless cards in the same purse or wallet to avoid having both cards be charged39. This campaign warns riders not to store multiple contactless cards in the same wallet when entering and exiting the system.
As mobile transit ticketing technology matures, agencies considering an open payment fare collection system should drive a hard bargain with its private sector partners to ensure equitable policy outcomes for un(der)banked transit riders. However, transit agencies themselves have little to no authority over financial industry regulations governing the terms and fees of consumer financial products. This 39 Candace Brakewood, Personal Interview
suggests that New York City must implement strong municipal regulations of the terms and conditions implemented with any prepaid debit card the MTA ultimately promotes. One Best Practice can be found in San Francisco’s CurrenC SF initiative. This municipal policy encourages businesses to adopt direct deposit for banked employees and payroll prepaid cards for the un(der)banked. Prepaid payroll cards under CurrenC SF must meet certain standards: no overdraft fees, no monthly or annual fees, at least one free bank withdrawal and one in-network ATM withdrawal each pay period, and one free phone call to customer service agent each month (Valenti and Heiss, 2013, 9). City agencies should also consider requiring prepaid card account terms of service to be printed in languages other than English, given the predominance of immigrant communities among the un(der)banked. Enacting similar initiatives at the City level would enable the MTA to avoid the inequitable outcome of passing burdensome prepaid card fees onto its most vulnerable riders.
Finally, City agencies such as DCA, the Human Resources Administration (HRA) and Department of Social Services (DSS) should investigate opportunities to promote equity for un(der)banked transit riders through a unique collaboration between mobile payment management companies, commuter benefit cards such as TransitChek and the recently launched municipal identification card, ID NYC. As shown through Figure 18, smartphones are often more prevalent in un(der)banked communities than bank accounts. This study’s surveys and interviews confirm that mobile phones are highly prevalent in nearly all communities, with a market penetration of between 75 and 90 percent. These data, and the ongoing work of mobile payment management companies like Masabi with transit agencies such as Boston’s MBTA Commuter rail and MTA’s Metro-North Railroad, indicate that the transit market is ripe to adopt mobile payment in a proof-of-payment fare collection environment such as express bus or commuter rail modes. However, mobile payment is not an equitable fare payment solution because this technology requires a link to a passenger’s bank account; to accommodate un(der)banked riders, the cash payment fare infrastructure must be preserved. Furthermore, until mobile payment can achieve reasonable transaction processing speeds it will be of limited value to gated transit systems such as New York City Transit’s subways and buses.
Meanwhile, the City’s Human Resources Administration has recently launched the municipal ID program, ID NYC. ID NYC offers another promising avenue to promote transportation equity for the un(der)banked. The card is accepted as sufficient identification to open a mainstream bank account, which may enable a significant portion

51 Privatizing the Metro Card | David Perlmutter | May 2015
of un(der)banked individuals to become banked. These residents are likely recent immigrants who lack sufficient U.S. credit history to get a mainstream bank account but have sufficient income to maintain a minimum balance. As a promotion to encourage adoption of ID NYC, the card also provides free annual memberships to local museums, as well as discounts on grocery purchases, health and fitness centers, and prescription drug benefits. ID NYC should extend the program further by coupling enrollment with a low-fee, transparent prepaid card as the City of Oakland has done. Coupling ID NYC with a prepaid debit card would enable undocumented or un(der)banked New Yorkers to more easily access City services such as healthcare, financial counseling and transit. If the City negotiates strongly, the prepaid debit card that accompanies ID NYC could also be accessible by a mobile application. This crucial step would expand mobile payment options to the un(der)banked on express buses and commuter rail and would relive transit agencies of the responsibility to design, build, operate and maintain such an application. Finally, the City should negotiate with the prepaid card manager to ensure the cards are contactless, enabling them to used seamlessly in an open payment system and reloadable at the transit agency’s contracted retail network.
In the interest of providing additional transportation equity to un(der)banked riders, City agencies such as DCA or HRA should follow the example of Seattle’s King Count Metro in launching a reduced-fares program for low-income riders. Low-income and un(der)banked riders in New York City today face a triple-bind of rising transit fares40, stagnant wages and a ballooning cost of living. Reduced transportation costs will improve access to jobs and economic opportunity for these communities. As shown in Figure 16, un(der)banked riders are more likely to buy Weekly Pass and “Pay As You Go” Metro Cards than the Monthly Unlimited Cards, even though the Monthly Unlimited Pass has a lower cost per ride. This is likely because of the high upfront cost of the Monthly Unlimited Pass compared to other fare payment alternatives. Implementing a reduced-fare program would be relatively straightforward given the network of enrollment locations already present for ID NYC. In addition to the handful of ID NYC registration offices, City agencies could partner with CUNY community colleges, NYC public libraries, NYCHA public housing offices or DCA’s Financial Empowerment Centers. Un(der)banked riders would register for both cards in tandem; having shown evidence of New York City residence and participation in a means-tested welfare program (such as Temporary Aid to Needy 40 With the MTA’s base fare increase expected in 2017, the agency will have raised transit fares five times in the past decade.
Families, Medicaid or “food stamps”), the riders would receive an annual, transit-issued contactless smartcard. The reduced-fare program could set transit fares at one-half of the general rate, as King County Metro has done, or provide a flexible sliding scale based on the applicant’s income.
One final opportunity for City agencies to become involved relates to the planned expansion of TransitChek41. TransitChek is an optional commuter benefits program in which transit benefits (up to $130 per month) are allocated in pre-tax dollars from employers to employees to encourage transit demand management. Benefits arrive in the form of a Visa prepaid debit card, which can be used for any transit or retail transaction. By 2016, all companies in New York City with more than 20 full-time employees will be required to offer TransitChek, due to the passage of the NYC Transit Ordinance. Both Seattle’s King Count Metro and Philadelphia’s SEPTA indicated that large, company-issued transit cards – such as those offered by universities or major corporations to students or employees - make up a significant portion of their ridership and are instrumental in the success of their contactless smartcard programs in providing a large pool of early adopters who become enrolled en masse. City agencies should negotiate with prepaid card companies like Visa to implement a contactless TransitChek benefits card to prepare for inter-operability with any future contactless smartcard fare payment system.
Role of MTAFollowing the lead of Transport for London, the
MTA should transfer some of its decision-making authority over social fare policy to some of the City agencies above that are better prepared to implement equitable fare solutions in low-income and un(der)banked communities. Measures such as reduced-fares for low-income riders are best handled through City agency administrative networks, such as those of the ID NYC and Financial Empowerment Centers, are better equipped to manage. For a significant operating cost savings, the MTA could outsource its existing administrative units responsible for the discounts for elderly and disabled riders to the DCA or HRA. Rather than filling the role of social services provider with respect to un(der)banked riders, the MTA should specialize in the procurement, installation and management of contactless fare payment technology while outsourcing the implementation of equity policies for un(der)banked riders to other agencies where possible. In this scenario, the MTA would merely implement equity-based fare discounts that are planned and managed by other agencies, while 41 Also known as “Wage Works”

52 Privatizing the Metro Card | David Perlmutter | May 2015
maintaining control of more traditional transit fare policies such as base fares, time of day-based pricing or distance or mode-based pricing.
That being said, the MTA will play a pivotal role in the contract negotiations for a contactless smartcard technology and/or mobile payment vendor/operator. The MTA must drive a hard bargain with its contractor candidates and ensure that the terms of the fare payment system contract do not unduly inconvenience or deprecate un(der)banked riders, especially those using open-loop prepaid cards for non-transit purchases. In the case of Chicago’s Ventra, it is clear that Chicago Transit Authority provided insufficient consumer protections for non-transit prepaid card transactions, evidenced by exorbitant fee structures and burdensome terms of use. If the MTA adopts open payment, the agency should perform extensive due diligence on the range of prepaid card products on the market and ensure that the prepaid cards meet established standards set by the Federal Reserve, FDIC and other regulatory bodies. However, it is likely that the MTA will need to partner with City and State agencies in the negotiations over the rollout of prepaid cards, since transit agencies have little to no authority to regulate the terms of consumer financial products.
One area where the MTA has considerable leverage, however, is the creation of a ubiquitous, easily accessible retail network of reloading/purchase stations where riders can continue to pay cash for Metro Card. The MTA already maintains such a network for the current Metro Card, but its operations must be enhanced and expanded. Proactive consumer-oriented advertising about nearby locations to pay cash for Metro Card is needed to raise rider awareness prior to any implementation of open payment. The creation of a mobile application displaying the locations of all retail locations selling MTA products is another means of achieving this objective. Finally, the MTA should partner with regional MPO’s such as NYMTC to gather additional data on financial services participation into standard annual customer travel surveys, especially within NYMTC’s Communities of Concern shown in Figure 4. Doing so will enable equity policies of other City agencies aimed at the un(der)banked to be reinforced with the most current data available.
Role of Regional MPO’s and States
Regional MPO’s like NYMTC and State Departments of Transportation should encourage fare policy coordination between various agencies such as New York City Transit, Port Authority Trans-
Hudson (PATH), New Jersey Transit, Westchester County’s Bee-Line Bus, Long Island’s Nice Bus, and Metro-North/Long Island Rail Road. This recommendation is based on the experience of the San Francisco Bay Area’s Metropolitan Transportation Commission, which was instrumental in the planning and management of Clipper Card across more than twenty distinct regional transit agencies. Although New York City Transit and the Metro Card service a large share of regional transit trips, advance coordination between agencies will go a long way towards promoting seamless intermodal transfers and linked transit trips. If the experience of King County Metro is any guide, the greatest barrier to regional fare integration may be inter-agency conflicts over fare payment reciprocity. That is to say, agencies must agree on how to compensate one another when the smartcard-enabled agency’s riders transfer to a non-smartcard-enabled agency’s service. In the experience of SEPTA, the latter agency would simply send an invoice to the former; how much the latter agency is owed, and for which rider and trip types to allow equity-based fare discounts such as reduced-fares for low-income riders. To avoid confusion especially for inter-state and cross-Hudson travel, regional fare policy integration would require State-level actors such as the Port Authority and State Departments of Transportation to participate in negotiations. The ultimate objective is what Seattle’s ORCA and San Francisco’s Clipper have already achieved: many transit agencies and modes continue to exist (each with their own legacy fare payment systems), but they all share a single preferred regional smartcard fare payment system.

53 Privatizing the Metro Card | David Perlmutter | May 2015
Role of the Federal Government
The primary role of the federal government in providing greater transportation equity for the un(der)banked will involve more regulation of prepaid cards’ fee structures, terms and conditions on a national scale. Federal agencies like the FDIC, Federal Reserve or the Department of Commerce may be relevant stakeholders in this process. A recent proposal by the Consumer Financial Protection Bureau (CFPB), established by the Dodd-Frank Act of 2010, would limit consumer liability in the event prepaid cards are lost or stolen, ensure that access to account balances is free and adhere to credit card protections is a credit card is offered in connection with a prepaid account. Further measures from the CFPB could ensure that terms and conditions are printed in languages other than English, calls to customer service are free, and limit additional fees added to ATM cash withdrawals. Additional federal regulation could also pass legislation to limit the worst excesses of the AFS industry, such as exorbitant interest rates and late fees, as well as provide more access to low-cost banking services through public institutions such as the Post Office. However, these measures are likely beyond the scope of any City agency or transit operator’s concern in implementing contactless smartcard fare payment technology.
Transit agencies face a series of challenging decisions as new fare payment systems become increasingly sophisticated and complex. While the benefits of open payment systems are numerous and appealing, transit agencies must ensure that fare payment technology does not provide a differential or substantially inferior experience for its un(der)banked riders, a highly transit-dependent group. The transit industry consensus among large, urban systems is increasingly coalescing around a hybrid open-loop smartcard product with dual functionality: a smartcard linked to a rider’s bank account, for the banked, or a GPR prepaid card for un(der)banked. This consensus on technological methods is compelling but leaves a great deal of room for agencies to negotiate, interpret and extend solutions to promote transportation equity for their riders.

54 Privatizing the Metro Card | David Perlmutter | May 2015
Bibliography
Academic SourcesBohn, S., & Pearlman, S. (2013). Ethnic concentration and bank use in immigrant communities.
Southern Economic Journal, 79(4), 864–885. doi:10.4284/0038-4038-2010.245
Brakewood, C., Rojas, F., Robin, J., Sion, J., & Jordan, S. (2014). Forecasting Mobile Ticketing Adoption on Commuter Rail. Journal of Public Transportation, 17(1). Retrieved from http://www.nctr.usf.edu/wp-content/uploads/2014/03/JPT17.1_Brakewood.pdf
Brakewood, C., & Kocur, G. (2012). Unbanked transit riders and open payment fare collection. Transportation Research Record: Journal of the Transportation Research Board, 2351, 133–141.
Carney, M. (2012, July 24). Bike-sharing and the unbanked: A study of the unbanked population in Chicago and best practices for their inclusion in bike-sharing. Masters Thesis; University of Illinois at Chicago, Chicago, IL.
Chatman, D., & Klein, N. (2009). Immigrants and travel demand in the United States: Implications for transportation policy and future research. Public Works Management & Policy, 13, 312–327. doi:10.1177/1087724X09334633
Grinstein-Weiss, M., Yeo, Y. H., Despard, M. R., Caslotti, A. M., & Zhan, M. (2010). Does prior banking experience matter? Differences of the banked and unbanked in individual development accounts. American Journal of Agricultural Economics, 31, 212–227. doi:10.1007/s10834-010-9184-5
Joassart-Marcelli, P., & Stephens, P. (2010). Immigrant banking and financial exclusion in Greater Boston. Journal of Economic Geography, 10, 883–912. doi:10.1093/jeg/lbp052
Opurum, C. (2012). Automated Fare Collection System and Urban Public Transportation. Bloomington, IN: Trafford.
Paez, A., Trepanier, M., & Morency, C. (2011). Geodemographic Analysis and the Identification of Potential Business Partnerships Enabled by Transit Smart Cards. Transportation Research Part A, 45, 640–652.
Pelletier, M.-P., Trepanier, M., & Morency, C. (2011). Smart Card Data Use in Public Transit: A Literature Review. Transportation Research Part C, 19(1), 557–568.
Pucher, J., & Renne, J. (2003). Socioeconomics of Urban Travel: Evidence from the 2001 NHTS. Transportation Quarterly, 57(3), 49–77.
Rhine, S., Greene, W., & Toussaint-Comeau, M. (2006). The importance of check-cashing businesses to the unbanked: racial/ethnic differences. The Review of Economics and Statistics, 88(1), 146–157.
Rice, L., & Swesnik, D. (2013). Discriminatory Effects of Credit Scoring on Communities of Color. Suffolk University Law Review, 46, 935.
Richardson, A., Ampt, E., & Meyburg, A. (n.d.). Survey Methods for Transport Planning. University of California at Santa Barabara, Department of Geography. Retrieved from http://www.geog.ucsb.

55 Privatizing the Metro Card | David Perlmutter | May 2015
edu/~deutsch/geog111_211a/code_books/Survey_Methods_For_Transport_Planning.pdf
Sanchez, T., & Brenman, M. (2007). The Right to Transportation: Moving to Equity. Chicago, IL: American Planning Association.
Shen, Q. (2000). Social Dimensions of Spatial Planning. Journal of the American Planning Association, 66(1), 68–82. doi:10.1080/01944360008976085
Smart, M. (2010). US immigrants and bicycling: Two-wheeled in Autopia. Transport Policy, 17, 153–159.
Stoesz, D. (2014). Are Payday Loans Really Evil? Controversy, Regulation, and Innovation in the Secondary Financial Services Market. Journal of Sociology and Social Welfare, 41(4), 3–18.
Yin, R. K. (2013). Case Study Research: Design and Methods (Fifth Edition). Los Angeles: SAGE Publications, Inc.
Agency Reports, Conference Papers and White PapersAmerican Public Transportation Association. 2011. Impacts of the Recession on Public
Transportation Agencies: 2011 Update. http://www.apta.com/resources/reportsandpublications/Documents/Impacts-of-Recession-August-2011.pdf.
Anders, J., Brakewood, C., & Watkins, K. (2014). A Case Study Analysis of New Fare Payment Systems in Public Transit. Presented at the 93rd Annual Meeting of the Transportation Research Board, Washington D.C. Retrieved from http://candacebrakewood.com/publications/
Brower, K., & Henderson, W. (2004). In Your Pocket: Using Smartcards for Seamless Travel (pp. 1–51). New York, NY: Permanent Citizen’s Advisory Committee to the MTA.
Caskey, J., Ruiz-Duran, C., & Maria-Solo, T. (2006). The urban unbanked in Mexico and the United States (No. WPS3835) (pp. 1–60). World Bank.
Center for an Urban Future. (2011). Behind the Curb. Retrieved from https://nycfuture.org/pdf/Behind_the_Curb.pdf
FDIC. (2012). 2011 FDIC National Survey of Unbanked and Underbanked Households. Washington D.C.
Jacob, K., & Jankowski, C. (2008). A Focus group study of Latin American immigrants’ financial behaviors (pp. 1–8). Federal Reserve Bank of Chicago. Retrieved from http://chicagofed.org/digital_assets/publications/profitwise_news_and_views/2008/pnv_dec2008_reed_final_web_latin_amer_immigrants.pdf
Jacob, K., Su, S., Rhine, S., & Tescher, J. (2005). Stored Value Cards: Challenges and Opportunities for Reaching Emerging Markets. New York, NY: Federal Reserve Bank of New York.
Keitel, P. (2012). A Prepaid Case Study: Ready Credit’s General-Purpose & Transit-Fare Programs. Philadelphia, PA: Federal Reserve Bank of Philadelphia. Retrieved from www.philadelphiafed.org/payment-cards-center/publications/discussion-paper/
Keitel, P. (2009). The Electronification of Transit Fare Payments: A Look at the Southeastern Pennsylvania Transportation Authority’s New Payment Technologies Project. Philadelphia, PA: Federal Reserve Bank of Philadelphia.
Kocur, G. (2010). Open Payment for Regional Public Transportation Travel. New York, NY: Rudin Center, New York University.
McDonald, N. (2000). Multipurpose Smart Cards in Transportation: Benefits and Barriers to Use. University of California Transportation Center, 1–24.

56 Privatizing the Metro Card | David Perlmutter | May 2015
Metropolitan Transportation Authority. Meeting Minutes, § MTA Capital Program Oversight Committee (2015, January 20). New York, NY. Retrieved from http://web.mta.info/mta/news/books/pdf/150120_1345_CPOC.pdf
Metropolitan Transportation Authority. (2010). Concept of operations for MTA new fare payment system: Bus and subway deployment phase. New York, NY. Retrieved from http://www.smartcardalliance.org/resources/pdf/MTA_NFPS_Concept_of_Operations_R1.2.pdf
Metropolitan Transportation Authority. (2009). 2008 New York Customer Travel Survey. New York, NY. Retrieved from http://web.mta.info/mta/planning/data/NYC-Travel-Survey/NYCTravelSurvey.pdf
Nancy Whelan Consulting. (2013). Ventra Fare Equity Analysis. Chicago Transit Authority. Retrieved from http://www.transitchicago.com/assets/1/miscellaneous_documents/Open_Standards_Fare_System_Equity_Analysis.pdf
New York City Department of Consumer Affairs. (2013). Immigrant Financial Services Study. New York, NY: NYC Department of Consumer Affairs. Retrieved from http://www.nyc.gov/html/ofe/downloads/pdf/IFS_full_report.pdf
New York City Department of Consumer Affairs. (2012). Citywide Financial Services Study. New York, NY: Office of Financial Empowerment. Retrieved from http://www.nyc.gov/html/ofe/downloads/pdf/FinServicesStudy_022510.pdf
New York Metropolitan Transportation Council. (2009). New York Metropolitan Transportation Council Environmental Justice Assessment. Retrieved from http://www.nymtc.org/rtp/documents/related/nymtc_rtp_ej.pdf
Perrotta, A. (2014). Fare Collection and Fare Policy. New York, NY: Regional Plan Association.
Prior, F., & Santoma, J. (2008). The Use of prepaid cards for banking the poor: Comparative study analyzing the development of prepaid systems in the United States and Europe (No. WP-752). IESE Business School, University of Navarra.
Quibria, N. (2008). The Contactless Wave: A Case Study in Transit Payments. Boston, MA: The Federal Reserve Bank of Boston.
Retail Banking: Banking on the unbanked. (2006). European Banker, 6. Retrieved from http://ezproxy.cul.columbia.edu/login?url=http://search.proquest.com.ezproxy.cul.columbia.edu/docview/231043840?accountid=10226
Seltzer, J. (2014). MTA Surveys: Facts and Findings. New York, NY: Metropolitan Transportation Authority. Retrieved from http://www.nymtc.org/mainpage/BB%20presentation%20files/MTA%20Survey%20NYMTCBrownBag_03122014%20with%20webinar%20recording.pdf
Smart Card Alliance Transportation Council. (2008, June). Serving unbanked consumers in the transit industry with prepaid cards. White Paper, Princeton Junction, NJ.
Stegman, M. A., Rocha, M., & Davis, W. (2004). The Role of Technology in Serving the Unbanked (White Paper). Chapel Hill, NC: Center for Community Capitalism, The Frank Hawkins Kenan Institute for Private Enterprise, UNC Kenan-Flagler Business School.
TCRP. (2014). Commonsense Approaches for Improving Transit Bus Speeds (No. Synthesis 110). Washington D.C.: Transportation Research Board. Retrieved from http://onlinepubs.trb.org/onlinepubs/tcrp/tcrp_syn_110.pdf
Transport for London. (2015). Fares and Payments. Retrieved from http://www.tfl.gov.uk/cdn/static/cms/documents/tube-dlr-lo-adult-fares.pdf

57 Privatizing the Metro Card | David Perlmutter | May 2015
Transport for London. (2011). Cash Payment on Buses. London, UK: Transport for London. Retrieved from https://www.tfl.gov.uk/cdn/static/cms/documents/cash-payment-on-buses-report.pdf
Valenti, J., & Heiss, D. (2013). Financial Access in a Brave New Banking World. Center for American Progress.
Washington Metropolitan Area Transportation Authority. (2011). New Electronic Payments Program: RFP Step 2 (No. FQ 11248-2). Retrieved from http://wmata.com/business/procurement_and_contracting/solicitations/uploads/NEPP%20Tech%20Spec%20Step%202%20Rev%202%2006302011.pdf
Popular PressCarr, A. (2012, February 2). Exclusive Look Inside The MTA-MasterCard PayPass Pilot: 17,000 NYC
Customers In Six Months. Fast Company. Retrieved from http://www.fastcompany.com/1813345/exclusive-look-inside-mta-mastercard-paypass-pilot-17000-nyc-customers-six-months
Cox, T. (2013). CTA Switch to Ventra Card Will Boost Cash Fares for Train Rides to $3 - Chicago - DNAinfo.com Chicago. Retrieved March 22, 2015, from http://www.dnainfo.com/chicago/20130228/chicago/cta-switch-ventra-card-will-boost-cash-fares-for-train-rides-3
Hilkevitch, J. (2013a). Convenience fees and other unexpected charges await CTA and Pace Ventra fare card customers who sign up for an optional prepaid debit card account. Chicago Tribune. Chicago, IL. Retrieved from http://articles.chicagotribune.com/2013-03-20/news/ct-met-cta-ventra-hidden-fees-0320-20130320_1_prepaid-debit-debit-card-interchange-fees
Hilkevitch, J. (2013b). Two Ventra fees dropped from CTA card. Chicago Tribune. Retrieved from http://articles.chicagotribune.com/2013-03-26/news/ct-met-ventra-debit-deal-0326-20130326_1_new-ventra-fare-card-prepaid-debit-debit-card
Johnson, K. (2015, February 28). Targeting Inequality, This Time on Public Transit. The New York Times. Retrieved from http://www.nytimes.com/2015/03/01/us/targeting-inequality-this-time-on-public-transit.html
Joshi, A. (2011). What’s the Cost of Open Payment Systems? Mass Transit, (September/October), 64-75.
Kazis, N. (2010, October 20). Who Buys Which Type of MetroCard? | Streetsblog New York City. Retrieved from https://www.streetsblog.org/2010/10/20/who-buys-which-type-of-metrocard/
Kumeh, T. (2012, March 17). Programs Are Under Way to Help the San Francisco Bay Area’s “Unbanked.” The New York Times. Retrieved from http://www.nytimes.com/2012/03/18/us/programs-are-under-way-to-help-the-san-francisco-bay-areas-unbanked.html
Servon, L. (2014, October 29). Are Banks Too Expensive to Use? The New York Times. Retrieved from http://www.nytimes.com/2014/10/30/opinion/are-banks-too-expensive-to-use.html
Servon, L. J. (2013, October 9). The High Cost, for the Poor, of Using a Bank. The New Yorker. Retrieved December 19, 2014, from http://www.newyorker.com/business/currency/the-high-cost-for-the-poor-of-using-a-bank
Silver-Greenberg, J., & Corkery, M. (2014). Bank Tool Is Expanding Unbanked Households, Regulators Say. The New York Times. Retrieved October 14, 2014, from http://dealbook.nytimes.com/2014/06/15/bank-account-screening-tool-is-scrutinized-as-excessive/
Swartz, T. (2013, February 27). Cost of single rail ride ticket could rise to $3. Chicago Tribune. Retrieved from http://articles.redeyechicago.com/2013-02-27/news/37335630_1_ventra-card-chicago-card-cta-rides
Zimmer, T. (2013, November 21). Ventra Capitalists. Jacobin. Retrieved from https://www.jacobinmag.com/2013/11/ventra-capitalists/

58 Privatizing the Metro Card | David Perlmutter | May 2015
AppendicesAppendix 1: Columbia University RASCAL Consent Form for Survey Respondents

59 Privatizing the Metro Card | David Perlmutter | May 2015

60 Privatizing the Metro Card | David Perlmutter | May 2015

61 Privatizing the Metro Card | David Perlmutter | May 2015
Appendix 2: Survey Questionnaire

62 Privatizing the Metro Card | David Perlmutter | May 2015

63 Privatizing the Metro Card | David Perlmutter | May 2015

64 Privatizing the Metro Card | David Perlmutter | May 2015
STATA Output Results for Pearson’s Chi Square Test

65 Privatizing the Metro Card | David Perlmutter | May 2015

66 Privatizing the Metro Card | David Perlmutter | May 2015

67 Privatizing the Metro Card | David Perlmutter | May 2015

68 Privatizing the Metro Card | David Perlmutter | May 2015

69 Privatizing the Metro Card | David Perlmutter | May 2015